Embed Size (px)
Citation preview

(NYSE:TLP)
Master Limited Partnership Association (MLPA) Conference June 1, 2017

2
Forward Looking Statements All statements, other than statements of historical facts, contained herein and made by representatives of TransMontaigne Partners L.P. during this presentation may constitute “forward-looking statements” within the meaning of the Private Securities Litigation Reform Act of 1995. Forward-looking statements address activities, events or developments that the Partnership expects, believes or anticipates will or may occur in the future. These forward-looking statements are based on certain assumptions made by the Partnership based on management’s experience and perception of historical trends, current conditions, expected future developments and other factors it believes are appropriate in the circumstances.
Any forward-looking statements contained herein or made by representatives of the Partnership during this presentation are subject to risks and uncertainties, many of which are beyond the Partnership’s ability to control or predict. If one or more of risks or uncertainties materialize, or if underlying assumptions prove incorrect, then the Partnership’s actual results may differ materially from those implied or expressed by the forward-looking statements. Important factors that could cause actual results differ materially from management’s expectations are detailed in the Partnership’s filings with the Securities and Exchange Commission (SEC) including those items disclosed in “Item 1A. Risk Factors” in the Partnership’s Annual Report on Form 10-K for the year ended December 31, 2016. These filings are available to the public over the internet at the SEC’s website (www.sec.gov) and at the Partnership’s website (www.transmontaignepartners.com). As a result of these risks and uncertainties, investors should not place undue reliance on forward-looking statements.
The Partnership undertakes no obligation to update any forward-looking statements, whether as a result of new information or future events.

3
TransMontaigne Partners (TLP) Overview
5 regions
48 storage terminals
$$ $99.4 million TTM 3/31/2017 EBITDA
Own and operate refined petroleum product tank farms and pipelines.
Provide integrated terminaling, storage, transportation and related services.
Petroleum products, crude oil, chemicals, fertilizers and other liquid products.
Longstanding relationships with diversified customers in refined product distribution.
Operate in 5 distinct and strategic regions across the US: Florida, Southeast, Texas, Midwest and along the Mississippi and Ohio rivers.
General partner affiliated with ArcLight Energy Partners.
Key Stats We are a leading terminaling and transportation company
32.1 million barrels capacity

4
Our Asset Footprint
Jacksonville
Cape Canaveral
Fort Lauderdale
Miami
Pensacola
Port Manatee Tampa
Baton Rouge Dock
Arkansas City Greenville
Cape Giradeau
Paducah
Henderson Evansville Owensboro
Louisville New Albany
Greater Cincinnati
East Liverpool
Oklahoma City Cushing
Mt. Vernon
Rogers
Brownsville Complex
Frontera Brownsville Investment
Denver
Bainbridge Albany
Americus Macon
Griffin Doraville
Rome
Lookout Mountain
Birmingham
Meridian Collins
Athens Belton
Spartanburg Charlotte
Montvale
Greensboro Selma
Richmond Norfolk
Fairfax
Southeast Facilities
River Facilities
Gulf Coast Facilities
Midwest Facilities
Brownsville Complex
Investment
TLP Pipeline
Third-Party Pipeline
Headquarters
Bostco Investment
Large network of strategically positioned refined product assets
Purvis
Light Refined Products
Gasoline Jet Fuel Diesel Fuel Heating Oil
Heavy Refined Products
Residual Fuel Oil Asphalt
Other
Crude Oil Propane Chemicals Other Liquids
Products Stored
MEXICO Third Party Facility
Matamoros Cadereyta/Monterrey
King Ranch

5
Sizable and Diversified Terminal Network
Note: 1 Excludes Bostco JV. 2 Includes ~1.5MM bbls owned by Frontera Brownsville - TLP owns a 50% interest. 3 Reflects total active storage capacity of Bostco – TLP owns a 42.5% interest. Information as of 3/31/2017.
• Terminals: 2
• Capacity: 2.4 MM bbls
• % Contracted: 94%
Brownsville2
21%
5%
7%
8%
23%
36%
Active Capacity
• Terminals: 1
• Capacity: 7.1 MM bbls
• % Contracted: 100%
Bostco3
• Terminals: 12
• Capacity: 2.7 MM bbls
• % Contracted: 52%
River
• Terminals: 22
• Capacity: 11.4 MM bbls
• % Contracted: 100%
Southeast
• Terminals: 7
• Capacity: 6.9 MM bbls
• % Contracted: 100%
Gulf Coast
Significant footprint of assets; 48 terminals across 5 strategic regions1
Bostco
River
Brownsville
Midwest Gulf Coast
Southeast
• Terminals: 4
• Capacity: 1.6 MM bbls
• % Contracted: 100%
Midwest

6
Strategic Advantages Across Regions Quality assets and strategic geographies establish our advantage Southeast Located along the Colonial and Plantation pipeline systems.
Most efficient path to Atlantic or Northeast U.S. markets. Collins: only independent terminal capable of moving between Colonial and
Plantation.
Gulf Coast Locations throughout Florida. Region is without major product supply pipelines and refineries. Fort Lauderdale, Miami and Cape Canaveral ports are among the busiest cruise
ship ports in the nation.
Midwest Strategic locations in Oklahoma, Arkansas and Missouri. Rogers facility: only refined products terminal located in Northwest Arkansas.
River Locations along the Mississippi and Ohio Rivers. Spans river locations from Ohio through Louisiana. Baton Rouge dock: strategic connection between Colonial Pipeline and Mississippi
River waterborne transportation.
Brownsville1
Facilitates product movements between the Gulf of Mexico, Northern Mexico and the U.S.
Evaluating long-term opportunities with new and existing customers provided by recent regulatory changes in Mexico.
Bostco
Located in the heart of the Houston Ship Channel. Provides access to expansive refinery complex and export markets. Refineries in this region account for more than 25% of total U.S. refining capacity. Positioned to meet increasing demand for global export capacity.
Note: 1 Comprised of TLP Terminal and Frontera JV
7
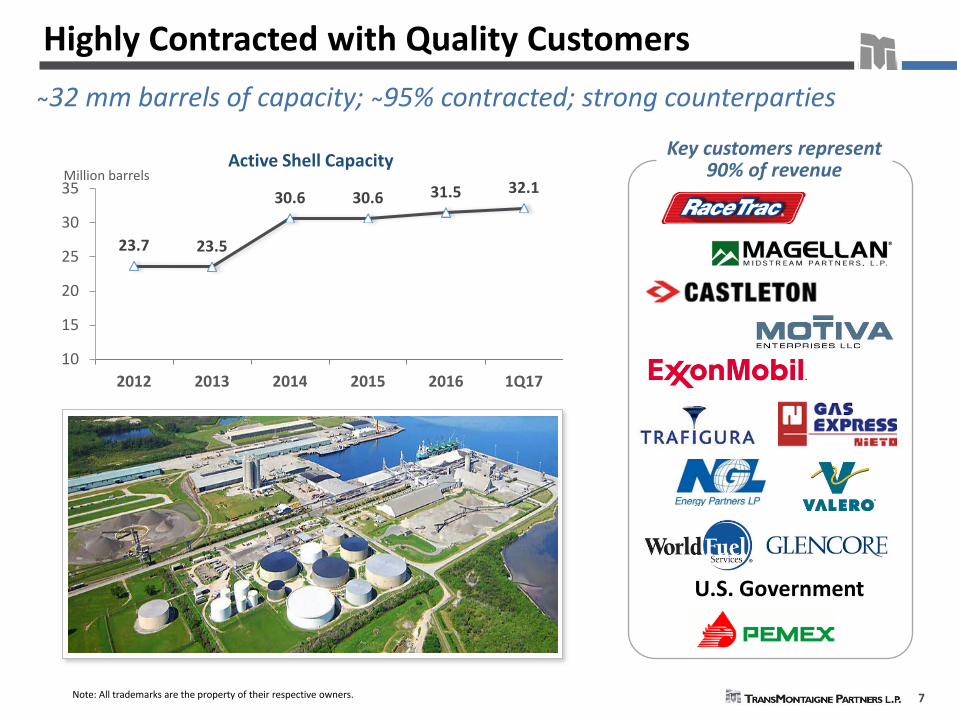
Highly Contracted with Quality Customers
U.S. Government
23.7 23.5
30.6 30.6 31.5 32.1
10
15
20
25
30
35
2012 2013 2014 2015 2016 1Q17
Million barrels Active Shell Capacity
32 mm barrels of capacity; 95% contracted; strong counterparties
Key customers represent 90% of revenue
Note: All trademarks are the property of their respective owners.

8
Morgan Stanley, a previous owner of our GP, accounted for more than 60% of our business in 2014.
All of our terminaling services fees and pipeline transportation fees are from unrelated third-parties.
Successful re-contracting effort demonstrates importance of our asset base in the refined product distribution chain.
38%
70%
~100%
0%
20%
40%
60%
80%
100%% of total
Q1 2014Q1 2015Q1 2017
Unaffiliated third-party customer base
Third Party Contracted Capacity
Success in Achieving Third-Party Growth

9
Sponsor Enhances Growth Potential
We are backed by a highly experienced and aligned general partner Strategic and Aligned General Partner
In February 2016, ArcLight Energy Partners Fund VI indirectly acquired 100% of our general partner from NGL Energy Partners (NGL). TLP’s GP holds the 2% GP interest and 100% of the IDRs.
On April 1, 2016, affiliates of ArcLight acquired approximately 3.2 million of our common units (20% interest) from NGL.
Represented ArcLight’s fourth major refined product terminal acquisition in a 10 month time frame.
About ArcLight Capital Partners
Leading private equity firm focused on energy infrastructure investments.
Based in Boston; founded in 2001.
Targets midstream, power and production.
ArcLight has invested more than $17 billion in over 101 transactions since inception.
Owns and controls over 45 million barrels of complementary refined product storage capacity on the U.S. East Coast and in the Caribbean.

10
• Contract 1.4 million
barrels of available storage capacity in River and Brownsville.
• Re-contract assets with new agreements at higher rates.
• Maximize butane blending opportunities.
• Finalizing construction of
the 2 million barrel, fully contracted, Phase I expansion at Collins.
• Developing Collins Phase II expansion; 2 to 5 million barrels of additional capacity.
• Strong balance sheet
positions us to pursue acquisition opportunities.
• Transaction pipeline is increasingly active.
• Sponsor relationship with ArcLight enhances growth potential through third party M&A and drop down opportunities.
Maximize Base System • Maximize assets • Re-contract capacity • Fill available capacity • Diversify customers
Invest Organically • New assets • Interconnections • Expansions • JV investments
Acquisitions • Sponsor
transactions • Third-party M&A
Growth Opportunities
2 3
Pursuing growth in three key areas
1

11
1 Collins storage terminal expansion Phase I expansion is adding 2 million barrels of capacity. Developing Phase II expansion for 2 to 5 million barrels of additional product storage.
2 Enhance various existing assets. Opportunity to fill 1.4 million barrels of storage capacity available at our River and Brownsville terminals. Potential to develop additional butane blending capabilities at various terminal locations. Exploring smaller scale projects at various locations throughout our system.
3 Bostco expansion
Permitted for 2 additional deep-water ship docks. Bostco strategically located on the Houston Ship Channel with access to expansive refinery complex.
4 Exploring multiple acquisition opportunities ArcLight enhances TransMontaigne’s ability to pursue growth opportunities, including M&A and drop downs. We are currently exploring multiple refined product acquisition opportunities that have the potential to enhance and augment our asset footprint.
Active Growth Opportunities Significant inventory of identified growth opportunities

12
Collins Storage Terminal Expansion
• Phase I: Construction of 2 million barrels of capacity (fully contracted), anticipated completion through Q2-2017. $75 million capex with return in high teens. To date have placed over 1.9 million barrels in
service. Tenants include credit worthy parties with 5-year
contracts. • Phase II: Permitting and development of up to another 5
million barrels of capacity. Projected returns in high teens. Projected tenants include major trading and oil
companies with similar contract lengths to Phase I.
Significant demand for additional bulk storage at Collins
PHASE I
PHASE II

13
Multi-Year Contracts with Firm Commitments
12%
29%
27%
32% < 1 Year>= 1 Year, < 3 Years>= 3 Years, < 5 Years>= 5 Years
Duration of Contracts1
~70% of Revenues from Firm Commitments
Our fee-for-service business model is underpinned by multi-year take-or-pay contracts, providing significant stability.
Approximately 88% of our current contracts are 1-5+ years in duration; with 59% of contracts at least 3 years in duration.
More than 70% of our revenues are generated from terminaling service fees with firm commitments.
Note: 1 As of 3/31/2017
$28 $27 $26 $26 $27 $26 $28 $27 $28 $29 $29 $30 $32
$10 $12 $10 $11 $11 $11 $10 $13 $12 $13 $11 $13
$13
73% 70%
73% 70% 70% 69% 74%
68% 70% 69% 72% 71% 71%
0%
10%
20%
30%
40%
50%
60%
70%
80%
$0
$5
$10
$15
$20
$25
$30
$35
$40
$45
$50
1Q14 2Q14 3Q14 4Q14 1Q15 2Q15 3Q15 4Q15 1Q16 2Q16 3Q16 4Q16 1Q17
Firm
ly C
omm
itted
Rev
enue
$mm
Firm Commitments Variable Commitments % Firm
Our revenue structure allows for predictable cash flows

14
Strong Cash Flows and Balance Sheet
$53 $58 $60 $69 $69 $72 $71 $75
$90 $96 $99
$0
$20
$40
$60
$80
$100
$120
2007 2008 2009 2010 2011 2012 2013 2014 2015 2016 TTM
$mm
2.5x 2.9x 2.7x
1.8x 1.7x
2.6x 3.0x
3.4x 2.8x 3.0x 2.9x
0.0x0.5x1.0x1.5x2.0x2.5x3.0x3.5x4.0x4.5x5.0x
2007 2008 2009 2010 2011 2012 2013 2014 2015 2016 TTM
Debt/EBITDA
Consistent and Growing EBITDA Conservative Leverage Profile
A track record of cash flow growth and financial stability
$293 $307
Outstanding Borrowings Available Capacity
Revolving Credit Facility1
1 As of 3/31/2017.
As of 3/31/2017, $307 million of available capacity on revolving credit facility, with approximately 30 million of approved expansion capital projects to be completed.
Recently upsized credit facility enhances liquidity to take advantage of organic growth and acquisition opportunities.
Ability to raise additional capital in high yield bond market.
1

15
Conservative coverage position provides significant cash cushion – historical average of 1.4x.
A 1.5¢ increase in the quarterly distribution per unit results in an additional ~$0.5 million in incremental quarterly distributions, including IDRs.
Cash Retention
Significant Distribution Coverage High distribution coverage allows for financial flexibility
$12.5 $12.6 $12.6 $12.6 $12.6 $12.6 $12.6 $12.8 $13.1 $13.4 $13.8 $14.1 $14.6 $4.1
$5.9
$3.1 $2.2
$5.5 $4.1 $4.7
$5.7 $6.0 $4.6
$5.7 $5.2
$8.9
1.33x 1.47x 1.25x 1.18x
1.43x 1.32x 1.37x 1.45x 1.46x 1.34x 1.41x 1.37x 1.61x
0.0x
0.5x
1.0x
1.5x
2.0x
2.5x
3.0x
3.5x
4.0x
4.5x
5.0x
$0.0
$5.0
$10.0
$15.0
$20.0
$25.0
1Q14 2Q14 3Q14 4Q14 1Q15 2Q15 3Q15 4Q15 1Q16 2Q16 3Q16 4Q16 1Q17
$mm Coverage
Distribution Cushion Coverage
Actual Distribution vs. Coverage
b a
b
a
FY 2015 coverage: 1.39x DCF: $70.7mm Distributions: $50.7mm Cushion: $20.0mm
FY 2014 coverage: 1.31x DCF: $65.7mm Distributions: $50.3mm Cushion: $15.4mm
c FY 2016 coverage: 1.40x DCF: $75.9mm Distributions: $54.4mm Cushion: $21.5mm c

16
Twelve Years of Distribution Stability and Growth
$0.4
3
$0.5
9
$0.6
0 $0.6
4
$0.6
65
$0.6
7 $0.7
25
$0.20
$0.25
$0.30
$0.35
$0.40
$0.45
$0.50
$0.55
$0.60
$0.65
$0.70
$0.75
Jun-
05
Dec-
05
Jun-
06
Dec-
06
Jun-
07
Dec-
07
Jun-
08
Dec-
08
Jun-
09
Dec-
09
Jun-
10
Dec-
10
Jun-
11
Dec-
11
Jun-
12
Dec-
12
Jun-
13
Dec-
13
Jun-
14
Dec-
14
Jun-
15
Dec-
15
Jun-
16
Dec-
16
$/unit Increased quarterly distribution from $0.71 to $0.725 for the quarter ended 3/31/17.
Sixth consecutive distribution increase following first distribution increase since quarter ended 6/30/14.
Long-term history of maintaining and growing cash flows and distribution.
81% increase in distribution per LP unit since our IPO on May 27, 2005.
+81%1
Denotes quarterly distribution increase
We have a long-term track record of creating and building value

17
TLP Business Highlights
Quality, Diversified Asset
Platform
Strong Financial Profile
Attractive Growth Potential
Large asset footprint spanning 5 key regions, 48 storage terminals and 3 products pipelines.
Asset system represents critical link in refined products distribution chain.
Diversified storage capabilities; refined products, NGLs and other liquids.
Re-contracting success confirms the value of our assets.
Long term take-or-pay contracts with quality customers. Highly contracted asset base; ~95% of capacity contracted. Average distribution coverage of ~1.4x; conservative leverage of
2.9x.
Excess coverage provides flexibility and growth potential.
3 avenues of growth – asset maximization, organic projects, M&A. Finalizing Collins Phase I construction of 2 million barrels of capacity
costing $75 million. Potential to develop an up to an additional 5 million barrels of
capacity at Collins. For the trailing twelve months, we have increased our quarterly
distribution at an annualized rate of 6.6%. Strategic sponsor relationship with ArcLight enhances LP growth
potential.
Attractive business model creates strong value proposition

18
Financial Summary
Note: $ in thousands
Net earnings $ 8,710 $ 10,310 $ 11,885 $ 13,201 $ 12,954 Depreciation and amortization 7,935 8,064 8,169 8,215 8,705 Earnings from unconsolidated affiliates (1,850) (2,130) (2,960) (3,089) (2,560) Distributions from unconsolidated affiliates 4,135 4,071 4,457 5,198 4,349 Equity-based compensation 2,155 258 251 599 1,817 Settlement of tax withholdings on equity-based compensation - - - - (382) Interest expense 2,792 2,368 1,467 1,160 2,152 Amortization of deferred financing costs 205 205 204 204 294 “Consolidated EBITDA” 24,082 23,146 23,473 25,488 27,329 Interest expense (2,792) (2,368) (1,467) (1,160) (2,152) Unrealized loss (gain) on derivative instruments 794 341 (578) (901) (258) Amortization of deferred financing costs (205) (205) (204) (204) (294) Amounts due under long-term terminaling services agreements, net (47) (25) (121) 530 (98) Project amortization of deferred revenue under GAAP (198) (122) (108) 180 (51) Project amortization of deferred revenue for DCF 451 464 438 164 452 Capitalized maintenance (2,953) (3,167) (1,970) (4,841) (1,462) “Distributable cash flow”, or DCF, generated during the period $ 19,132 $ 18,064 $ 19,463 $ 19,256 $ 23,466
Actual distribution for the period on all common units and the general partner interest including incentive distribution rights $ 13,114 $ 13,437 $ 13,761 $ 14,088 $ 14,592
Distribution coverage ratio 1.46x 1.34x 1.41x 1.37x 1.61x
2016March 31,
2017
Three months ended
March 31,2016
June 30,2016
September 30, December 31,2016

19
Financial Summary (continued)
Note: $ in thousands, except per unit amounts
Revenue $ 40,626 $ 41,136 $ 40,638 $ 42,524 $ 44,850Direct operating costs and expenses (15,906) (17,703) (17,048) (17,758) (16,511) General and administrative expenses (3,878) (3,446) (3,605) (3,171) (3,971) Insurance expenses (895) (912) (969) (1,305) (1,006) Equity-based compensation expense (2,155) (258) (251) (599) (1,817) Depreciation and amortization (7,935) (8,064) (8,169) (8,215) (8,705) Earnings from unconsolidated affiliates 1,850 2,130 2,960 3,089 2,560 Operating income 11,707 12,883 13,556 14,565 15,400 Other expenses (2,997) (2,573) (1,671) (1,364) (2,446) Net earnings $ 8,710 $ 10,310 $ 11,885 $ 13,201 $ 12,954 Net earnings per limited partner unit—basic $ 0.41 $ 0.50 $ 0.58 $ 0.65 $ 0.62
Balance Sheet DataProperty, plant and equipment, net $ 394,118 $ 399,676 $ 408,334 $ 416,748 $ 419,995Investments in unconsolidated affiliates 246,641 244,699 243,202 241,093 241,304Goodwill 8,485 8,485 8,485 8,485 8,485Total assets 662,728 665,704 676,791 689,694 696,530Long-term debt 264,100 268,000 270,300 291,800 292,500Partners’ equity 376,543 373,996 372,695 372,734 373,058
20162016
March 31, 2017
March 31, 2017
March 31, September 30, 2016
June 30, 2016
June 30, 2016
December 31,
Three months ended March 31,
2016September 30,
2016December 31,
2016