Embed Size (px)
Citation preview

1
Technical Documentation Digital Archive of Canadian Climatological Data
1.0 Record formats 1.1 Daily record of hourly data (HLY) 1.2 Monthly record of daily data (DLY) 1.3 Annual record of monthly data (MLY) 1.4 Daily record of 15 minute data (FIF) 1.5 Hourly record of minutely data (MIN)
2.0 Data field descriptions 2.1 Climate identifier 2.2 Element number 2.3 Data value field 2.4 Day flag
3.0 Archive files 3.1 Hourly weather (HLY01) 3.2 Rate of rainfall (HLY03) 3.3 Rate of rainfall (DLY03) 3.4 Daily climatological data (DLY02, DLY04) 3.5 Daily climatological data from COOL (DLY44) 3.6 Monthly climatological data (MLY04) 3.7 Bright sunshine (HLY10) 3.8 Solar radiation (HLY11) 3.9 Solar radiation (MIN11) 3.10 Soil temperature (DLY12) 3.11 Pan evaporation (DLY13) 3.12 Wind (HLY15) 3.13 Precipitation (Fischer/Porter) data (FIF21) 3.14 Precipitation (Fischer/Porter) data (HLY21) 3.15 Precipitation (Fischer/Porter) data (DLY21)
4.0 Upper air data (UAS/UAW) 4.1 Record format and field descriptions 4.2 Source code 4.3 List and description of elements
5.0 Table of flags 6.0 Notes
Environment and Climate Change Canada Date Modified: 2018-10-30 2
1.0 Record formats
Standard record formats exist for the Canadian climatological data which are archived at minutely, fifteen minute, hourly, daily or monthly intervals. These records are available in non-delimited American Standard Code for Information Interchange (ASCII) formatted files commonly called flat files. Each record consists of a climate identification number, a date and element number, followed by the data, which is available for each time interval indicated by that record’s date. The datum for each time interval is recorded as a five (5) digit integer, preceded by a single field for the integer’s sign, and followed by a single alphanumeric character for the datum’s flag (see Table of flags). The units and decimal position are implied by the assigned element number, which denotes the data type (as defined in the tables below for each archive files type).
A single file may contain data from multiple stations, for multiple element types, and may include data from a range of dates.
The five (5) record formats are as follows:
1.1 Daily record of hourly data (HLY)
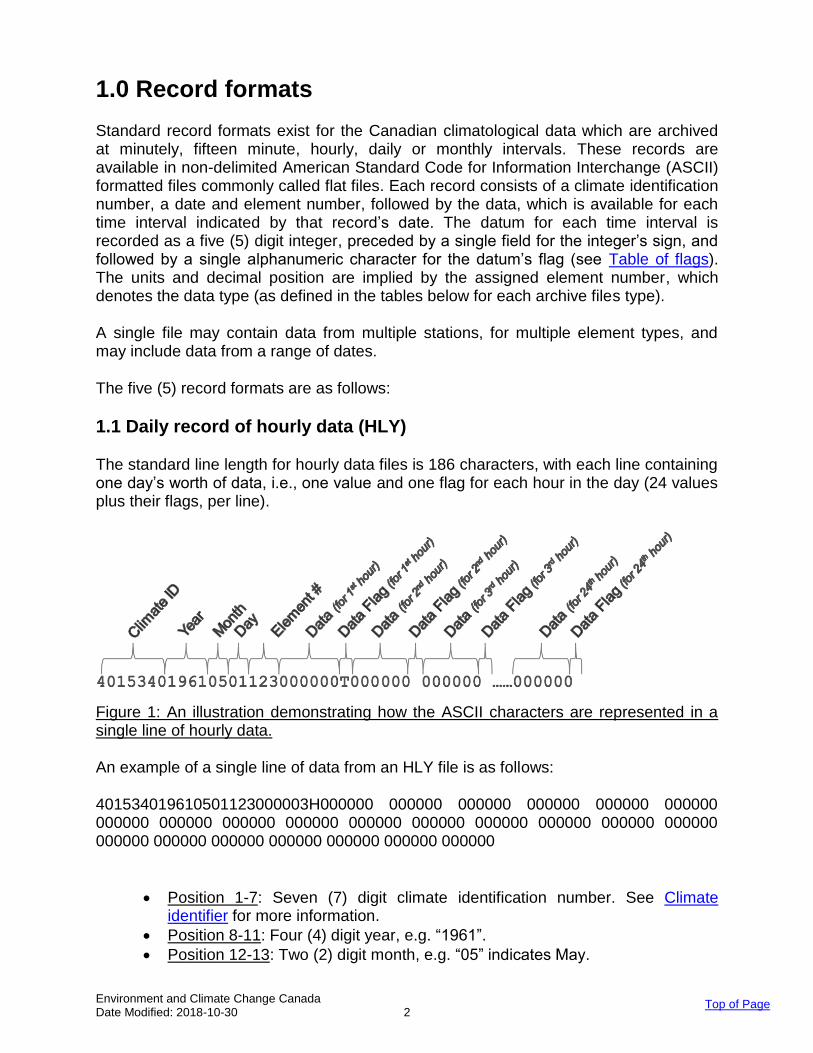
The standard line length for hourly data files is 186 characters, with each line containing one day’s worth of data, i.e., one value and one flag for each hour in the day (24 values plus their flags, per line).
Figure 1: An illustration demonstrating how the ASCII characters are represented in a single line of hourly data.
An example of a single line of data from an HLY file is as follows:
401534019610501123000003H000000 000000 000000 000000 000000 000000 000000 000000 000000 000000 000000 000000 000000 000000 000000 000000 000000 000000 000000 000000 000000 000000 000000
Position 1-7: Seven (7) digit climate identification number. See Climate identifier for more information.
Position 8-11: Four (4) digit year, e.g. “1961”.
Position 12-13: Two (2) digit month, e.g. “05” indicates May.
Top of Page

Environment and Climate Change Canada Date Modified: 2018-10-30 3
Position 14-15: Two (2) digit day of month, e.g. “01” indicates the first day of the month.
Position 16-18: Three (3) digit element number, e.g. “123” indicates “Hourly rainfall”. Details on various element numbers can be found throughout this document.
Position 19-24: Five (5) digit value, plus a preceding character reserved for the datum’s sign, which is explicit (“-“) if negative and implicit (“0”) if positive. A missing field is indicated by “-99999”. In the above example, “3” indicates 0.3 mm of rainfall. See Data value field for more information.
Position 25: An alphabetic flag for the value in position 20-24, where a blank space indicates no flag. For example, “H” indicates “freezing” precipitation. See Table of flags for more information.
Position 26-32: Value and flag for the second hour of the day.
This pattern of data, preceded by a number sign and followed by a flag, repeats in the line 24 times, once for each hour in the day.
NOTE: In the daily record of hourly data (HLY), the 24 entries (for each hour) represent the observation taken during the hour 00h-23h, for elements 071-122, 156, 209-210, 219-230, 260, 262-280 and 311. For all other elements, the entries represent the observation for hours ending 01h-24h. For example, for element 123 (rainfall) the hour 12 represents the total rainfall recorded in the period between 1101h-1200h. All times are local standard with the exception of sunshine (element 133) and radiation (elements 061-068, 169-172) which are local apparent solar time. Note that the values for the sunshine and radiation elements are for the hour beginning at that time. For example, hour 12 represents the period between 1200h-1259h. One (1) minute solar radiation data (elements 200-208) are also in local apparent time.
1.2 Monthly record of daily data (DLY)
The standard line length for daily files is 233 characters, with each line containing one month’s worth of data.
Figure 2: An illustration showing how the ASCII characters are represented in a single line of daily data.
Top of Page

Environment and Climate Change Canada Date Modified: 2018-10-30 4
An example of a single line of data from a DLY file is as follow:
5010140197306010000000 000015 000028 000000T000000 000000 000000T000000 000104 000003 000000 000000 000000 000000T000295 000145 000000 000343 000076 000030 000005 000000 000000 000000T000013 000008 000000 000000 000000 000000 -99999M
Position 1-7: Seven (7) digit climate identification number. See Climate identifier for more information.
Position 8-11: Four (4) digit year, i.e. “1973”.
Position 12-13: Two (2) digit month, i.e. “06” is June.
Position 14-16: Three (3) digit element number, e.g. “010” is “Rainfall”. Details on various element numbers can be found throughout this document.
Position 17-22: Five (5) digit value, plus a preceding character reserved for the datum’s sign, which is explicit (“-“) if negative and implicit (“0”) if positive. A missing field is indicated by “-99999”. In the above example, “00000” indicates zero rainfall. See Data value field for more information.
Position 23: An alphabetic flag for the value in position 18-22, where a blank space indicates no flag. See Table of flags for more information.
Position 24: Same as position 17.
Position 25-29: Value for the second day of the month.
This pattern of sign, value and flag repeats to 31 days, once for each day of the month indicated in the “month” position. Months with less than 31 days will show missing values of “-99999” and “M” in place of a non-existent day, e.g. the last value and flag in the line for April (position 227-233) will be “-99999M”.
1.3 Annual record of monthly data (MLY)
The standard line length for monthly files is 98 characters, with each line containing one year’s worth of data. Each line includes space for 12 months of data.
Figure 3: An illustration showing how the ASCII characters are represented in a single line of monthly data.
Top of Page

Environment and Climate Change Canada Date Modified: 2018-10-30 5
An example of a single line of data from a MLY file is as follow:
60107381981049000112 000222 000213 000136 000056 000000T000000 000000 000117 000096 000338 000223
Position 1-7: Seven (7) digit climate identification number. See Climate identifier for more information.
Position 8-11: Four (4) digit year, e.g. “1981”.
Position 12-14: Three (3) digit element number. e.g. “049” indicates “Total snowfall”. Details on various element numbers can be found throughout this document.
Position 15-20: Five (5) digit value, plus a preceding character reserved for the datum’s sign, which is explicit (“-“) if negative and implicit (“0”) if positive. A missing field is indicated by “-99999”. In the above example, “000112” indicates 11.2 cm of snowfall for January. See Data value field for more information.
Position 21: An alphabetic flag for the value in position 16-20, where a blank space indicates no flag. See Table of flags for more information.
This pattern of sign, value and flag repeats is repeated 12 times on each line, once for each month of the year indicated in the “year” position.
1.4 Daily record of 15 minute data (FIF)
The standard line length for 15 minute files is 691 characters, with each line containing one day’s worth of data, i.e., one value and one flag for each 15 minute period (96 values plus their flags per line).
NOTE: The 15 minute data are currently unavailable for distribution, pending further review in the archive.
1.5 Hourly record of minutely data (MIN)
The standard line length for minutely data is 440 characters, with each line containing one hour’s worth of data, i.e. one value and one flag for each minute in the hour (60 values plus their flags, per line).
NOTE: The minutely data are currently unavailable for distribution, pending further review in the archive. Additionally, only a small amount of data exists; only five (5) stations reported minutely data between 1997 and 2003.
Top of Page

Environment and Climate Change Canada Date Modified: 2018-10-30 6
2.0 Data field descriptions
2.1 Climate identifier
Also referred to as climate ID or station number, the climate identifier is a 7 digit number assigned by the Meteorological Service of Canada (MSC) to a site where official weather observations are taken, and serves as a permanent, unique identifier (ID).
The first digit of the number indicates the province in which the observing site is located; the second and third digits identify the climatological district within the province.
When observations are discontinued at a site, the number is not used for subsequent stations (which may, or may not, differ in name) unless it is judged that the records from the earlier and subsequent stations may be combined for most climatological purposes.
A station inventory which includes current and historic stations is available upon request at Services Climatiques / Climate Services (EC) or in any specific Historical Data search result by clicking “Get More Data” in the “Download Data” section.
2.2 Element number
An assigned element number uniquely identifies each data type and implies the units and decimal position.
Documentation for each element is organized by record format, unique to the observing frequency (e.g. HLY). In addition, a reference has been made to the system under which the data were acquired and quality controlled (e.g. HLY01). For more information about each element number, please refer to the tables located under the Archive files types section.
2.3 Data value field
This seven (7) character field records the datum for one time interval. The first character is reserved for the datum’s sign; explicit (“-“) if negative and implicit (“0”) if positive. Prior to the ASCII files being written, all value fields are initialized to -99999M (missing). If the values are missing for all the time intervals of a record, the record will not be written. However, if a value is available for at least one time interval within the record, the record will be written but with all remaining unavailable intervals coded as -99999M. In the Monthly record of daily data (DLY) files, records for days in excess of the number of days in the specified month are coded -99999M. For example, the 31st data position for the month of April is reported as missing.
The units and decimal position are determined by the element number. The flag position at the end of the field is a single alphanumeric character which is used to qualify the value and varies by element number. A blank value indicates valid data. See Table of flags for more information.
Top of Page

Environment and Climate Change Canada Date Modified: 2018-10-30 7
2.4 Day flag
If the time is uncertain within this record, 'N' will be entered in this field.
NOTE: This flag applies to 15 minute (FIF) data files only.
3.0 Archive files
The data are maintained in the National Archive System (NAS). The various files are identified by temporal format (e.g. Daily or “DLY”) and system number (e.g. “01”). The data set names are as follow:
Table 1: Definition of Archive files types
Data Sets Description
HLY01 Hourly weather
HLY01.CLD Hourly weather - Cloud layers
HLY03 Hourly rate of rainfall
DLY03 Daily rate of rainfall – Intensities
DLY04 Daily climatological data
DLY02 Daily climatological data
DLY44 Daily climatological data
MLY04 Monthly climatological data
HLY10 Hourly bright sunshine
HLY11 Hourly solar radiation
MIN11 Minutely solar radiation*
DLY12 Daily soil temperature
DLY13 Daily pan evaporation
HLY15 Hourly wind
FIF21 Fifteen minute precipitation Fischer/Porter*
HLY21 Hourly precipitation Fischer/Porter
DLY21 Daily precipitation Fischer/Porter – Intensities
*Small subset only
3.1 Hourly weather (HLY01)
See Note 38 for additional information.
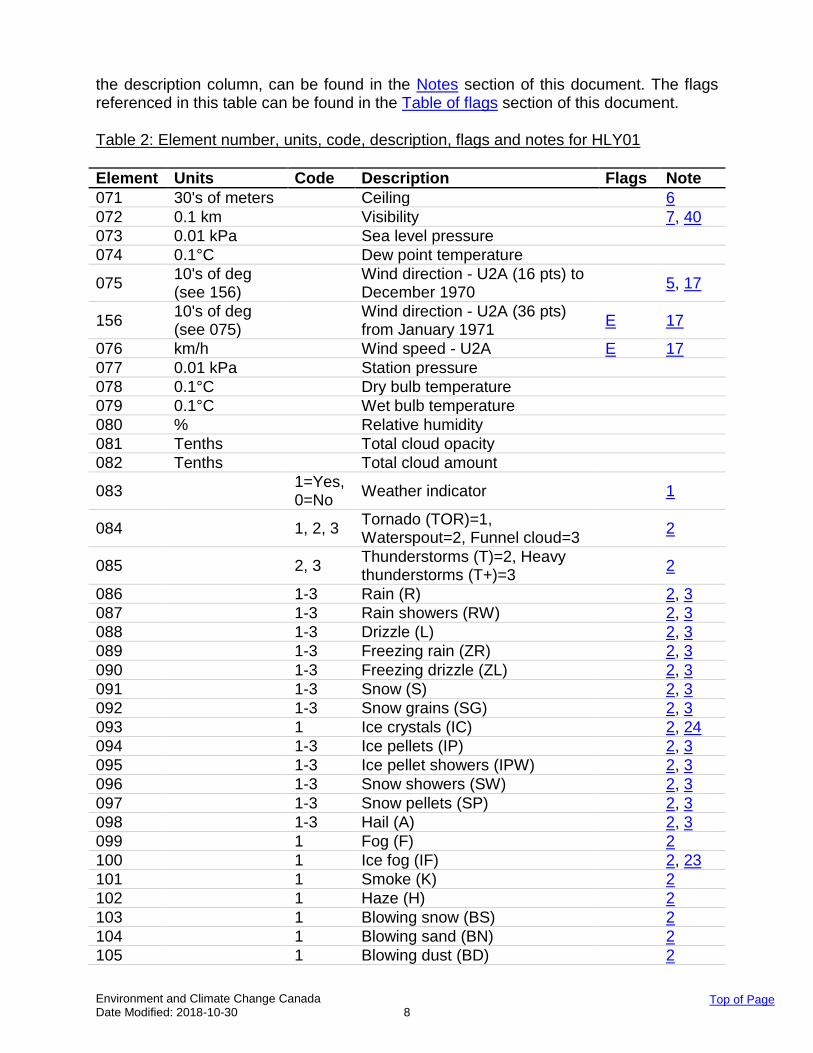
The following table presents the available element types for hourly weather and cloud layer (HLY01) data, with corresponding units, code, description, flags and numbered notes. Data for elements, such as rain (element 086) are reported as codes. For example, rain type may be reported as four (4) different codes: 0=none, 1=light, 2=moderate and 3=heavy. Detailed information on these codes, where not defined in
Top of Page
Environment and Climate Change Canada Date Modified: 2018-10-30 8
the description column, can be found in the Notes section of this document. The flags referenced in this table can be found in the Table of flags section of this document.
Table 2: Element number, units, code, description, flags and notes for HLY01
Element Units Code Description Flags Note
071 30's of meters Ceiling 6
072 0.1 km Visibility 7, 40
073 0.01 kPa Sea level pressure
074 0.1°C Dew point temperature
075 10's of deg (see 156)
Wind direction - U2A (16 pts) to December 1970
5, 17
156 10's of deg (see 075)
Wind direction - U2A (36 pts) from January 1971
E 17
076 km/h Wind speed - U2A E 17
077 0.01 kPa Station pressure
078 0.1°C Dry bulb temperature
079 0.1°C Wet bulb temperature
080 % Relative humidity
081 Tenths Total cloud opacity
082 Tenths Total cloud amount
083 1=Yes, 0=No
Weather indicator 1
084 1, 2, 3 Tornado (TOR)=1, Waterspout=2, Funnel cloud=3
2
085 2, 3 Thunderstorms (T)=2, Heavy thunderstorms (T+)=3
2
086 1-3 Rain (R) 2, 3
087 1-3 Rain showers (RW) 2, 3
088 1-3 Drizzle (L) 2, 3
089 1-3 Freezing rain (ZR) 2, 3
090 1-3 Freezing drizzle (ZL) 2, 3
091 1-3 Snow (S) 2, 3
092 1-3 Snow grains (SG) 2, 3
093 1 Ice crystals (IC) 2, 24
094 1-3 Ice pellets (IP) 2, 3
095 1-3 Ice pellet showers (IPW) 2, 3
096 1-3 Snow showers (SW) 2, 3
097 1-3 Snow pellets (SP) 2, 3
098 1-3 Hail (A) 2, 3
099 1 Fog (F) 2
100 1 Ice fog (IF) 2, 23
101 1 Smoke (K) 2
102 1 Haze (H) 2
103 1 Blowing snow (BS) 2
104 1 Blowing sand (BN) 2
105 1 Blowing dust (BD) 2
Top of Page

Environment and Climate Change Canada Date Modified: 2018-10-30 9
Element Units Code Description Flags Note
106 1 Dust (D) 2
244 1-3 Precip. Unclassified Type (P) 3, 43
260 1 Freezing fog (FZFG) 2, 23
311 Hg (inches of mercury)
Altimeter setting
107-110 Lowest cloud layer
107 Tenths Opacity G
12, 19, 29
108 Tenths Amount or condition G
12, 13, 19, 29, 44
109 0-28 Type G
4, 12, 19, 29
110 30's of meters Height G
12, 19, 29
111-114 Second lowest cloud layer
111 Tenths Opacity G
12, 19, 29
112 Tenths Amount or Condition G
12, 13, 19, 29, 44
113 0-28 Type G
4, 12, 19, 29
114 30's of meters Height G
12, 19, 29
115-118 Third lowest cloud layer
115 Tenths Opacity G
12, 19, 29
116 Tenths Amount or Condition G
12, 13, 19, 29, 44
117 0-28 Type G
4, 12, 19, 29
118 30's of meters Height G
12, 19, 29
119-122 4th Lowest cloud layer
119 Tenths Opacity G
12, 19, 29
120 Tenths Amount or Condition G
12, 13, 19, 29, 44
121 0-16 Type G
4, 12, 19, 29
122 30's of meters Height G
12, 19, 29
219-222 4th Cloud layer
Top of Page

Environment and Climate Change Canada Date Modified: 2018-10-30 10
Element Units Code Description Flags Note
219 Tenths Opacity G
12, 19, 29
220 Tenths Amount or Condition G
12, 13, 19, 29, 44
221 0-28 Type G
4, 12, 19, 29
222 30's of meters Height G
12, 19, 29
223-226 5th Cloud layer
223 Tenths Opacity G
12, 19, 29
224 Tenths Amount or Condition G
12, 13, 19, 29, 44
225 0-28 Type G
4, 12, 19, 29
226 30's of meters Height G
12, 19, 29
227-230 6th Cloud layer
227 Tenths Opacity G
12, 19, 29
228 Tenths Amount or Condition G
12, 13, 19, 29, 44
229 0-28 Type G
4, 12, 19, 29
230 30's of meters Height G
12, 19, 29
Wind character and gust speed - at 10 m
209 1, 2 Wind character at 10 m Gust (G)=1, Squall (Q)=2
S 32
210 km/h Wind gust speed at 10 m S, E 32
Reference Climate Surface weather stations (RCS) elements - Phase 1
262 0.1 mm Precipitation amount (minutes 00-60)
33
263 0.1 mm Precipitation amount (minutes 00-15)
33
264 0.1 mm Precipitation amount (minutes 15-30)
33
265 0.1 mm Precipitation amount (minutes 30-45)
33
266 0.1 mm Precipitation amount (minutes 45-60)
33
267 0.1 kg/m2 Precipitation gauge weight per unit area (at minute 15)
33
Top of Page

Environment and Climate Change Canada Date Modified: 2018-10-30 11
Element Units Code Description Flags Note
268 0.1 kg/m2 Precipitation gauge weight per unit area (at minute 30)
33
269 0.1 kg/m2 Precipitation gauge weight per unit area (at minute 45)
33
270 0.1 kg/m2 Precipitation gauge weight per unit area (at minute 60)
33
271 0.1 km/h Wind speed at 2 m (minutes 00-15)
33
272 0.1 km/h Wind speed at 2 m (minutes 15-30)
33
273 0.1 km/h Wind speed at 2 m (minutes 30-45)
33
274 0.1 km/h Wind speed at 2 m (minutes 45-60)
33
275 cm Snow depth (at minute 60) 33
276 cm Snow depth (at minute 15) 33
277 cm Snow depth (at minute 30) 33
278 cm Snow depth (at minute 45) 33
279 Degrees Wind direction at 2 m (minutes 50-60)
33
280 0.1 km/h Wind speed at 2 m (minutes 50-60)
33
3.2 Rate of rainfall (HLY03)
Also see section on Fisher/Porter Precipitation (HLY21) data.
The following table presents the available element type for hourly rate of rainfall (HLY03) data, along with corresponding units, description and flags. The flags referenced in this table can be found in the Table of flags section of this document.
Table 3: Element number, units, description and flags for HLY03
Element Units Code Description Flags Note
123 0.1 mm Hourly rainfall H, I, J
3.3 Rate of rainfall (DLY03)
Also see section on Fisher/Porter Precipitation (DLY21) data.
The following table presents the available element types for rate of rainfall (DLY03) data, with corresponding units, description, flags and numbered notes. The flags and notes referenced in this table can be found in the Table of flags and Notes sections of this document.
Top of Page

Environment and Climate Change Canada Date Modified: 2018-10-30 12
Table 4: Element number, units, description, flags and notes for DLY03
Element Units Code Description Flags Note
124 0.01 Adjustment factor 20
125-132 Since last chart change, greatest amount of rainfall in...
125 0.1 mm 5 minutes H, I, J 36
126 0.1 mm 10 minutes H, I, J 36
127 0.1 mm 15 minutes H, I, J 36
128 0.1 mm 30 minutes H, I, J 36
129 0.1 mm 1 hour H, I, J 36
130 0.1 mm 2 hours H, I, J 36
131 0.1 mm 6 hours H, I, J 36
132 0.1 mm 12 hours H, I, J 36
160 Chart change hour (Local Standard Time) 36
161 0.1 mm 24 hours H, I, J 36
3.4 Daily climatological data (DLY02, DLY04)
DLY02 daily data are now derived from hourly observations and will no longer be
restricted to synoptic observation stations effective the following dates:
May 14, 2018 – automatic climate weather stations
October 30, 2018 – human and automatic aviation weather stations
See Note 16 for additional information.
The following table presents the available element types for daily climatological data with corresponding units, code, description, flags and notes for DLY02 and DLY04 elements. The flags and notes referenced in this table can be found in the Table of flags and Notes sections of this document.
Table 5: Element number, units, code, description, flags and notes for DLY02 and DLY04
Element Units Code Description Flags Note
001 0.1°C Daily max temperature E
002 0.1°C Daily min temperature E, N, Y
003 0.1°C Daily mean temperature E
004 % Daily max relative humidity
005 % Daily min relative humidity
023 10's of deg (see 157)
Direction of extreme gust (16 pts) to December 1976
E, S 5, 34
024 km/h Speed of extreme gust E, S
025 UTC hour of extreme gust 41
Top of Page

Environment and Climate Change Canada Date Modified: 2018-10-30 13
Element Units Code Description Flags Note
(earliest)
157 10's of deg (see 023)
Direction of extreme gust (36 pts) from January 1977
E, S
006-009 6 hourly precipitation (totals ending at the specified time)
006 0.1 mm 1200 UTC T 15
007 0.1 mm 1800 UTC T 15
008 0.1 mm 0000 UTC T 15
009 0.1 mm 0600 UTC T 15
010 0.1 mm Total rainfall A, C, E, F, L, T
011 0.1 cm Total snowfall A, C, E, F, L, T
37
012 0.1 mm Total precipitation A, C, E, F, L, T
37
013 cm Snow on the ground E, T 8, 37
014-022 Day with... (DLY04 - also available for DLY44, elements 014-017)
014 1=Yes, 0=No Thunderstorms 14
015 1=Yes, 0=No Freezing rain or drizzle 14
016 1=Yes, 0=No Hail 14
017 1=Yes, 0=No Fog or Ice fog 14
018 1=Yes, 0=No Smoke or Haze 14
019 1=Yes, 0=No Blowing Dust or Sand 14
020 1=Yes, 0=No Blowing snow 14
021 1=Yes, 0=No Wind speed >= 28 Knots 14
022 1=Yes, 0=No Wind speed >= 34 Knots 14
179 0.1 hrs Daily bright sunshine 42
3.5 Daily climatological data from COOL (DLY44)
See Note 16 for additional information.
The following table presents the available element types for daily climatological data from the COOL observing program (DLY44) with corresponding units, code, description and numbered notes. The notes referenced in this table can be found in the Notes section of this document.
Table 6: Element number, units, code, description and notes for DLY44
Element Units Code Description Flags Note
001 0.1°C Daily max temperature 31
002 0.1°C Daily min temperature 31
003 0.1°C Daily mean temperature 31
010 0.1 mm Total rainfall 31
011 0.1 cm Total snowfall 31
012 0.1 mm Total precipitation 31
Top of Page

Environment and Climate Change Canada Date Modified: 2018-10-30 14
Element Units Code Description Flags Note
013 cm
Snow on the ground 8, 31
014-017 Day with... (DLY04 & DLY44)
014 1=Yes, 0=No Thunderstorms 14
015 1=Yes, 0=No Freezing rain or Drizzle 14
016 1=Yes, 0=No Hail 14
017 1=Yes, 0=No Fog or Ice fog 14
3.6 Monthly climatological data (MLY04)
See Note 16 for additional information.
The following table presents the available element types for monthly climatological data (MLY04), with corresponding element number, units, description, flags and numbered notes. The flags and notes referenced in this table can be found in the Table of flags and Notes sections of this document.
Table 7: Element number, units, code, description, flags and notes for MLY04
Element Units Code Description Flags Note
026-038 Number of days with...
026 Frost I 25
027 Thunderstorms I 25
028 Rain or Drizzle I 25
029 Freezing rain or Drizzle I 25
030 Hail I 25
031 Snow I 25
032 Measurable precipitation I 25
033 Fog or Ice fog
034 Smoke or Haze
035 Blowing dust or Sand
036 Blowing snow
037 Wind speed >= 28 knots
038 Wind speed >= 34 knots
039 whole cm Snow cover - Last day of month E, T
040 0.1°C Mean max temperature E, I 26
041 0.1°C Mean min temperature E, I 26
042 0.1°C Mean monthly temperature E, I 26
043 0.1°C Mean monthly temperature difference from normal
E 18
044 0.1°C Extreme max temperature B, E, I, S
25
045 Date of extreme max temperature (earliest)
Top of Page

Environment and Climate Change Canada Date Modified: 2018-10-30 15
Element Units Code Description Flags Note
046 0.1°C Extreme min temperature B, E, I, S
25
047 Date of extreme min temperature (earliest)
048 0.1 mm Total rainfall E, I, T 25
049 0.1 cm Total snowfall E, I, T 25
050 0.1 mm Total precipitation E, I, T 25
051 0.1 mm Total precipitation difference from normal
E, I, T 18, 25
052 0.1 mm Greatest rainfall B, E, I, S, T
25
053 Date of greatest rainfall (earliest)
054 0.1 cm Greatest snowfall B, E, I, S, T
25
055 Date of greatest snowfall (earliest)
056 0.1 mm Greatest precipitation B, E, I, S, T
25
057 Date of greatest precipitation (earliest)
058 10's of deg Direction of extreme gust (16 pts) to December 1976
B, E, S 9
059 km/h Speed of extreme gust B, E, S 9
060 Date of extreme gust (earliest) B, E, S 9
158 10's of deg Direction of extreme gust (36 pts) from January 1977
B, E, S 9
3.7 Bright sunshine (HLY10)
The following table presents the available element type for Bright sunshine (HLY10), with corresponding element number, unit, description, flag and note. The flag and note referenced in this table can be found in the Table of flags and Notes sections of this document.
Table 8: Element number, units, code, description, flags and notes for HLY10
Element Units Code Description Flags Note
133 0.1 hrs Sunshine E 21
3.8 Solar radiation (HLY11)
The following table presents the available element types for solar radiation (HLY11), with corresponding element numbers, units, description, flags and numbered note. The flags and note referenced in this table can be found in the Table of flags and Notes sections of this document.
Top of Page
Top of Page

Environment and Climate Change Canada Date Modified: 2018-10-30 16
Table 9: Element number, units, code, description, flags and notes for HLY11
Element Units Code Description Flags Note
061 0.001 MJ/m2 RF1 global solar radiation D, U, V, W, X, Y, Z
22
062 0.001 MJ/m2 RF2 sky (diffuse) radiation D, U, V, W, X, Y, Z
22
063 0.001 MJ/m2 RF3 reflected solar radiation
D, U, V, W, X, Y, Z
22
064 0.001 MJ/m2 RF4 net all wave radiation D, U, V, W, X, Y, Z
067 0.01 Kilolux_hrs
RF7 daylight illumination D, U, V, W, X, Y, Z
22
068 0.001 MJ/m2 RF8 direct solar radiation D, U, V, W, X, Y, Z
22
169 0.001 MJ/m2 RF9 incident longwave radiation (shaded)
D, U, V, W, X, Y, Z
170 0.001 MJ/m2 RFB emitted longwave radiation
D, U, V, W, X, Y, Z
171 0.001 MJ/m2 RFC incident solar radiation – Green (PAR)
D, U, V, W, X, Y, Z
22
172 0.001 MJ/m2 RFD incident solar radiation – Red (PAR)
D, U, V, W, X, Y, Z
22
3.9 Solar radiation (MIN11)
The following table presents the available element types for solar radiation (MIN11), with corresponding element numbers, units, description, flags and numbered note. The flags and note referenced in this table can be found in the Table of flags and Notes sections of this document.
Table 10: Element number, units, description, flags and notes for MIN11
Element Units Code Description Flags Note
200 0.1 W/m2 RF1 global solar radiation D, P, R, U, V, W, X, Y, Z
35
201 0.1 W/m2 RF2 sky (diffuse) radiation D, P, R, U, V, W, X, Y, Z
35
202 0.1 W/m2 RF3 reflected solar radiation D, P, R, U, V, W, X, Y, Z
35
203 0.1 W/m2 RF4 net all wave radiation D, P, R, U, V, W, X, Y, Z
35
204 0.1 W/m2 RF8 direct solar radiation D, P, R, U, V, W, X, Y, Z
35
205 0.1 W/m2 RF9 incident longwave D, P, R, U, V, W, 35
Top of Page

Environment and Climate Change Canada Date Modified: 2018-10-30 17
Element Units Code Description Flags Note
radiation (shaded) X, Y, Z
206 0.1 W/m2 RFB emitted longwave radiation
D, P, R, U, V, W, X, Y, Z
35
207 0.1 W/m2 RFC incident solar radiation - Green (PAR)
D, P, R, U, V, W, X, Y, Z
35
208 0.1 W/m2 RFD incident solar radiation - Red (PAR)
D, P, R, U, V, W, X, Y, Z
35
3.10 Soil temperature (DLY12)
The following table presents the available element types for soil temperature (DLY12), with corresponding element numbers, units, description and numbered note. The note referenced in this table can be found in the Notes section of this document.
Table 11: Element number, units, description and notes for DLY12
Element Units Code Description Flags Note
134-141 AM Soil temperatures at...
134 0.1°C 1 cm 10
135 0.1°C 5 cm
136 0.1°C 10 cm
137 0.1°C 20 cm
138 0.1°C 50 cm
139 0.1°C 100 cm
140 0.1°C 150 cm
141 0.1°C 300 cm
142 whole cm AM snow depth
143-149 PM Soil temperatures at...
143 0.1°C 1 cm 10
144 0.1°C 5 cm
145 0.1°C 10 cm
146 0.1°C 20 cm
147 0.1°C 50 cm 10
148 0.1°C 100 cm 10
149 0.1°C 150 cm 10
150 whole cm PM snow depth 10
Top of Page
Environment and Climate Change Canada Date Modified: 2018-10-30 18
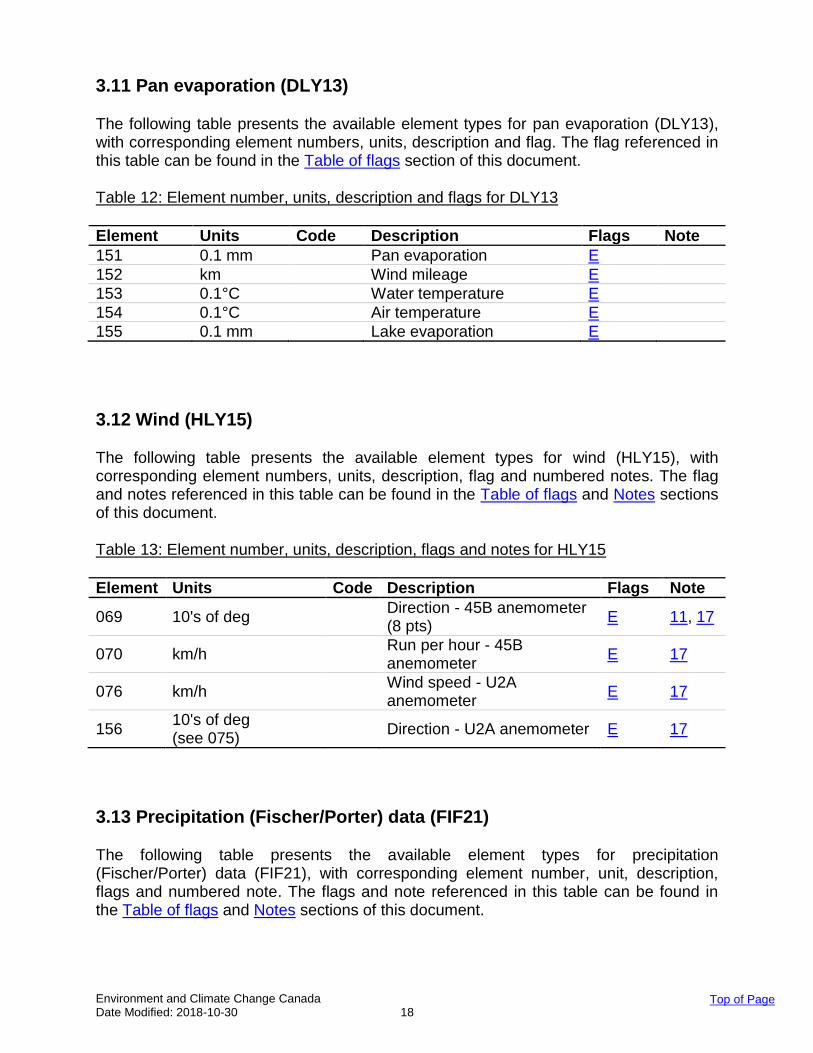
3.11 Pan evaporation (DLY13)
The following table presents the available element types for pan evaporation (DLY13), with corresponding element numbers, units, description and flag. The flag referenced in this table can be found in the Table of flags section of this document.
Table 12: Element number, units, description and flags for DLY13
Element Units Code Description Flags Note
151 0.1 mm Pan evaporation E
152 km Wind mileage E
153 0.1°C Water temperature E
154 0.1°C Air temperature E
155 0.1 mm Lake evaporation E
3.12 Wind (HLY15)
The following table presents the available element types for wind (HLY15), with corresponding element numbers, units, description, flag and numbered notes. The flag and notes referenced in this table can be found in the Table of flags and Notes sections of this document.
Table 13: Element number, units, description, flags and notes for HLY15
Element Units Code Description Flags Note
069 10's of deg Direction - 45B anemometer (8 pts)
E 11, 17
070 km/h Run per hour - 45B anemometer
E 17
076 km/h Wind speed - U2A anemometer
E 17
156 10's of deg (see 075)
Direction - U2A anemometer E 17
3.13 Precipitation (Fischer/Porter) data (FIF21)
The following table presents the available element types for precipitation (Fischer/Porter) data (FIF21), with corresponding element number, unit, description, flags and numbered note. The flags and note referenced in this table can be found in the Table of flags and Notes sections of this document.
Top of Page

Environment and Climate Change Canada Date Modified: 2018-10-30 19
Table 14: Element number, units, description, flags and note for FIF21
Element Units Code Description Flags Note
159 0.1 mm Precipitation A, K, L 39
3.14 Precipitation (Fischer/Porter) data (HLY21)
The following table presents the available element types for precipitation (Fischer/Porter) data (HLY21), with corresponding element number, unit, description and flags. The flag referenced in this table can be found in the Table of flags section of this document.
Table 15: Element number, units, description and flags for HLY21
Element Units Code Description Flags Note
123 0.1 mm Hourly precipitation H, I, J
3.15 Precipitation (Fischer/Porter) data (DLY21)
The following table presents the available element types for precipitation (Fischer/Porter) data (DLY21), with corresponding element numbers, units, descriptions and flags. The flags referenced in this table can be found in the Table of flags section of this document.
Table 16: Element number, units, description and flags for DLY21
Element Units Code Description Flags Note
012 0.1 mm Total precipitation A,C,E,F,L,T
127-132,161 Greatest amount of precipitation in...
127 0.1 mm 15 minutes H, I, J
128 0.1 mm 30 minutes H, I, J
129 0.1 mm 1 hour H, I, J
130 0.1 mm 2 hours H, I, J
131 0.1 mm 6 hours H, I, J
132 0.1 mm 12 hours H, I, J
161 0.1 mm 24 hours H, I, J
Top of Page

Environment and Climate Change Canada Date Modified: 2018-10-30 20
4.0 Upper air data (UAS/UAW)
4.1 Record formats and field description
Up until 2012, standard ASCII record formats exist for upper air data. These data are, archived at pressure levels, minute intervals or significant wind levels. Beyond 2012, upper air data are archived in a non-ASCII format, which is currently under review. For further information, contact: Services Climatiques / Climate Services (EC).
Each value in the standard record format is recorded as a five (5) digit integer preceded by a single field for the integer’s sign field followed by a single alphabetic character for the datum’s flag. The units and decimal positions are implied by the element number assigned to the record (see Table 18 below).
Each record consists of climate identification number, date, time and element number followed by the data, repeated for each level or time interval, from the lowest level to the termination of the ascent.
File organization is element within date and time (usually hours 00,06,12,18 UTC).
The two (2) types of record formats are as follows:
1. Ascent Record of Interspersed significant and Standard Level Data (UAS)
Figure 4: An illustration demonstrating how the ASCII characters are represented in a single line of UAS upper air data. The total length of each line is 656 characters, with the data fields repeating 90 times. An example of a single line of data from a UAS file is as follows: 240B350008010100181010105 010000 009500 009412 009250 009000 008500 008000 007897 007500 007000 006500 006000 005500 005297 005217 005007 005000 004851 004628 004500 004302 004000 003818 003500 003000 002812 002680 002500 002360 002167 002000 001937 001795 001750 001553 001500 001441 001250 001073 001005 001000 000800 000700 000694 000670 000600 000594 000500 -99999M-99999M-99999M-99999M-99999M-99999M-99999M-99999M-99999M-99999M-99999M-99999M-99999M-99999M-99999M-99999M-
Top of Page
Top of Page

Environment and Climate Change Canada Date Modified: 2018-10-30 21
99999M-99999M-99999M-99999M-99999M-99999M-99999M-99999M-99999M-99999M-99999M-99999M-99999M-99999M-99999M-99999M-99999M-99999M-99999M-99999M-99999M-99999M-99999M-99999M-99999M V
2. Ascent Record of Wind Data (UAW)
Figure 5: An illustration demonstrating how the ASCII characters are represented in a single line of UAW upper air data. The total length of each line is 866 characters, with the data fields repeating 120 times. An example of a single line of data from a UAW file is as follows: 240B350008010100188000006 000313 000627 000921 001210 001483 001788 002067 002348 002662 002961 003293 003613 003931 004249 004555 004872 005194 005507 005827 006118 006408 006689 007003 007353 007653 007937 008145 008393 008727 009092 009474 009814 010089 010315 010571 010848 011109 011337 011594 011866 012161 012397 012599 012823 013077 013361 013637 013896 014130 014374 014617 014854 015102 015367 015648 015930 016188 016477 016779 017061 017304 017558 017840 -99999M-99999M-99999M-99999M-99999M-99999M-99999M-99999M-99999M-99999M-99999M-99999M-99999M-99999M-99999M-99999M-99999M-99999M-99999M-99999M-99999M-99999M-99999M-99999M-99999M-99999M-99999M-99999M-99999M-99999M-99999M-99999M-99999M-99999M-99999M-99999M-99999M-99999M-99999M-99999M-99999M-99999M-99999M-99999M-99999M-99999M-99999M-99999M-99999M-99999M-99999M-99999M-99999M-99999M-99999M-99999M V
For the two (2) types of record formats presented above, the field descriptions are as follows:
Position 1-7: Seven (7) digit climate identification number which contains the province and district designation.
Position 8-10: Three (3) digit year, e.g. “2008” indicates “008”.
Position 11-12: Two (2) digit months, e.g. “05” indicates May.
Position 13-14: Two (2) digit day of month, e.g. ”01” indicates the first day of the month.
Position 15-16: Two (2) digit hour of the day, in UTC.
Position 17-19: Three (3) digit element number.
Top of Page

Environment and Climate Change Canada Date Modified: 2018-10-30 22
Position 20-25: Five (5) digit value for the first level of upper air data, plus one preceding character reserved for the datum’s sign, which is explicit (“-“) if negative and implicit (“0”) if positive. A missing field is indicated by “-99999”.
Position 26: A flag for the value in position 20-25, where a blank space indicates valid data. See Table of flags for more information.
Position 27-33: Value and flag for the second level of upper air data.
This pattern of data, preceded by a number sign and followed by a flag, is repeated 90 times for UAS data and 120 times for UAW data. Note that all value fields are initialized to “-99999M” (missing), therefore, if the ascent is missing, then no record will be written and the value will remain as such.
4.2 Source code
This code indicates the equipment used to collect the data or the source of the data.
A = ADRES (implemented between June 1980 and May 1981)
B = pre-ADRES (data converted from the card archive, type 05, 06, 08 & 18)
NOTE: ADRES stands for Aerological Data Reduction System.
4.3 List and description of elements
UAS Record
Table 17: Element number, units, description and notes for UAS
Element Units Description Notes
181 0.01 kPa Pressure 27, 30
182 whole meters Altitude above sea level 27, 30
183 0.1 deg C Temperature 27, 30
184 % Relative humidity 27, 30
185 degrees Wind direction 27, 30
186 meters per second Wind speed 27, 30
UAW Record
Table 18: Element number, units, description and notes for UAW
Element Units Description Notes
187 0.01 kPa Pressure 28, 30
188 whole meters Altitude above sea level 28, 30
Top of Page

Environment and Climate Change Canada Date Modified: 2018-10-30 23
Element Units Description Notes
189 degrees Wind direction 28, 30
190 meters per second Wind speed 28, 30
5.0 Table of flags
Table 19: Flag, definition and applicable elements
Flag Definition Elements
blank Valid data all except 061-068, 169-172, 200-208
A Accumulated amount; previous value C or L for elements 010, 011, 012 and K or L for elements 159
010, 011, 012, 159
B More than one occurrence & estimated 044, 046, 052, 054, 056, 058, 059
C Precipitation occurred, amount uncertain; value is 0
010, 011, 012
D Derived 061-068, 169-172, 200-208
E Estimated all except 061-068, 169-172, 200-208, 262-280
F Accumulated and estimated 010, 011, 012
G Uncorrected 107-122, 219-230
H Freezing 123, 125-132, 161
I Unadjusted 123, 125-132, 161
I Incomplete; month contains at least one missing value
026-032, 044, 046, 048-052
I Incomplete; month contains 3 consecutive or 5 random missing values
040, 041, 042
J Freezing and unadjusted 123, 125-132, 161
K First occurrence when precipitation. May or may not have occurred; value is 0
159
L Precipitation may or may not have occurred; value is 0 or 0.1
010, 011, 012, 159
M Missing all
N Time uncertain 159
N Temperature missing, but known to be ABOVE freezing
002
O Not assigned
P Identified by automatic QC as suspect 200-208
Q Not assigned
R Identified by automatic QC as erroneous 200-208
S More than one occurrence 023, 024, 044, 046, 052, 054, 056, 058, 059, 157, 158, 209,
Top of Page
Environment and Climate Change Canada Date Modified: 2018-10-30 24
Flag Definition Elements
210
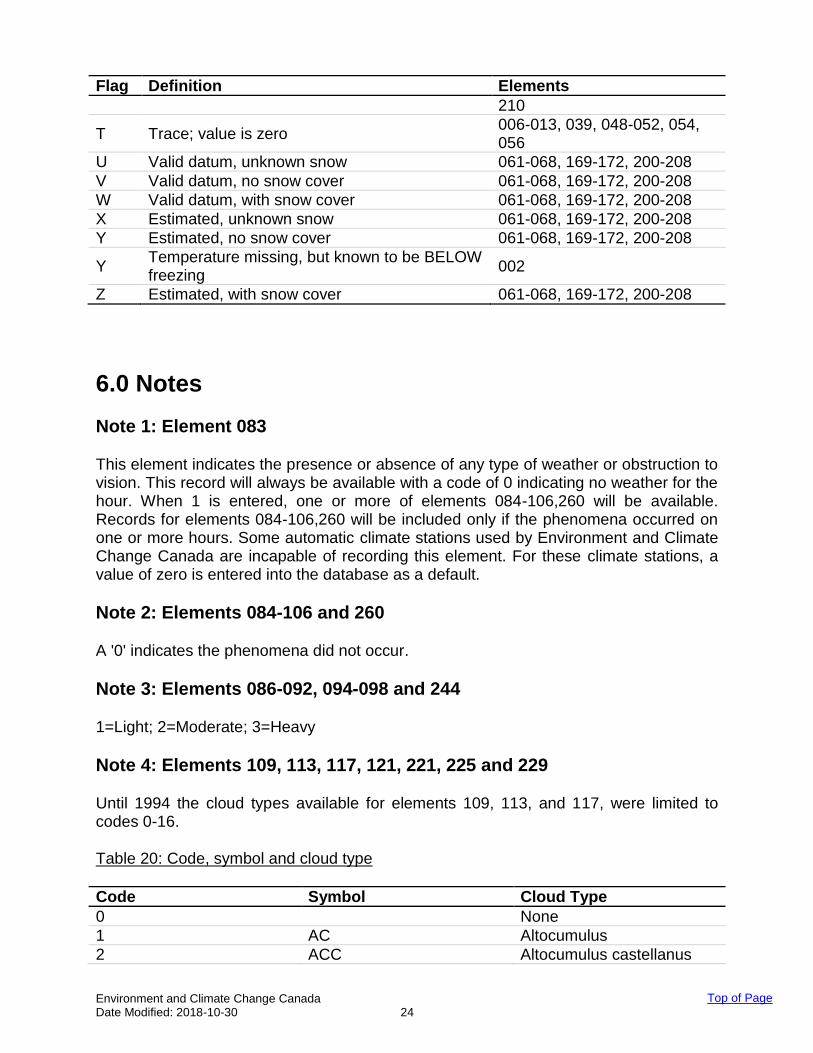
T Trace; value is zero 006-013, 039, 048-052, 054, 056
U Valid datum, unknown snow 061-068, 169-172, 200-208
V Valid datum, no snow cover 061-068, 169-172, 200-208
W Valid datum, with snow cover 061-068, 169-172, 200-208
X Estimated, unknown snow 061-068, 169-172, 200-208
Y Estimated, no snow cover 061-068, 169-172, 200-208
Y Temperature missing, but known to be BELOW freezing
002
Z Estimated, with snow cover 061-068, 169-172, 200-208
6.0 Notes
Note 1: Element 083
This element indicates the presence or absence of any type of weather or obstruction to vision. This record will always be available with a code of 0 indicating no weather for the hour. When 1 is entered, one or more of elements 084-106,260 will be available. Records for elements 084-106,260 will be included only if the phenomena occurred on one or more hours. Some automatic climate stations used by Environment and Climate Change Canada are incapable of recording this element. For these climate stations, a value of zero is entered into the database as a default.
Note 2: Elements 084-106 and 260
A '0' indicates the phenomena did not occur.
Note 3: Elements 086-092, 094-098 and 244
1=Light; 2=Moderate; 3=Heavy
Note 4: Elements 109, 113, 117, 121, 221, 225 and 229
Until 1994 the cloud types available for elements 109, 113, and 117, were limited to codes 0-16.
Table 20: Code, symbol and cloud type
Code Symbol Cloud Type
0
None
1 AC Altocumulus
2 ACC Altocumulus castellanus
Top of Page

Environment and Climate Change Canada Date Modified: 2018-10-30 25
Code Symbol Cloud Type
3 AS Altostratus
4 CC Cirrocumulus
5 CS Cirrostratus
6 CI Cirrus
7 CB Cumulonimbus
8 CU Cumulus
9 CF Cumulus fractus
10 SF Stratus fractus
11 TCU Towering cumulus
12 NS Nimbostratus
13 SC Stratocumulus
14 ST Stratus
15 F Fog
16
Obstruction other than fog
17 R Rain (any form including RW and ZR)
18 A Hail
19 IP Ice pellets (including ice pellet showers)
20 L Drizzle (including freezing drizzle)
21 IC Ice crystals
22 S Snow (snow showers, snow pellets and snow grains)
23 BS Blowing snow
24 D Dust, blowing dust or duststorm
25 H Haze
26 N Sand, blowing sand or sandstorm
27 K Smoke
28 VA Volcanic ash
Note 5: Elements 023 and 075
Table 21: 16 point, range and 10s of deg
16 point Direction/Range 10s of Degrees
NNE (012-033) 02
NE (034-056) 05
ENE (057-078) 07
E (079-101) 09
ESE (102-123) 11
SE (124-146) 14
Top of Page

Environment and Climate Change Canada Date Modified: 2018-10-30 26
16 point Direction/Range 10s of Degrees
SSE (147-168) 16
S (169-191) 18
SSW (192-213) 20
SW (214-236) 23
WSW (237-258) 25
W (259-281) 27
WNW (282-303) 29
NW (304-326) 32
NNW (327-348) 34
N (349-011) 36
CALM
00
Note 6: Element 071
Unlimited Ceiling has been assigned a value of 888.
Note 7: Element 072
Table 22: Value in km and statute miles
Value (km) Statute Miles
25.0 15+
15.0 9
0.0 0
0.2 1/8
0.4 1/4
0.6 3/8
0.8 1/2
1.0 5/8
1.2 3/4
1.6 1
2.0 1 1/4
2.4 1 1/2
2.8 1 3/4
3.2 2
3.6 2 1/4
4.0 2 1/2
4.8 3
ETC
159.3 99
Note 8: Element 013
Daily snow depth is available since 1955 for about 300 primary and selected climate stations.
Top of Page
Environment and Climate Change Canada Date Modified: 2018-10-30 27
The record for this element will not be available if snow on the ground is reported only on the last day of the month. Last day snow depth is available from element 039 on the MLY04 file.
In 1981 many non-primary climate stations began to observe daily snow depth. Frequently, zero amounts are not entered on the document and are archived as missing. This deficiency is most evident after the last measured depth in the spring.
Note 9: Elements 058, 059, 060 and 158
When no gusting occurs, the direction and speed are coded -99999M and the date shows as 000000b (b means blank).
Note 10: Elements 134, 143 and 147-150
Elements 134 and 143 were gradually phased out beginning June 1966.
Elements 147-150 were discontinued June 1966.
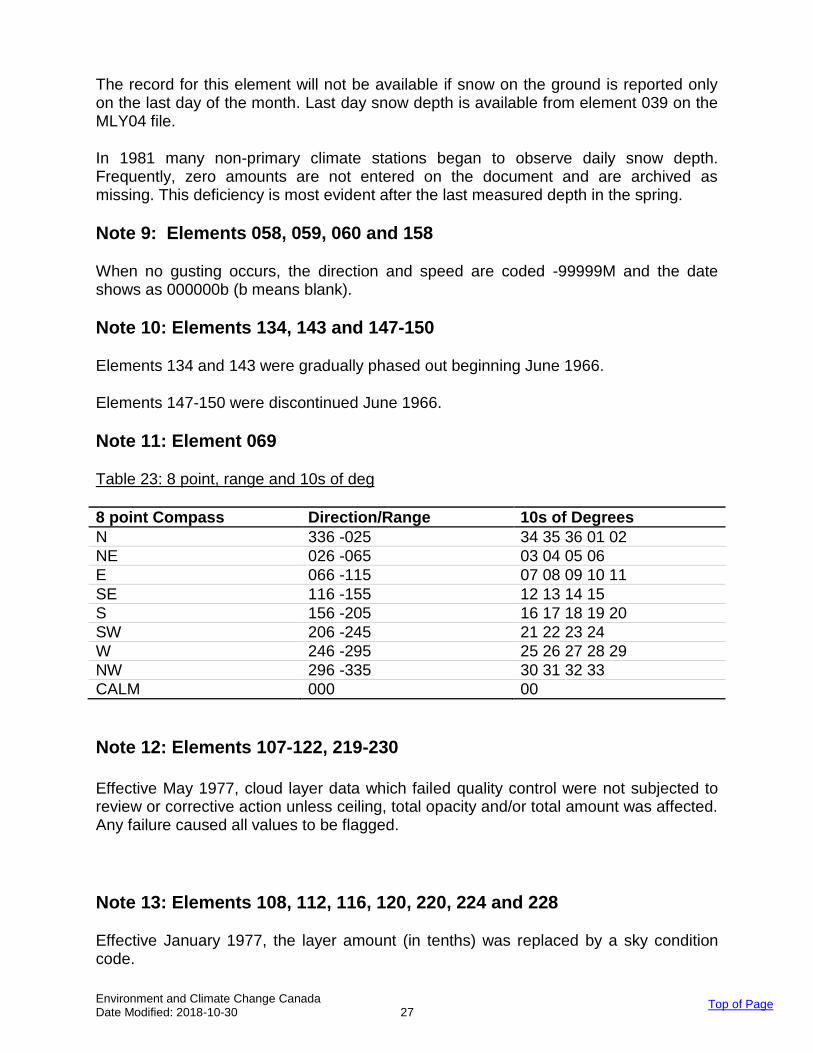
Note 11: Element 069
Table 23: 8 point, range and 10s of deg
8 point Compass Direction/Range 10s of Degrees
N 336 -025 34 35 36 01 02
NE 026 -065 03 04 05 06
E 066 -115 07 08 09 10 11
SE 116 -155 12 13 14 15
S 156 -205 16 17 18 19 20
SW 206 -245 21 22 23 24
W 246 -295 25 26 27 28 29
NW 296 -335 30 31 32 33
CALM 000 00
Note 12: Elements 107-122, 219-230
Effective May 1977, cloud layer data which failed quality control were not subjected to review or corrective action unless ceiling, total opacity and/or total amount was affected. Any failure caused all values to be flagged.
Note 13: Elements 108, 112, 116, 120, 220, 224 and 228
Effective January 1977, the layer amount (in tenths) was replaced by a sky condition code.
Top of Page
Environment and Climate Change Canada Date Modified: 2018-10-30 28
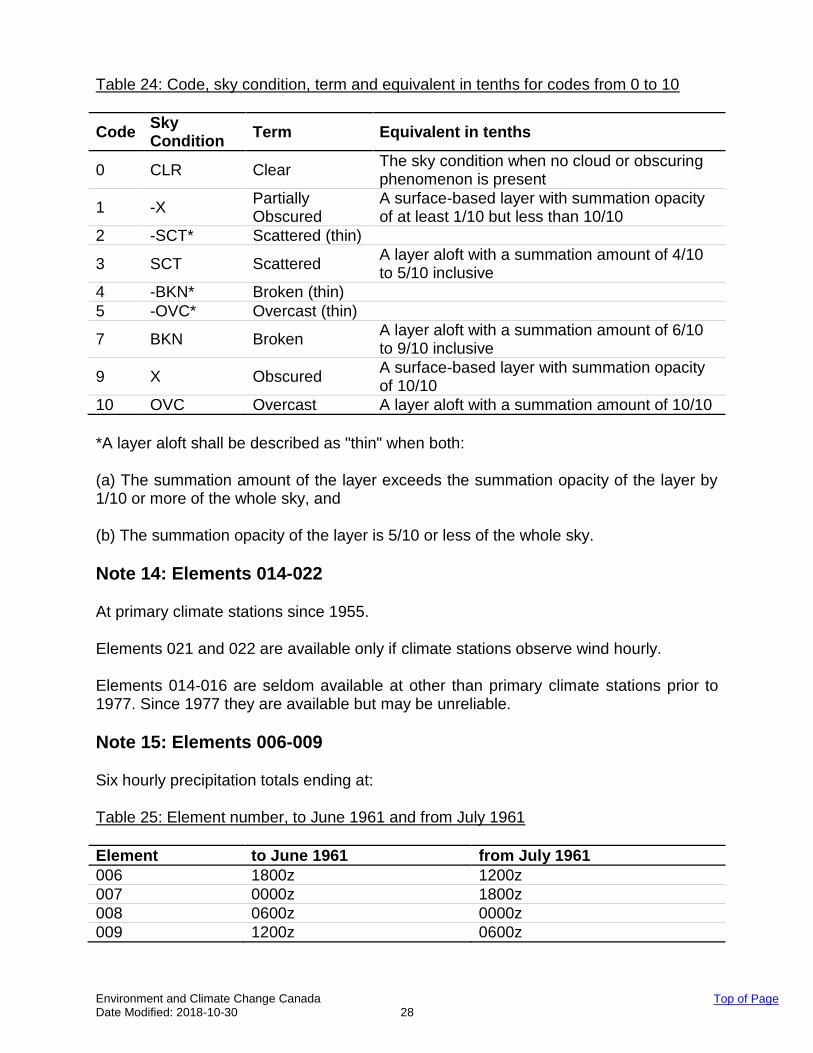
Table 24: Code, sky condition, term and equivalent in tenths for codes from 0 to 10
Code Sky Condition
Term Equivalent in tenths
0 CLR Clear The sky condition when no cloud or obscuring phenomenon is present
1 -X Partially Obscured
A surface-based layer with summation opacity of at least 1/10 but less than 10/10
2 -SCT* Scattered (thin)
3 SCT Scattered A layer aloft with a summation amount of 4/10 to 5/10 inclusive
4 -BKN* Broken (thin)
5 -OVC* Overcast (thin)
7 BKN Broken A layer aloft with a summation amount of 6/10 to 9/10 inclusive
9 X Obscured A surface-based layer with summation opacity of 10/10
10 OVC Overcast A layer aloft with a summation amount of 10/10
*A layer aloft shall be described as "thin" when both:
(a) The summation amount of the layer exceeds the summation opacity of the layer by 1/10 or more of the whole sky, and
(b) The summation opacity of the layer is 5/10 or less of the whole sky.
Note 14: Elements 014-022
At primary climate stations since 1955.
Elements 021 and 022 are available only if climate stations observe wind hourly.
Elements 014-016 are seldom available at other than primary climate stations prior to 1977. Since 1977 they are available but may be unreliable.
Note 15: Elements 006-009
Six hourly precipitation totals ending at:
Table 25: Element number, to June 1961 and from July 1961
Element to June 1961 from July 1961
006 1800z 1200z
007 0000z 1800z
008 0600z 0000z
009 1200z 0600z
Top of Page

Environment and Climate Change Canada Date Modified: 2018-10-30 29
Note 16: Elements of sections DLY02, DLY04, MLY04 and DLY44
The following guidelines can be used to determine the times of observations and the endpoint of the climatological day for temperature and precipitation elements:
For climate stations operating on a 24 hour basis, since July 1, 1961, the climatological day for temperature and precipitation ends at 0600Z of the following day. From June 1, 1957 to June 30, 1961, the climatological day for precipitation and maximum temperature ended at 1200Z of the following day. The climatological day for minimum temperatures ended at 0000Z of the following day. Before June 1, 1957, the climatological day for precipitation and maximum temperature ended at 1230Z of the following day. The climatological day for minimum temperatures ended at 0030Z of the following day.
At locations with no hourly observations, observation times are generally morning and evening. In general, the climatological day for precipitation and maximum temperature ends at the morning observation of the following day. The climatological day for minimum temperatures ends at the afternoon observation of the current day. For sites reporting only once per day, the calendar day rather than climatological day applies.
In cases where knowing time-of-observation is critical, the best approach is to check the historical inspection reports for the climate station. For further information on climate station inspection reports, please contact: Services Climatiques / Climate Services (EC).
Note 17: Elements 069, 070, 075, 076 and 156
Wind data are available in either the HLY01 or HLY15 data sets. U2A anemometer winds, from climate stations which also observe other elements, are archived in the HLY01 data sets. Currently, these data are from the SA type message or form 2322. The HLY15 data sets are primarily 45B anemometer winds. However, climate stations equipped with U2A and reporting only winds are included.
Note 18: Elements 043 and 051
These differences from normal are available from 1977 to 1993. The 1941-1970 normals were replaced by the 1951-1980 normals with the processing of January 1982 data.
Note 19: Elements 107-122 and 219-230
If a cloud observation is taken, the four elements of the lowest (or only) layer are entered in the archive. If there is no cloud, the height is assigned a value of 888 and the other elements of the layer are zero. The second to fourth/sixth (see Note 29) layers are archived only if cloud is reported.
Top of Page

Environment and Climate Change Canada Date Modified: 2018-10-30 30
Note 20: Element 124
A factor applied to the hourly and duration amounts to bring them in line with the daily total measured with a standard MSC precipitation gauge. This element is available since 1978.
Note 21: Element 133
Records are not included during the periods of polar night.
Note 22: Elements 061-063, 067, 065-068, 171 and 172
Periods of polar night are indicated by a data value of -00000 (literally: minus zero).
Note 23: Elements 100 and 260
Observations of Element 100 (IF) discontinued November 1, 1999. Observations of Element 260 (FZFG) commenced November 1, 1999.
Note 24: Element 093
Between February 20th, 1995 and November 2000, observations of IC (ice crystals) at temperatures greater than -16°C were automatically changed to S- (light snow). Thus, archived occurrences of S- at temperatures >-16°C may have originally been reported as IC.
Note 25: Elements 026-032, 044, 046, 048-052, 054 and 056
Beginning in 1994, values derived for these elements were flagged with "I" for incomplete if the month contained one or more missing daily values.
Note 26: Elements 040-042
Beginning in 1994, values derived for elements 040, 041 and 042 were flagged with "I", denoting incomplete, if the month contained more than 3 consecutive missing daily values or more than 5 missing daily values in total for the month.
Note 27: Elements 181-186
Data for significant and standard levels are interspersed in descending pressure sequence.
If any data are available for an ascent, all six (6) records are included. The first level at which temperature is available represents the surface weather
observation. For standard pressure levels exceeding the station pressure, only the altitude is
given, and may be negative.
Top of Page

Environment and Climate Change Canada Date Modified: 2018-10-30 31
The termination of an ascent is indicated by a value of -99999M in the pressure record (element 181).
Prior to ADRES, wind direction and speed (elements 185 and 186) are only available for standard levels.
Prior to 1969 the surface pressure is in tenths of kilopascals. ADRES was implemented between June 1980 and May 1981. Each record
carries a code indicating the source of the data. Prior to ADRES the altitude is available for standard pressure levels only. After the installation of ADRES, pressures for significant levels are in hundredths
of kilopascals. The available standard levels vary, but will be from the following list:
100.00, 95.00, 90.00, 85.00, 80.00, 75.00, 70.00,
65.00, 60.00, 55.00, 50.00, 45.00, 40.00, 35.00, 30.00,
25.00, 20.00, 17.50, 15.00, 12.50, 10.00, 8.00, 7.00,
6.00, 5.00, 4.00, 3.00, 2.50, 2.00, 1.50, 1.00,
0.70, 0.40, 0.30, 0.20 kPa.
o 2.50 kPa surface available since mid-1957 o 7.00, 0.30, 0.20 kPa surfaces available from January 1961 o 95.00, 75.00, 65.00, 55.00, 45.00, 0.30, 0.20 kPa surfaces are not
available after ADRES installed at the station.
Note 28: Elements 187-190
Two types of data are available depending on the period. Before the implementation of ADRES at the station, significant wind level data are recorded with altitude, direction and speed available (elements 188,189 & 190). After the implementation of ADRES, winds are recorded at minute intervals with pressure, altitude, direction and speed available (elements 187, 188, 189 & 190). The termination of the ascent is indicated by a value of -99999M in the altitude record (element 188).
Note 29: Elements 107-122 and 219-230
The Manual of Surface Weather Observations (MANOBS) allows up to six cloud layers from manned climate stations and five from Automated Weather Observing System (AWOS) stations (a ground-based layer plus four layers aloft). In the past, an algorithm was used to compress the layers into a maximum of four layers to be stored in the archive. With the introduction of elements 219-230, all layers are available in the archive since 1994. The compressed fourth layer (element 119-122) will continue to be populated to support legacy applications.
Top of Page

Environment and Climate Change Canada Date Modified: 2018-10-30 32
Note 30: Elements 181-190
RS80 radiosondes have been replaced by RS92 radionsondes. The switchover began in October 2005 and was completed in June 2006.
The following GENOT was issued on October 14, 2005 reflecting the date/time as to when the switchover took place: NOCN01 CWAO 141830 and GENOT TLTP. NO. 139.
Note 31: Elements 001-003 and 010-013
In 2004, the MSC developed a web-based application called COOL (DLY44) to collect climate information from volunteer and cooperative observers (originally part of the Temperature and Precipitation Climate Observer Network) with access to internet-enabled computers. Observers that do not have access to the internet enter their observations via a touch-tone reporting system called ONTAP-IVR.
COOL observations include maximum and minimum temperatures, rainfall, snowfall, and snow depth data. Observations are taken once or twice a day.
Note 32: Elements 209 and 210
Wind character and wind gust speed are acquired at a height of 10 m. These elements are reported since 1994 and have been added to the archive in January 2006.
Note 33: Elements 262-280
Additional RCS elements were added to the archive in January 2006. Prior to December 10th, 2013 quality checks were not performed at the ingest stage and the status of the data is “R” (raw). From December 10th, 2013 onward basic automatic quality assessment of the data is being performed at the ingest stage and the status of the data is “Q”.
Element description:
262-270: Prior to 2007 the precipitation gauge weight (elements 267-270) was derived by using a weighing type gauge. The weights are computed for each minute of the hour based on a 9-minute boxcar* average. The precipitation gauge weight is computed for a given minute (15, 30, 45, 60) in units of kg/m2 and stored with a resolution of 0.1 kg/m2. Units of kg/m2 equate to mm. As of 2007 onward, 9-minute boxcar* averages are no longer used and precipitation gauge weight is computed using 5-minute filtered averages ending at the four times listed above.
The quarter-hour total precipitation amounts (elements 263-266), are derived over 15-minute intervals (00-15, 15-30, 30-45, 45-60) by taking the difference of the gauge weight between the end and start of each period. The total hourly precipitation (element 262) is the total precipitation amount for minutes 00 through 60, inclusive, computed as
Top of Page

Environment and Climate Change Canada Date Modified: 2018-10-30 33
the sum of the four 15-minute precipitation amounts. Precipitation amounts are stored in mm with a resolution of 0.1 mm.
271-274, 279-280: The 15-minute average wind speed at the height of the precipitation gauge (approximately 2 meters) (elements 271-274) is averaged over a 15-minute interval (00-15, 15-30, 30-45, 45-60). The average for the interval is computed as the mean of the 15 minutely averages. The wind speed is observed in m/s or nautical mile per hour and is archived in km/h with a resolution of 0.1 km/h. The average wind direction at the height of the precipitation gauge (element 279), at the top of the hour (minutes 50-60), is computed using a vector algorithm where the average north and east vectors are converted to a direction in degrees true, with a resolution of whole degrees. The average wind speed at the height of the precipitation gauge (element 280), at the top of the hour, is averaged over the interval of minutes 50-60. This element is observed in m/s or nautical mile per hour and will be archived in km/h with a resolution of 0.1 km/h.
275-278: Prior to 2007, the snow depth element was the depth of snow on ground computed for a given minute (15, 30, 45, 60) based on a 9-minute boxcar* average for that minute. It is stored in whole cm with a resolution of 1 cm. As of 2007 onward, 9-minute boxcar averages are no longer used and snow depth fields are computed using 5-minute filtered averages ending at the four times listed above.
boxcar* - (definition) A moving average computed for each minute, based on 9 minutely average values preceding each target minute.
Note 34: Element 023
During the period of 1955 and 1966, “S” flags were used for element 023, direction of extreme wind gust. The “S” flag indicated that the hourly peak wind gust value occurred more than once within that day.
Note 35: Elements 200-208
Flags P (suspect) and R (erroneous) only apply to minutely solar radiation data processed by a new automated solar radiation system implemented in 2005. These flags only apply to data that has a status of raw, meaning that suspect/error flags assigned to the data during automatic QC have not yet been cleared or corrected by manual interactive QC. These two flags allow the user to make their own determination of whether the data quality is appropriate for their application. Data values which have a status of Q (quality controlled), and therefore no P or R flag, have passed both automatic QC as well as any manual QC required to inspect and/or correct suspect/erroneous data.
Note 36: Elements 125-132
Rate of rainfall data for the period 1996-1999, provided by the “Ministère du Développement durable, Environnement et lutte contre les changements climatiques”, presented a few irregularities. This only affects data for climate stations located in the
Top of Page

Environment and Climate Change Canada Date Modified: 2018-10-30 34
province of Québec. These rare occurrences present rate of rainfall data (complete or partial) that are not supported by hourly precipitation for the corresponding period. The standard gauge value might also be missing. In these circumstances, the rate of rainfall data are flagged as "I" (unadjusted).
Note 37: Elements 011-013
Because the sections of the synoptic message pertaining to elements 011, 012 and 013 are not mandatory, they may be omitted from the message. When the data are ingested into the database, the missing message is replaced by a zero. For these elements, a zero may therefore indicate that the observed value was zero or that the relevant portions of the synoptic message were not transmitted.
Note 38: HLY01 elements
Special SPL01 observations, recorded at times outside the regular schedule, are made for HLY01 elements at some stations. Note that SPL01 observations are not reported for RCS elements (elements 262-280).
Note 39: Element 159
Data for element 159 is formatted with a three (3) digit year in the ASCII files.
Note 40: Element 072
Due to different observation standards, the maximum visibility that can be recorded by manned climate stations is 15 statute miles, while the maximum for AWOS stations is 9 statute miles. A value of 15 (for manned climate stations) or 9 (for AWOS stations) may mean that the actual visibility value exceeded that amount.
Note 41: Element 025
This element is reported in UTC after 1961 and in LST prior to 1961. For information on the date a specific climate station switched from LST to UTC, please contact: Services Climatiques / Climate Services (EC).
Note 42: Element 179
The program responsible for reporting daily bright sunshine was no longer operational as of July 1, 2005.
Note 43: Element 244
The Precipitation – Unclassified type element was implemented in 2009 and exists for AWOS stations. It represents precipitation of varying intensities that has been detected by a sensor, however, the sensor was unable to classify the specific type as either a
Top of Page

Environment and Climate Change Canada Date Modified: 2018-10-30 35
form of liquid, freezing or frozen precipitation. Basic quality control is not performed at the ingest stage. As a result, the status of the data is “R” (raw).
Note 44: Elements 108, 112, 116, 120, 220, 224 and 228
Since 2010, manned climate stations that became NCHWOS stations report only individual cloud layer amount, i.e. not a total of the reporting layer amount and layers below. The amount is observed in octas and is converted to tenths for reporting. Also, reported layer amount excludes any obscuration which is reported under weather.
Top of Page


![EUROPEAN COMMISSION Executive Agency for Small and … · Grant Agreement number: [insert number] [insert acronym] [insert call identifier of the master call] EASME Model Grant Agreement:](https://img.dokumen.tips/doc/110x75/5f1f193b6b12e3701b18ac78/european-commission-executive-agency-for-small-and-grant-agreement-number-insert.jpg)


![H2020 Programme Mono-Beneficiary Model Grant Agreement · 2019-06-21 · Grant Agreement number: [insert number] [insert acronym] [insert call identifier] H2020 Model Grant Agreements:](https://img.dokumen.tips/doc/110x75/5f7bb7d03afdbf5c7842a0a4/h2020-programme-mono-beneficiary-model-grant-agreement-2019-06-21-grant-agreement.jpg)

![European Research Council (ERC) Multi-Beneficiary …...Grant Agreement number: [insert number] [insert acronym] [insert call identifier] H2020 Model Grant Agreements: H2020 ERC MGA](https://img.dokumen.tips/doc/110x75/5e468cdb0a3b3c056a46e3e1/european-research-council-erc-multi-beneficiary-grant-agreement-number-insert.jpg)


![H2020 Programme Multi-Beneficiary Model Grant Agreement · Grant Agreement number: [insert number] [insert acronym] [insert call identifier] H2020 Model Grant Agreements: H2020 MGA](https://img.dokumen.tips/doc/110x75/5f86cda5c1b1c677475d0cc3/h2020-programme-multi-beneficiary-model-grant-agreement-grant-agreement-number.jpg)
![Perle P840 · 2015-02-18 · 5. SPID 1 [none] - link 1 service profile identifier 6. SPID 2 [none] - link 2 service profile identifier Enter option number, “=“ - main menu,](https://img.dokumen.tips/doc/110x75/5f2bb5fa00b6e45f4a4a2570/perle-p840-2015-02-18-5-spid-1-none-link-1-service-profile-identifier-6.jpg)


