Embed Size (px)
Citation preview

Massachusetts All-Payer Claims Database:Technical Assistance Group (TAG)
April 14, 2015
Agenda
• Housekeeping
• Submission Guides – Version 4 Timeline
• 2015 Annual Premiums Data Request
• Enrollment Trends
• Total Medical Expenses (TME)
• Wrap Up

Housekeeping – Risk Adjustment
• Risk Adjustment Lockdown
Data Due 4/30/2015
All RACP fields and premiums
• Data Extracts
• Risk Adjustment Member Month Tracker
• Supplemental Diagnosis Submission Guide

Housekeeping – DOI Reports
• Membership Reports
Review Logic
Reply to Liaisons
Reruns based on logic updates
• Utilization Reports
Meetings June 3rd – June 19th
Pre-meetings the week prior

Version 4 Intake Timeline
• Version 4 File Submissions DELAYED
• New Production TimeLine
Supplemental Diagnosis (SD) – Production Starts 7/1/2015
ME, MC, PC, DC, PV, PR, BP – Production Starts 8/1/2015
• Testing TimeLine – June/July 2015
Priority – SD, MC, PV, ME followed by all others

Version 5 Intake and Beyond
MA APCD Intake Process Timeline
Data Partners Propose Version 5 Updates November 2015
Proposals Shared/Discussed with Carriers December 2015
Draft Submission Guides published January 2016
Guides Reviewed at Technical Advisory Group January 2016
Carrier Comment Period January 2016
Administrative Bulletin and Guides Adopted February 2016
Development/Testing March/June 2016
Carrier Testing July 2016
MA APCD Intake Version 5 Production August 2016
* CHIA plans to maintain this timeframe on an annual basis

2015 ANNUAL PREMIUMS DATA REQUEST
April 14, 2015Kevin Meives| Senior Health Policy Analyst
Annual Premiums Data Request
Payer Questions
o Review of First TAG
o Behavioral Health, Dental, and Vision Benefits
o Counting Membership
o Average Employer Size
Additional Questions
Timeline

Review of First TAG
Question: Can payers use the same data submitted last year for
2012 and 2013 in this year’s Request?
Answer: No. Please generate fresh data for 2012 and 2013, re-
running queries to account for retro-activity, complete run-out, and
specification consistency.
Question: CHIA is requesting premiums and claims data be split
by fully-insured and self-insured. Should we go back to 2012 and
2013 and split out that data?
Answer: Yes. We ask that payers split out claims data by fully- and
self-insured for all three years, not just for 2014.
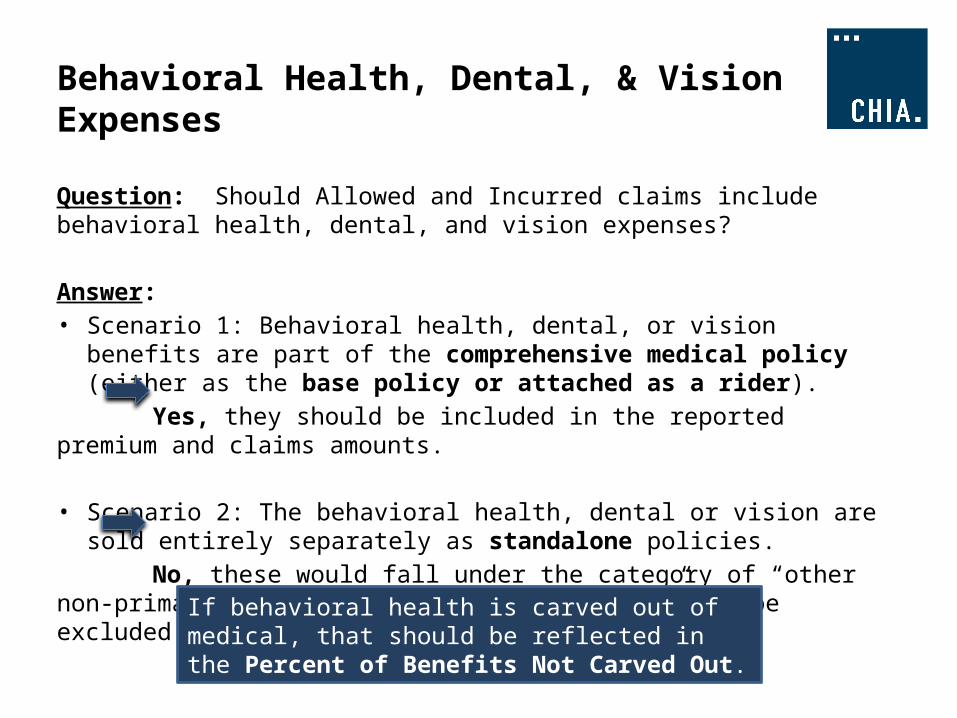
Behavioral Health, Dental, & Vision Expenses
Question: Should Allowed and Incurred claims include behavioral health, dental, and vision expenses?
Answer: • Scenario 1: Behavioral health, dental, or vision benefits are part
of the comprehensive medical policy (either as the base policy or attached as a rider).
Yes, they should be included in the reported premium and claims amounts.
• Scenario 2: The behavioral health, dental or vision are sold entirely separately as standalone policies.
No, these would fall under the category of “other non-primary, non-medical business,” and be excluded from the request.
If behavioral health is carved out of medical, that should be reflected in the Percent of Benefits Not Carved Out.

Counting Membership
Question: When counting membership/member months, should
we count members active on 12/31 of the reporting year or
members active any time during the reporting year?
Answer: Please report the total member months of coverage
during the year, for members that were active any time during the
year.

Counting Membership - Example
Member Effective Date: April 1, 2014
Coverage Terminated Date: July 31, 2014
What You Would Report:
• Membership: 4 member months
• Premiums and Claims: The premium that was earned and
the claims that were incurred for that member for the 4
months of coverage.
There should be consistency between the member months, premiums, and claims reported.

Average Employer Size
Question: For average employer size, should we count all
covered employees regardless of their state of residence or only
covered employees who reside in MA?
Answer: All of the reporting should be based on the contract
situs, not member residence. For the average employer size count,
this would include all covered employees, both residents and non-
residents.

Additional Questions
Are there any other questions at this time?
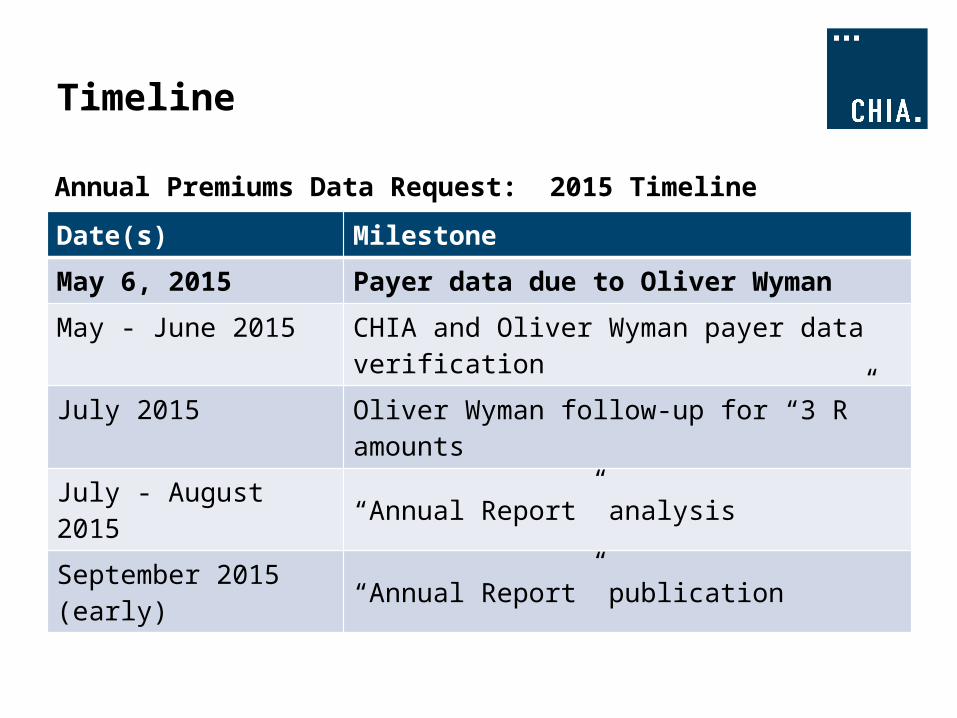
Timeline
Annual Premiums Data Request: 2015 Timeline
Date(s) Milestone
May 6, 2015 Payer data due to Oliver Wyman
May - June 2015 CHIA and Oliver Wyman payer data verification
July 2015 Oliver Wyman follow-up for “3 R” amounts
July - August 2015 “Annual Report” analysis
September 2015 (early) “Annual Report” publication

Contact Information & Request Materials
General Questions:Kevin MeivesSenior Health Policy AnalystCHIA Health System Performance Analytic [email protected]
Technical Questions:Dianna WelchPrincipalOliver Wyman Actuarial Consulting, Inc.(414) [email protected]

ENROLLMENT TRENDSAPCD ENROLLMENT REPORTING
April 14, 2015Ashley Storms| Health System Policy Analyst

CHIA Enrollment Trends Reporting
Enrollment Trends Overview
About the Report
Timeline
Data Verification: Payer Data Breakouts
Questions and Answers
Contact Information

CHIA Enrollment Trends Overview
• Enrollment Trends monitors health insurance coverage in the Commonwealth of Massachusetts within the top 16 commercial payers, MassHealth and Medicare (as data allow).
• Population: unique, Massachusetts residents with primary, medical coverage
• Transition from direct payer reporting (“ACA Enrollment Trends”) to APCD Member Eligibility data
• Identifying the Enrollment Trends population:– Member State – ME016 = MA– Medical Coverage – ME018 = 1– Primary Insurance Indicator – ME028 = 1
• Understanding enrollment by category:– Insurance Type Code Product – ME003– Coverage Type – ME029– Market Category Code – ME030
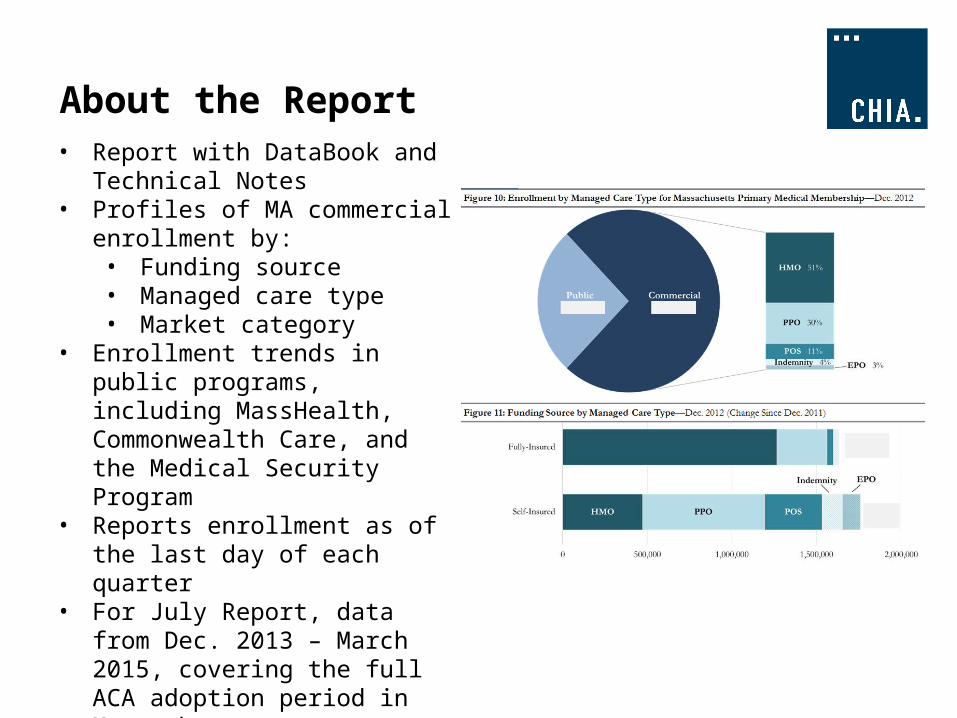
About the Report• Report with DataBook and
Technical Notes• Profiles of MA commercial
enrollment by:• Funding source• Managed care type• Market category
• Enrollment trends in public programs, including MassHealth, Commonwealth Care, and the Medical Security Program
• Reports enrollment as of the last day of each quarter
• For July Report, data from Dec. 2013 – March 2015, covering the full ACA adoption period in Massachusetts
• Released bi-annually starting in July 2015
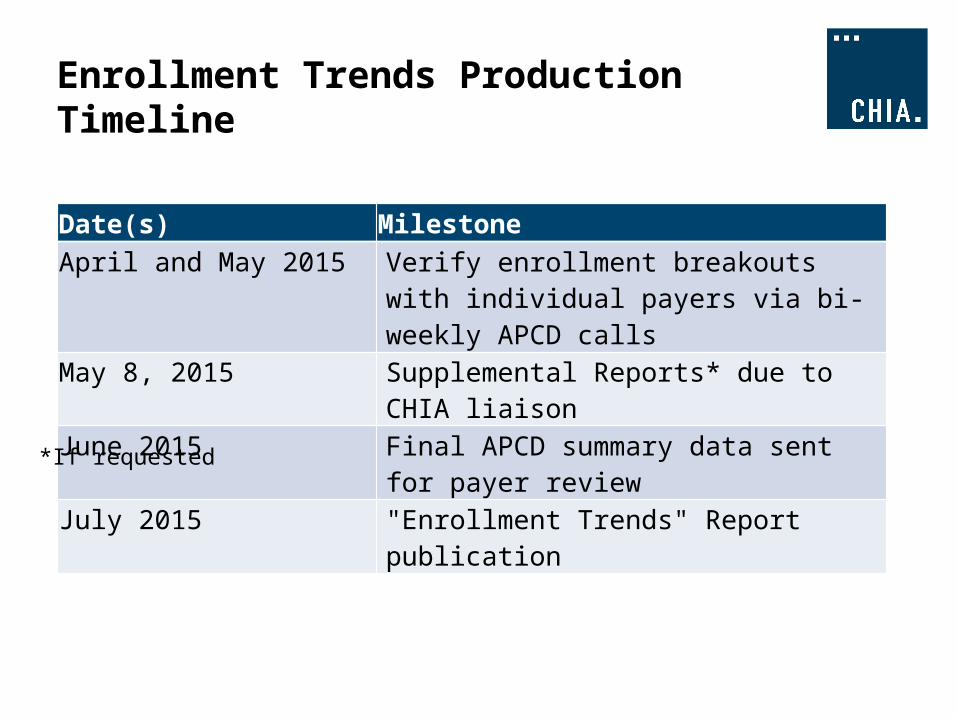
Enrollment Trends Production Timeline
Date(s) MilestoneApril and May 2015 Verify enrollment breakouts with
individual payers via bi-weekly APCD calls
May 8, 2015 Supplemental Reports* due to CHIA liaison
June 2015 Final APCD summary data sent for payer review
July 2015 "Enrollment Trends" Report publication
*If requested
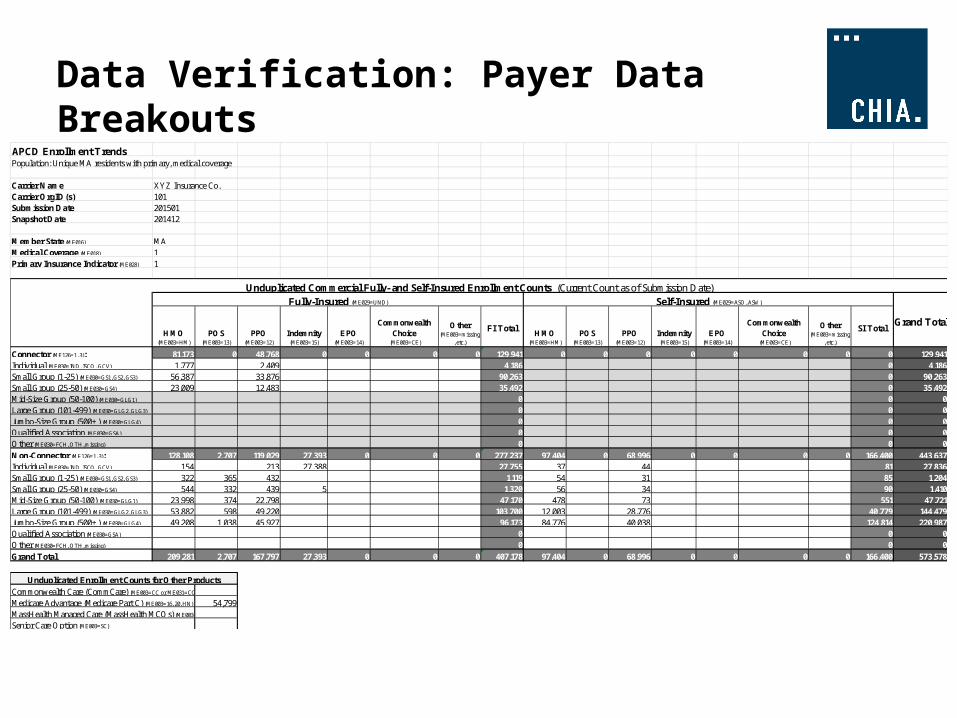
Data Verification: Payer Data BreakoutsAPCD Enrollment TrendsPopulation: Unique MA residents with primary, medical coverage
Carrier Name XYZ Insurance Co.Carrier OrgID(s) 101Submission Date 201501Snapshot Date 201412
Member State (ME016) MAMedical Coverage (ME018) 1Primary Insurance Indicator (ME028) 1
HMO (ME003=HM)
POS (ME003=13)
PPO (ME003=12)
Indemnity (ME003=15)
EPO (ME003=14)
CommonwealthChoice
(ME003=CE)
Other (ME003=missing
, etc.)
FI TotalHMO
(ME003=HM)
POS (ME003=13)
PPO (ME003=12)
Indemnity (ME003=15)
EPO (ME003=14)
CommonwealthChoice
(ME003=CE)
Other (ME003=missing
, etc.)
SI Total
Connector (ME126=1, 3): 81,173 0 48,768 0 0 0 0 129,941 0 0 0 0 0 0 0 0 129,941Individual (ME030=IND, ISCO, GCV) 1,777 2,409 4,186 0 4,186Small Group (1-25) (ME030=GS1, GS2, GS3) 56,387 33,876 90,263 0 90,263Small Group (25-50) (ME030=GS4) 23,009 12,483 35,492 0 35,492Mid-Size Group (50-100) (ME030=GLG1) 0 0 0Large Group (101-499) (ME030=GLG2, GLG3) 0 0 0Jumbo-Size Group (500+) (ME030=GLG4) 0 0 0Qualified Association (ME030=GSA) 0 0 0Other (ME030=FCH, OTH, missing) 0 0 0Non-Connector (ME126=1, 3): 128,108 2,707 119,029 27,393 0 0 0 277,237 97,404 0 68,996 0 0 0 0 166,400 443,637Individual (ME030=IND, ISCO, GCV) 154 213 27,388 27,755 37 44 81 27,836Small Group (1-25) (ME030=GS1, GS2, GS3) 322 365 432 1,119 54 31 85 1,204Small Group (25-50) (ME030=GS4) 544 332 439 5 1,320 56 34 90 1,410Mid-Size Group (50-100) (ME030=GLG1) 23,998 374 22,798 47,170 478 73 551 47,721Large Group (101-499) (ME030=GLG2, GLG3) 53,882 598 49,220 103,700 12,003 28,776 40,779 144,479Jumbo-Size Group (500+) (ME030=GLG4) 49,208 1,038 45,927 96,173 84,776 40,038 124,814 220,987Qualified Association (ME030=GSA) 0 0 0Other (ME030=FCH, OTH, missing) 0 0 0Grand Total 209,281 2,707 167,797 27,393 0 0 0 407,178 97,404 0 68,996 0 0 0 0 166,400 573,578
54,799
Unduplicated Enrollment Counts for Other Products
Unduplicated Commercial Fully- and Self-Insured Enrollment Counts (Current Count as of Submission Date)Fully-Insured (ME029=UND) Self-Insured (ME029=ASO, ASW)
Grand Total
Commonwealth Care (CommCare) (ME003=CC or ME031=CC)
Medicare Advantage (Medicare Part C) (ME003=16, 20, HN)
MassHealth Managed Care (MassHealth MCOs) (ME003=MC, MO)
Senior Care Option (ME003=SC)
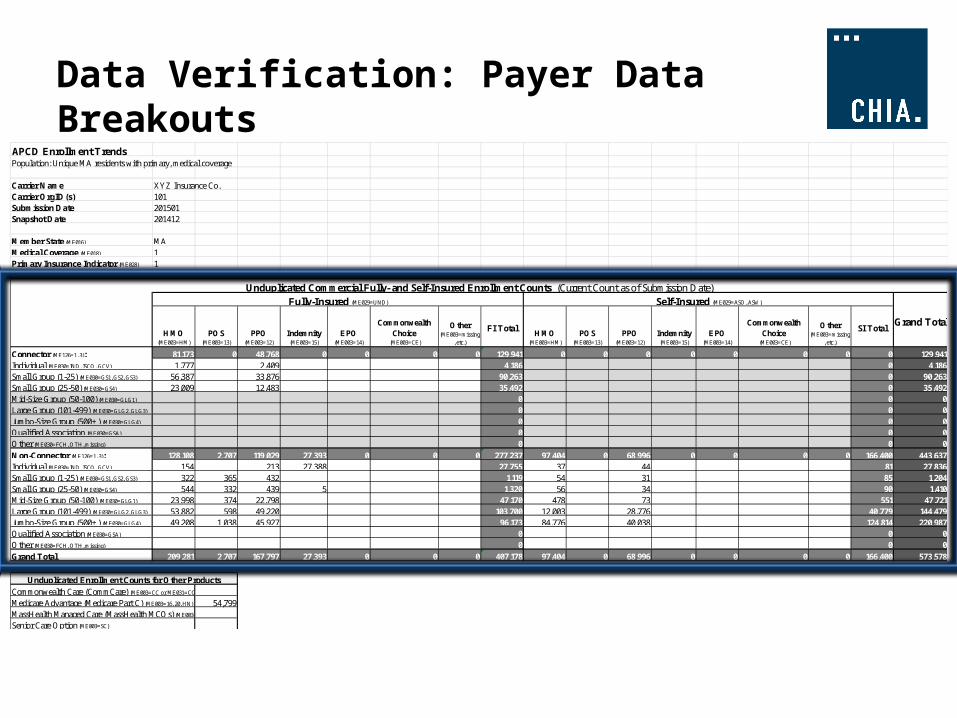

Additional Questions
Are there any other questions at this time?
Contact Information
General Questions:Ashley StormsHealth System Policy AnalystCHIA Health System Performance Analytic [email protected]
Technical Questions: Cathy HoSenior Health Informatics AnalystCHIA Health System Performance Analytic [email protected]

TME, APM, and RP Timelines
Total Medical ExpensesDate(s) Milestone
May 1, 2015 CY 2013 Final TME
May 1, 2015 CY 2014 Preliminary TME (with IBNRs applied)
Alternative Payment MethodsDate(s) Milestone
May 15, 2015 CY 2014 Legacy APM
May 15, 2015 CY 2014 APM Addendum
Relative PriceDate(s) Milestone
June 1, 2015 CY 2014 Hospital Relative Price
June 1, 2015 CY 2013 Physician Group Relative Price
June 1, 2015 CY 2014 Other Provider Relative Price

Next Meetings
May 12, 2015 @ 2:00 pm
June 9, 2015 @ 2:00 pm