Embed Size (px)
Citation preview

Massachusetts Adult Proficiency Tests Technical Manual
Version 21
Stephen G. Sireci, Peter Baldwin, Andrea Martone, April L. Zenisky, Leah Kaira, Wendy Lam, Christine Lewis Shea, Kyung T. Han, Nina Deng, Jill Delton, and Ronald K. Hambleton
Center for Educational Assessment
University of Massachusetts Amherst
Prepared under a contract awarded by the
Massachusetts Department of Elementary and Secondary Education
April 2008
1 Center for Educational Assessment Research Report No. 677. Amherst, MA: University of Massachusetts, Center for Educational Assessment. Funding for this research was provided by the Massachusetts Department of Education under Project/Grant #S39000000700000. The opinions expressed in this report are those of the authors and do not necessarily represent official positions of the Massachusetts Department of Education.
2
Acknowledgements
Like its predecessor, the second edition of this technical manual represents an
extraordinary team effort including tireless work by staff at the Massachusetts Department of Elementary and Secondary Education Office of Adult and Community Learning Services (especially Jane Schwerdtfeger, Anne Serino, Donna Cornellier, and Bob Bickerton), graduate students in the Research and Evaluation Methods Program at UMASS (particularly Jenna Copella, Tie Liang, and Polly Parker), additional faculty and staff at UMASS (Craig Wells and Lisa Keller), staff at the UMASS Center for Educational Software Development (Stephen Battisti, David Hart, Gordon Anderson, Cindy Stein, and Gail Parsloe), and the Office Manager for the Center for Educational Assessment—Kelly Smiaroski. Most of all, we are particularly grateful for the hard work of the hundreds of adult educators and ABE learners throughout Massachusetts who contributed to the development of the MAPT in many important ways and continuously provide feedback and support so that we can best serve the assessment needs of Massachusetts adult education programs.

3
Massachusetts Adult Proficiency Tests Technical Manual: Version 2
Table of Contents
I. INTRODUCTION .................................................................................................................5
CHANGES IN MAPT SINCE FISCAL 2007.....................................................................................6 PURPOSES OF THIS TECHNICAL MANUAL ....................................................................................6
II. DESCRIPTION OF MAPT .................................................................................................8
1. THE PURPOSE OF MAPT .......................................................................................................8 2. DESCRIPTION OF THE TEST SPECIFICATION DEVELOPMENT PROCESS........................................9 3. DESCRIPTION OF THE MAPT FOR MATHEMATICS AND NUMERACY ........................................12 4. DESCRIPTION OF THE MAPT FOR READING...........................................................................18 5. DESCRIPTION OF MULTISTAGE TESTING................................................................................23
III. DESCRIPTION OF TEST CONSTRUCTION PROCEDURES....................................25
1. ITEM REVIEW AND REVISION ...............................................................................................25 2. DEVELOPMENT OF COMPUTERIZED TEST SUPPORTING MATERIAL ..........................................25 3. PILOT TESTING....................................................................................................................26 4. ITEM ANALYSIS ..................................................................................................................35
Characteristics of Operational Item Banks ........................................................................41 5. SENSITIVITY REVIEW ...........................................................................................................48 6. DEVELOPMENT OF MST MODULES AND PANELS ..................................................................51 7. MST DESIGN: ROUTING LEARNERS ACROSS STAGES...........................................................52
IV. DEVELOPING THE MAPT SCORE SCALE ...............................................................55
1. ITEM RESPONSE THEORY (IRT) CALIBRATION ......................................................................55 2. PLACING FY07 ITEM PARAMETER ESTIMATES ON THE FY06 SCALE ......................................56
Refreshing the MAPT Item Banks ......................................................................................56 3. ESTABLISHING THE MAPT SCORE SCALE .............................................................................57
V. STANDARD SETTING: ESTABLISHING THE NRS EDUCATIONAL FUNCTIONING LEVELS......................................................................................................59
1. STANDARD SETTING METHODS............................................................................................61 2. VALIDITY EVIDENCE FOR STANDARD SETTING......................................................................61 3. 2006 STANDARD SETTING—THE ITEM DESCRIPTOR MATCHING METHOD..............................62
Setting NRS Cut-scores on the MAPT for Mathematics and Numeracy ..............................65 Setting NRS Cut-scores on the MAPT for Reading.............................................................69
4. 2007 READING STANDARD SETTING STUDY—THE MODIFIED ANGOFF METHOD ....................73 Description of standard setting task...................................................................................74 Computing cut scores ........................................................................................................75
VI. MEASUREMENT PRECISION ......................................................................................78
1. TEST INFORMATION............................................................................................................78 2. CONDITIONAL STANDARD ERROR OF ESTIMATION ................................................................82 3. DECISION CONSISTENCY AND DECISION ACCURACY..............................................................86

4
VII. VALIDITY.......................................................................................................................91
1. UNDERSTANDING VALIDITY AND VALIDATION ......................................................................91 2. VALIDITY EVIDENCE BASED ON TEST CONTENT ...................................................................94
MAPT Content Validity Studies .........................................................................................94 MAPT for Math Alignment Study.....................................................................................107 MAPT for Math Content Representation Study ................................................................111
3. VALIDITY EVIDENCE BASED ON INTERNAL STRUCTURE.......................................................114 4. VALIDITY EVIDENCE BASED ON RELATIONS TO OTHER VARIABLES .....................................117 5. VALIDITY EVIDENCE BASED ON RESPONSE PROCESSES.......................................................119 6. VALIDITY EVIDENCE SUPPORTING EVALUATION OF EDUCATIONAL GAIN ..............................124 7. VALIDITY EVIDENCE BASED ON CONSEQUENCES OF TESTING..............................................132 8. OTHER VALIDITY EVIDENCE ..............................................................................................135 9. TEST SECURITY.................................................................................................................137 10. MAPT TEST ACCOMMODATIONS.....................................................................................138
VIII. INTERPRETING MAPT TEST SCORES .................................................................140
IX. LOOKING FORWARD: NEXT STEPS FOR THE MAPT ........................................143
REFERENCES......................................................................................................................145
APPENDICES .......................................................................................................................153
APPENDIX A........................................................................................................................153
LIST OF CENTER FOR EDUCATIONAL ASSESSMENT RESEARCH REPORTS RELATED TO MAPT....153
APPENDIX B ........................................................................................................................155
LISTS OF MAPT COMMITTEE MEMBERS................................................................................155
APPENDIX C........................................................................................................................159
LINKS TO ADDITIONAL RESOURCES........................................................................................159
APPENDIX D........................................................................................................................160
EXPANDED NRS EFL DESCRIPTIONS.....................................................................................160
APPENDIX E ........................................................................................................................167
MAPT TEST ADMINISTRATIONS BY WEEK: FISCAL 2007........................................................167

5
I. Introduction
Since January 2003, the Center for Educational Assessment at the University of Massachusetts Amherst (UMASS), under a contract awarded by the Massachusetts Department of Elementary and Secondary Education, has worked closely with the Department’s Office of Adult and Community Learning Services (ACLS) to develop achievement tests in math and reading that are appropriate for adult learners in Massachusetts. Our collaborative vision in creating these tests involved ensuring the tests are (a) aligned to the National Reporting System’s (NRS) Educational Functioning Levels (EFLs), (b) aligned with the curriculum frameworks established by ACLS and the adult basic education (ABE) community in Massachusetts, (c) sensitive enough to measure gain across the EFLs within the NRS, (d) consistent with the instruction in ABE classrooms as directed by these frameworks, and (e) developed with comprehensive input from teachers and administrators from the ABE community in Massachusetts.
Early on in this collaboration we realized that measuring ABE learners’ gains required a highly specialized test design. Given that ABE learners span a wide range of proficiency and typically are unable to take classes full-time, the testing system would need to measure progress along a wide spectrum of achievement and would need to be sensitive to small, but meaningful, educational gains. These two needs are best met by adaptive test designs that adjust the difficulty of an exam according to how well learners perform while taking the exam (Hambleton, Zaal, & Pieters, 1991; Sands, Waters, & McBride, 1997; Sireci, 2004; Wainer, 2000). The decision to use an adaptive test administration design is consistent with the recommendations from a national panel of experts convened by the National Academy of Sciences to address issues in ABE assessment (Mislevy & Knowles, 2002). The end results of our collaborative endeavor are the Massachusetts Adult Proficiency Test for Mathematics and Numeracy and the Massachusetts Adult Proficiency Test for Reading. To develop these tests, we convened groups of ABE teachers and administrators who are experts in ABE mathematics or reading instruction to help us create test specifications congruent with Massachusetts ABE curriculum frameworks, and that could be aligned with the NRS EFLs. In addition, we trained over 200 Massachusetts ABE teachers and staff to write test items in accordance with accepted principles of item writing (e.g., Downing & Haladyna, 1997; Haladyna, 1994; Haladyna & Downing, 1989). Expert staff and teachers also helped us review items and set the cut-scores on the MAPT that correspond to the EFLs (as dictated in the National Reporting System for Adult Basic Education). We also designed a sophisticated multistage adaptive testing system to tailor the administration of the MAPT to each learner and to maximize the precision of our estimates of their achievement levels and educational gains. To deliver these exams, we collaborated with the Center for Educational Software Development at UMASS. We are delighted that ABE learners in Massachusetts are currently taking computerized math and reading tests over the Internet that are tied to Massachusetts ABE curriculum frameworks, developed in part by their teachers, and targeted to their proficiency levels. The remaining sections in this manual describe the complex nature of the MAPT and the procedures used to develop and evaluate these tests. This manual represents the second compendium of

6
technical information on the MAPT and is a substantial update to its predecessor which was published in November 2006, shortly after the tests first became operational (Sireci et al. 2006). In addition to the technical manuals, we have produced numerous research reports on the MAPT, many of which are cited in this manual, and all of which are available upon request from the Center for Educational Assessment (CEA) at UMASS.
Changes in MAPT since Fiscal 2007 Although the MAPT are just in their second year of operational use, several important improvements have occurred since the last Technical Manual was written. These changes include
• Enhanced item banks with more operational items in both Math and Reading • New test specifications and items developed for Math to measure the proficiencies of
learners at the High Adult Secondary Educational Functioning Level • New test specifications and items developed for Reading to measure the proficiencies of
learners at the Low Adult and High Adult Secondary Educational Functioning Levels • New item response theory scaling procedures to best characterize the statistical
functioning of each item • A new multistage test design, increasing the number of stages from 3 to 6 • Enhanced rules for routing learners from one stage to the next based on item response
theory • Elimination of routing rules that limited learners from moving to only adjacent proficiency
levels as the test progressed • Embedded, unscored items into the operational tests to statistically evaluate items for
future use • New psychometric analyses pertaining to the reliability and validity of MAPT scores based
on data from adult education learners taking the tests under operational conditions
Many of these improvements are described in this manual and references to other reports are provided where necessary. In addition, a listing of 24 research reports pertaining to the MAPT is presented in Appendix A
Purposes of this Technical Manual
Proper test score use and interpretation requires a firm understanding of the capabilities and limitations of a testing program. As described in the Standards for Educational and Psychological Testing (American Educational Research Association (AERA), American Psychological Association, & National Council on Measurement in Education, 1999), “The provision of supporting documents for tests is the primary means by which test developers, publishers, and distributors communicate with test users” (p. 67). The purpose of this Technical Manual is to inform all current and potential users of the MAPT in math and reading of (a) the purpose of the tests and their intended uses; (b) the content of the tests; (c) the processes used to develop, validate, and set standards on the tests, (d) the processes used to ensure assessment equity across diverse learners; (e) the technical characteristics of the test such as measurement

7
precision, score scale characteristics, and multistage test administration design; and (f) how to properly interpret the test scores. The information in this manual should also be useful to technical reviewers for the NRS who will evaluate the MAPT for approval within the NRS. Additional information regarding test administration and other policies related to assessing the proficiencies of adult learners in Massachusetts can be found on the ACLS web site (http://www.doe.mass.edu/acls/assessment). That web site contains links to practice test and other information regarding the MAPT, as well as the Assessment Policies and Procedures Manual. Technical reports describing specific test development features or MAPT validation studies are also available from the CEA. A current listing of these reports is presented in Appendix A.
This Technical Manual is intended to be informative to several audiences; however, some
sections may require familiarity with statistics and other aspects of psychometrics. The types of professionals who may be interested in the material in this manual include ABE teachers, administrators, and staff; representatives from the US Department of Education and other organizations interested in evaluating the technical merits of the MAPT; representatives from ABE programs in other states who want to understand the strengths and limitations of MAPT; and members of the psychometric and educational research communities who are interested in test evaluation and computer-based testing.
The MAPT represents an evolution in testing and so it is likely to be of interest to many
researchers studying educational assessment. The multistage adaptive nature of the test, the linking of the score scale to the NRS standards (EFLs), the alignment of the tests to the state frameworks, and the explicit recruitment and inclusion of teachers in the test development and evaluation processes are relatively unique features of an educational assessment program. For this reason, we have tried to be as comprehensive as possible in documenting all processes used in the development and validation of these tests, as well as the rationales behind our decisions.
Although this manual represents a comprehensive description of the technical qualities and
features of the MAPT, these tests are not intended to remain static, and the process of test validation is ongoing. We expect the MAPT to evolve and improve as we continue to monitor its functioning, and as we continue to conduct validation research.

8
II. Description of MAPT
1. The Purpose of MAPT There are many assessment needs in ABE. These needs include placement of learners into appropriate instructional programs, measuring learners’ educational gains over time, and diagnosing their strengths and weaknesses in specific subject areas. Another important need is for accountability. The Massachusetts Department of Elementary and Secondary Education, which funds ABE programs in the Commonwealth, needs to evaluate programs with respect to the degree to which they are helping learners meet their educational goals according to the Massachusetts ABE Curriculum Frameworks. In addition to accountability at the state level, there is also accountability at the Federal level, because Massachusetts receives federal funding for its ABE programs. The US Department of Education (DOE)’s Office of Vocational and Adult Education (OVAE) established the National Reporting System (NRS) for Adult Basic Education, which requires states to measure ABE learners’ educational gains as a core outcome measure of program effectiveness (see http://www.nrsweb.org/). All states receiving funds from OVAE must comply with the NRS requirements. These federal and state accountability demands were the primary factors motivating development of the MAPT. The purposes of the MAPT are to measure ABE learners’ knowledge and skills in math and reading so that their progress in meeting educational goals can be evaluated. The MAPT is designed to measure learners’ educational gains for the purposes of state monitoring and accountability under the NRS. Learners’ MAPT scores and score gains can be aggregated to provide meaningful summative measures of program effectiveness. The specific knowledge and skills measured by MAPT come from the Massachusetts ABE curriculum frameworks and are described in detail in Chapter III of this manual. At this juncture, the MAPT assessments are not designed for diagnosing learners’ specific strengths and weaknesses within each subject area. Diagnostic evaluation should be based on more than MAPT scores, however MAPT scores may be useful as one piece of information in a more comprehensive assessment of learners’ strengths and weaknesses that should include classroom assessments, homework assignments, classroom observation, and performance on the MAPT practice items. MAPT assessments are also not designed for placing students into instructional programs. As described in the Assessment Policies and Procedures Manual (http://www.doe.mass.edu/acls/assessment/), students should be in instructional programs for at least two weeks before they are pre-tested with the MAPT.

9
2. Description of the Test Specification Development Process A primary factor in deciding to develop assessments specifically for ABE learners in Massachusetts was a desire to link assessments with the Massachusetts ABE curriculum frameworks developed by the Department of Elementary and Secondary Education. Prior to commissioning test development, the Massachusetts Department of Elementary and Secondary Education assembled a Performance Accountability Working Group that comprehensively studied available assessments for ABE learners. This Group evaluated the overlap of several national tests (ABLE, AMES, CASAS, and TABE) with the Massachusetts frameworks and concluded
The commercially available assessment that came closest to alignment with the ELA and Math Curriculum Framework standards was the TABE…Unfortunately, “closest” still only represents a 56% correlation of the TABE’s test items with learning standards in the math framework and even less for alignment with the English Language Arts standards...the TABE is also limited in the degree to which it meets the PAWG’s third overriding goal as stated earlier - assessments must provide useful information to teachers and students. These are three of the reasons why the TABE is not recommended as a long-term solution for assessing ABE Reading, Writing and Math. (Massachusetts Adult Basic Education Performance Accountability Working Group, 2002, p. 6)
To ensure the MAPT would be aligned with the curriculum frameworks and to instruction in ABE classrooms, UMASS and ACLS (with input from the System for Adult Basic Education Support, SABES) worked together to assemble test development specification committees. Separate committees were assembled for the MAPT for Mathematics and Numeracy and for the MAPT for Reading. The MAPT for Mathematics and Numeracy Test Specifications Development Committee consisted of five leaders in ABE mathematics instruction in Massachusetts, a senior staff person from ACLS, and four representatives from UMASS (see Appendix B for committee membership; see Appendix C for Internet links to additional assessment resources related to the MAPT). The 10-member MAPT for Reading Test Specifications Development Committee consisted of four leaders in ABE reading instruction in Massachusetts, one expert in educational psychology with a concentration in reading, a senior staff person from ACLS, and four representatives from UMASS (see Appendix B for committee membership).
Each committee was sent materials in advance of the meeting describing the purpose of the Committee (to develop test specifications aligned with the curriculum frameworks) and two sets of potential test specifications (see Baldwin & Sireci, 2003 for Math and Valle & Sireci, 2003 for Reading). Each committee met for a full day and had several follow-up conference calls and multiple rounds of correspondence via e-mail. At the full-day meeting, each committee was oriented to the purposes of the forthcoming tests and asked to respond to a set of specific questions designed to facilitate the test specification development process. Both committees met in December 2003. Each committee produced a final report containing the test specifications that governed the item and test development processes (see Sireci, Baldwin et al., 2004 for the Math report and Sireci, Li et al., 2004, for the Reading report).

10
Deriving test specifications from the ABE curriculum frameworks was a first step in
fostering test-curriculum alignment. However, an important aspect of such alignment is the degree to which the actual test items reflect tasks on which students work in the classroom. To maximize the degree to which the test items would reflect instructional practice, an explicit goal of test development was to train teachers to write items for the new tests. This strategy encouraged teachers to be part of the test development process so that they could take some “ownership” of the new tests and not feel like these tests were being “forced” on them from the outside.
Asking teachers to write items for the new test is not straightforward for at least two
reasons. First, teachers are not trained in writing the types of items appropriate for large-scale assessment, such as multiple-choice items (American Federation of Teachers, National Council on Measurement in Education, & National Education Association, 1990), and second, it takes time to write quality test items—time most teachers do not have. To address these obstacles, we held a series of item writing workshops across the state from March 2004 through November 2007. These workshops informed teachers of the characteristics of quality educational assessments (e.g., content validity) and of the appropriate uses of test scores. The bulk of the workshops focused on (a) reviewing guidelines for writing multiple-choice items (e.g., Haladyna & Downing, 1989) (b) giving teachers opportunities to practice item writing, and (c) providing feedback to teachers on the items they wrote. We also offered a two-week, full-time test construction graduate course at the University of Massachusetts in August 2004 in which 14 ABE teachers/administrators participated.
Over 200 ABE teachers and administrators were trained to write items targeted to the test
specifications (and to specific objectives within the curriculum frameworks). These activities led to the production of over 2,000 test items that made up the initial pool of potential MAPT items. It also helped empower the teachers within the MAPT assessment program and made them feel part of the assessment team, and ensured that the test items would reflect the instructional needs of ABE learners in Massachusetts as much as possible
As the item pool for each test was created, item review committees were assembled to
review items for content quality (degree of match to intended objective, technical accuracy, appropriateness for adult learners, clarity, etc.). The review committees also rated items to determine how well the item measured the objective to which it was matched. The reviewers used a scale of 1-6, with 6 being exemplary, and only items rated a 4 or above were considered for pilot testing. Items were also reviewed for psychometric quality by UMASS staff. Items were edited and then subsets of items were selected for pilot testing. Further details regarding item development, review, revision, and pilot testing are described in Chapter III. Following pilot testing, the statistical functioning of the items was evaluated and the items considered to be most appropriate for operational use were selected. These items then underwent sensitivity (item bias) review, content validity review, and screening for differential item functioning (see Chapters III and VII for information on the sensitivity and content validity reviews, respectively).
The end result of the item development, revision, and review processes were pools of

11
items considered most appropriate for assembling the operational multistage tests. After the operational tests were developed, standard setting studies were conducted to determine the most appropriate cut-scores on the MAPT to signify the Educational Functioning Levels established by the NRS (see Chapter V).
The process of developing the MAPT, from the development of test specifications to
development of the operational tests and standard setting, spanned more than three years. From across the Commonwealth, literally hundreds of people wrote, edited, or reviewed items, or provided valuable input in some other way. Figure II.1 presents an illustration of the test development process. Each of the steps in Figure II.1 is explained in one or more sections of this manual. It should also be noted that refinements to the MAPT testing program are ongoing and so Figure II.1 illustrates the development process, but not the continuation and improvement of MAPT, which is dynamic. Research on the MAPT and development of new items continues to this day.
Figure II.1
Illustration of MAPT Test Development Process
Incorporating Universal Test Design Principles The MAPT assessments are designed for all types of ABE learners, regardless of any disabling conditions they may have. For this reason, the principles of Universal Test Design (UTD) were used throughout the test development process. UTD involves developing tests as flexibly as possible to minimize the need to provide accommodations to the test administration, and also flexible enough so that accommodations can be provided for any learners who may need them (see Thompson & Thurlow, 2002, or Thompson, Thurlow, & Malouf, 2004 for more information regarding UTD). Examples of how UTD principles governed MAPT development include the use of clear and simple language in developing items, clear definitions of the construct

12
measured, legible presentation of items, extremely generous time limits for all learners (essentially unlimited time) and the opportunity to restart the test at a subsequent date (if necessary), simple instructions for taking the test, and amenability to accommodations. A discussion of the MAPT accommodations suggested for learners with disabilities is presented in Chapter VII.
3. Description of the MAPT for Mathematics and Numeracy
The first step in developing the MAPT was developing the specifications describing the “construct” of Mathematics and Numeracy. In addition to the Massachusetts Adult Basic Education Curriculum Framework for Mathematics and Numeracy (ACLS, 2005b), the Educational Functioning Level descriptions from the National Reporting System (Division of Adult Education and Literacy (DAEL), 2006) were also considered. It was decided to operationally define Mathematics and Numeracy for the MAPT using two dimensions. The first dimension is a content strand dimension comprising the four content strands contained in the MA ABE Curriculum Framework for Mathematics and Numeracy. These strands are Number Sense; Patterns, Functions, and Algebra; Statistics and Probability; and Geometry and Measurement. The second dimension is a cognitive (reasoning) dimension containing three levels derived from Bloom’s (1956) taxonomy. The original Bloom’s taxonomy contained six levels, but for the MAPT for Mathematics and Numeracy, the two lowest levels were combined into one category and the three highest levels were combined into another. This collapsing of categories is consistent with contemporary theories regarding how cognitive skill dimensions should be used in test specifications (Linn & Gronlund, 2000; Popham, 1992) because it is hard to distinguish among the original six levels when classifying test items. The three cognitive skill levels in the MAPT for Mathematics and Numeracy are Knowledge and Comprehension; Application; and Analysis, Synthesis, and Evaluation. In addition to the two-dimensional framework for defining the MAPT for Mathematics and Numeracy, the test development framework needed to address the different NRS Educational Functioning Levels. The Massachusetts Adult Basic Education Curriculum Framework for Mathematics and Numeracy (ACLS, 2005b) describes six Learning Levels that distinguish the different performance levels present in the ABE student population. These levels are mapped to the NRS Education Functioning Levels. The test specifications that governed development of this test stipulated specific percentages of test items in each of the intersections of content strands and cognitive levels, but these percentages were set within each Educational Functioning Level.
MAPT for Mathematics and Numeracy Test Specifications As described in Sireci, Baldwin et al. (2004), the Test Specifications Development
Committee used the content strand-by-cognitive level matrix to suggest the relative emphases of these strands and levels across the different Learner Levels. It was decided (at the time) that learners at the Beginning ABE Literacy level would not be able to take a test on the computer because learners at that level are working on literacy skills that are necessary for taking a text-based test. Therefore, it was decided that test specifications for the current edition of the MAPT for Mathematics and Numeracy be designed for ABE learners at the NRS Beginning Basic through High Adult Secondary levels.
13
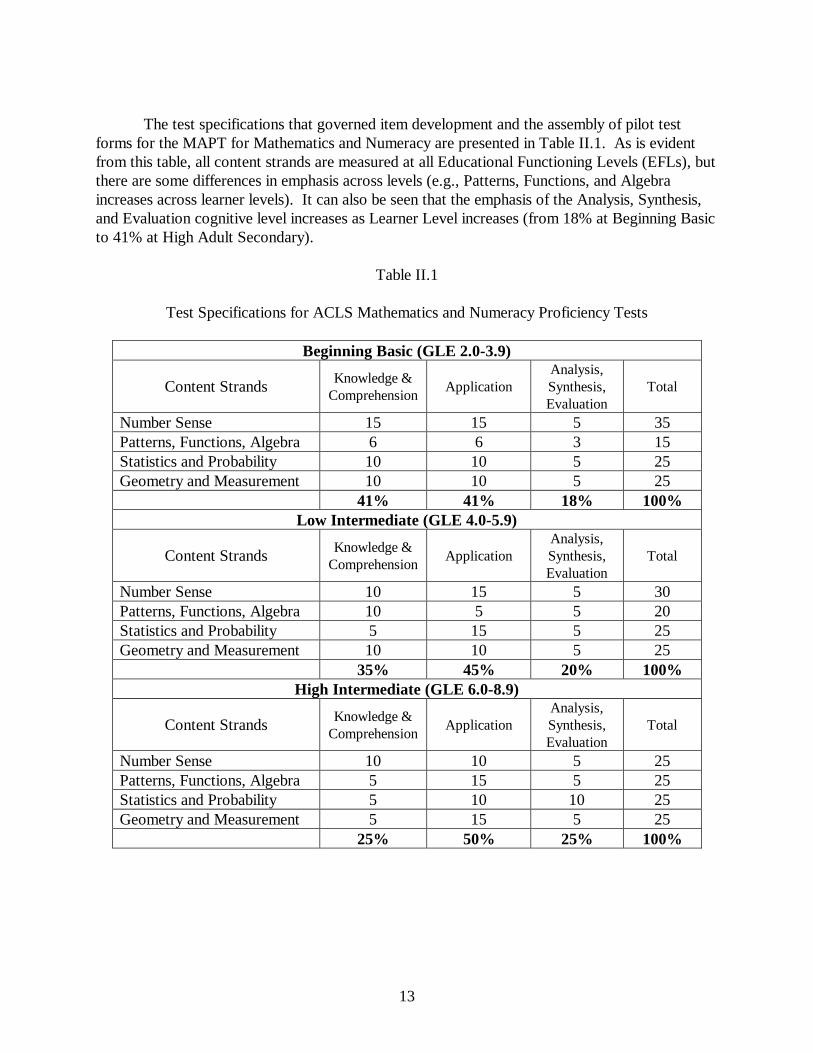
The test specifications that governed item development and the assembly of pilot test
forms for the MAPT for Mathematics and Numeracy are presented in Table II.1. As is evident from this table, all content strands are measured at all Educational Functioning Levels (EFLs), but there are some differences in emphasis across levels (e.g., Patterns, Functions, and Algebra increases across learner levels). It can also be seen that the emphasis of the Analysis, Synthesis, and Evaluation cognitive level increases as Learner Level increases (from 18% at Beginning Basic to 41% at High Adult Secondary).
Table II.1
Test Specifications for ACLS Mathematics and Numeracy Proficiency Tests
Beginning Basic (GLE 2.0-3.9)
Content Strands Knowledge &
Comprehension Application
Analysis, Synthesis, Evaluation
Total
Number Sense 15 15 5 35 Patterns, Functions, Algebra 6 6 3 15 Statistics and Probability 10 10 5 25 Geometry and Measurement 10 10 5 25 41% 41% 18% 100%
Low Intermediate (GLE 4.0-5.9)
Content Strands Knowledge &
Comprehension Application
Analysis, Synthesis, Evaluation
Total
Number Sense 10 15 5 30 Patterns, Functions, Algebra 10 5 5 20 Statistics and Probability 5 15 5 25 Geometry and Measurement 10 10 5 25 35% 45% 20% 100%
High Intermediate (GLE 6.0-8.9)
Content Strands Knowledge &
Comprehension Application
Analysis, Synthesis, Evaluation
Total
Number Sense 10 10 5 25 Patterns, Functions, Algebra 5 15 5 25 Statistics and Probability 5 10 10 25 Geometry and Measurement 5 15 5 25 25% 50% 25% 100%

14
Table II.1 (continued)
Test Specifications for ACLS Mathematics and Numeracy Proficiency Tests
Low Adult Secondary (GLE 9.0-10.9)
Content Strands Knowledge &
Comprehension Application
Analysis, Synthesis, Evaluation
Total
Number Sense 3 6 6 15 Patterns, Functions, Algebra 5 15 10 30 Statistics and Probability 5 10 15 30 Geometry and Measurement 5 10 10 25 18% 41% 41% 100%
High Adult Secondary (GLE 11.0-12.9)
Content Strands Knowledge &
Comprehension Application
Analysis, Synthesis, Evaluation
Total
Number Sense 3 6 6 15 Patterns, Functions, Algebra 5 15 10 30 Statistics and Probability 5 10 15 30 Geometry and Measurement 5 10 10 25 18% 41% 41% 100% Note: Cell entries represent percentages of test items devoted to each content strand and cognitive level.
Content Strands As mentioned above, the four content strands in the MAPT for Mathematics and Numeracy were taken directly from the Massachusetts Adult Basic Education Curriculum Framework for Mathematics and Numeracy (ACLS, 2005b). The definitions that follow are taken directly from these frameworks, since they were used to guide development of the items for the MAPT for Mathematics and Numeracy.
Number sense
Number Sense is the foundation of numeracy. Sound number sense enables us to interpret and represent the world in which we live. It is evident in all we do, whether in complex examples such as the Gross National Product, basic issues such as the family budget, or as personal as a blood pressure reading. Mathematical intuition grows with a strong basic understanding of numbers and, with that, our ability to do mathematical problem solving.
To be efficient workers or consumers in today's world, adults must have a strongly developed conceptual understanding of arithmetic operations, as well as the procedural knowledge of computation and number facts. They must be able to perceive the idea of place value and be able to read, write, and represent numbers and numerical relationships in a wide

15
variety of ways. Simple paper-and-pencil computation skills are not enough. Adults must be able to make decisions regarding the best method of computation (mental math, paper-and-pencil, or calculator/computer) to use for a particular situation. Knowledge of numbers, operations and computation must include both a well-developed number sense and the ability to use basic mathematics-related technologies.
Number sense promotes accuracy in estimation and flexibility and efficiency in mental math. While calculators and computers are used to do most of the complex computations in today’s world, the ability to estimate is critical for lifelong learners. Adults use informal measurements in life skill activities such as cooking, shopping, buying clothes, or estimating the time required for daily tasks. Estimation is a valuable skill for checking the reasonableness of computation or accuracy in problem solving, and is an aid in timed-test situations such as the GED. It builds on adult experience and knowledge. Good estimators use a variety of strategies and techniques for computational estimation that can be explored and shared by learners.
Patterns, functions, and algebra
Mathematics has been defined as the study of patterns. Learning to recognize, analyze,
describe, and represent patterns and number relationships connects math to the world and helps us to appreciate fully the intrinsic value of such pleasures as poetry, art, music, and science. Math concepts formerly taught only in basic algebra courses are increasingly part of the culture and vocabulary of modern life. Headlines and news reports speak of exponential growth of the national debt, a variable rate mortgage, or a balanced budget, while medical literature uses terms like “HIV-positive,” or “RH-negative.”
Being able to see and use patterns has been identified as a fundamental skill needed for
developing mathematical understanding. The Patterns, Functions, and Algebra strand is positioned after the Number Sense strand because of the importance of building pre-number skills such as patterning which, in turn, enable adult learners to learn multiplication tables and number relationships necessary for efficient and fluent computation skills. The strand also encompasses skills that are necessary for developing concepts in the Statistics and Probability and Geometry and Measurement strands.
Algebra serves as a bridge between arithmetic and more broadly generalized mathematical
situations. These generalizations can be expressed in words, tables and charts, the notation of formulas, and graphs. Life experience has afforded adult basic education learners with a broad base of real-world ties that can be readily linked to the concepts of equation, function, variable, and graph. From baby formulas to chemical formulas, algebra offers a succinct way to define real-world situations that can aid adults in the home and in the workplace.
Algebra impacts the competency of workers, parents and citizens, and algebraic thinking
skills are crucial if adults are to compete in the global economy. Workplace skills requiring competencies in “information,” “systems,” and “technology” stress the need for organizing, interpreting and communicating information and employing computers as a tool for those tasks, as well as the ability to “discover a rule or principle underlying the relationship between two or more

16
objects and apply it in solving a problem.” Identifying and expressing pattern, relation and function are the algebraic skills imbedded within these competencies.
Statistics and probability
The Statistics and Probability strand links numeracy and literacy learning. Numbers,
logical reasoning, and texts interweave to describe phenomena visually, numerically and verbally in what we term data, which is the heart of this strand.
Data are wide-ranging and touch on many areas of academic study and inform us about our world. For instance, we learn about preferences, predilections and group characteristics when we read and interpret data. We learn about the power of evidence as we develop the skills to make statements and evaluate arguments based on data. We learn the power of the question and the framer of the question when we collect and represent data, and we learn that sometimes true, sometimes false, pictures are created when we compress data into statistics. Data are a powerful descriptive tool.
So powerful are data that agencies of authority often use them to generate, promote and, sometimes, evaluate decisions. Citizens, therefore, must understand the ways of data to exercise their collective and individual intelligence by responding to the expanding presence of this dense expression of information.
The learning standards in the Statistics and Probability strand provide adult learners with the tools for dealing with data.
Geometry and measurement
Geometry and measurement help us represent in an orderly fashion what we see in our world. Whether we are cooking or cartooning, shopping or shipping, painting a canvas or a wall, designing an addition for a house or a play yard for preschool, we continually bump up against these mathematical organizers. Lifelong learners should know and understand these interconnected and symbiotic mathematical domains.
Adult learners who attend basic mathematics classes at any level share a wealth of pragmatic experience surrounding geometric and spatial concepts. They have probably built a bookcase, laid out a garden, applied wallpaper or tiled a floor, all the while discovering informally the rules which formally govern the study of geometry itself.
Geometry and measurement often spark a renewed interest in mathematics for those students who have been turned off for some reason or heretofore have felt unsuccessful with mathematics learning. Investigating problems that involve geometry and measurement broadens all students' mathematical understanding and engages them as they explore mathematical ideas.

17
Cognitive Levels As mentioned earlier, MAPT for Mathematics and Numeracy items were written to and classified according to three cognitive levels—Knowledge and Comprehension; Application; and Analysis, Synthesis, and Evaluation. This dimension was included in specifying the content of the test to ensure that items were written to measure skills necessary for the different purposes for which math is used. These three levels represent a simplification of Bloom’s (1956) six levels of cognitive complexity. The Test Specifications Development Committee believed it was important to separate the lower-level knowledge and comprehension areas from the higher cognitive levels, and they also believed it was important to distinguish application of math knowledge and comprehension from the areas of analysis, synthesis, and evaluation. Brief descriptions of the three cognitive levels used on the MAPT follow.
Knowledge and comprehension
Knowledge refers to remembering material that was previously learned, such as specific facts, events, or principles. Examples include remembering mathematical terms and definitions or identifying terms, symbols, equations, etc. Comprehension refers to the ability to comprehend the meaning of material. Comprehension goes beyond mere memorization and is signified by an understanding of a concept. Being able to explain, translate, or summarize material are ways in which comprehension is demonstrated. The knowledge/comprehension level is characterized by both recognition of a concept and understanding the concept.
Application
Application refers to the ability to use learned material in new, but specific (concrete) situations. This cognitive level is invoked in applying rules, methods, concepts, principles, and other learned material in a realistic context. Examples include working with data in realistic context (calculating change, sales tax, discounts, etc.) and using a formula to solve a problem.
Analysis, synthesis, and evaluation
Analysis refers to the ability to break material down into its component parts to understand its underlying structure and the relationships between the components. Synthesis refers to the ability to combine parts to form a new whole, which may involve creation of a product from a variety of elements. Evaluation refers to the ability to make a judgment about a situation for a given purpose or to accomplish a goal. The analysis/synthesis/evaluation cognitive level is characterized by maneuvering through complex stimuli to fully understand a problem, and using several aspects of the situation to solve the problem. This cognitive level is distinguished from application in that it typically involves situations with more than one variable, or multiple pieces of information that must be understood, deciphered, and brought back together in a logical way.

18
The Dynamic Interplay between ABE Curriculum Framework for Mathematics and Numeracy and Test Specifications
Early in the item writing process UMASS staff engaged in a discussion with ABE teachers
who were writing items and ACLS staff regarding the clarity of the objectives specified under each content strand in the Mathematics and Numeracy Curriculum Frameworks. While the content strands were judged appropriate, some specific objectives within the different strands and at different levels were either redundant or missing. UMASS worked with three ABE Math Curriculum Experts to review and revise the frameworks. Details of the changes to the curriculum frameworks can be found in Refinements to ABE Mathematics Standards for Assessment Purposes (Martone, Goodridge, et al., 2004). The result of this revision was a cleaner progression of objectives across levels and within strands. All subsequent math item writing activities were targeted to the revised objectives.
4. Description of the MAPT for Reading
Like development of test specifications for the MAPT for Mathematics and Numeracy, the
development of test specifications for the MAPT for Reading followed the Massachusetts Adult Basic Education Curriculum Framework for the English Language Arts (ACLS, 2005a) and the NRS Educational Functioning Level descriptions (DAEL, 2006). The “construct” of Reading was initially defined for the MAPT using two dimensions. One dimension pertained to reading skill areas and the other dimension pertained to different purposes for reading. The skill dimension consists of three areas: Word Recognition, Vocabulary and Meaning, and Comprehension. The Purposes for Reading dimension consists of four areas. The first area is reading to “Acquire Basic Word Analysis Skills,” which is most relevant to the lower learner levels (GLE 0-3.9), as it is considered a pre-requisite to reading. The remaining areas in the Purposes dimension are Reading for Literary Experience, Reading to Gain Information, and Reading to Perform a Task. The Purposes for Reading dimension was seen as capturing the spirit of the reading skills articulated in the Massachusetts ABE Curriculum Frameworks and Equipped for the Future (Curry, et al., 1996; Stein, 2000).
In addition to the two-dimensional framework for defining the MAPT for Reading, the
test development framework needed to address the different Educational Functioning Levels. The Massachusetts Adult Basic Education Curriculum Framework for the English Language Arts (ACLS, 2005a) describes six Learning Levels that distinguish the different performance levels present in the ABE student population. These levels map to the NRS Education Functioning Levels for reading and range from Beginning ABE Literacy (Initial) to High Adult Secondary (Adept). It was decided at the time that it would be difficult for learners at the Beginning ABE Literacy level to take a reading test on the computer because learners at that level are working on literacy skills that are necessary for taking a text-based test. Furthermore, learners at this level may be the level most vulnerable to existing, but possibly undocumented learning disabilities, which could be made worse by taking a test via computer. Therefore, it was decided at the time that test specifications for the MAPT for Reading targeted Beginning Basic through High Adult Secondary (Levels 2 through 6), and that the Beginning Literacy Level would be tackled afterwards. These specifications are described next. It is important to note, however, that in

19
February 2008 ACLS and CEA began the process of developing a Beginning ABE Literacy level for the MAPT for Reading, which will eventually be integrated into the current MAPT for Reading when completed.
MAPT for Reading Test Specifications
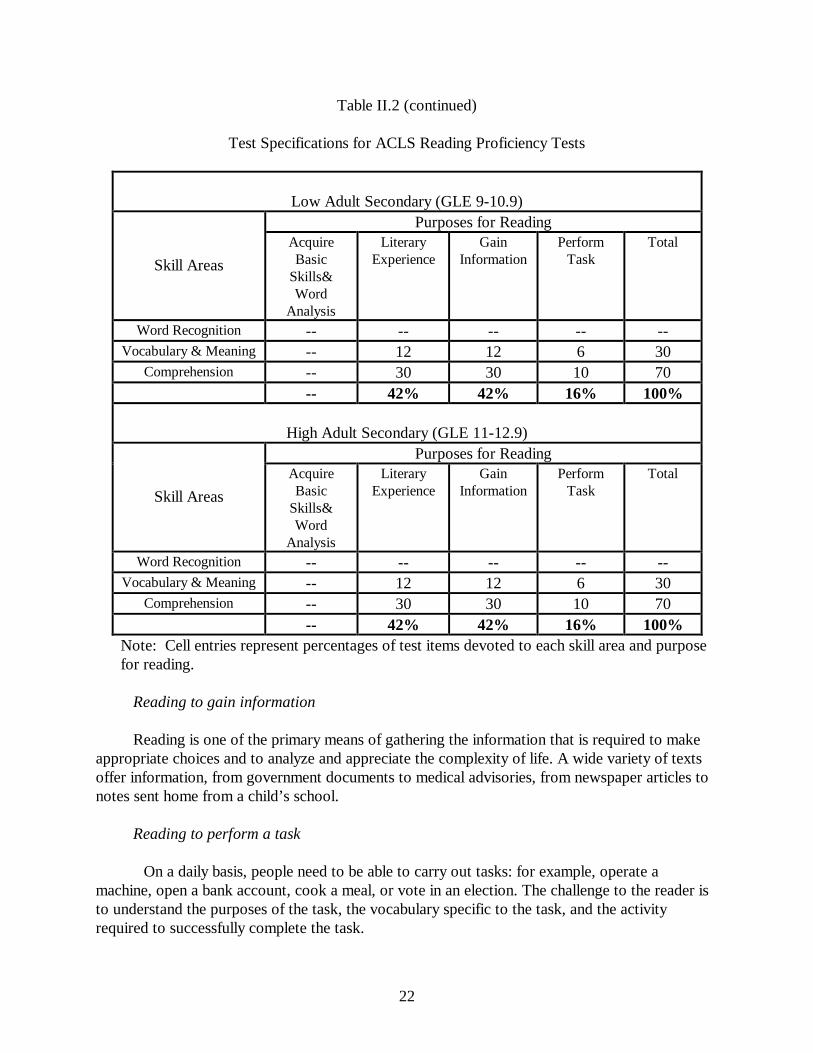
The test specifications that governed item development and the assembly of pilot test
forms for the MAPT for Reading are presented in Table II.22. A comparison of the proportions of test content allocated to the different area-by-purpose cells across test levels indicates that as test level increases, the proportion of the test measuring the purpose “Acquisition of Basic Word Analysis Skills” decreases. At Beginning Basic, 50% of test content is associated with this purpose. At Low Intermediate, this percentage drops to 20%, and at High Intermediate and above it drops to 0%. The same pattern appears for the “Word Recognition” skill area. The purposes “Reading for Literary Experience” and “Reading to Gain Information” increase across test levels, as does the skill area of Comprehension. The changes in test specifications across test level clearly indicate that more advanced skills and more challenging reading purposes are being measured as test level increases. The Committee agreed that these specifications reflect the changing emphasis in these areas across instructional levels in ABE programs. A description of the Skill Areas and Purposes for Reading is presented in the next section.
Skill Areas
As mentioned above, the three skill areas in the MAPT for Reading were developed by the Reading Test Specification Committee (Sireci, Li, et al., 2004). The definitions that follow are based on the guidance provided in that report and were used to guide development of the MAPT items. A detailed listing of the standards within each skill area is in presented in Appendix D.
Word recognition
This skill area involves recognizing controlled words, sight words, and visual cues. Word recognition skills are not comprehension skills. They simply allow the learner to read the word off the page. Examples of MAPT for Reading objectives that fall under this skill area include (a) Identify short vowels with single consonants (one syllable words); (b) Identify compound words; and (c) Apply the rules of syllabication to unfamiliar words from the content areas (social studies, science, and literature) and be able to know what syllable should be accented.
Vocabulary and meaning
2 When the MAPT for Reading was initially developed, test specifications were not developed for the Low Adult and High Adult Secondary levels. During the first year of implementation, it became clear that additional levels needed to be added to appropriately measure students’ proficiencies at these levels. A test specifications review committee was convened in November 2006 and determined the specifications for these new MAPT levels (see Martone, Smith et al. 2006; Sireci, Martone et al., 2007). The current specifications are reported in this manual.

20
This skill area involves the ability to understand word meanings and the ability to infer
word meanings from context. Examples of MAPT for Reading objectives that fall under this skill area include (a) Recognize synonyms, antonyms, homonyms, and homophones (e.g., dear-deer) for identified vocabulary words presented in isolation or within a group of words; (b) Use context clues to determine meaning of unfamiliar words, including increasingly sophisticated multi-syllabic words originating from Latin and Greek prefixes, suffixes, and roots; (c) Identify idioms and their use in passages; and (d) Recognize and comprehend the meaning of moderately complex vocabulary using word, sentence, and paragraph clues to determine meaning.
Comprehension Comprehension refers to the ability to extract meaning from connected discourse that is
read. Examples of MAPT for Reading objectives that fall under this skill area include (a) Locate pertinent information in simple familiar materials (e.g., want ads, job listings, schedules, signs, food packages) including who, what, which, when, where; (b) Distinguish between fact and opinion in a short paragraph; (c) Determine author’s purpose from a variety of written pieces; and (d) Draw conclusions and make inferences based on passages read. Purposes for Reading Reading items were written to and classified according to four purposes for reading: Reading to Acquire Basic Word Analysis Skills, Reading for Literary Experience, Reading to Gain Information, and Reading to Perform a Task. This dimension was included in specifying the content of the test to ensure that items measured skills relevant to adult learners as articulated in Massachusetts ABE Curriculum Frameworks and in Equipped for the Future (Curry, et al., 1996; Stein, 2000). The Test Specifications Development Committee believed it was important to separate the different purposes for reading to ensure a balanced representation of the different purposes for which people read. Brief descriptions of the four purposes for reading used on the MAPT follow. Reading to acquire basic word analysis skills This purpose for reading highlights learners’ ability to develop an understanding of how phonemes, or speech sounds, are connected to print, as well as the ability to decode unfamiliar words.
Reading for literary experience To read for literary experience is to listen to voices not one’s own and to gain access to new experiences and perspectives. The encounter with literature is likely to engage the heart and the senses, as well as the mind. This encounter may be challenging but also offers the possibility of great pleasure.
Table II.2

21
Test Specifications for ACLS Reading Proficiency Tests
Beginning Basic (GLE 2-3.9) Purposes for Reading
Skill Areas
Acquire Basic
Skills& Word
Analysis
Literary Experience
Gain Information
Perform Task
Total
Word Recognition 50 -- -- -- 50 Vocabulary & Meaning -- 10 10 10 30
Comprehension -- 8 7 5 20 50% 18% 17% 15% 100%
Low Intermediate (GLE 4-5.9)
Purposes for Reading
Skill Areas
Acquire Basic
Skills& Word
Analysis
Literary Experience
Gain Information
Perform Task
Total
Word Recognition 20 -- -- -- 20 Vocabulary & Meaning -- 10 10 10 30
Comprehension -- 20 20 10 50 20% 30% 30% 20% 100%
High Intermediate (GLE 6-8.9)
Purposes for Reading
Skill Areas
Acquire Basic
Skills& Word
Analysis
Literary Experience
Gain Information
Perform Task
Total
Word Recognition -- -- -- -- -- Vocabulary & Meaning -- 12 12 6 30
Comprehension -- 30 30 10 70 -- 42% 42% 16% 100%
Note: Cell entries represent percentages of test items devoted to each skill area and purpose for reading.
22
Table II.2 (continued)
Test Specifications for ACLS Reading Proficiency Tests
Low Adult Secondary (GLE 9-10.9)
Purposes for Reading
Skill Areas
Acquire Basic
Skills& Word
Analysis
Literary Experience
Gain Information
Perform Task
Total
Word Recognition -- -- -- -- -- Vocabulary & Meaning -- 12 12 6 30
Comprehension -- 30 30 10 70 -- 42% 42% 16% 100%
High Adult Secondary (GLE 11-12.9)
Purposes for Reading
Skill Areas
Acquire Basic
Skills& Word
Analysis
Literary Experience
Gain Information
Perform Task
Total
Word Recognition -- -- -- -- -- Vocabulary & Meaning -- 12 12 6 30
Comprehension -- 30 30 10 70 -- 42% 42% 16% 100%
Note: Cell entries represent percentages of test items devoted to each skill area and purpose for reading.
Reading to gain information Reading is one of the primary means of gathering the information that is required to make appropriate choices and to analyze and appreciate the complexity of life. A wide variety of texts offer information, from government documents to medical advisories, from newspaper articles to notes sent home from a child’s school.
Reading to perform a task On a daily basis, people need to be able to carry out tasks: for example, operate a machine, open a bank account, cook a meal, or vote in an election. The challenge to the reader is to understand the purposes of the task, the vocabulary specific to the task, and the activity required to successfully complete the task.

23
The Dynamic Interplay Between the ABE Curriculum Framework for English Language Arts and Test Specifications Like the MAPT for Math, the test specifications for the MAPT for Reading are not expected to be static. Based in part on feedback from ABE practitioners, ACLS has been working with reading experts in adult education on providing more clarity to the standards and benchmarks in the framework, and CEA staff and faculty from UMASS have been involved in these efforts (see Appendix B). When the new Frameworks are finalized the test specifications for the MAPT for Reading will be revised to ensure alignment. Should the NRS EFL descriptions for Reading be revised, the specifications for the MAPT for Reading would likewise be revised.
5. Description of Multistage Testing
The National Academy of Sciences commissioned a Committee to investigate assessment needs and issues in adult education. In December 2001, this group, called the Committee for the Workshop on Alternatives for Assessing Adult Education and Literacy Programs (Mislevy & Knowles, 2002), held a national workshop where experts in adult education and psychometrics discussed assessment issues for adult learners3. One of the concluding themes of the workshop was that, given the wide diversity of proficiency among adult education students and their limited time in the classroom, some form of computerized adaptive testing would be beneficial. Computerized adaptive testing (CAT) is a test administration model that uses the computer to select and deliver test items to examinees. The model is called adaptive because the computer selects the items to be administered to a specific examinee based, in part, on the proficiency of the examinee. Unlike many traditional tests where all examinees take a single form of an exam, the computer tailors the exam to each examinee. This tailoring is done by keeping track of an examinee’s performance on each test question and then using this information to select the next item to be administered. Computerized adaptive testing reduces testing time by shortening the length of the test without losing information about examinee proficiency (Bartram & Hambleton, 2006; Wainer, 2000). In fact, for a fixed test length, an adaptively administered test provides more precision about candidate proficiency than a fixed test form.
The statistical model underlying computerized-adaptive testing is item response theory
(IRT). IRT places test items and examinees on a common scale (i.e., the scale that indicates the difficulty of an item is the same scale that is used to assign scores to examinees). There are several attractive features of IRT, including the ability to provide scores on a common scale for examinees who take different items. This feature allows us to place ABE learners of different proficiency levels, who take different tests, on the same (wide) proficiency continuum. By using IRT in a CAT, learners’ proficiency estimates are updated as they progress through the test, and a new item (or set of items) is selected based on the updated estimate. Items that are targeted at a learner’s proficiency provide more information about her/his proficiency than items that are much too easy or much too difficult. This reduction explains why accurate measurement of ABE learners can be accomplished using fewer items than is typically required on a paper-based test
3 Three members of the MAPT development team were involved in this workshop. Bob Bickerton from ACLS was a member of the National Academy of Science’s panel, and Ron Hambleton and Stephen Sireci were invited discussants.
24
such as the TABE. There are several computerized-adaptive testing models (see Hambleton, et al., 1991;
Sands, Waters, & McBride, 1997, and Wainer, 2000, for comprehensive discussions of these models), but most can be described as falling into one of two categories—adaptive at the item level or adaptive at a testlet level. A testlet (sometimes referred to as a module in multistage testing) is a group of items that function together as a “mini-test.” Item-level adaptive models select a new item for each learner after the learner answers an item. If the learner answered the item correctly, a slightly more difficult item is selected. If the learner answered the item incorrectly, a slightly easier item is selected. Adaptivity at the item level is the best way to tailor a test to the performance of the learner, however, item-level adaptive models require very large item pools and large sample sizes for piloting these items. In addition, item-level adaptive testing allows far less control over test content, since an almost infinite number of test “forms” could be administered. Testlet-adaptive models have emerged to address these drawbacks. In a testlet-adaptive model, such as the multistage testing model designed for the MAPT, learners answer a set of several items before the computer scores their performance and selects the next set of items (testlet) to be administered. Like item-level models, if the learner is doing well, s/he will be routed to a testlet at or above the difficulty level of the last testlet administered. If a learner does not do well on the set of items, s/he will be routed to an easier testlet.
Multistage testing (MST) is often viewed as an intermediary step between a test that has a
fixed number of items (such as a paper-and-pencil test) and item-level computerized-adaptive testing (CAT). MST combines the adaptive features of CAT with the opportunity to pre-assemble portions of the tests prior to test administration, which allows for content-balancing and general form integrity to be evaluated and controlled prior to operational administration. Other potential advantages of MST include simplification of the delivery mechanism and tempering the impact of response aberrancy (Jodoin, Zenisky, & Hambleton, 2006; Luecht, 2005; Sireci, 2004).
The specific MST architecture underlying the MAPT is complex and was specifically
designed to meet the needs of adult assessment in Massachusetts. The details of this architecture, including how learners are routed as they progress through the assessment, are provided in Chapter III, which describes the MAPT test construction procedures in considerable detail.

25
III. Description of Test Construction Procedures
The procedure for developing items for the MAPT (i.e., training ABE teachers and staff to write items aligned with the curriculum frameworks) was described in Chapter II. In this chapter, we provide descriptions of how the operational versions of the MAPT were created from these items. The chapter begins with a discussion of the initial item reviews and ends with a description of how the multistage test modules and panels were assembled for both the initial version of the MAPT (fiscal year 2007) and the current version of the MAPT (fiscal year 2008). A description of the pilot tests conducted to perform the initial item calibrations is also provided, as is a description of the item analysis statistics used to evaluate the statistical characteristics of the items, and the sensitivity reviews conducted to promote a more equitable assessment for learners from a variety of backgrounds.
1. Item Review and Revision
All potential MAPT test items went through a multistage review process. Initially, for both the math and reading areas, a content area specialist at UMASS reviewed each item. Items were approved, slightly revised, rewritten or deleted based on the item content and the standard to which it was matched. Prior to pilot testing, ABE specialists in each content area (i.e., independent subject matter experts who were not working for ACLS or UMASS) also reviewed each item. The math ABE Item Review Committee comprised two current math ABE teachers and one person with extensive experience in ABE math standards (see Appendix B). The reading Item Review Committee comprised three current or former ABE teachers and a literacy specialist (see Appendix B). These item reviewers examined how well each item measured the objective to which it was matched. They rated each item on scale of 1-6 with 6 being an exemplary item-objective match. The reviewers also suggested changes to the content of the item and to the cognitive area/purpose for reading areas as needed. Only items rated a 4 or above were considered for pilot testing. The UMASS content area specialists reviewed all comments and suggestions from the ABE reviewers. Based on these comments, some items were deleted, matched to a different standard, or revised. At this stage items were ready to be considered for selection into the pilot test. The content validity studies that were conducted on the items that performed well in the pilot tests are described in Chapter VII. The sensitivity reviews conducted on these items are reported later in this chapter. New items that are written for the MAPT receive the same internal and external reviews before becoming operational.
2. Development of Computerized Test Supporting Material
We considered learners’ unfamiliarity with computers to be a potential source of “construct-irrelevant variance,” which refers to a factor that unnecessarily impedes learners from fully demonstrating their knowledge and skills. Thus, we considered it crucial to provide all learners with an opportunity to become familiar with the basic computer functions needed to answer test questions. A Computer Basics tutorial was developed in collaboration with the Massachusetts Department of Education and several ABE educators. This tutorial is accessible at http://owl.cs.umass.edu/Departments/CtrEdAssess/Tutorial/index.html. ABE teachers and learners can use this tutorial as many times as they like.

26
The Computer Basics tutorial contains two portions. The first section is an overview of
basic computer functionality including using a mouse, clicking, and scrolling. Each page in this section demonstrates these skills with pictures and words in simple language. Upon completion of that section, students then move on to several web pages in which the information needed to navigate the actual testing system is provided. This section included a review of the login process, initial name and site confirmation screens, directions on the Student Home page, and a summary of some important things to know about the system functionality.
Within the MAPT system there are two additional ways learners can prepare for the online
test and teachers can gain familiarity with the MAPT. Prior to taking the MAPT for Math or MAPT for Reading all students are required to complete the Sample Questions in the appropriate subject area. For each area there are four sample questions that provide an overview of the specific skills or knowledge required for that test. The Sample Questions are not meant to test content knowledge and they are specifically designed for a low reading level. In addition, the correct answers for three out of the four items are presented, with the fourth item designed for the student to practice on their own. The Math Sample Questions include clicking radio buttons, calculator usage, and the formula page link. The Reading Sample Questions include clicking on radio buttons, exploring how multiple items can relate to the same reading passage, and reviewing how reading graphics might appear. A raw score is given at the end of the four questions. The students can retake the Sample Questions as often as they like and they can be accessed outside of a testing session to allow for more practice. Teachers and test administrators can also access the Sample Questions so they will also be familiar with these features of the MAPT.
Practice Tests are also available to students, teachers, and test administrators in each
subject area for each testing level. The practice tests are half-length, fixed forms of 20 questions each, and the students receive a raw number correct score. The practice tests mirror the test specifications used to guide the operational test development. They help both students and teachers to see the type of content that is tested at each level and serve as another way to determine what level would be most appropriate. Students can access multiple levels and can retake the Practice Tests as often as necessary.
3. Pilot Testing
As described in Chapter II, pilot tests are a critical aspect of test development. Through the pilot test process, items are administered to learners in the target population so that statistical information about the items can be computed and evaluated. The development of the MAPT involved two separate and comprehensive pilot tests, which preceded—and were distinct from—the ongoing routine pilot testing described below. The first pilot test occurred between March 2005 and June 2005 and is referred to as Pilot 1. The second pilot test occurred between October 2005 and January 2006 and is referred to as Pilot 2. In both pilots, items developed for the MAPT for Reading and MAPT for Mathematics and Numeracy were administered over the Internet to adult learners throughout Massachusetts. Trained test administrators managed this process and administered the pilot tests to students during regular class hours. Only actual adults enrolled in adult education programs in Massachusetts participated in the pilot studies. Thus, all

27
MAPT item pilots were conducted on the same population for which the test was designed and is currently used. The specific goals of the pilot tests were to:
(a) evaluate the statistical characteristics of items developed for the MAPT (b) evaluate the feasibility of delivering the tests over the Internet (c) evaluate ABE learners’ ability to take tests on computer (d) (Pilot 1 only) select specific, high quality items for use as linking items in Pilot 2 (e) (Pilot 2 only) select items for operational use
In this section, we describe the procedures we followed in collaboration with ACLS and UMASS’ Center for Educational Software Development (CESD) during pilot testing. Included are descriptions of participation rates and a summary of the results, and a description of how the results were used to develop the operational tests. Pilot 1 Design
Pilot 1 took place from March through June 2005. To appropriately target the pilot items to the intended learners, multiple fixed-length pilot test forms were created. These forms followed the test specifications stipulated in the reports from the Test Specification Development Committees (Sireci, Baldwin, et al., 2004; Sireci, Li, et al., 2004) and included 5 forms at levels 2, 3, and 4 for both reading and math and two additional forms at math level 5. The booklet design for Pilot 1 is shown in Tables III.1 and III.2. Each form had 30 items: 20 items associated with its given level and 10 items from an adjacent level (or levels). All items from adjacent levels also appeared on forms within their respective level. This design resulted in a total of approximately 100 piloted items at each level (20 items × 5 forms) for each subject (reading and math).
The Pilot 1 design included some linking items (i.e., items that appear on more than one
form), which allowed item statistics for within-subject items to be placed on a common scale for comparison. However, the primary goal of Pilot 1 was to evaluate items relative to quality criteria—not relative to one another—and for this reason, links were allowed to be weak in some cases. Using less than high-quality links across forms and levels allowed for more items to be piloted and was permissible given that the item statistics were not going to be used operationally.

28
Table III.1: Spring 2005 (Pilot 1) Test Booklet Design for Reading
Level 2 Items Level 3 Items Level 4 Items Number of Items in Booklet Booklet
20-item blocks 10-item blocks
5-item blocks 10-item blocks 20-item blocks 10-item blocks
5-item blocks
L2.1 20 10 30 L2.2 20 10 30 L2.3 20 10 30 L2.4 10 10 10 30
Level 2 Booklets
L2.5 5 5 5 5 10 30
L3.1 10 10 10 30 L3.2 5 10 10 5 30 L3.3 5 10 10 5 30 L3.4 5 10 10 5 30
Level 3 Booklets
L3.5 10 10 10 30
L4.1 10 20 30 L4.2 10 20 30 L4.3 10 20 30 L4.4 10 10 10 30
Level 4 Booklets
L4.5 10 5 5 5 5 30
= block of unique items = block of common (anchor) items

29
Table III.2: Spring 2005 (Pilot 1) Test Booklet Design for Mathematics and Numeracy
Level 2 Items Level 3 Items Level 4 Items Level 5 Items
Number of Items
in Booklet Booklet
20-item blocks
10-item blocks
5-item blocks 10-item blocks 20-item blocks
10-item blocks
5-item blocks 20-item
blocks
10-item blocks
L2.1 20
10
30
L2.2 20
10
30
L2.3 20
10
30
L2.4 10
10
10
30
Level 2 Booklets
L2.5 5 5 5 5 10
30
L3.1 10
10
10
30
L3.2 5 10
10
5 30
L3.3 5 10
10
5 30
L3.4 5 10
10
5 30
Level 3 Booklets
L3.5 10
10
10
30
L4.1 20
10
30
L4.2 20
10
30
L4.3 10
20
30
L4.4 10
10
10
30
Level 4 Booklets
L4.5 10
5 5 5 5 30
L5.1 10
10
10
30 Level 5 Booklets
L5.2 5 5 20 30
= block of unique items = block of common (anchor) items

30
Pilot 2 Design A key objective of Pilot 1 was to identify linking items for Pilot 2. In addition to evaluating the statistical characteristics of the pilot items, a key objective of Pilot 2 was to place all item parameter estimates onto a common scale for the operational administration of the MAPT. Pilot 2 occurred between October 2005 through mid-January 2006 and included 4 forms at levels 2, 3, and 4 for both reading and math and 2 additional forms at math level 5. These forms were also developed according to the Test Specification Development Committee recommendations. Each form had 40 items with a minimum of 15 linking items per form. As discussed in the previous paragraph, linking items are items that appear on multiple forms, creating a link between forms. Such links allow item parameter estimates from multiple forms to be placed on a common scale through a statistical adjustment called scaling, which is discussed in greater detail in Chapter IV. For Pilot 2, it was critical that all items within each subject area (math and reading) were placed on a common scale, so that the item statistics from the pilot 2 could be used in the operational administration of the MAPT. Thus, the booklet linking design was more extensive for Pilot 2 than for Pilot 1. Tables III.3 and III.4 show the Pilot 2 design for Reading and Mathematics and Numeracy, respectively.
Participation
To estimate item parameters using the IRT model selected for the MAPT (i.e., the one-parameter logistic model or 1-PL), it was decided that a minimum of 150 learners needed to respond to each item to properly gauge its difficulty, but our goal was to achieve double that sample size for as many items as possible. Although 150 learners per item is a modest sample size, larger sample sizes were difficult to obtain, given the large numbers of items being calibrated. Also, random error in the item parameter estimates due to sample size has a relatively modest impact on proficiency score estimates as long as the number of items in the test is not too small. Figures III.1 and III.2 show the mean sample sizes for each subject and form level, excluding within-level linking items for Pilot 1 and 2, respectively. It can be seen that all items had sample sizes of 200 or more except for Pilot 1 math level 4 items, which had an average exposure of n=166, Pilot 1 math level 5 items, which had a mean exposure of n=138, and Pilot 2 math level 2, which had a mean exposure of n=192. For Pilot 1, linking items typically had the same within-level exposure as non-linking items because in general they did not appear on more than one form in a given level. For Pilot 2, on the other hand, linking items typically had twice the within-level exposure as non-linking items because, excepting Mathematics and Numeracy Level 5, all linking items appear on two within-level forms. Figure III.3 shows the within-level exposure of the Pilot 2 linking items.

31
Table III.3: Fall 2005 (Pilot 2) Test Booklet Design for Reading Level 2 Items Level 3 Items Level 4 Items
Booklet 25-item blocks
5-item blocks
20-item blocks 10-item
blocks 25-item blocks
5-item blocks
Number of Items in Booklet
L2.1 25 5 10 40 L2.2 25 5 10 40 L2.3 25 5 10 40
Level 2 Booklets
L2.4 25 5 10 40 L3.1 5 20 10 5 40 L3.2 5 20 10 5 40 L3.3 5 20 10 5 40
Level 3 Booklets
L3.4 5 20 10 5 40 L4.1 10 25 5 40 L4.2 10 25 5 40 L4.3 10 25 5 40
Level 4 Booklets
L4.4 10 25 5 40 = block of unique items = block of common (anchor) items

32
Table III.4: Fall 2005 (Pilot 2) Test Booklet Design for Mathematics and Numeracy
Level 2 Items Level 3 Items Level 4 Items Level 5 Items
Booklet 25-item blocks
5-item blocks
20-item blocks 10-item
blocks
20-item blocks
10-item block
5-item blocks 25-item
blocks
5-item block
Number of Items
in Booklet
L2.1 25 5 10 40 L2.2 25 5 10 40 L2.3 25 5 10 40
Level 2 Booklets
L2.4 25 5 10 40
L3.1 5 20 10 5 40 L3.2 5 20 10 5 40 L3.3 5 20 10 5 40
Level 3 Booklets
L3.4 5 20 10 5 40
L4.1 10 20 5 5 40 L4.2 10 20 5 5 40 L4.3 10 20 5 5 40
Level 4 Booklets
L4.4 10 10 5 5 5 5 40
L5.1 5 5 25 5 40 Level 5 Booklets L5.2 5 5 5 25 40
= block of unique items = block of common (anchor) items

33
Figure III.1
Pilot 1: Mean Item Exposure by Subject and Test Form Level (excluding within-level linking items)
0
100
200
300
400
500
600
700
2 3 4 5 Test Form Level
Mean Item Exposure
Math Reading
Figure III.2
Pilot 2: Mean Item Exposure by Subject and Test Form Level (excluding within-level linking items)
0
100
200
300
400
500
600
700
2 3 4 5
Test Form Level
Mea
n I
tem
Exp
osu
re
Math
Reading

34
Figure III.3
Pilot 2: Mean Item Exposure by Subject and Test Form Level (within-level linking items only)
0
100
200
300
400
500
600
700
2 3 4
Test Form Level
Mea
n I
tem
Exp
osu
re
Math
Reading

35
4. Item Analysis A total of 1,101 unique items were evaluated during Pilots 1 and 2, including 239 items that appeared on both Pilot 1 and Pilot 2. For each item, classical item difficulty and discrimination statistics were computed4. Figure III.4 shows an example of the item analysis statistics computed for each Pilot 1 item (similar information was gathered for Pilot 2). Only one item is illustrated in the figure, but a complete item analysis report for all items is available. The top of the item analysis report provides the name of the item writer, the subject area, and test level. Next, the number of learners who responded to the item is shown, in the “item exposure” field. Many of the items appeared on multiple test forms each targeted to a different level and therefore the frequencies for each level are reported when applicable. In the “response summary” field, the proportions of learners (at each level) who correctly answered the item are reported along with the average number of seconds it took learners to respond to the item. These proportion correct statistics are referred to as “p-values” and are an index of item difficulty. The next section reports the numbers and proportions of learners who selected each of the four response options for the item. The correct answer is denoted with an asterisk. The correlation between the selection of each response and total test score is also reported. Items that “perform” as expected will have large and positive correlations (i.e., > .25) for the correct answer and negative correlations for the incorrect response options.
The “point-biserial” statistic for the item is presented next. The point-biserial is a measure
of “item discrimination.” It is the correlation between item scores (0 if answered incorrectly and 1 if answered correctly) and total test scores. Since this statistic is a correlation, it ranges from –1.0 (perfect negative correlation) to +1.0 (perfect positive correlation), with values at or above .25 reflecting an acceptable relationship between learners’ performance on an item and their total test score. For Pilot 1, total test score was computed by summing all the items on a test form correctly answered by each learner, minus the item of interest. Positive point-biserials indicate that the item is performing as expected—i.e., higher-scoring examinees are answering the item correctly more often than lower-scoring examinees. Thus, the closer the point-biserial is to 1.0, the better, but in practice, it is rare for these point-biserials to exceed values of about .60. The point-biserial statistic can also be found in the distractor analysis for the row representing the correct answer. For convenience, it is repeated separately so that the statistic can be viewed easily when reviewing lots of items. The “infit” and “outfit” statistics indicate how well the item fits the 1PL IRT model. These statistics provide similar information to the point biserial, but are on different scales. The last section of the item analysis report is a histogram that illustrates the distributions of item
4 For Pilot 1, calibration was done using Winsteps, an IRT estimation software package. This software provides infit and outfit statistics, which were used during item analysis. For pilot test 2, and for the operational calibration, BILOG-MG software was used and so both item fit (residual plots, chi-square values) and classical item statistics were used to statistically evaluate the items. Only the classical results are described in this manual, but we do address item fit in Chapter VII. For pilot 1, we found that essentially the same items were flagged whether we used corrected point-biserials, infit/outfit, or residual analysis. Analysis of differential item functioning across groups defined by sex, ethnicity, and native language (English vs. other) were also conducted, where sample sizes permitted, and are summarized in Han, Baldwin, and Sireci (2006).

36
difficulties for all items within a subject area and for all items within that test level. The difficulty location of the item of interest is represented by a small diamond (◊) on the x-axis of the figure. These item difficulties are not the same as the p-values described earlier. Rather, they are IRT difficulty parameters reported on a scale ranging from about –4.0 to 4.0, with a mean of 0 and a standard deviation of 1.0 for level 3 items. On this scale, a larger number indicates a more difficult item.
As can be seen in Figure III.4, the item analysis report provides a great deal of information for each item (e.g., item difficulty, item discrimination, item response time, and how well the distractors are functioning). In selecting the “best” items to be used on Pilot 2, the point-biserial statistics were of particular interest because they are good indicators of the best items for sorting candidates into performance categories. We excluded most Pilot 1 items with point biserials less than .25 from the item calibration process. The specific criteria for inclusion in item calibration were:
1. Minimum of 150 people responded to item (minimum of 120 for math Level 5) 2. Corrected point-biserial greater than .25 (on at least one form, if item appears on multiple
forms); however, this criterion could be relaxed if the proportion correct (p-value) was less than .15 or greater than .85 (since extreme p-values have an attenuating effect on discrimination statistics).
The minimum N criterion helped ensure that the item characteristics could be reasonably
estimated. It can be seen that when only the minimum number of examinees (N = 150) responded to an item and when p-values are extreme (i.e., very easy or very hard items), discrimination indices must be based on performance differences of an extremely small number of examinees (150× .15≈ 23). Under such conditions, corrected point-biserials may be difficult to estimate. Thus, the minimum corrected point-biserial criterion of .25 was relaxed for items that had extreme p-values (<.15 or >.85). This allowed potentially usable items to be included in the second round of pilot testing before a final determination of their suitability for operational use was made.
For the item shown in Figure III.4, we can see it has a p-value of .65 for level 2 learners and .81 for level 3 learners. This is consistent with our expectations—lower-level learners had less success with the item than higher-level learners. This item also performed well with respect to the point-biserial criterion: .40 and .32 for level 2 and 3 learners, respectively. It is also interesting to note that the time it took for learners to respond to the item decreased as level increased, which is also consistent with expectation. Thus, this is an item that appears to function as intended and would probably be selected for Pilot 2.
Unfortunately, not all piloted items exhibited the same pattern of results. One example is
presented in Figure III.5. For this item, level 4 learners performed slightly better than level 5 learners, although the most striking finding is that the item was very difficult for learners at both levels, and learners took a substantial amount of time to answer the item. This particular item was removed from the pool of potential items and was not selected for operational use.
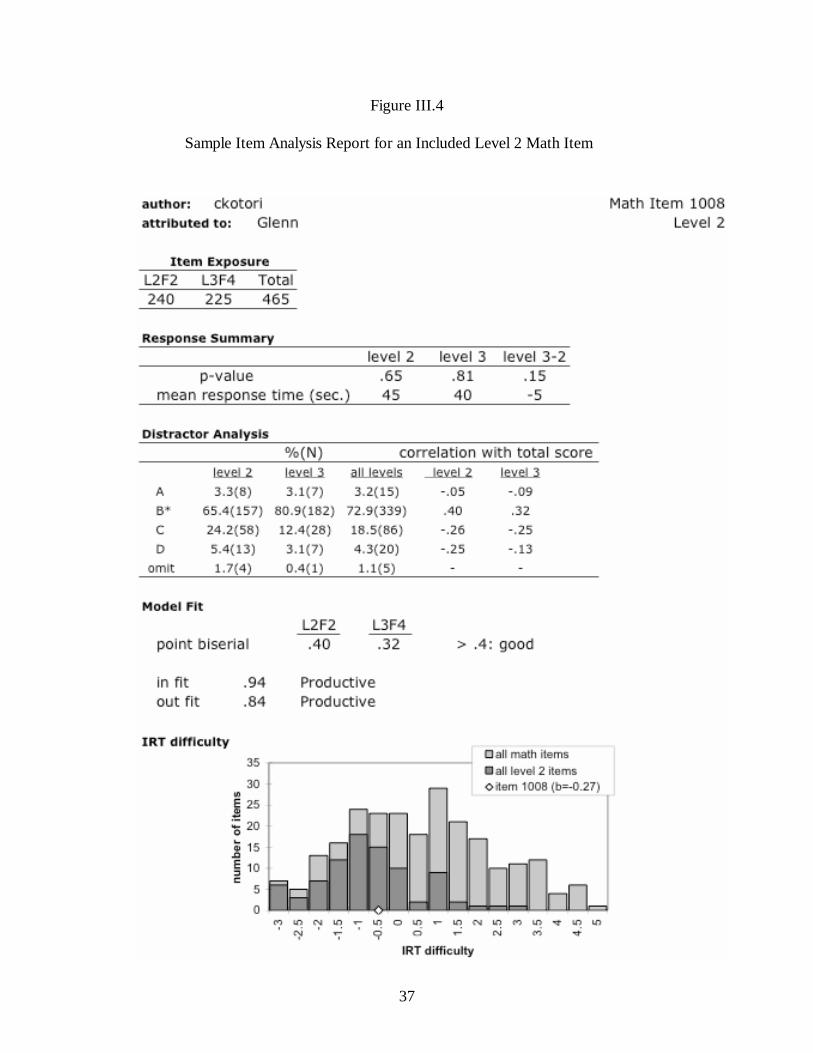
37
Figure III.4
Sample Item Analysis Report for an Included Level 2 Math Item

38
Figure III.5
Sample Item Analysis Report for an Unused Level 4 Math Item
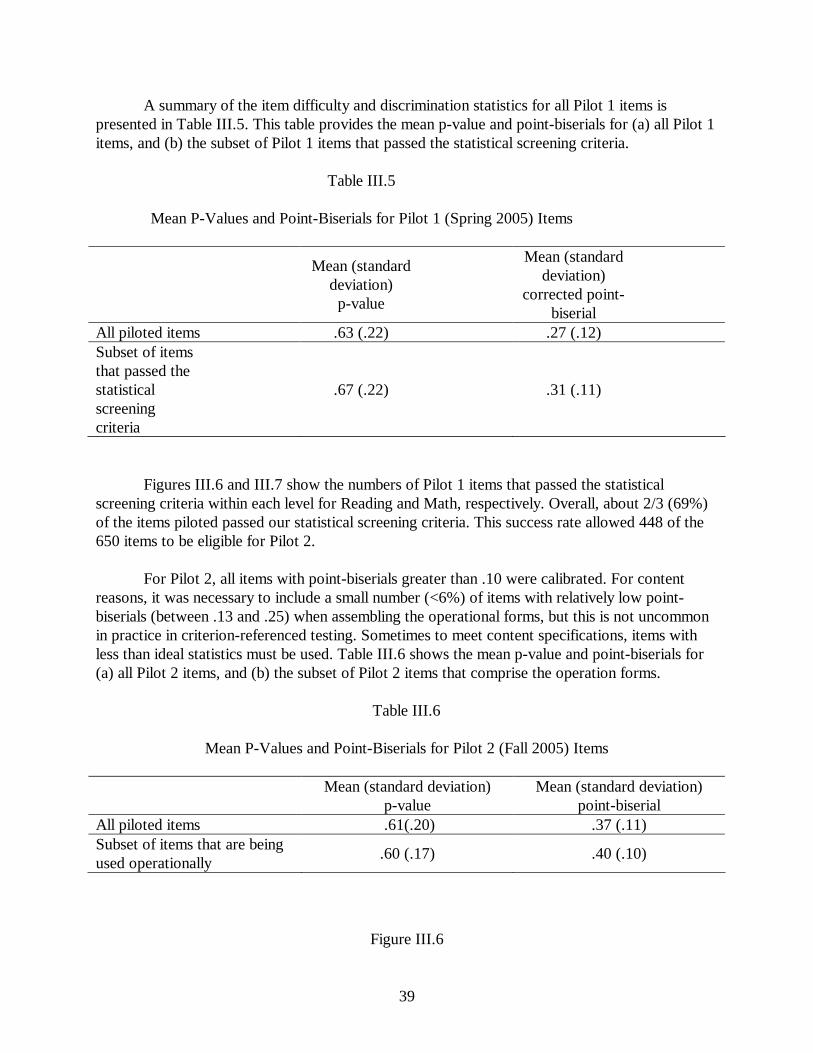
39
A summary of the item difficulty and discrimination statistics for all Pilot 1 items is presented in Table III.5. This table provides the mean p-value and point-biserials for (a) all Pilot 1 items, and (b) the subset of Pilot 1 items that passed the statistical screening criteria.
Table III.5
Mean P-Values and Point-Biserials for Pilot 1 (Spring 2005) Items
Mean (standard deviation) p-value
Mean (standard deviation)
corrected point-biserial
All piloted items .63 (.22) .27 (.12) Subset of items that passed the statistical screening criteria
.67 (.22) .31 (.11)
Figures III.6 and III.7 show the numbers of Pilot 1 items that passed the statistical
screening criteria within each level for Reading and Math, respectively. Overall, about 2/3 (69%) of the items piloted passed our statistical screening criteria. This success rate allowed 448 of the 650 items to be eligible for Pilot 2.
For Pilot 2, all items with point-biserials greater than .10 were calibrated. For content
reasons, it was necessary to include a small number (<6%) of items with relatively low point-biserials (between .13 and .25) when assembling the operational forms, but this is not uncommon in practice in criterion-referenced testing. Sometimes to meet content specifications, items with less than ideal statistics must be used. Table III.6 shows the mean p-value and point-biserials for (a) all Pilot 2 items, and (b) the subset of Pilot 2 items that comprise the operation forms.
Table III.6
Mean P-Values and Point-Biserials for Pilot 2 (Fall 2005) Items
Mean (standard deviation) p-value
Mean (standard deviation) point-biserial
All piloted items .61(.20) .37 (.11) Subset of items that are being used operationally
.60 (.17) .40 (.10)
Figure III.6

40
Approximate Frequencies of Pilot 1 Reading Items Included/Excluded from IRT Calibration
63%67%80%
20%
33%37%
0
20
40
60
80
100
120
2 3 4
Item Level
Num
ber
of It
ems
s
excluded from calibration
included in calibration
Figure III.7
Approximate Frequencies of Pilot 1 Math Items Included/Excluded from IRT Calibration
87%
68%53%
64%
13%
32%47%
36%
0
20
40
60
80
100
120
2 3 4 5
Item Level
Nu
mbe
r of
Item
s
s
excluded from calibration
included in calibration

41
Characteristics of Operational Item Banks
The previous figures were based on the pilot results that were used to create and calibrate the Math and Reading item banks that were operational during the first year of the MAPT—fiscal 2007. Figures III.8 through III.11 show the distribution of point-biserials and IRT difficulty (b-parameters) for the subset of Pilot 2 items that were selected for operational use. The b-parameter figures (III.10 and III.11) are also of interest because they represent the relationship between intended test level and item difficulty. One advantage of the IRT difficulty scale is that items across levels can be placed on the same scale, which allows relationships across levels (and forms) to be examined (unlike p-values, which are level and form dependent).
Figure III. 8
Distribution of Point-Biserials by Level (Fiscal 2007 MAPT for Reading)
0
0.05
0.1
0.15
0.2
0.25
0.3
0.35
0.4
0.1 0.2 0.3 0.4 0.5 0.6 0.7 Point-Biserial
Pro
po
rtio
n o
f Ite
ms
Level 2 Level 3 Level 4 All Items

42
Figure III.9
Distribution of Point-Biserials by Level (Fiscal 2007 MAPT for Math)
0
0.05
0.1
0.15
0.2
0.25
0.3
0.1 0.2 0.3 0.4 0.5 0.6 0.7 Point-Biserial
Pro
po
rtio
n o
f Ite
ms
Level 2 Level 3 Level 4 Level 5 All Items
Figure III.10
Distribution of IRT Difficulty by Level (Fiscal 2007 MAPT for Reading)
0
0.05
0.1
0.15
0.2
0.25
0.3
0.35
0.4
0.45
-2 -1.5 -1 -0.5 0 0.5 1 1.5 2 IRT Difficulty (b-parameter)
Pro
port
ion
of It
ems
Level 2 Level 3 Level 4 All Items

43
Figure III.11
Distribution of IRT Difficulty by Level (Fiscal 2007 MAPT for Math)
0
0.05
0.1
0.15
0.2
0.25
-2.5 -2 -1.5 -1 -0.5 0 0.5 1 1.5 2 2.5 IRT Difficulty (b-parameter)
Pro
port
ion
of It
ems
Level 2 Level 3 Level 4 Level 5 All Items
Figures III.12 and III.13 present the distributions of IRT b-parameters (difficulty parameters) for Math and Reading, respectively, for fiscal 2008. The distributions for all items, as well as separate distributions for each NRS level, are presented. Currently, 3,002 items have been written for the MAPT—1,763 for Math and 1,239 for Reading. However, not all items have been field-tested, and some were deemed not suitable for content or statistical reasons. The total number of operational items for fiscal 2008 is 400 Math items and 320 Reading items.

44
Figure III.12
Figure III.13
0.00
0.05
0.10
0.15
0.20
0.25
-2.5 -2.0 -1.5 -1.0 -0.5 0.0 0.5 1.0 1.5 2.0 2.5
m
All
Level 2
Level 3
Level 4
Level 5
Level 6
All
Beginning Basic
Low Inter. High Inter.
LAS
HAS
Distribution of IRT Difficulty Level: MAPT for Math (Fiscal 2008)
IRT Difficulty (b-parameter)
Rel
ativ
e F
requ
ency
Distribution of IRT Difficulty Level: MAPT for Reading (Fiscal 2008)
IRT Difficulty (b-parameter)
0.00
0.05
0.10
0.15
0.20
0.25
0.30
0.35
-2.5 -2.0 -1.5 -1.0 -0.5 0.0 0.5 1.0 1.5 2.0 2.5
m
All
Level 2
Level 3
Level 4
Level 5
All Beginning Basic
Low Inter.
High Inter.
LAS/HAS
Rel
ativ
e

45
Item Response Time Analyses
Pilot Studies
The amounts of time it took learners to answer each item and to complete the pilot tests were also calculated. These analyses were conducted to ensure learners would have sufficient time for completing the exam and to further evaluate item functioning. Table III.7 presents a summary of the data for Pilot 1, in which 2,817 learners took a 30-item Mathematics pilot test, and 2,758 learners took a 30-item Reading pilot test. The results across the two tests were similar. On average, learners spent about 53 seconds per item on the math items and 55 seconds on the reading items, which resulted in a total testing time of less than 30 minutes.
Table III.7
Descriptive Statistics for Item and Test Completion Times for Pilot 1 (30 Items)
Test Mean SD
Item Response Time (seconds)
53.2 18.9 MAPT for Mathematics and Numeracy
Time to Complete Test (minutes)
26.6 9.5
Item Response Time (seconds)
54.7 20.8 MAPT for Reading
Time to Complete Test (minutes)
27.3 10.4
The results for Pilot 2 (n=3,284 for Math and n=3,254 for Reading) are presented in Table III.8. The average time to respond to an item went up about 6 seconds for Math, but went down about 4 seconds for reading. The mean time to complete the test was about 39 minutes for math and 34 minutes for reading. The vast majority of learners (93%) completed the test within one hour. The MAPT is not intended to be speeded and so the timing recommendations for the exam are due to practical factors such as scheduling learners to take the test. The current suggested time interval for taking a MAPT exam is two hours. The results from the pilot test suggest all learners should have no trouble completing the test within this recommended time interval and that the vast majority will finish in half that time. Information on the current time it takes learners to respond to items and complete the exams is provided next.

46
Table III.8
Descriptive Statistics for Item and Test Completion Times for Pilot 2 (40 Items)
Test Mean SD
Item Response Time (seconds)
58.8 51.3 MAPT for Mathematics and Numeracy
Time to Complete Test (minutes)
39.2 16.3
Item Response Time (seconds)
51.2 44.0 MAPT for Reading
Time to Complete Test (minutes)
34.1 12.9
Item Response and Test Completion Times: Operational Data A goal of the MAPT program was that most learners would be able to complete an exam in one hour. Based on the pilot test analyses of item response and test completion times, it was expected that most learners would be able to complete the test in that time period. However, due to concern over learners who may work more slowly, and since the MAPT is not intended to be speeded, a two-hour time interval was suggested for the exam. This time interval was set so that all learners would be able to complete the exam without feeling rushed. Should a learner need more than two hours, they can request extended time, even after they begin an exam. At this juncture, all requests for extended time have been granted (information on MAPT accommodations is presented in Chapter VII.). Thus, completion rates for the MAPT are essentially 100%. For fiscal 2007, 58% of the learners completed the MAPT for Math in one hour or less, and 96% completed the exam in two hours or less. For the MAPT for Reading, 61% of the learners finished the exam in an hour or less, and 96% completed the exam within two hours. Thus, there is no evidence the MAPT exams are speeded.
Each year, we evaluate the item response time data and test completion data. The data for fiscal 2007 are summarized in Table III.9. The item and total test times have increased since the two pilot studies for both Math and Reading. Several factors likely contributed to this increased time. First, learners get scores for the operational tests and so they are probably trying harder than they did on the pilot tests. A recent study by Delton (2008, described in Chapter VII) confirmed that learners were attending to the items when taking the operational tests5. Learners may have been less motivated to take their time and do as well on the pilot tests. Second, the operational tests are longer than the pilot tests because they include unscored pilot items (see a discussion of embedded item piloting in the next section). Third, the new items added for fiscal 2008, and piloted in fiscal 2007, involved more difficult math items (targeted to the ASE
5 Specifically, by looking at item response times, she found that 99% of the time learners were engaged in “solution behavior” (see Chapter VII).

47
cognitive levels) and longer, more difficult reading passages. For much of 2007 there were 10 pilot items for Reading and 5 for Math. We recently reduced the number of Reading pilot items to 5 due to a desire to reduce testing time for learners, now that we have larger numbers of items already piloted.
Table III.9
Descriptive Statistics for Item and Test Completion Times for MAPT Fiscal 2007 (45 Items Math (5 Pilot), 50 Reading Items (10 pilot))
Test Median Mean SD Item Response Time
(seconds) 78.60 86.70 43.64
MAPT for Mathematics and Numeracy Time to Complete
Test (minutes) 55.63 61.33 29.27
Item Response Time (seconds)
81.21 104.01 77.32 MAPT for Reading
Time to Complete Test (minutes)
53.35 59.26 30.12
Current Item Tryout Procedures and Item Bank Calibrations Since the MAPT became operational in July 2006, unscored pilot items have been embedded into the tests. The items are placed in modules associated with the EFLs they were written to, and also in modules for the adjacent EFLs. The difficulty statistics for these items are monitored to see if they need to be piloted at a lower or higher level. Initially, there were 5 pilot items on each test. In April 2007, however, it was decided that longer reading passages were needed on the MAPT and until February 2008, ten reading items were piloted. As of March 2008, all MAPT tests, both reading and math, contain only 5 pilot items. When a sufficient number of learners has responded to a pilot item (typically a minimum of 200 learners), the item is pulled from the pretest slot and replaced with another pilot item. Item analyses are conducted on all pilot items, and items that are judged to meet the statistical criteria described earlier are retained for calibration. Items become operational through a calibration process involving all current operational items (see Chapter IV). This enhanced calibration of the item bank occurs each summer so that refreshed banks are used for the operational testing. The initial and current procedures used to calibrate all MAPT items onto a common scale are described at the end of this chapter and in Chapter IV.

48
5. Sensitivity Review Sensitivity review refers to the process of having a diverse group of professionals review
tests to flag material that may unintentionally interact with demographic characteristics of some test takers. As the Standards for Educational and Psychological Testing (AERA, et al., 1999) describes
Test developers should strive to identify and eliminate language, symbols, words, phrases, and content that are generally regarded as offensive by members of racial, ethnic, gender, or other groups, except when judged to be necessary for adequate representation of the domain. (AERA, et al., 1999, p. 82)
Although item writers and item reviewers were asked to consider issues of diversity and
sensitivity when constructing and reviewing items, we believed it was important to add a separate, independent review that would concentrate solely on sensitivity issues. The sensitivity review process for the MAPT sought to do more than identify and eliminate test content that may be construed as offensive (Ramsey, 1993; Sireci & Mullane, 1994). Rather, the MAPT sensitivity review also sought to identify test material that was irrelevant to the construct measured, but may provide an advantage or disadvantage to learners from different backgrounds. That is, our sensitivity reviews attempted to uncover unintended bias in the MAPT. Specifically, the MAPT sensitivity reviewers were asked to review pools of MAPT items for material that may
(a) be construed as offensive to particular groups of learners,
(b) portray groups of learners unfavorably, or in a stereotypical fashion,
(c) be advantageous to one group, and/or disadvantageous to another, or
(d) be unfamiliar to certain groups of learners. Sensitivity review is often seen as a final, qualitative check on potential bias in a test6.
Unlike a technical content review, the reviewers need not necessarily be experts in the subject domain tested, although such expertise is desirable. Instead, the reviewers are selected for their knowledge of specific cultural groups and how test takers from such groups may interpret test material. Sensitivity reviewers are typically a diverse group consisting predominantly of minority group members. By reviewing tests for potential bias, sensitivity review can improve the content validity of a test, but it should not be confused with a content review. As Sireci and Mullane described
“[test developers] strive to ensure that the content of their tests is representative of and relevant to the domain tested, and that trivial or superfluous material is not present.
6 Analyses of differential item functioning were also conducted on the MAPT, where sample sizes permitted, as a quantitative check on potential item bias. These analyses were conducted on pilot 2 data and included analysis across groups based on sex, ethnicity, and native language (English vs. other). See Han, Baldwin, and Sireci (2006) for a summary of these analyses.

49
Therefore, it can be argued that sensitivity review is built into the test development process under the rubric of content validation. After all, if the entire content of a test has been demonstrated to be relevant to the content domain, there should be no material contained therein that is offensive or unfamiliar to examinees who are knowledgeable of the domain. This argument is flawed, however, because evaluations of test content focus on how well the items that comprise a test represent the content domain, rather than on evaluating the context within which the items are framed. (pp. 22-23)
For the initial sensitivity review of all MAPT pilot items that were being considered for
operational use, eight independent sensitivity reviewers were hired to review MAPT items. Five of the reviewers were men and three were women. The reviewers were selected to represent a variety of backgrounds including African/African-American (4), Hispanic/Latino (2), Asian-American (1), and Euro-American (1). The reviewers taught or worked with adult learners from a variety of backgrounds, particularly new immigrants, learners with limited English proficiency, and traditionally under-represented minority groups such as Hispanic/Latino, Haitian, Asian, and African American, and other ethnic groups within the adult education community in Massachusetts such as Polish, Russian, Cape Verdean, and Vietnamese. The reviewers were also familiar with instructing students who had learning disabilities. In addition, the facilitator for the meeting was a former quadriplegic who was familiar with issues confronting disabled adults, and is a member of several national committees for assessing special needs students.
The reviewers were trained in the sensitivity review process during a four-hour meeting
held in Worcester, Massachusetts in spring 2006. The principles of sensitivity review were discussed and instructions were given regarding the types of problems to look for in items and their associated text and stimuli (e.g., reading passages, graphs, tables, etc.). The diversity of adult learners were discussed and reviewers were asked to consider identifiable subgroups of adult learners such as men, women, ethnic subgroups (African, African American, Hatian Creole, Hispanic/Latino, Portuguese, Russian, Vietnamese, etc.), linguistic minorities, learners of different age groups, individuals with disabilities, and individuals with different sexual orientations. Following these discussions, panelists reviewed sample items that had been flagged for reasons of sensitivity in different testing programs (see Ramsey, 1993; and Sireci & Mullane, 1994 for some examples of these types of items) and the issues associated with these items were discussed as a group.
After training, the sensitivity reviewers were given a booklet containing 120 MAPT items,
with about half coming from each subject area. The item booklets were partitioned into sets of about 30 items to facilitate the review process. The booklets were assembled so that all MAPT items being considered for operational use were reviewed by at least two (and up to four) sensitivity reviewers. The reviewers were also given sets of Sensitivity Review Rating Sheets. They were asked to review all items and provide any comments regarding items with potential sensitivity issues on a review sheet. When they were unsure whether an item could be problematic, they were told to err on the side of flagging the item and to provide a description of why the item might have a sensitivity issue. The rating sheet also asked whether the packet of test items was appropriate for 12 specific groups of learners. The reviewers spent two hours reviewing items at the meeting and were asked to complete their remaining reviews within a one-
50
week period. All reviewers completed this task within the requested time period. The sensitivity reviewers provided numerous comments on items and reading passages.
Approximately 40 items were flagged for various reasons. Examples of why items were flagged included a lack of diversity in the names that were associated with the items (particularly in math problems), concerns over terms related to money, negative stereotypes for certain body types associated with reading passages, and concerns over items that described violence during World War II.
All comments received from the sensitivity reviewers were carefully considered by the test development team at UMASS, which included test development staff and a Professor of Psychometrics with 17 years of experience in test development and sensitivity review. Changes were made to approximately 20 items in response to the reviewers’ comments. In some cases, an offensive sentence was removed from a reading passage, after concluding the sentence was not needed to correctly answer any items associated with the passage. In other cases, more diverse names, such as “Julio,” “Djata,” and “Zoe,” were used to replace names such as “John” and “Sue.” Some items were left unchanged because it was concluded the issue raised by the sensitivity reviewer was content-relevant. For example, one sensitivity reviewer thought that some learners would not understand the term “dime,” on a math item measuring “carry out basic calculations with money.” This issue was discussed with members of the Math Content Validity Panel who concluded the term was necessary for appropriately measuring the objective. To summarize the MAPT sensitivity review, a carefully selected panel of reviewers who were familiar with learners from a variety of backgrounds, were trained to review items for sensitivity issues. These reviewers flagged many items and explained why they should be discussed before being considered for operational use. UMASS staff reviewed and considered all comments received from the sensitivity reviewers and made several changes to many items. The current sensitivity review process for the MAPT involves reviewing all items that survive pilot testing using trained sensitivity reviewers, following the same processes described above.
51
6. Development of MST Modules and Panels
To address the challenge of testing a population with a heterogeneous distribution of proficiency scores, the MAPT uses a multistage adaptive test design. The basic concepts underlying multistage testing (MST) were described in Chapter II. In this section, we describe how the MAPT modules and panels were developed. A module is a set of items administered to learners at a particular stage of the test. A panel is a collection of modules that spans the learner levels and stages. The original MST design for the MAPT, and the current design, are described in the next section. These designs describe how learners begin the test and are routed from one stage to the next. In this section, we describe how the modules and panels were assembled.
As described in earlier sections of this chapter, all MAPT items were piloted using adult
education learners in adult programs throughout Massachusetts. The pilot data for items were evaluated using classical and IRT statistics and the items surviving statistical screening were calibrated onto the underlying IRT scale. A separate scale was created for the MAPT for Math and the MAPT for Reading. Each scale was centered by fixing the mean difficulty level of all items written for Low Intermediate to be zero (i.e., the theta scale was centered at the mean difficulty of all items written for Level 3). The technical details for this calibration are provided in Chapter IV.
Given a common scale for all items, and test specifications for each EFL in each subject
area, panels were put together by creating sets of modules that would represent the test specifications for each EFL. These sets of modules were “straight paths” that represented a learner starting at one EFL and remaining at that EFL for each stage of the test. For example, the 2-2-2-2-2-2 path represents a learner who starts the test at Beginning Basic, and remains at that level for the remaining five stages. The 3-3-3-3-3-3 path represents a learner who starts the test at Low Intermediate, and remains at that level for the remaining five stages, etc. This strategy ensured the content specifications would be represented for each EFL. Learners who are routed to different EFLs as they take an exam (i.e., follow a “crooked path”) will take tests that are a combination of the test specifications for the different EFL paths that they travel (see Kaira & Sireci, 2007).
In addition to test content, the modules within each panel were created to distinguish the
different difficulty levels associated with each EFL. Specifically, we assembled the modules to maximize test information (described in Chapter 6) over the midpoint of each EFL interval. Thus, each straight path of modules represents the average difficulty of the items at that EFL and the test specifications for that EFL. Each panel is created in the same manner and so they are parallel with respect to content and difficulty. For each panel, the average difficulty of the items within each EFL is approximately equal, as are the test content specifications.

52
7. MST Design: Routing Learners Across Stages
Prior to December 2007, the MAPT MST design consisted of three stages. An example of the initial 3-stage MAPT MST design is presented in Figure III.14. The modules labeled 1 through 4 in this figure illustrate sets of items that correspond to higher EFLs (i.e., are more difficult) moving from the left-hand side of the figure to the right-hand side. This figure illustrates the design in use for the MAPT for Mathematics and Numeracy in the 2006 fiscal year—its first year of operation. As can be seen in the figure, there were four entry points for learners at stage 1. These entry points were decided using either their teacher’s judgment of their current EFL (first MAPT test) or their most recent MAPT test score (subsequent MAPT tests). If a learner performed well at stage 1, s/he would be routed to a module at a more challenging EFL. Also evident in the figure is there were two parallel test panels, containing 12 modules each (4 levels X 3 stages).
Figure III.14
Multi-Panel MST Test Structure (Math): MAPT Version 1: Fiscal 2007
There were three major changes made in the current MAPT MST design compared to the
original design in place in fiscal 2007 (July 1, 2006 through June 30, 2007). The first change was from a 3-stage design to a 6-stage design. The second change was in the scores that were used to route learners to modules across stages. In the original MAPT design, learners were routed from one stage to the next based on the number of items they correctly answered in each module (i.e., number correct or module raw scores). Currently, after each stage, an IRT-based estimate of their Math or Reading proficiency is calculated, as described in Chapter IV, and this IRT-based provisional score (theta) is used to determine the next module to administer. The third change is that learners are no longer restricted from “traveling” only to an adjacent module. As is evident in Figure III.14, during the first operational year of the MAPT learners could only move one module

53
to the left or the right when moving from one stage to the next. In the current design (Figure III.15), if a learner’s provisional theta score is very high, relative to the module s/he just completed, they may be routed to a module more than one level higher than the current module (and vice versa). These changes are all designed to reduce the standard errors of the provisional and final MAPT scores for each learner and to maximize the likelihood they are administered the items that are most appropriate for their current skill level.
For the purpose of routing, IRT proficiency estimates are computed for a learner at each
decision point (or branching point) based on all items they answered prior to the end of a stage. That is, at the end of stage 1, a learner’s proficiency estimate is based on the 15 items taken at stage 1; at the end of stage 2, the learner’s proficiency estimate is based on 20 items (15 at stage 1 + 5 at stage 2, etc.). The routing rules were determined such that IRT information would be maximized for the provisional proficiency estimate available at each decision point. (IRT (Fisher) information, which is discussed in greater detail in section VI.1, is somewhat analogous to the concept of reliability.) This maximization is accomplished at each decision point by computing module information functions for each module within the subsequent stage and routing the learner to whichever module yields the most information for their provisional theta estimate (routing is not limited to adjacent modules). For the learner, the presentation of items is seamless—all routing decisions are made within the test delivery system. Upon completion of the entire test (i.e., all six stages), examinee IRT proficiency is estimated based on all of their item responses.
Figure III.15 illustrates the multistage, multi-panel adaptive test structure used for the current (fiscal 2008) MAPT for both Math and Reading. For the current MAPT design, the first stage consists of 15 scored items. Each module in stage 2 through 6 is then composed of five scored items. This results in a total test length of 40 items in both Math and Reading, respectively. The two-panel structure of the MAPT has been retained. That is, there are two sets of stages and modules for each subject (one light grey and one dark grey). These sets are called panels and in no instance does routing occur across panels. Furthermore, each panel comprises a unique set of items. First-time learners are randomly assigned to one of two parallel panels. In subsequent administrations, a learner is randomly assigned a panel from those panels he or she has not yet seen. If this is not possible (because the examinee has seen all panels), the learner is assigned the panel he or she has seen least recently. Even though considerable time (at least 2 months) may elapse between test administrations, this design minimizes the chance that a learner will have an unfair advantage as a result of being previously exposed to an item. In addition, it is also highly unlikely a learner would travel the same 6-stage path on either panel. Given 24 modules and 6 stages, the potential number of test “forms” for the MAPT is very large.

54
Figure III.15
Multi-Panel, MST Test Structure for Current MAPT (Fiscal 2008)
It should be noted that the test administration architecture for the MAPT is controlled by the Online Web-based Learning (OWL) system developed by the Center for Educational Software Development (CESD) at UMASS. The test selection and item routing rules were developed by the Center for Educational Assessment and were implemented by CESD. The OWL system keeps track of a learner’s MAPT history so that appropriate panel assignments are made.

55
IV. Developing the MAPT Score Scale
1. Item Response Theory (IRT) Calibration
The initial item calibrations for the MAPT used a one-parameter (Rasch) model to place all items on a common scale. This model was chosen primarily because the sample sizes for the items tended to be small. After piloting items in the operational context and administering operational items for a year, sample sizes for many items were considerably larger and so we explored fitting more general IRT models to the data. Specifically, we evaluated the fit of 1-, 2-, and 3-parameter IRT models to the data for each item and even explored modifications of these models such as fixing one or more parameters to predetermined values or using item-specific priors. Ultimately, item parameters and proficiency scores for examinees were estimated using a modified 3-parameter logistic (3PL) IRT model. The typical (unmodified) 3PL model is defined as (Hambleton & Swaminathan, 1985):
Pi (θ) = ci + (1− ci )eDai (θ−bi )
1+ eDai (θ−bi )
where:
Pi is probability of a correct answer on item i; θ (theta) is the examinee proficiency parameter; ai is the item discrimination parameter; bi is the item difficulty parameter; ci is the pseudo-guessing parameter; D is a scaling factor equal to 1.7; e is base of the natural logarithm.
Discrimination parameters (a-parameters) and pseudo-guessing parameters (c-parameters) can be difficult to estimate when examinee samples are small or are very able relative to the difficulty of the item. Because one or both of these conditions existed for a subset of items, the model for such items was further constrained by either fixing a- and/or c-parameters to a predetermined value (1.0 or .20, respectively) or placing a relatively informative prior distribution on parameters as needed. Furthermore, after viewing the residual plots for these items, these priors were, in some cases, revised. Analysis and comparison of residuals across various models was a key determinant in deciding the best IRT model for each item.
Two advantages of IRT models are that item difficulty and examinee proficiency are on a
common scale and that the model parameters are invariant—up to a linear transformation—for a given population of examinees. The qualifier up to a linear transformation is necessary because linearly transforming the scale does not affect the probability of a correct response. That is,

56
Pi (θ) = ci + (1− ci )eDai (θ−bi )
1+ eDai (θ−bi ) = ci + (1− ci )e
Dai
m[( mθ+n)−(mbi +n)]
1+ eD
ai
m[( mθ+n)−(mbi +n)] ,
where m and n are some arbitrary constants. (Note that the pseudo-guessing parameter is unaffected by the transformation because it is on the probability scale not the proficiency/difficulty scale.) The consequence of this scale indeterminacy is that separate estimations of the model parameters cannot be assumed to be on a common scale without making an additional adjustment called equating or scaling. This was the case with item parameters for fiscal year 2007 (FY07), which were estimated independently from the parameters estimated in the pilot studies (fiscal year 2006 or FY06), but nevertheless needed to be expressed on the FY06 scale for comparability.
2. Placing FY07 Item Parameter Estimates on the FY06 Scale
In order to place FY07 item parameter estimates on the FY06 scale, the relationship between the two arbitrarily defined scales was estimated. This relationship can be described by a linear function (i.e., a slope and an intercept). To estimate this linear transformation function, a common element—or link—must exist on both scales. For the MAPT scales, the link was the proficiency distribution of FY06 examinees: all FY06 examinees were scored using the FY06 item parameters and then rescored using the FY07 parameters. Because the same examinees are being scored twice—it’s only the item parameter estimates that differ—the examinee proficiency distribution should be the same for both sets of item parameter estimates, except for the arbitrary scale difference due to the indeterminancy. Therefore, the linear transformation that makes the mean and standard deviation of the FY07 proficiency distribution equal to FY06’s, is the same transformation that places the FY07 parameter estimates on a common scale with FY06 parameters. In this manner, the relationship between the FY06 and FY07 scales was estimated and the FY07 estimates were placed on the FY06 scale.
In addition to reusing most items from FY06, FY07 forms utilize a large number of newly operational items that were piloted over the course of FY06. These new items were embedded within operational test forms and seamlessly presented alongside scored items. At the end of FY06, all within-subject items were calibrated simultaneously using BILOG-MG (Zimowski, Muraki, Mislevy, & Bock, 2002). Simultaneous calibration had two important results: (1) item parameter estimates for operational items were updated and (2) item parameter estimates for pilot items were obtained.
Refreshing the MAPT Item Banks The process described above is repeated once each year, typically at the start of the fiscal year (July) to add new items to the MAPT item banks and reconstitute the panels. All pilot items are monitored and once their sample sizes reach a threshold of 300 examinees, they are evaluated using classical item analysis. If they pass the item statistical screening criteria, they will be considered for operational use, and their pretest slots will be replaced by other pilot items. In this way, we can continuously try out items throughout the year. Approximately 100 operational

57
items will be added to the item banks for Math and Reading each year for the next four years. They will be calibrated as described above (to ensure the scale remains constant over time), and then new panels will be created as described in Chapter 2.
3. Establishing the MAPT Score Scale
As discussed above, FY07 item parameter estimates were adjusted such that they shared a common metric with FY06 estimates. Once this was accomplished, all FY07 examinee proficiency estimates were expressed on FY06 scale. This calibration process is analogous to the equating processes that occur on non-adaptive test forms. As was done in FY06, FY07 proficiency estimates were adjusted using a nonlinear transformation so that scores could be reported to MAPT users on an easily understood scale, the MAPT score scale, which goes from 200 to 700. Transformations were determined such that the lowest score on the MAPT is 200 (signifying the beginning point of the Beginning Basic EFL); the cut-point between Beginning Basic and Low Intermediate corresponds to a MAPT score of 300, and so on. (The processes for establishing the EFL cut-points are described in Chapter V.) This transformation strategy was chosen entirely to aid in score interpretation; for example, a learner scoring in the 200’s would be classified as performing at EFL 2—Beginning Basic ABE. Figures IV.1 and IV.2 show the transformation functions for MAPT Reading and MAPT Math, respectively. Note that the transformations are highly—but not perfectly—linear within the range of reported scores. To the extent that the transformation is not linear, the theoretical equal interval property of the theta metric will not exist for the MAPT score scale except conditionally in the ranges 201-399, 400-499, and 500-699. This loss of equal intervals across the entire score scale is a consequence of setting proficiency level cut-scores on the MAPT that correspond to the NRS EFLs. For further information on interpreting scores on the MAPT score scale, please refer to Chapter VIII.

58
Figure IV.1. MAPT Scale Score Transformation Function (Reading).
0
100
200
300
400
500
600
700
800
-2.5 -2 -1.5 -1 -0.5 0 0.5 1 1.5 2 2.5
theta
MA
PT
for R
ead
ing S
cale
d S
core
l
Figure IV.2
MAPT Scale Score Transformation Function (Mathematics and Numeracy).
100
200
300
400
500
600
700
800
-2.5 -2 -1.5 -1 -0.5 0 0.5 1 1.5 2 2.5
theta
MA
PT
for
Ma
them
atic
s a
nd N
ume
racy
Sca
led
Sco
re
j

59
V. Standard Setting: Establishing the NRS Educational Functioning Levels
As mentioned in Chapter I, a primary purpose of the MAPT is to measure learners’ educational gains for both evaluation of individual learners’ progress and for program accountability. In the National Reporting System (NRS), educational gain is a core outcome measure that is defined by a set of Educational Functioning Levels (EFLs). There are six EFLs defined in the NRS that relate to Mathematics and Reading—Beginning ABE Literacy, Beginning Basic Education, Low Intermediate Basic Education, High Intermediate Basic Education, Low Adult Secondary Education, and High Adult Secondary Education (Division of Adult Education and Literacy (DAEL), 2006). Under the NRS, learners’ educational gains are measured by comparing their pretest EFL with their posttest EFL. The following excerpt from the NRS illustrates this framework for measuring gain.
The NRS approach to measuring educational gain is to define a set of educational functioning levels at which students are initially placed based on their abilities to perform literacy-related tasks in specific content areas. After a set time period or number of instructional hours set by the State, students are again assessed to determine their skill levels. If their skills have improved sufficiently to be placed one or more levels higher, an “advance” is recorded for that student. (DAEL, 2006, p. 13)
Descriptions of the NRS EFLs that pertain to the MAPT are provided in Exhibit V.1. These descriptions were the focal point of the MAPT standard setting process. At the beginning of each standard setting study, the participants reviewed the NRS EFL Descriptors and discussed how those skills related to the skills within the curriculum frameworks. The participants agreed that the EFLs mapped to the Framework learning levels and building on the foundation of the EFL descriptors in Exhibit V.1, the participants added more details about the skills associated with each NRS level. These expanded NRS EFL descriptors can be found in Appendix D.
For the MAPT to be useful for measuring educational gain within the NRS, cut-scores on the MAPT score scale are needed to demarcate the NRS EFLs. To establish these cut-scores, standard setting studies were conducted using standard setting panels consisting of experts in math and reading instruction for adult learners. Separate studies were conducted for the MAPT for Mathematics and Numeracy and the MAPT for Reading. Two initial studies were conducted in May 2006—one for Math and one for Reading—and the methodology used was the same across studies. Since the MAPT for Reading was extended in 2007 to better measure learners at the two highest EFLs (i.e., new content was added for Low and High Adult Secondary learners) an additional study was conducted for Reading in 2007. The final EFL cut-scores were based on data from all studies and consideration of measurement error. Before describing the specific processes used to set EFL standards on the MAPT scale, we first present a discussion of standard setting in general, and then a discussion of the specific methods we used. We then summarize the results of the three standard setting studies.

60
Exhibit V.1
NRS Educational Functioning Level Descriptions
LLiitteerraaccyy LLeevveell Basic Reading Numeracy Skills Beginning Basic Education
Individual can read simple material on familiar subjects;
Comprehend simple and compound sentences in single or linked paragraphs containing a familiar vocabulary.
Individual can count, add, and subtract three digit numbers
Can perform multiplication through 12 Can identify simple fractions Perform other simple arithmetic
operations. Low Intermediate Basic Education
Individual can read text on familiar subjects that have a simple and clear underlying structure (e.g., clear main idea, chronological order);
Can use context to determine meaning; Can interpret actions required in specific
written directions.
Individual can perform with high accuracy all four basic math operations using whole numbers up to three digits
Can identify and use all basic mathematical symbols.
High Intermediate Basic Education
Individual is able to read simple descriptions and narratives on familiar subjects or from which new vocabulary can be determined by context;
Can make some minimal inferences about familiar texts;
Compare and contrast information from such texts but not consistently.
Individual can perform all four basic math operations with whole numbers and fractions
Can determine correct math operations for solving narrative math problems
Can convert fractions to decimals and decimals to fractions
Can perform basic operations on fractions.
Low Adult Secondary Education
Individual can comprehend expository writing and identify spelling, punctuation, and grammatical errors;
Can comprehend a variety of materials such as periodicals and nontechnical journals on common topics;
Can comprehend library reference materials;
Can identify the main idea in reading selections;
Use a variety of context issues to determine meaning.
Individual can perform all basic math functions with whole numbers, decimals, and fractions
Can interpret and solve simple algebraic equations, tables, and graphs
Can develop own tables and graphs Can use math in business transactions.
High Adult Secondary Education
Individual can comprehend, explain, and analyze information from a variety of literacy works, including primary source materials and professional journals;
Can use context cues; Can use higher order processes to interpret
meaning of written material.
Individual can make mathematical estimates of time and space
Can apply principles of geometry to measure angles, lines, and surfaces
Can also apply trigonometric functions.
Adapted from exhibit 2.1 of the DAEL (2006) Implementation guidelines.

61
1. Standard Setting Methods
Standard setting is the process of dividing a continuous variable, such as a test score scale, into a discrete variable with two or more categories (sometimes referred to as performance or achievement levels). The demarcations between these categories are characterized by cut-scores, which are points along the continuum that divide one category from another. Many different methods exist for setting cut scores (or standards) on educational tests (see Cizek, 1996, 2001; Hambleton, 2001; or Hambleton & Pitoniak, 2006 for descriptions of a variety of these methods). However, all methods are inherently subjective because there is no “true” standard to discover—that is, the optimal cut score is not simply a parameter to be estimated. Hence, setting standards on educational tests is essentially the establishment of a policy, albeit one that is informed by data. These data are typically in the form of judgments from subject matter experts (standard setting panelists) regarding the knowledge and skills possessed by students at specific proficiency levels and how they are likely to perform on specific items.
For the MAPT, the goal of the standard setting process was to identify cut-scores that
corresponded to these NRS EFLs. Three standard setting studies were conducted to determine the best cut-scores for demarcating the EFLs on the MAPT score scale. Two studies were done for Reading, and one for Math. The additional study conducted for Reading was due to the need to re-evaluate the initial cut-scores given the extension of the Reading item bank to the Low Adult and High Adult Secondary levels. Before describing the studies and their results, we first describe a framework for evaluating standard setting studies. This framework is helpful for understanding the various types of data gathered and analyzed in setting the NRS EFL cut-scores on the MAPT.
2. Validity Evidence for Standard Setting
Kane (1994, 2001) suggested three types of validity evidence for evaluating standard setting studies—procedural evidence, internal evidence, and external evidence. Procedural evidence “focuses on the appropriateness of the procedures used and the quality of the implementation of these procedures” (Kane, 1994, p. 437). This category of evidence includes the selection of qualified standard setting panelists, appropriate training of panelists, clarity in defining the tasks and goals of the procedure, appropriate data collection procedures, and proper implementation of the method. In reporting the results for the MAPT standard setting, we also include data related to internal validity evidence, which refers to the expected consistency of results, if the study were replicated. One internal validity evaluation criterion is the standard error of the cut-score, although calculation of this standard error is not straightforward due to dependence among panelists’ ratings (i.e., due to discussion) and practical factors (e.g., time and expense in conducting independent replications). Other evidence for internal validity includes evaluation of the variability across panelists within a single study, the degree to which standards are consistent across subsets of items, and the degree to the variability of cut-scores derived from panelists’ ratings decreases across subsequent rounds of the study7.
7 However, Kane (2001) pointed out that interpretations of the variability of panelists’ ratings are not always clear: “A high level of consistency across participants is not to be expected and is not necessarily desirable; participants may have
62
External validity evidence for standard setting refers to the degree to which the
classifications of examinees are consistent with other performance data. Such data are not readily available, but we do report on the relationships among MAPT scores and other measures of learners’ math and reading achievement in Chapter VII, and in this chapter we report data regarding the consistency of the MAPT for Reading cut-scores across two different standard setting methods. External validity evidence for standard setting is hard to gather because the validity of the external data (i.e., the criterion) would need to be established. This problem of the validity of the criterion has been discussed for well over 60 years (e.g., Guilford, 1946; Jenkins, 1946; Toops, 1944).
Kane (1994) described the validation of standard setting as building an argument that the
process was reasonable and leads to defensible decisions. As he put it, The best that we can do in supporting the choice of a performance standard and an associated [cut] score is to show that the [cut] score is consistent with the proposed performance standard and that this standard of performance represents a reasonable choice, given the overall goals of the assessment program. In practice, however, we seldom, if ever, achieve even this goal. A more modest, but realistic goal in most cases is to assemble evidence showing that the passing score and its associated performance standard are not unreasonable. (p. 437)
Given the strong link between the NRS EFLs and the procedure we used to set standards on the MAPT, we believe our results are far better than “not unreasonable.” They represent experienced Massachusetts ABE educators’ consensus judgments of how performance on the MAPT relates to the NRS EFLs.
3. 2006 Standard Setting—The Item Descriptor Matching Method The initial method used to set EFL standards on the MAPT was the Item Descriptor
Matching Method (Ferrara, Perie, & Johnson, 2002, 2008). This method was selected because it focuses on the descriptions of the knowledge and skill levels possessed by learners at each EFL. Like most standard setting methods, the Item Descriptor Matching (IDM) procedure relies on the judgments of subject matter experts who serve as standard setting panelists. The panel reviews descriptions of the achievement level categories of interest (in our case, the EFL descriptions) and discusses the knowledge and skills possessed by students in each category. Next, a booklet of test items is distributed to the panelists for review. The items within the booklet are ordered by their difficulty, which is estimated using item response theory (IRT) (Hambleton, Swaminathan, & Rogers, 1991). That is, the first item appearing in the booklet had the lowest IRT difficulty parameter estimate, and so on, until the last item in the booklet, which had the highest difficulty parameter estimate. This feature of the method is similar to the bookmark standard setting procedure (Karantonis & Sireci, 2006), but the task required of panelists is different, as we explain below. In addition to the item booklet, the content standards and the correct answer for different opinions about performance standards. However, large discrepancies can undermine the process by generating unacceptably large standard errors in the cutscores and may indicate problems in the training of participants.” (p. 73)

63
the item are also provided to the panelists. The task for the panelists is to review each item, consider the knowledge and skills required to correctly answer the item, and then match the item to a proficiency category (EFL). Panelists are trained to complete this task, and after they rate the items independently, they discuss their ratings as a group. Through multiple rounds of discussion, they are invited to change their ratings based on the discussions, if they so desire.
The first step in our application of the IDM method was discussion of the knowledge and
skills possessed by learners in each of the EFLs (see Appendices E and F for standard setting materials). As noted earlier, the participants used the NRS EFL Descriptions as a foundation and expanded those definitions to include the specific skills that related to each of the learning levels (see Appendix D). After explanation of the matching task and discussion, the panelists were asked to review 10 practice items (selected to span the EFLs), answer the items, and check the answer key (to get an appreciation of the item difficulties). Next, they were asked to match each item to an EFL. The specific question presented to the panelists for matching items to EFLs was
To which NRS Educational Functioning Level description are the knowledge, skills, and cognitive processes required to correctly answer this item most closely matched? (i.e., match each item to an NRS Educational Functioning Level.) Following discussion of the practice items, panelists reviewed and rated items within an
item booklet, where the items were ordered by their difficulty (IRT b-parameter) from easiest to hardest. Two 60-item booklets were created, each booklet was developed to represent the content specifications of the tests and to provide an appropriate range of difficulty designed to span the EFLs. Hence, the booklets were parallel with respect to item pool representation and difficulty. We created two booklets to balance our desire to use as many items as possible in deriving the cut-scores and our fear that panelists might not be able to complete their ratings in the amount of time for which we hired them8. This strategy would allow for deriving cut-scores based on at least 60 representative items for each panelist, in case we ran out of time. As described later, all panelists completed both booklets (i.e., all panelists rated 120 items).
Ferrara, et al., (2008) describe the advantages of the IDM procedure relative to other
standard setting methods. One advantage is that the cognitive task does not require probability judgments, but rather relies on content expertise that is more familiar to teachers and others who serve on standard setting panels. Another advantage is that the panelists do not have to make difficult, probabilistic judgments regarding the likelihood that certain types of learners will answer an item correctly at some specific probability level (as is required in the Bookmark and Angoff standard setting methods, Karantonis & Sireci, 2006). In addition, the IDM is ideally suited to the present situation where cut-scores must be set to preexisting achievement level definitions.
Given that IRT provides the statistical framework for the item calibration, scaling, and
scoring architecture for the MAPT (see chapter IV), the IRT item difficulty parameters are on the same scale as learners’ scores9. Therefore, the difficulty parameters for items classified by the
8 For all three standard setting studies, panelists were paid for their participation. 9 In item response theory items and examinees are placed on the same score scale metric, but for reporting purposes,

64
standard setting panelists within each EFL were used to determine the cut-scores signifying the boundaries of each EFL. Specifically, logistic regression was used to calculate the cut-score boundaries between each EFL. Separate regressions were conducted for each cut-score using the equation
p =1
1+ e− (a+bx)
where p=the probability of a panelists’ rating being in a specific EFL or higher for an item with difficulty=x, and a and b are the intercept and slope, respectively, of the logit of p. In this regression, a dichotomous (criterion) variable was created for each panelist’s EFL classification indicating whether it was in a particular EFL or higher (e.g., Beginning Basic ABE, or higher) and the IRT difficulty parameter for each item was used as the predictor. Using these data, the slope and intercept in the logistic regression equation were calculated, and the cut-scores were computed by setting p=.50 (indicating a 50/50 chance of a point on the scale being in either of two adjacent EFLs) and solving for x. The selection of p=.50 means that learners with a proficiency estimate at the cut-score resulting from the calculation (x) have a 50% chance of being in either EFL, and so it is the point that minimizes false positive and false negative errors (Livingston & Zieky, 1989). Logistic regression has been used in this fashion to derive cut-scores in several contexts including those based on contrasting groups (Livingston & Zieky, 1989) and cluster analysis (Sireci, Robin, & Patelis, 1999). Although the process we followed in gathering panelists’ standard setting data closely mirrored the IDM procedure described by Ferrara, et al., (2002, in press), our use of logistic regression departs from their method for calculating the cut-scores. Ferrara, et al., conducted several additional rounds of panelist review and discussion of preliminary results from the IDM and used the panelists to help determine the final cut-score regions from which the standards would be set. We used the logistic regression approach because in our context more than two rounds of discussion were not possible, due to the time and budget available for the study. For example, we did not have six days to set the standards across the two tests as would be required if we exactly followed the Ferrara, et al., procedure. In addition to the time needed to complete such a study, it was not possible to recruit or remunerate the types of panelists we needed (i.e., experienced ABE educators) for a three-day meeting, given their demands as ABE teachers. As described below, the panelists discussed their classifications for over half of the items and so training and discussion were integral parts of our application of the IDM method. To make up for the lack of discussion on the other items and to address specific item ratings that appeared to be way off base relative to the item statistics and majority of panelists’ judgments, we used a data cleaning process to eliminate widely discrepant ratings before applying the logistic regression model. In some standard setting studies extremely discrepant panelists or items are eliminated before calculating cut-scores (Livingston & Zieky, 1982). Our data cleaning did not
such as the MAPT, the scores reported for examinees are usually transformed to a more interpretable scale (which for the MAPT is currently 200-700).

65
eliminate any panelists or items10. Instead, ratings for particular panelists on specific items were omitted. The omit rule was to eliminate the rating from a panelist where inclusion of the rating would place the item in a EFL category in which its IRT difficulty estimate was more than two standard deviations from the mean difficulty of the remaining items in that EFL. This data-cleaning rule was applied for two iterations and led to retention of 90% or more of the rating data.
Setting NRS Cut-scores on the MAPT for Mathematics and Numeracy The previous section described the overall IDM procedure for setting the NRS standards on the MAPT. In this section, we give the specific details in setting standards on the MAPT for Mathematics and Numeracy. Participants Ten subject matter experts served as panelists for setting the NRS standards on the MAPT for Mathematics and Numeracy (see Appendix B for a list of these panelists). Half of the panelists were classroom teachers and the others were administrators or teacher/administrators. Eight of the ten panelists were female. The panelists were recruited through nominations from ACLS. Of the 10 panelists, one taught for just under 5 years, three taught for 5-10 years, three taught for 10-20 years, and three taught for more than 20 years. One panelist was a non-native English speaker, the rest were native speakers of English. Panelists were selected to ensure a representation of expertise across the continuum of ABE students’ learning levels. Two of the 10 panelists felt very comfortable working with students at all of the learning levels and the remaining eight participants were evenly divided between a preference for the lower levels and a preference for the higher levels. Through the training and discussions all the panelists shared their expertise about learners at the different levels.
Special care was also taken to invite panelists from different regions of the state and who taught diverse learner populations. Four of the 10 panelists were from the Eastern region, three were from the Western region, two were from the Central region, and one panelist was from Rhode Island, but worked for years in Massachusetts and consults with ACLS on curriculum issues. The panelists work with learners from a variety of international backgrounds with many non-native English speakers in their ABE classes. The predominant ethnicities of their students include Hispanic/Latino, Haitian, Asian, and African American.
Procedure
10 Several different approaches were considered in calculating the cut-scores, including conducting the logistic regressions separately for each panelist and then averaging their cut-scores and calculating the cut-scores without any data cleaning. However, the other methods we explored were rejected because the approach on which we ultimately decided used most of the data available (all but those eliminated through the cleaning process) and provided the most sufficient estimates of the cut-scores, as well as the estimates most resistant to outliers.

66
In advance of the standard setting meeting, panelists were sent a demographic survey, the MAPT for Mathematics and Numeracy test specifications, and the NRS EFL descriptors for numeracy skills. They were asked to review the EFL descriptors and think about the different types of learners to whom they referred, and to add annotations regarding the types of knowledge and skills possessed by learners at these different levels.
The standard setting meeting was conducted in one day from 8:30 a.m. to 5:00 p.m.
After a welcome, introductions, and overview of the MAPT, a facilitated review and discussion of the EFLs was conducted. Panelists were asked to add specific knowledge and skills to the EFL descriptors that characterized learners at that level. Large flip charts were used to post the embellished (more detailed) descriptors agreed upon by the Panel (see Appendix D). The review and elaboration of the EFLs took about three hours. At the end of this discussion, flip charts for each EFL were hung on the walls of the room and were referred to by panelists throughout the remainder of the meeting.
Next, the panelists were introduced to the item-matching task. They were asked to review
and rate 10 specific items, which were subsequently discussed as a group. This discussion ensured that all panelists were on-task, were using appropriate criteria for making their ratings, and could understand the perceptions and opinions of their fellow panelists. After this step, panelists took a brief lunch break, and then rated the remaining 50 items in Booklet 1 on their own. Items with less than 50% agreement across the panelists regarding the EFL classification were targeted for discussion and all these items, and many others, were discussed. Panelists were invited to revise their ratings for any items based on the group discussions as they regarded necessary. Panelists recorded both the original and revised ratings on the rating forms.
About half of the panelists completed their ratings for Booklet 2 before the meeting ended.
The other panelists took the unfinished pages from Booklet 2 with them and returned them with their ratings within four days of the meeting. All panelists completed their ratings on all 120 items, yielding a data set of 1,200 item/EFL matches (10 panelists X 120 items).
As mentioned earlier, the panelists’ rating data went through a data cleaning procedure
where highly aberrant ratings were eliminated. Specifically, we eliminated a panelist’s rating for an item if it resulted in placing the item into an EFL with a mean difficulty more than 2 standard deviations from the item’s difficulty. This data-cleaning step was necessary to reduce the influence of extreme ratings on the final cut-scores. Using this process, 102 of the 1,200 ratings (8.5%) were omitted before implementing the logistic regression analyses.
Results Using the procedure described above, the cut-score results for the MAPT for Mathematics and Numeracy were calculated for each of the boundaries between the NRS EFLs, with the exception of the lowest (Beginning Literacy vs. Beginning Basic), since the MAPT is not currently available for learners at the Beginning Literacy Level. The results are presented in Table V.1. It should be noted that the cut-scores presented in the 2nd column in Table V.1, are reported on the IRT metric before transformation to the 200-700 MAPT score
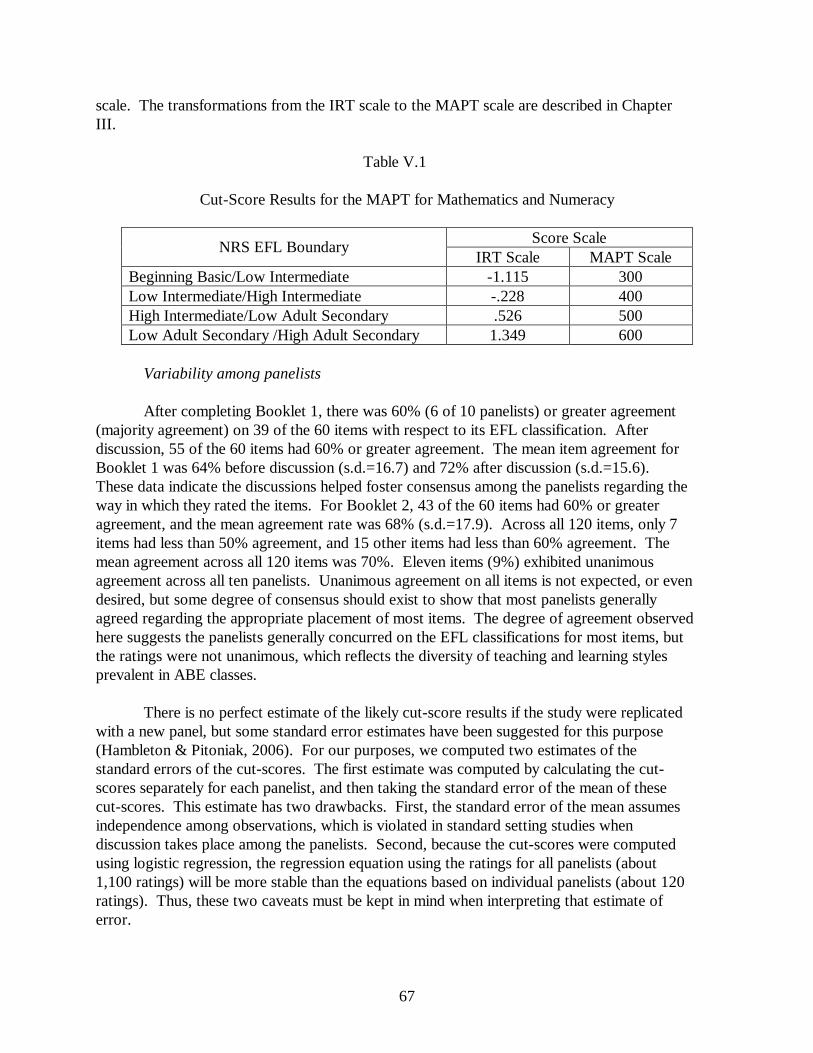
67
scale. The transformations from the IRT scale to the MAPT scale are described in Chapter III.
Table V.1
Cut-Score Results for the MAPT for Mathematics and Numeracy
Score Scale
NRS EFL Boundary IRT Scale MAPT Scale
Beginning Basic/Low Intermediate -1.115 300 Low Intermediate/High Intermediate -.228 400 High Intermediate/Low Adult Secondary .526 500 Low Adult Secondary /High Adult Secondary 1.349 600
Variability among panelists
After completing Booklet 1, there was 60% (6 of 10 panelists) or greater agreement (majority agreement) on 39 of the 60 items with respect to its EFL classification. After discussion, 55 of the 60 items had 60% or greater agreement. The mean item agreement for Booklet 1 was 64% before discussion (s.d.=16.7) and 72% after discussion (s.d.=15.6). These data indicate the discussions helped foster consensus among the panelists regarding the way in which they rated the items. For Booklet 2, 43 of the 60 items had 60% or greater agreement, and the mean agreement rate was 68% (s.d.=17.9). Across all 120 items, only 7 items had less than 50% agreement, and 15 other items had less than 60% agreement. The mean agreement across all 120 items was 70%. Eleven items (9%) exhibited unanimous agreement across all ten panelists. Unanimous agreement on all items is not expected, or even desired, but some degree of consensus should exist to show that most panelists generally agreed regarding the appropriate placement of most items. The degree of agreement observed here suggests the panelists generally concurred on the EFL classifications for most items, but the ratings were not unanimous, which reflects the diversity of teaching and learning styles prevalent in ABE classes. There is no perfect estimate of the likely cut-score results if the study were replicated with a new panel, but some standard error estimates have been suggested for this purpose (Hambleton & Pitoniak, 2006). For our purposes, we computed two estimates of the standard errors of the cut-scores. The first estimate was computed by calculating the cut-scores separately for each panelist, and then taking the standard error of the mean of these cut-scores. This estimate has two drawbacks. First, the standard error of the mean assumes independence among observations, which is violated in standard setting studies when discussion takes place among the panelists. Second, because the cut-scores were computed using logistic regression, the regression equation using the ratings for all panelists (about 1,100 ratings) will be more stable than the equations based on individual panelists (about 120 ratings). Thus, these two caveats must be kept in mind when interpreting that estimate of error.

68
The second estimate of standard error was computed by calculating separate cut-scores based on Booklet 1 and Booklet 2 and dividing the difference between these two separate cut-scores by the square root of 2, as suggested by Brennan (2002). This estimate may overestimate the true standard error, in our situation, for two reasons. First, computing the cut-scores based on 60 items is sure to be less stable than computing it based on 120 items. Second, most of the items in Booklet 2 were not discussed by the panelists, and so there is likely to be less agreement across items not discussed than across random subsets of items. These two standard error estimates for Mathematics and Numeracy are presented in Table V.2. Also presented are the conditional standard errors of measurement for each cut-score. These conditional errors represent the amount of error associated with the score on the IRT scale underlying the MAPT, and so it is important to also consider that measurement error in deciding where the final cut-scores should be placed.
Table V.2
Estimates of Standard Errors for Mathematics and Numeracy Cut Scores (n=10)
NRS EFL Boundary Cut-Score
(IRT Scale) Standard Error:
Method 1 Standard Error:
Method 2 Conditional
SEM Beginning Basic/Low Intermediate
-1.115 0.249 0.021 0.22
Low Intermediate/High Intermediate
-.228 0.054 0.033 0.20
High Intermediate/Low Adult Secondary
.526 0.046 0.120 0.20
Low Adult Secondary /High Adult Secondary
1.349 0.247 0.067 0.19
Notes: Method 1 refers to the standard error of the mean across panelists. Method 2 refers to the difference across cut-scores derived separately for Booklet 1 and Booklet 2. Conditional SEM refers to the standard error of measurement at the cut-point on the theta scale.
As can be seen in Table V.2, the standard errors estimated using either method are
small relative to the widths of the score intervals for each EFL. For all cuts except High Intermediate/Low Adult Secondary, the expected error due to item sampling (Method 2) is lower than the expected error due to sampling panelists. It should be noted that the scale of the cut-scores is based on an IRT metric with a mean of .38 and standard deviation of .70 (based on the subset of 120 items used in the standard setting study). Thus, the standard error estimates based on the standard error of the mean (Method 1) for the Beginning Basic/Low Intermediate cut-score and for the Low Adult Secondary /High Adult Secondary cut-score, represent about one-third of a standard deviation. The estimates based on either method for the other two cut-scores are much lower. The conditional standard error of measurement associated with each cut-score ranges from .19 (Low/High Adult Secondary cut-score) to .22 (Beginning Basic/Low Intermediate).
69
Math standard setting post-meeting survey results The post-meeting survey administered to the panelists inquired about the clarity of the goals of the meeting, adequacy of time spent on specific activities, the degree to which they understood their tasks, and the confidence they had in their ratings. Nine of the 10 panelists indicated the goals of the meeting were “very clear,” with the remaining panelist marking “somewhat clear.” With respect to the NRS EFLs, 7 of the 10 panelists reported they were “very clear,” while the other 3 reported they were “somewhat clear.” When asked how well they understood the rating task, 5 panelists responded “Understood Completely” and 5 panelists responded “Mostly Understood” (the second-highest rating on the scale). Eight of the 10 panelists responded that the time spent discussing the EFLs was “about right,” while the other 2 panelists thought more time was needed. With respect to the amount of time needed to complete their item descriptor matching ratings, 8 of the 10 panelists thought the amount of time was “about right,” and 2 thought more time was needed.
Panelists were also asked “How confident are you that your item ratings will be useful for helping us set cut-points on the MAPT score scale to demarcate the NRS Educational Functioning Levels?” Four panelists responded “Very Confident,” 4 responded “Confident,” and 2 responded “Not Sure.” All panelists indicated they felt comfortable expressing their opinions during the group discussions. When asked about the criteria they used in making their ratings, virtually all panelists used the expected criteria (e.g., EFL descriptions, knowledge and skills measured by the items, group discussions, experience working with students), and 3 panelists listed additional criteria—knowledge of current curriculum, a more holistic view of how an item matches to a level, and reading requirements within an item. The overwhelming conclusions from the panelists’ survey data are that they understood the tasks, had sufficient time to provide their ratings, had confidence in the standard setting data, and enjoyed their experience.
Setting NRS Cut-scores on the MAPT for Reading In this section, we give the specific details regarding the standard setting for the MAPT for Reading, including the specifics regarding the participants and procedures, as well as the results. Participants Eleven subject matter experts served as panelists for setting the NRS standards on the MAPT for Reading (see Appendix B for a list of these panelists). Three panelists were administrators, three were teachers, and four were both teachers and administrators. Eight of the eleven panelists were female. The panelists were recruited through nominations from ACLS based on knowledge of their skills and experience as ABE practitioners in teaching reading. Of the 11 panelists, one taught for less than 5 years, three taught for 5-10 years, five taught for 10-20

70
years, and two taught for more than 20 years. Five of the 10 panelists had additional professional and curriculum development experience. Given the range of ABE learners, panelists were selected to ensure a representation of expertise across the continuum of learning levels. One of the 11 panelists felt very comfortable working with students at all of the learning levels and the remaining ten participants were evenly divided between a preference for the lower levels and a preference for the higher levels. Through the training and discussions all the panelists shared their expertise about learners at the different levels.
Special care was also taken to invite panelists from different regions of the state and who taught diverse learner populations within their ABE classes. Five of the 11 panelists were from the Northeast, five were from the Eastern region, and one was from the Western region. The panelists work with learners from a variety of international backgrounds with many non-native English speakers in their ABE classes and from ethnic backgrounds such as Haitian, Caribbean, Hispanic/Latino, Asian, and African American.
Procedure
In advance of the standard setting meeting, panelists were sent a demographic survey, the MAPT for Reading test specifications, and the NRS EFL descriptors for reading and writing. They were asked to review the EFL descriptors and think about the different types of learners to whom they referred, and to add annotations regarding the types of knowledge and skills possessed by learners at these different levels.
The standard setting meeting was conducted in one day from 8:30 a.m. to 5:00 p.m. The
agenda for the meeting is reproduced in Appendix F. Similar to the math standard setting meeting, after a welcome, introductions, and overview of the MAPT, a facilitated review and discussion of the EFLs was conducted. Panelists were asked to add specific knowledge and skills to the EFL descriptors that characterized learners at that level. Large flip charts were used to post the embellished (more detailed) descriptors agreed upon by the Panel (see Appendix D). The review and elaboration of the EFLs took just over three hours. At the end of this discussion, flip charts for each EFL were hung on the walls of the room and were referred to by panelists throughout the remainder of the meeting.
Next, the panelists were introduced to the item-matching task. They were asked to review
and rate 10 specific items, which were subsequently discussed as a group. This discussion ensured that all panelists were on-task, were using appropriate criteria for making their ratings, and could understand the perceptions and opinions of their fellow panelists. After this step, panelists took a brief lunch break, and then rated the remaining 50 items in Booklet 1 on their own. Items with less than majority agreement across the panelists regarding the EFL classification were targeted for discussion and all these items were discussed. Many other items were also discussed based on panelists’ requests. Following these discussions, panelists were invited to revise their ratings for any items based on the group discussions as they regarded necessary. Panelists recorded both the original and revised ratings on the rating forms.
About half of the panelists completed their ratings for Booklet 2 before the meeting ended.

71
The other panelists took the unfinished pages from Booklet 2 with them and returned them with their ratings within four days of the meeting. All panelists completed their ratings on all 120 items, yielding a data set of 1,320 item/EFL matches (11 panelists X 120 items).
As mentioned earlier, the panelists’ rating data went through a data cleaning procedure
where highly aberrant ratings (i.e., those that placed an item within an EFL with a mean difficulty more than 2 standard deviations from the item’s difficulty) were eliminated. The complete data set consisted of 1,320 ratings (11 panelists X 120 items). After data cleaning, 137 of the 1,320 ratings (10%) were omitted before implementing the logistic regression analyses, which was based on the remaining 1,183 ratings. This data-cleaning step was necessary to reduce the influence of extreme ratings on the final cut-scores. Given that panelists made 120 ratings, we expected that some of them may be off the mark due to fatigue and other factors.
Results Using the procedure described above, the cut-scores for the MAPT for Reading were calculated for each of the boundaries between the NRS EFLs, with the exception of the lowest (Beginning Literacy versus Beginning Basic), since the MAPT is not designed for learners at the Beginning Literacy Level. The results are presented in Table V.3. It should be noted that the cut-scores presented in the 2nd column in the table, are reported on the IRT metric before transformation to the 200-700 MAPT score scale.
Table V.3
Cut-Score Results for the MAPT for Reading
Score Scale NRS EFL Boundary
IRT Scale MAPT Scale Beginning Basic/Low Intermediate -.170 300 Low Intermediate/High Intermediate .378 400 High Intermediate/Low Adult Secondary .938 500 Low Adult Secondary /High Adult Secondary 1.538 600
Variability among panelists
After completing Booklet 1, there was majority agreement (6 of 11 panelists or 55%) on 47 of the 60 items with respect to its EFL classification. After discussion, 56 of the 60 items had majority agreement. The mean item agreement for Booklet 1 was 62% before discussion (s.d.=13.7) and 76% after discussion (s.d.=13.2). These data indicate the discussions helped foster consensus among the panelists regarding the way in which they rated the items. For Booklet 2, 56 of the 60 items had 55% or greater agreement, and the mean agreement rate was 65% (s.d.=13.2). Across all 120 items, only 17 items (14%) had less than 55% agreement. The mean agreement across all 120 items was 70%, which was the same observed for the math test. The degree of agreement observed here suggests there was strong, but not perfect, consensus among the panelists regarding matching the items to EFLs.

72
As described in reporting the results for the Math test, two estimates of the standard
errors of the cut-scores were calculated. These estimates are presented in Table V.4. All standard error estimates were relatively small with the exception of the Low Adult Secondary/High Adult Secondary cut-score. For all cuts except Low/High Adult Secondary, the expected error due to item sampling (Method 2) is lower than the expected error due to sampling panelists (Method 1). This finding makes sense, since at the time of the study there were relatively few items located at that level of the score scale, which is why the second standard setting study for Reading (described below) was done in 2007 (i.e., to re-evaluate the cut-score results from this study). For the results reported in Table V. 4, the scale of the cut-scores is based on an IRT metric with a mean of .54 and standard deviation of .49 (based on the items used in the standard setting study). The conditional standard errors for the cut-scores on the IRT scale range from .18 (Beginning Basic/Low Intermediate) to .22 (Low Adult/High Adult Secondary).
Table V.4
Estimates of Standard Errors for Reading Cut Scores (n=11)
NRS EFL Boundary Cut-Score
(IRT Scale) Standard Error:
Method 1 Standard Error:
Method 2 Conditional
SEM Beginning Basic/Low Intermediate
-.170 0.079 .067 .18
Low Intermediate/High Intermediate
.378 0.055 .011 .19
High Intermediate/Low Adult Secondary
.938 0.057 .034 .20
Low Adult Secondary /High Adult Secondary
1.538 0.394 .775 .22
Notes: Method 1 refers to the standard error of the mean across panelists. Method 2 refers to the difference across cut-scores derived separately for Booklet 1 and Booklet 2. Conditional SEM refers to the standard error of measurement at the cut-point on the theta scale.
Reading post-meeting survey results
The post-meeting survey administered to the panelists inquired about the clarity of the goals of the meeting, adequacy of time spent on specific activities, the degree to which they understood their tasks, and the confidence they had in their ratings (see Appendix G for a copy of the survey). Eight of the 11 panelists indicated the goals of the meeting were “very clear,” and 3 panelists indicated the goals were “clear.” With respect to the NRS EFLs, 9 of the 11 panelists reported they were “very clear,” while the other 2 reported they were “somewhat clear.” When asked how well they understood the rating task, 4 panelists responded “Understood Completely” and 7 panelists responded “Mostly Understood.” All 11 panelists responded that the time spent discussing the EFLs, and the amount of time needed to complete their item descriptor matching ratings, was “about right.”

73
Panelists were also asked “How confident are you that your item ratings will be useful for helping us set cut-points on the MAPT score scale to demarcate the NRS Educational Functioning Levels?” Two panelists responded “Very Confident,” 8 responded “Confident,” and 1 responded “Not Sure.” All panelists indicated they felt comfortable expressing their opinions during the group discussions. When asked about the criteria they used in making their ratings, virtually all panelists used the expected criteria (e.g., EFL descriptions, knowledge and skills measured by the items, group discussions, experience working with students). Two panelists listed other criteria that influenced their ratings. These criteria were (a) specific knowledge of some content that was appearing more challenging (e.g. vowel sounds), (b) past experience reviewing reading assessments. The overwhelming conclusions from the panelists’ survey data are that they understood the tasks, had sufficient time to provide their ratings, had confidence in the standard setting data, and enjoyed their experience.
4. 2007 Reading Standard Setting Study—The Modified Angoff Method
Given that EFL cut-scores were already in place, but there was a need to re-evaluate the Reading cut-scores due to the new items added to the Low and High Adult Secondary levels, it made sense to explore a new method to derive suggested cut-scores (Kane, 1994). We elected to use a variation of the Angoff method (Angoff, 1971; Cizek, Bunch, & Koons, 2004) for this purpose, and to keep the focus of the study on the NRS EFL descriptions. The Angoff method is the most widely used method for setting passing standards on licensure and certification tests (Meara, Sireci, & Hambleton, 2001; Plake, 1998) and it is also popular for setting standards on statewide educational achievement tests (Nellhaus, 2000). In addition, it has a broad research base supporting its use (Hambleton & Pitoniak, 2006).
The Angoff method involves asking panelists to envision “borderline” learners who are
just above the threshold for an EFL. Panelists are asked to think about learners who deserve to be classified into the EFL, but just barely. After discussing the characteristics of these marginally proficient learners, panelists are asked to review each test item and either (a) predict whether a borderline learner will answer the item correctly, or (b) estimate the probability that a borderline learner will answer the item correctly. The estimates provided by the panelists are their “Angoff ratings.” Our implementation of the method used the first option, which is sometimes referred to as the Yes/No method (Impara & Plake, 1997), where “yes” signifies the panelist predicts the borderline learner will correctly answer the item. This modification reduces the cognitive complexity of the panelists’ task because they do not have to make their judgments on a probability scale.
In this modified Angoff method, after panelists provide initial ratings about whether
borderline learners will answer the items correctly, they are given feedback regarding how their ratings compare with other panelists. Following a discussion of this feedback, they are invited to revise their ratings if they desire. Ratings are collected both from the first round along with any revised ratings. Our specific implementation of this procedure is described next.

74
Participants Twelve panelists were recruited to participate in this study. They were all experienced ABE reading teachers and were nominated by the Massachusetts Department of Education to participate in the standard setting process. The panelists were selected to represent different types of students taught, such as students at different learning levels and students of different ethnicities. It was also a goal to select a panel that came from different regions of the State and had ethnic and gender diversity. Unfortunately, there was little ethnic or sex diversity among the SMEs who accepted the invitation to participate. As a result, all panelists were female, with 11 reporting their ethnicity as Euro-American and one reporting her ethnicity as African-American. Procedure The panelists participated in a two-day meeting in which the standard setting (and content validity) data were gathered. A total of 180 items were selected from the bank of 280 items for use in this study. They were assembled into four booklets, each targeted at one of the four EFL boundaries (the continuum of NRS levels Beginning Basic through High Adult Secondary), and each comprising 45 items. The items were selected so that the average difficulty of the items within a booklet (i.e., average IRT b-parameter) corresponded to the cut-points on the IRT proficiency scale that were established through the previous standard setting study (described earlier). The items were also selected for each booklet to approximate the test specifications (i.e., percentage of items at each skill and cognitive level) relevant to the two EFLs adjacent to each cut-score.
Description of standard setting task The panelists first discussed the knowledge, skills, and abilities of students who straddle
the boundary between two EFLs. These students are referred to as “borderline students” and we provided panelists with draft descriptions of these students based on the NRS EFL descriptions. For each EFL border, the panelists discussed the elements of the EFL descriptions that best distinguished between the adjacent EFLs and best characterized the borderline student for each EFL (i.e., the student “just barely” Low Intermediate, etc.). We asked the panelists to consider borderline students to be those whose reading proficiency was “just barely enough” to classify them into the higher of two adjacent proficiency levels. The standards set for each cut-score began with this discussion and the panelists reviewed the draft description for the relevant borderline student and discussed and revised them until there was consensus about the capabilities of the borderline students at each EFL.
After the panelists confirmed they had a clear understanding of the borderline students,
they were introduced to the Yes/No (Angoff) rating task. They were asked to review a test item, answer the item, and then check their answer with the answer key that was provided on a separate sheet of paper. Next, they were asked to consider the knowledge and skills of the borderline student. If they thought the borderline student would correctly answer the item, they were to

75
mark a “Y” (for “yes”) on the Angoff rating form. If they thought the borderline student would not answer the item correctly, they were asked to mark an “N” on the form. A set of 10 items was selected for practice and the facilitator instructed them to consider the difficulty of what was being measured, the attractiveness of the incorrect response options, and the fact that students may answer the item correctly by guessing among reasonable response options. The panelists completed this task for the 10 practice items and discussed them as a group. After it was clear the panelists understood the task, they were asked to review and rate all 45 items in the booklet. When all panelists completed this task, they discussed their ratings as a group. The panelists provided their logic for their Y or N ratings. During these discussions, the panelists were given the rank order of the difficulty of each item out of the set of 45 items in each booklet. This information was used to serve as a “reality check” with respect to their Yes/No ratings.
Following the discussion of each item, the panelists were invited to revise their ratings, if
they wished. We gathered the initial rating for each item as well as the revised rating (if the item was revised) to evaluate the degree to which the discussions fostered consensus among the panelists.
Computing cut scores To compute the cut-scores that demarcated the EFLs, we treated the panelists’ Angoff
ratings as if they were scored responses to these items by a borderline student. We then scored these response strings using the item parameters for the items and the scoring phase of the computer program Bilog3 (Zimowski, Muraki, Mislevy & Bock, 2002). This procedure provided a score for each panelist on the IRT metric, which was then averaged across panelists and converted to the MAPT score scale. That is, the mean “borderline” theta score across panelists was used as the resulting cut-score for each EFL demarcation. Results The cut-scores derived from the study, and their respective standard errors are presented in Table V.5. A comparison of these results to those derived from the 2006 study using the IDM are presented in Table V.6. The Angoff-based standards set in 2007 are slightly higher for all four EFLs. The differences are relatively small for three of the four EFLs (below.2), but the difference for High Intermediate/Low Adult Secondary is larger (.40). The conditional standard errors of measurement range from .15 (Low/High Intermediate cut-score) to .25 (Low/High Intermediate cut-score).

76
Table V.5
Cut-Scores and Corresponding Standard Errors for 2007 Angoff Study for Reading (n=12)
NRS EFL Boundary Cut-Score
(IRT Scale) Standard Error:
Method 1 Conditional
SEM Beginning Basic/Low Intermediate
-.1463 .055 .19
Low Intermediate/High Intermediate
.5538 .095 .15
High Intermediate/Low Adult Secondary
1.329 .089 .20
Low Adult Secondary /High Adult Secondary
1.7025 .102 .25
Notes: Standard error=standard error of the mean across panelists. Conditional SEM=standard error of measurement at the cut-score on the IRT scale.
A comparison of the cut-score results from the 2006 (IDM) and 2007 (Angoff) MAPT for Reading standard setting studies is presented in Table V.6. For each cut-score, an interval is established by adding and subtracting one conditional standard error of measurement on the IRT scale11. The mean difference between the cut-scores is also reported. The largest difference is between the cut-scores for High Intermediate and Low Adult Secondary Education. However, the cut-score intervals from the 2007 study all overlap with the intervals from the 2006 study, which suggests the separate results from the two studies are within the expectations of random measurement error.
Table V.6
Comparing 2006 and 2007 Cut-Score Results
NRS EFL Boundary 2006 Cut-Score Interval (IDM)
2007 Cut-Score Interval (Angoff)
Mean Difference
Beginning Basic/Low Intermediate -.370 < -.170 < .030 -.336 < -.146 < .044 -.024 Low Intermediate/High Intermediate
.188 < .378 < .568 .404 < .554 < .704 -.176
High Intermediate/Low Adult Secondary
.748 < .938 <1.129 1.129 < 1.329 < 1.529 -.391
Low Adult Secondary /High Adult Secondary
1.318 < 1.538 < 1.758 1.453 <1.703 < 1.953 -.165
Note: Cut score intervals were determined by adding and subtracting one conditional standard error of
11 Adding and subtracting one conditional standard error gives an approximately 68% confidence interval for the cut-score, which means if a learner’s “true” score was equal to the cut-score, drawing a confidence interval around her or his observed score would result in an interval that would contain the true score 68% of the time. Subtracting only one standard error is conservative (in many cases a 95% confidence interval is drawn), but we use it here to provide a descriptive comparison, not a statistical one, of how similar the cut-scores are from the separate Reading standard setting studies.
77
measurement from the resulting cut-scores from each study. Summary of MAPT Standard Setting To determine the most appropriate points along the MAPT score scale to set the boundaries for the NRS EFLs, the judgments from 31 adult educators were used and they reviewed hundreds of MAPT items. Due to changes in the MAPT for Reading after the initial study was conducted, an additional study was conducted on that exam. In evaluating the results from these studies, the standard errors of the cut-scores, and the conditional standard errors of measurement were considered. In addition, the widths of the intervals between the cut-scores were considered. Based on all these data, it was decided to implement the cut-scores based on the 2006 studies. The conditional standard errors associated with these cut-scores were relatively small, the widths between the EFL boundaries were relatively evenly spaced, and the cut-scores derived from the 2007 Reading study were within the bounds of the 2006 results, given conservative estimates of measurement error. The internal validity evidence indicated good consensus among the panelists, which suggests the results would likely be replicated across an independent panel if the study were repeated. In addition, the procedural evidence indicated the methods used were sound, the panelists understood their tasks and had confidence in their ratings, and their ratings were generally consistent with one another.
To summarize, the methods for setting cut-scores on the MAPT score scale were specifically designed to ensure the cut-scores corresponded to the EFL descriptions stipulated in the NRS. By using these descriptions as a starting point, and systematically gathering judgments from carefully selected ABE teachers and administrators, who were familiar with the Massachusetts ABE curriculum frameworks and learners at various educational levels, the resulting cut-scores reflect achievement levels that differ from one another in a way that is congruent with the differences among the EFLs described in the NRS.

78
VI. Measurement Precision
The reliability of a test score is an estimate of the consistency or stability of the score. If a given test yields widely discrepant scores for the same individual on separate testing occasions, and the individual did not change on the proficiency measured, then the test scores are not reliable. As described by Anastasi (1988):
Reliability refers to the consistency of scores obtained by the same persons when reexamined with the same test on different occasions or with different sets of equivalent items, or under other variable examining conditions. This concept of reliability underlies the computation of the error of measurement of a single score, whereby we can predict the range of fluctuation likely to occur in a single individual’s score as a result of irrelevant, chance factors. (p. 109)
Reliability is inversely related to the amount of measurement error associated with test scores, and so it is an important index of test quality. Clearly, if a person’s test score on different occasions changes dramatically according to unintended variations in the testing process, little faith can be put into a particular score obtained on a particular day. For this reason, reliability has been described as a “…necessary, but not sufficient condition for validity” (Nunnally, 1978, p. 192). A great deal of statistical theory has been developed to provide indices of the reliability of test scores as well as measures of measurement error throughout the test score scale. Classical test theory defines reliability as the squared correlation between observed test scores and their unbiased values (“true scores”). Reliability indices typically range from zero to one, with values of .80 or higher signifying test scores that are likely to be consistent from one test administration to the next. Reliability indices are based on “classical” theories of testing, which are somewhat re-conceptualized in modern measurement theory, such as IRT, that characterizes measurement precision in terms of test information and conditional standard error. In this chapter, we describe measurement error within an IRT context and present estimates of the precision of MAPT scores in terms of (a) test information, (b) conditional standard error, (c) decision consistency, and (d) decision accuracy.
1. Test Information
In IRT, the classical concept of reliability is extended and replaced by the concept of test information. Test information takes into account the lack of uniformity in reliability across the proficiency scale. Using the 1PL IRT scale on which MAPT scores are calculated, test information can be computed as
I (θ) =D2
eD (θ −bi )[1+ e−D(θ −bi ) ]2i=1
n
∑ [VI.1]

79
where )(θI is the information function, θ is examinee proficiency, ai, bi, and ci are the IRT discrimination, difficulty,and pseudo-guessing parameters, respectively, for item i, n is the test length, D is a scaling constant equal to 1.7, and e is the base of the natural logarithm (Hambleton, Swaminathan, & Rogers, 1991). It is evident from equation VI.1 that given a fixed length test and a fixed ai and ci, information is maximized when item difficulty (bi ) equals proficiency (θ ). It is this very property that makes adaptive testing so attractive: by targeting items to learners’ proficiencies, measurement information is maximized.
As described earlier, the concept of a test form does not really apply to MST, but we can think of the paths learners travel when taking the MAPT as forms in some sense. The most important paths, and the most popular (Kaira & Sireci, 2007), are the straight paths where a learner starts at one level and remains at that level throughout the exam. These paths are described as important because they reflect the content specifications designed for learners at that level and are influential in assembling the panels. Thus, it makes sense to evaluate the test information functions for these paths. Figures VI.1 and VI.2 show the observed test information functions ( )(θI ), for the straight paths taken by learners on the MAPT for Math and the MAPT for Reading based on the current 6-stage MST design. The functions illustrate high levels of information throughout the majority of the theta scale, with less information at the upper and lower ends, which is typical of educational assessments.
As information increases, measurement precision increases. Figure VI.3 illustrates this relationship by plotting test information against the standard error of estimation (of learner proficiency). It can be seen that the standard error of estimation stabilizes when information is in the range of about 20-25.
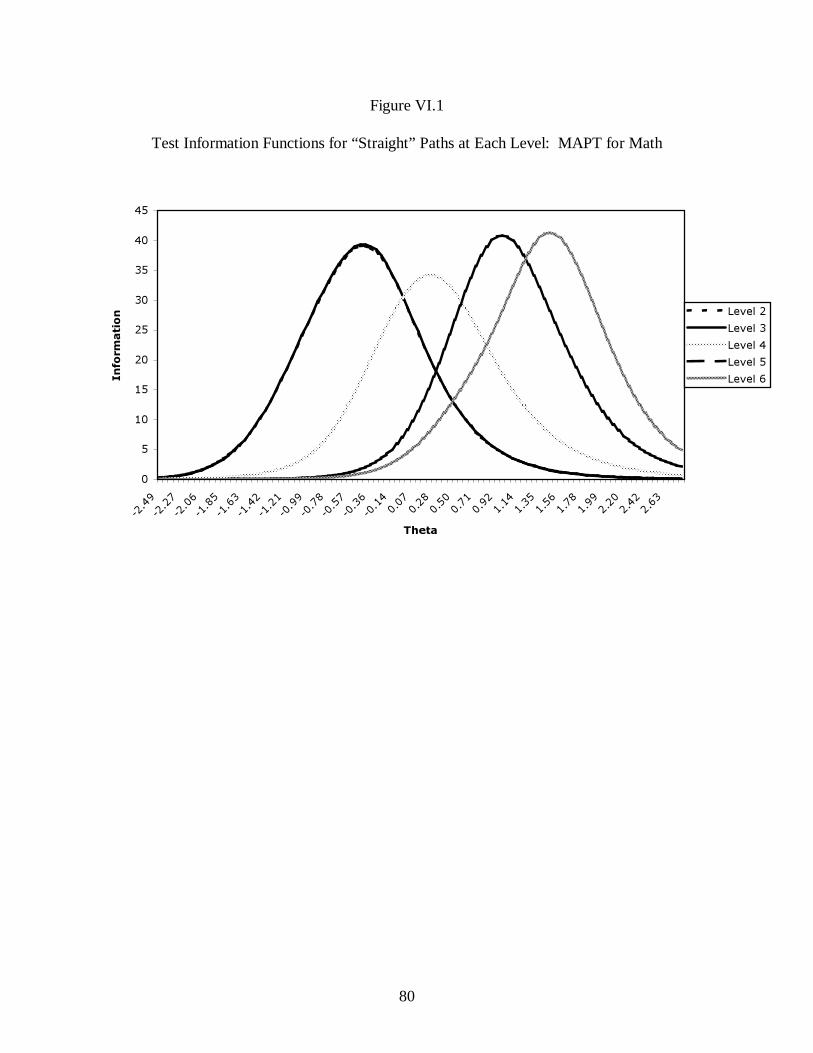
80
Figure VI.1
Test Information Functions for “Straight” Paths at Each Level: MAPT for Math
0
5
10
15
20
25
30
35
40
45
- 2. 4 9
- 2. 2 7
- 2. 0 6
- 1. 8 5
- 1. 6 3
- 1. 4 2
- 1. 2 1
- 0. 9 9
- 0. 7 8
- 0. 5 7
- 0. 3 6
- 0. 1 4 0 . 0
70 . 2
80 . 5
00 . 7
10 . 9
21 . 1
41 . 3
51 . 5
61 . 7
81 . 9
92 . 2
02 . 4
22 . 6
3
Theta
Info
rmat
ion Level 2
Level 3Level 4Level 5Level 6
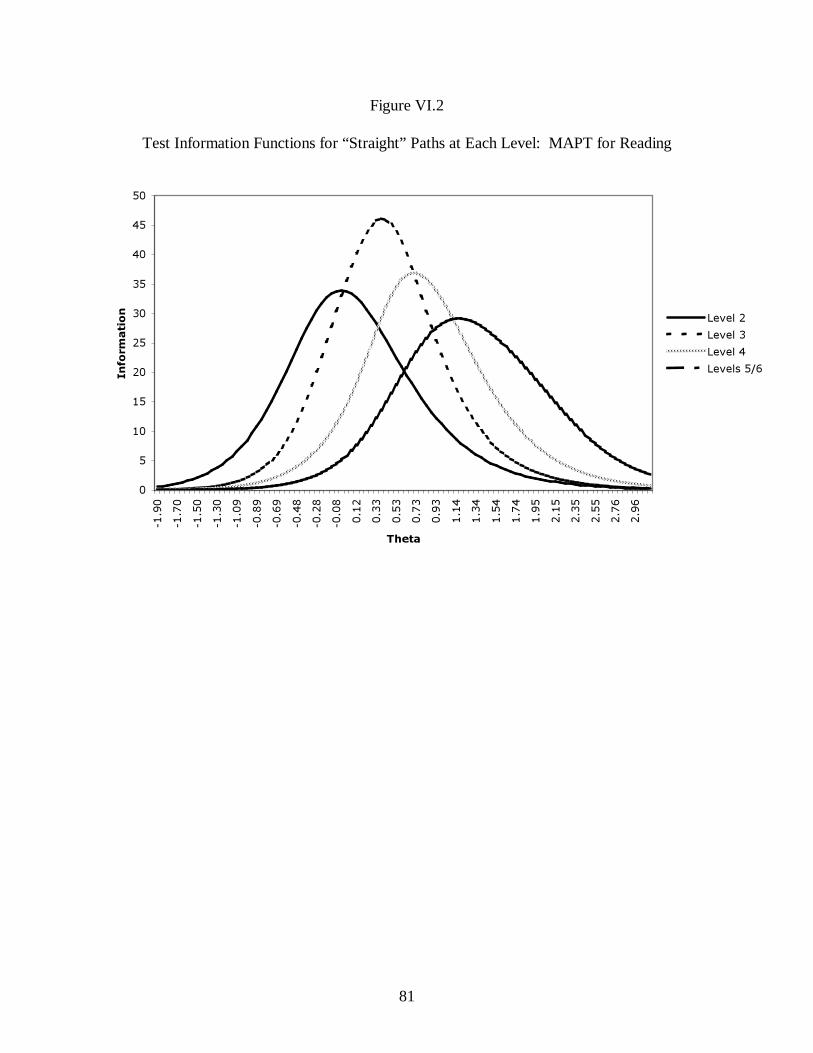
81
Figure VI.2
Test Information Functions for “Straight” Paths at Each Level: MAPT for Reading
0
5
10
15
20
25
30
35
40
45
50
-1.9
0-1
.70
-1.5
0-1
.30
-1.0
9-0
.89
-0.6
9-0
.48
-0.2
8-0
.08
0.12
0.33
0.53
0.73
0.93
1.14
1.34
1.54
1.74
1.95
2.15
2.35
2.55
2.76
2.96
Theta
Info
rmat
ion Level 2
Level 3Level 4Levels 5/6

82
Figure VI.3
Test Information vs. Standard Error of Measurement for Proficiency
0
0.2
0.4
0.6
0.8
1
1.2
1.4
1.6
1.8
2
0 5 10 15 20 25 30
Test Information
SE
M
2. Conditional Standard Error of Estimation Conditional standard error refers to estimates of measurement error at specific points
along the score scale. Test information and conditional standard errors of estimation ( SE()θ ) ) are
inversely related as
( ) ( )21
θθ
SEI = [VI.3]
where ( )θSE is standard error of estimation for a given examinee proficiency estimate
)
θ . Figures VI.4 (a-c) and VI.5 (a-c) provide scatterplots for Mathematics and Numeracy and Reading, respectively, that illustrate the standard errors of estimation for the MAPT broken out by administration. For each subject area, the first scatterplot shows the standard errors for first-time test takers, the second scattterplot is data from examinees’ second MAPT administration, and the third scatterplot contains information about standard errors from the third time examinees’ took the test. The standard errors are generally low for the second and third test administrations—the vast majority are below 0.30. For the first test administration, most are below 0.30, but there are many above that threshold, particularly at the upper end. This increased error could be due to misplacement of students with respect to starting point the first time they take the MAPT. It is interesting to note that the estimates of error decrease for subsequent administrations of the MAPT in both subject areas.

83
Figure VI.4a
Standard Error of Estimation vs. Proficiency (Mathematics and Numeracy, First Administration)
Figure VI.4b
Standard Error of Estimation vs. Proficiency (Mathematics and Numeracy, Second Administration)

84
Figure VI.4c
Standard Error of Estimation vs. Proficiency (Mathematics and Numeracy, Third Administration)
Figure VI.5a
Standard Error of Estimation vs. Proficiency (Reading, First Administration)

85
Figure VI.5b
Standard Error of Estimation vs. Proficiency (Reading, Second Administration)
Figure VI.5c
Standard Error of Estimation vs. Proficiency (Reading, Third Administration)

86
3. Decision Consistency and Decision Accuracy
In addition to providing a score on the 200-700 score scale, the MAPT classifies learners
into one of five Educational Functioning Levels. As discussed elsewhere in this report (e.g., Chapter V), under the NRS, learners’ educational gains are measured by comparing their pretest EFL with their posttest EFL. For this reason, decision accuracy is of particular interest—perhaps even more so than conditional standard errors of measurement, although the two are highly related.
Hambleton and Novick (1973) introduced the topic of decision consistency (DC) as the
consistency of examinee decisions resulting from either two administrations of the same examination or from parallel forms of an examination. This concept is akin to the index of reliability that reflects the consistency of classifications across repeated testing. Decision accuracy (DA) can be thought of as the extent to which the observed classifications of learners agree with their true classification. Estimates of decision accuracy compare the classifications into which learners are placed based on their test score with an estimate of their “true” classification. However, because learners’ true proficiencies are never known, simulation studies or some type of split-half estimate (Livingston & Lewis, 1995) are typically used to estimate decision accuracy. To provide estimates of the decision accuracy for the MAPT, a simulation study was conducted before the MAPT became operational. This study, reported in the previous version of this manual (Sireci et al., 2006) focused on the 200-500 scale score range for the MAPT and predicted DA rates of .83 and .77 for the MAPT for Mathematics and Numeracy and MAPT for Reading, respectively, within that score interval.
Given that the MAPT has been operational for one year, we analyzed the data from
learners who took the MAPT in fiscal 2007 to calculate both decision consistency and decision accuracy estimates. In this section, we describe the methods used to estimate these indices and we report the results. Estimating Decision Consistency and Decision Accuracy Using IRT
Rudner (2001, 2004) proposed a method for estimating DA using IRT and noted that for
any given true scoreθ , the corresponding observed scoreθ̂ is expected to be normally distributed,
with a mean θ and a standard deviation of ˆ( )seθ . The probability of an examinee with a given
true scoreθ of having an observed score in the interval [ ]ba, (an interval between two cut scores) on the theta scale is then given by
ˆ( | )
ˆ ˆ( ) ( )
b ap a b
se se
θ θθ θ φ φθ θ − −< < = − (2)
where )(Zφ is the cumulative normal distribution function. He noted further that multiplying equation (2) by the expected proportion of examinees whose true score is θ yields the expected proportion of examinees whose true score is expected to be in interval[ ]ba, , and summing or
integrating over all examinees in interval [ ]dc, (an interval between two cut scores) gives us the

87
expected proportion of all examinees that have a true score in [ ]dc, and an observed score
in[ ]ba, . If we are willing to make the assumption that the examinees’ true scores ( )θ are normally
distributed, the expected proportions of all examinees that have a true score in the interval [ ]dc,
and an observed score in the interval [ ]ba, are given by
=<<∑=
)()|ˆ( θθθθ
fbaPd
c
( )ˆ ˆ( ) ( )
d
c
b a
se seθ
θ θ
θ µθ θφ φ δθ θ=
−− −− Φ ∑ , (3)
where )(θse is the reciprocal of the square root of the Test Information Function at theta, which is the sum of the Item Information Function, and f(θ) is the standard normal density function ( )ZΦ (Rudner, 2004).
Rudner’s (2001, 2004) method involves four steps. First, the cut-scores are transformed from the raw score scale to the theta score scale. This step can be implemented by mapping each cut-score to a corresponding θ score via the TCC of the test (not relevant to the MAPT, where the cut-scores are already on the theta scale). Next, a K-by-K classification contingency table is set up using the categories for the observed scores as the rows and the categories for the true scores as the columns or vice versa. Next, the elements of the contingency table that are conditional probabilities are calculated as follows:
θθθθθθ
θ
dfppi
jc
jc
i ccij )()ˆ(1
1∫−
−
<≤=, where .0,0 kjki <<<< (4)
When ji = ,
θθθθθθ
θ
dfppi
ic
ic
i ccii )()ˆ(1
1∫−
−
<≤= . (5)
Finally, the overall DA index is calculated as the sum of the diagonal elements in the contingency table.
Li (2006) extended Rudner’s (2001, 2004) approach to provide an estimate of decision consistency (DC) in addition to DA. She also proposed a new set of methods for calculating DA and DC on the test score metric, and illustrated how they could be applied in an operational setting. To estimate DC, she posited a parallel to equation (2) to estimate the probability of an examinee with a given true score θ of having an observed score in an interval [ ],c d , on an
independent, parallel administration of the test. That is,
ˆ( | )ˆ ˆ( ) ( )
d cP c d
se se
θ θθ θ φ φθ θ − −< < = − . (6)
Since the responses to the two tests are independent, the probability of an examinee with a given

88
true scoreθ of having an observed score in the interval [ ]ba, on the first administration of the test
and in the interval [ ],c d on the second administration of the test is given by:
ˆ ˆ( | )* ( | )
{ }*{ }ˆ ˆ ˆ ˆ( ) ( ) ( ) ( )
P a b P c d
b a d c
se se se se
θ θ θ θθ θ θ θφ φ φ φθ θ θ θ
< < < < = − − − −− −
(7) By extending this logic to all candidates in the test, or to the entire theta scale range, as formulated in equation 8, we arrive at the expected proportions of all examinees who have observed scores in the interval [ ],a b on one form and observed scores in the interval [ ],c d on
the other form:
ˆ ˆ( | )* ( | ) ( )P a b P c d f dθ
θ θ θ θ θ θ+∞
=−∞
< < < < =∫* ( )
ˆ ˆ ˆ ˆ( ) ( ) ( ) ( )
b a d cd
se se se seθ
θθ
θ µθ θ θ θφ φ φ φ θδθ θ θ θ+∞
=−∞
−− − − − − − Φ ∫ , (8)
where )(θse is the reciprocal of the square root of the Test Information Function (TIF) at theta, which is the sum of the Item Information Function, and as in the Rudner method for the consistency accuracy, f(θ) is still the standard normal density function ( )ZΦ . Whena c= , and b d= , the above formula gives the DC index. Based on the DA/DC program developed by Li (2006), all the unique items in the item pool for fiscal 2007 were used in estimating DA and DC (i.e., 277 unique Mathematic items and 212 unique Reading items). The results of these analyses are presented in Tables VI.1 through VI.4.
The DC results for Math are reported in TableVI.1. The main diagonal of the table
illustrates the proportion of learners consistently classified into the same EFL. Summing the diagonal entries (bolded in the table) gives the overall DC estimate, which is about .83. This finding indicates 83% of the learners were consistently classified into the same EFL (i.e., 83% of learners would be classified the same were they to immediately take a parallel form). The largest proportion misclassified was .029, which represented the proportion of Low Intermediate learners misclassified as High Intermediate, and High Intermediate students misclassified as Low Intermediate. No learners were misclassified more than one EFL.
The DA results for Math are reported in Table VI.2. The results indicate that about 88%
of the learners were accurately classified into their “true” EFL. The “false positive” (learners misplaced in a higher EFL) and “false negative” (learners misplaced into a lower EFL) are relatively small, and were not predominately in one direction. In general, these findings are encouraging and indicate the EFL classifications based on the MAPT for Math are reliable.

89
Table VI.1
Decision Consistency Estimates for MAPT for Math
Actual Form Hypothetical (Parallel)
Form Beginning
Basic Low
Intermediate High
Intermediate Low Adult Secondary
High Adult Secondary
Total
Beginning Basic .117 .017 .000 .000 .000 .134 Low Intermediate .017 .230 .029 .000 .000 .276 High Intermediate .000 .029 .234 .026 .000 .289
Low Adult Secondary .000 .000 .026 .171 .014 .210 High Adult Secondary .000 .000 .000 .014 .077 .090
Total .134 .276 .289 .210 .090 1.000 DC Estimate .829
Kappa .777
Table VI.2
Decision Accuracy Estimates for MAPT for Math
Observed Score
True Score Beginning
Basic Low
Intermediate High
Intermediate Low Adult Secondary
High Adult Secondary
Total
Beginning Basic .121 .013 .000 .000 .000 .134 Low Intermediate .011 .244 .021 .000 .000 .276 High Intermediate .000 .020 .251 .018 .000 .289
Low Adult Secondary .000 .000 .019 .183 .009 .210 High Adult Secondary .000 .000 .000 .010 .080 .090
Total .132 .278 .290 .211 .089 1.000 DA Estimate .879
False + .060 False - .061
The DC results for Reading are reported in TableVI.3. The overall DC estimate is about
.81. This finding indicates 81% of the learners were consistently classified into the same EFL. The largest proportion misclassified was .032, which represented the proportion of Beginning Basic learners misclassified as Low Intermediate, and Low Intermediate students misclassified as Beginning Basic. No learners were misclassified more than one EFL. The DA results for Reading are presented in TableVI.4. Overall, the DA rate was .87, indicating about 87% of the learners were accurately placed into their EFL. Like Math, the false positive and false negative rates were small, and were not predominately in one direction.

90
TableVI.3
Decision Consistency Estimates for MAPT for Reading
Actual Form Hypothetical (Parallel)
Form Beginning
Basic Low
Intermediate High
Intermediate Low Adult Secondary
High Adult Secondary
Total
Beginning Basic .401 .032 .000 .000 .000 .433 Low Intermediate .032 .152 .030 .000 .000 .214 High Intermediate .000 .030 .127 .022 .000 .178
Low Adult Secondary .000 .000 .022 .079 .012 .112 High Adult Secondary .000 .000 .000 .012 .052 .064
Total .433 .214 .178 .112 .064 1.000 DC Estimate .811
Kappa .737
Table VI.4
Decision Accuracy Estimates for MAPT for Reading Observed Score
True Score Beginning
Basic Low
Intermediate High
Intermediate Low Adult Secondary
High Adult Secondary
Total
Beginning Basic .410 .022 .000 .000 .000 .433 Low Intermediate .022 .171 .021 .000 .000 .214 High Intermediate .000 .022 .142 .014 .000 .178
Low Adult Secondary .000 .000 .016 .088 .007 .112 High Adult Secondary .000 .000 .000 .009 .055 .064
Total .433 .214 .179 .112 .062 1.000 DA Estimate .866
False + .065 False - .069
In general, the DC and DA results for the MAPT for Math and the MAPT for Reading are encouraging. The estimates for both Reading and Math are at or above those observed in many K-12 statewide testing programs. For example, the DA for the Massachusetts Comprehensive Assessment System (MCAS) 2004 Grade 10 English Language Arts Exam is .76, and for the 2004 Grade 10 Mathematics Exam it is .80 (Massachusetts Department of Elementary and Secondary Education, 2005).

91
VII. Validity According to the Standards for Educational and Psychological Testing (AERA, APA, NCME, 1999), “validity refers to the degree to which evidence and theory support the interpretations of test scores entailed by proposed uses of tests” (p. 9). In other words, validity is the extent to which the inferences (interpretations) derived from test scores are justifiable from both scientific and equity perspectives. For decisions based on test scores to be valid, the use of a test for a particular purpose must be supported by theory and empirical evidence, and biases in the measurement process must be ruled out. Much of the information contained in earlier chapters of this manual pertains to the validity of inferences derived from MAPT scores. Validity starts with careful and comprehensive definition of the domain to be tested (Chapter II), continues with sound test construction procedures that include several quality control checks and concerns for fairness (Chapter III), and includes adherence to technical quality in item calibration and scaling (Chapter IV), and standard setting (Chapter V). With respect to standard setting, explicit information supporting the validity of the MAPT cut-scores for the NRS EFLs was presented in Chapter V. In this chapter, we present additional information to support the use of the MAPT for the purposes for which these exams were intended. Before presenting specific validity evidence, we first provide some background on validity theory and test validation.
1. Understanding Validity and Validation From the outset, it is important to bear in mind that validity is not an intrinsic property of a test. As many psychometricians have pointed out (e.g., Cronbach, 1971; Messick, 1989; Shepard, 1993), in judging the worth of a test, it is the inferences derived from the test scores that must be validated, not the test itself. Therefore, the specific purpose(s) for which test scores are being used must be considered when evaluating validity. Contemporary definitions of validity borrow largely from Messick (1989) who stated “validity is an integrated evaluative judgment of the degree to which empirical evidence and theoretical rationales support the adequacy and appropriateness of inferences and actions based on test scores or other modes of assessment” (p. 13). From this definition, it is clear that validity is not something that can be established by a single study and that tests cannot be labeled ‘valid’ or ‘invalid.’ Given that validity is the most important consideration in evaluating the use of a test for a particular purpose, and such utility can never be unequivocally established, determining that a test is appropriate for a particular purpose is an arduous task. Thus, the following facts about validity should be clear: (a) tests must be evaluated with respect to a particular purpose, (b) what needs to be validated are the inferences derived from test scores, not the test itself, (c) evaluating inferences made from test scores involves several different types of qualitative and quantitative evidence, and (d) evaluating the validity of inferences derived from test scores is not a one-time event; it is a continuous process (Sireci, 2003a, 2003b). In addition, it should be noted that although test developers must provide evidence to support the validity of the interpretations that are likely to be made from test scores, ultimately, it is the responsibility of the users of a test to

92
evaluate this evidence to ensure the test is appropriate for the purpose(s) for which it is being used. Further information regarding the proper interpretation of MAPT scores for adult educators and others who use them is provided in Chapter VIII.
Like all testing programs, appraising the validity of MAPT scores must be evaluated with respect to the intended purposes of the testing program, which were described in Chapter I. Specifically, interpretations based on MAPT scores should be valid for (a) evaluating adult learners’ proficiencies with respect to the knowledge and skills specified in the relevant Massachusetts ABE Curriculum Frameworks, (b) evaluating ABE learners’ educational gains over time, and (c) monitoring instructional quality for state and federal accountability. Factors that might threaten the validity of the use of MAPT scores for these purposes include poor congruence between MAPT items and the standards and objectives they are designed to measure, measurement of knowledge or skills that are extraneous to the subject matter tested, and imprecision in the scale scores and classifications (i.e., EFLs) assigned to learners. Information regarding the precision of MAPT scale scores and EFL classifications was provided in Chapter VI. In this chapter, we present further information in support of the utility and appropriateness of MAPT scores for their intended purposes. Before presenting these descriptions and summaries, some basic terms in test validity and validation are described.
Test Validation To make the task of validating inferences derived from test scores both scientifically sound and manageable, Kane (1992) proposed an “argument-based approach to validity.” In this approach, the validator builds an argument based on empirical evidence to support the use of a test for a particular purpose. Although this validation framework acknowledges that validity can never be established absolutely, it requires evidence that (a) the test measures what it claims to measure, (b) the test scores display adequate precision, and (c) test scores display relationships with other variables in a manner congruent with their predicted properties. Kane’s practical perspective is congruent with the Standards for Educational and Psychological Testing (AERA, et al., 1999), which provide detailed guidance regarding the types of evidence that should be brought forward to support the use of a test for a particular purpose. For example, the Standards state
A sound validity argument integrates various strands of evidence into a coherent account of the degree to which existing evidence and theory support the intended interpretation of test scores for specific uses…Ultimately, the validity of an intended interpretation…relies on all the available evidence relevant to the technical quality of a testing system. This includes evidence of careful test construction; adequate score reliability; appropriate test administration and scoring; accurate score scaling, equating, and standard setting; and careful attention to fairness for all examinees… (p. 17)
The information in this chapter, taken together with the information presented in previous chapters, represents the current validity argument for the MAPT.

93
Gathering validity evidence
To build a validity argument for a test, there are several types of evidence that can be brought forward. Traditionally, the major forms of validity evidence are content validity, criterion-related validity, and construct validity. Content validity evidence involves gathering data from subject matter experts regarding the degree to which the behaviors sampled on the test represent the behaviors the test is designed to measure. Criterion-related validity evidence involves evaluating correlations among test scores and other variables related to the construct measured. Construct validity involves gathering data that show test scores are indicative of the construct measured. Many test theorists (e.g., AERA, et al., 1999; Messick, 1989) consider content and criterion validity to be subcomponents of construct validity because such evidence assists in evaluating test-construct congruence. The current version of the Standards revised these three traditional forms of validity evidence as five sources for validity evidence. These five sources are evidence based on (a) test content, (b) response processes, (c) internal structure, (d) relations to other variables, and (e) testing consequences.
Evidence based on test content refers to traditional forms of content validity evidence such as subject matter expert review and rating of test items and test specifications (Sireci, 1998a, 1998b). Evidence based on response processes refers to “evidence concerning the fit between the construct and the detailed nature of performance or response actually engaged in by examinees” (AERA et al., p. 12). Such evidence can include analyzing data regarding the amount of time it takes examinees to respond to test questions, interviewing test takers about their responses to test questions, systematic observations of test response behavior, and evaluation of the criteria used by judges when scoring performance tasks. Evidence based on internal structure refers to statistical analysis of item and sub-score data to investigate the dimensions measured by an assessment. Such evidence includes factor analysis (both exploratory and confirmatory) and analysis of the fit of IRT models to the observed item response data (Hambleton, 1989). Evidence based on relations to other variables refers to traditional forms of criterion-related evidence for validity such as correlations with external criteria relevant to the attributes measured (e.g., other test scores, grades, supervisor ratings). Finally, evidence based on consequences of testing refers to evaluation of the intended and unintended consequences associated with a testing program. For MAPT scores, evidence of content validity is of paramount importance because these tests are designed to measure instruction as defined by the NRS EFL descriptions, the Massachusetts ABE Curriculum Frameworks, and the test specifications. In fact, it was the lack of congruence between commercially available tests and the Massachusetts ABE Frameworks that motivated development of the MAPT in the first place. For this reason, emphasis on quality test content and congruence among the frameworks, test specifications, and tests have been a priority in conceptualizing and developing these tests. Thus, the first source of evidence we present in the validity argument for the MAPT is evidence based on test content.

94
2. Validity Evidence Based on Test Content In addition to the content reviews that took place for all items (described in Chapter III), four separate content validity studies were conducted—three for the MAPT for Mathematics and Numeracy and one for the MAPT for Reading. In three of the studies, carefully selected subject matter experts were recruited and trained to evaluate test items with respect to their congruence to the test specifications. For each subject area, a traditional content validity study was conducted where subject matter experts (SMEs) were recruited and trained to review and rate test items. A separate alignment study was conducted for Math (Martone, 2007), and an additional study that looked at the content representation of the specific tests taken by learners was also conducted (Kaira & Sireci, 2007). Each study is described below, starting with the two traditional content validity studies.
MAPT Content Validity Studies Participants Thirteen SMEs participated in these studies—6 for the MAPT for Math and 7 for the MAPT for Reading. In addition, three facilitators from UMASS participated in both meetings. Lists of the members of the Content Validity Committees are presented in Appendix B.
The SMEs came from diverse backgrounds with a range of experiences. Both groups described the learners in their ABE classes as coming from very diverse backgrounds including native English speakers and students for whom English is a second language, and cultural heritages such as Euro-American, Hispanic/Latino, African-American, Asian and Cape Verdean. For the math study, five of the SMEs were women. Four of the math SMEs were from eastern Massachusetts, the other two were from the western part of the state. Five of the math SMEs had over 15 years of experience in teaching adult learners; the other SME had 5 years of experience. For the reading study, five of the SMEs were women, and all were from the East and Northeast parts of Massachusetts. Six of the participants had over 10 years of teaching experience; the other panelist had three years of teaching experience. Materials In advance of the meeting, the SMEs were sent the Massachusetts ABE Curriculum Frameworks for Mathematics and Numeracy or for English Language Arts, and the NRS EFL descriptions. For each subject area, two item review booklets were created for each SME. Each page in the booklet contained a screen shot of a MAPT item along with a unique item ID number. The booklets were designed so that all items selected for the study would be reviewed by at least 3 SMEs if there were only time to complete one booklet, and all selected items would be reviewed by all 6 SMEs if there were time to complete both booklets. As described below, all SMEs in both subject areas completed both booklets. For Math, there were 352 items contained in the two booklets. For Reading, there were 240 items across the two booklets. In addition to the item booklets, SMEs were given handouts that described the content
95
strands and cognitive levels (Math test) or the skill areas, cognitive levels, and purposes for Reading (Reading test). Item rating forms were also created for the SMEs to mark their item ratings. The rating forms included the unique item IDs and columns for the SMEs to mark their ratings regarding the content, cognitive, skill, and purpose areas being measured by each item. Math content validity materials are presented in Appendix H and Reading Content Validity materials are presented in Appendix I. An evaluation form was also created for each group of SMEs. Procedure For each subject area, the meeting began with a description of the test, including its purpose, and a description of the content and cognitive (Math) or skill, cognitive, and text type (Reading) dimensions of the test specifications. The relationship of these content specifications to the different NRS EFLs was also discussed. Next, the purpose of the meeting was described and the SMEs were given instructions on how to review and rate the test items. Specifically, they were asked to read each item and consider the knowledge and skills being measured. The Math SMEs were asked to indicate the content strand and cognitive level they thought each item measured. They were instructed to not mark any content strand or cognitive level if they did not think the item matched one of the content strands or cognitive levels in the test specifications or if they could not determine the content strand or cognitive level being measured. For Reading, the SMEs were asked to indicate the skill area, cognitive level, and text type being measured by each item. For both subject areas, the SMEs were not informed of the content specifications for the items and so their judgments were independent appraisals of what they thought the items were measuring. After describing the rating task, the SMEs were asked to rate 10 items that were selected to span the content specifications for each test. These ratings were discussed as a group to make sure that the SMEs understood their task and were using appropriate criteria in making their ratings. After discussing these practice ratings, they individually rated the remaining items in their booklets. As questions arose, they were discussed as a group. After the SMEs rated both booklets, they were given an evaluation form that inquired about their impressions of the meeting and their confidence in the ratings. Data analysis Popham (1992) noted there are no absolute criteria for determining when a test item is adequately “matched” to its intended specifications based on SME rating data. To solve this problem, he recommended use of a 70% criterion for indicating adequate content validity at the item and area levels. That is, if 70% of SMEs match an item to its intended area, it should be considered to be content valid. Sireci (1998a) and O’Neil, Sireci, and Huff (2004) supported use of this criterion for evaluating the content validity of educational assessments. For the MAPT, an item was considered correctly matched to its intended areas (i.e., content strand, cognitive level, skill area, or purpose for reading) if approximately 70% of the SMEs placed the item in area the item was designed to measure. For math, this was operationalized as 4 of the 6 SMEs (67%). For reading, this criterion was operationalized as 5 of 7 SMEs (71%).

96
This (approximately) 70% criterion was used to classify each item as congruent or incongruent with the areas it was designed to measure. In addition, several summary statistics were calculated to summarize the overall content validity of the MAPT item pools and of the different aspects of the test specifications. First, we calculated the percentage of items within each subject area that were unanimously classified in the intended area (i.e., content strand, cognitive level, skill area, or purpose for reading). Second, we calculated the percentage of items in each area that met or surpassed the (approximately 70%) congruence criterion. The percentages of items that did not meet this criterion were also calculated. These summary statistics were broken down by the areas within each dimension of the test specifications to evaluate the content representation of each dimension. In addition to providing summative data regarding content representation, the SMEs’ ratings were also used to reevaluate items with respect to their specifications. In some cases, there was consensus among the SMEs that the item was measuring an area different from the one it was intended to measure. In such cases, the test development team discussed the specifications for the item, and if the team agreed with the consensus ratings of the SMEs, the item was reclassified.
Results
In this section, we present a summary of the results from the content validity study for both the MAPT for Math and the MAPT for Reading. The results are summarized following the traditional means for reporting content validity data; however, virtually all studies of content validity have been conducted on static test forms, not on adaptive tests (Huff & Sireci, 2001). Thus, it should be kept in mind that the results here refer to a pool of items from which the operational versions of the MAPT were assembled. The MST algorithm that delivers sets of test items to adult learners who take the MAPT is designed to represent the content dimensions of each test (see Chapter III). We evaluated the content representation of the different tests taken by adult learners in a separate study (Kaira & Sireci, 2007, described later).
In addition to providing a summary of the content validity studies, the results reported here are also useful for targeting the types of items that will be added to the MAPT item bank in the near future. That is, new items have been constructed to address any noted “shallow” aspects of the item pool. Math Content Validity Results As mentioned earlier, there were 352 items that were reviewed by the 6 Math SMEs. With respect to the content strand dimension, 80% of these items met the congruence criterion. The association between the intended content strand and the strand into which at least 4 SMEs placed the item was statistically significant (X2
(9)=689, p < .001). For the cognitive skill
dimension, 61% of the items met this criterion, and the association between the intended and consensus SME skill level was also statistically significant (X2
(4)=232, p < .001). The relatively
lower congruence observed for the cognitive skill dimension is consistent with previous research

97
in this area (e.g., O’Neil, et al., 2004; Sireci, Robin, Meara, Rogers, & Swaminathan, 2000), which has consistently found that SMEs have trouble distinguishing among cognitive levels because these levels overlap to some extent. Although the overall results generally support the content validity of the MAPT for Mathematics and Numeracy, further breakdown of the results by content strand and cognitive level reveals the relative strengths and weaknesses of the assessment with respect to the congruence of the items to their intended specifications. A summary of the SMEs’ content validity ratings is presented in Table VII.1, which reports the results by content strand. A visual display of these data is presented in Figure VII.1. The Statistics and Probability strand exhibited the highest level of congruence (94%), followed by the Geometry and Measurement Strand (87%) and the Number Sense strand (80%). The Patterns, Functions, and Algebra strand exhibited the lowest level of congruence (53%). The relatively lower congruence of the “Patterns” content strand was primarily due to the fact that 16 of these items (21%) tended to be classified as Number Sense items by the SMEs.
Table VII.1
Summary of SMEs’ Content Validity Ratings by Content Strand: Mathematics and Numeracy
Content Strand # Items % Not
Congruent %
Unanimous % Congruent
Statistics and Probability 89 6% 55% 94% Geometry and Measurement 85 13% 54% 87% Number Sense 102 20% 50% 80% Patterns, Functions, Algebra 76 47% 22% 53%
Total 352 20% 46% 80% Notes: “Not Congruent” refers to items that were matched to the intended content strand by less than 4 of the 6 SMEs. “Unanimous” refers to items matched to the intended strand by all 6 SMEs. “Congruent” refers to items matched by 4-6 SMEs.
Table VII.2 presents a summary of the results for the cognitive dimension. These data are also visually summarized in Figure VII.2. The Knowledge/Comprehension level exhibited the highest congruence (81%) followed by the Application level (71%). The Analysis, Synthesis, Evaluation (ASE) level exhibited much lower congruence (18%). Further inspection of this result found that more than half of the ASE items (46 of 88 items) were classified as Application items by 4 of the 6 SMEs. These results suggest that the distinction between these cognitive levels should be clarified. It is interesting to note that only 3 ASE items had a consensus rating at the lowest cognitive level (Knowledge/Comprehension) and so the poor congruence of the two higher cognitive levels appears to stem from a lack of consensus regarding which of the higher cognitive levels an item belongs (i.e., whether the item is a Application or ASE), and is not due to ASE items measuring only basic knowledge or comprehension. Nevertheless, based on this finding, item writing for the following year focused on writing more ASE items for Math.

98
Table VII.2
Summary of SMEs’ Content Validity Ratings by Cognitive Level: Mathematics and Numeracy
Cognitive Level # Items % Not
Congruent %
Unanimous % Congruent
Knowledge/Comprehension 240 19% 51% 81% Application 156 29% 22% 71% Analysis, Synthesis, Evaluation 88 82% 3% 18%
Total 352 39% 26% 61% Notes: “Not Congruent” refers to items that were matched to the intended cognitive level by less than 4 of the 6 SMEs, “Unanimous” refers to items that were matched to the intended level by all 6 SMEs, and “Congruent” refers to items matched by 4-6 SMEs.
Figure VII.1
# Math SMEs Matching Item to Intended Content Strand
6.005.004.003.002.001.00.00
# SMEs
60.0%
50.0%
40.0%
30.0%
20.0%
10.0%
0.0%
Per
cen
t
SPNS
GM
strand
Note: GM=Geometry & Measurement; NS=Number Sense; P=Patterns, Functions, & Algebra, and S=Statistics & Probability

99
Figure VII.2
# Math SMEs Matching Item to Intended Cognitive Level
6.005.004.003.002.001.00.00
# SMEs
60.0%
50.0%
40.0%
30.0%
20.0%
10.0%
0.0%
Per
cen
t
KC
ASEApp
cog
Note: App=Application; ASE=Analysis/Synthesis/Evaluation; KC=Knowledge/Comprehension
A final summary of the Math content validity results is presented in Table VII.3. In this table, we compare the SMEs’ classifications of the items to the intended test specifications at each test level associated with each EFL. The SMEs’ classifications were highly congruent with the target specifications. All content strands were within 8% of their targets, with Number Sense at the Beginning ABE level being the most deviant (over-represented by 8%). For the cognitive levels, the greatest deviance was at the Low and High Adult Secondary levels where ASE was under-represented by 26% and Application was over-represented by 24%. As mentioned earlier, subsequent item writing for Math targeted ASE skills.

100
Table VII.3 Comparison of Test Specifications with SME Classifications: Mathematics and Numeracy
Beginning Basic
Content Strands Knowledge &
Comprehension Application
Analysis, Synthesis, Evaluation
Actual %
Target %
Number Sense 17 24 2 43% 35% Patterns, Functions, Algebra 6 2 2 9% 15% Statistics and Probability 8 13 5 26% 25% Geometry and Measurement 14 6 2 22% 25%
Actual % 45% 45% 10% Target % 41% 41% 18%
Low Intermediate
Content Strands Knowledge &
Comprehension Application
Analysis, Synthesis, Evaluation
Actual %
Target %
Number Sense 15 22 0 37% 30% Patterns, Functions, Algebra 8 6 1 15% 20% Statistics and Probability 5 15 4 25% 25% Geometry and Measurement 13 11 0 24% 25%
Actual % 41% 54% 5% Target % 35% 45% 20%
High Intermediate
Content Strands Knowledge &
Comprehension Application
Analysis, Synthesis, Evaluation
Actual %
Target %
Number Sense 10 17 1 29% 25% Patterns, Functions, Algebra 3 13 4 20% 25% Statistics and Probability 5 16 8 30% 25% Geometry and Measurement 7 14 0 21% 25%
Actual % 26% 61% 13% Target % 25% 50% 25%
Low and High Adult Secondary
Content Strands Knowledge &
Comprehension Application
Analysis, Synthesis, Evaluation
Actual %
Target %
Number Sense 2 10 0 12% 15% Patterns, Functions, Algebra 12 19 6 37% 30% Statistics and Probability 4 21 6 31% 30% Geometry and Measurement 2 15 4 21% 25%
Actual % 19% 65% 15% Target % 18% 41% 41%
Note: All cell entries represent percentages of items within a test level.

101
Summary of math SMEs’ survey responses
The responses of the math SMEs to the post-meeting survey indicated they understood their tasks and the test specifications, and they believed their ratings would be useful for evaluating the degree to which the items they reviewed measured their intended specifications. In general, they indicated they thought the items represented the content strands and cognitive levels described in the test specifications. In terms of overall perception of the meeting, all of the SMEs reported they enjoyed the meeting and that it was easy for them to express their opinions. Five out of six panelists thought the group discussions were very helpful in the item rating process. In responding to the open-ended survey questions, all of the SMEs thought the content of the test was appropriate for measuring ABE learners’ educational gains in Mathematics and Numeracy. For example, one panelist stated, “In general, I found the items were clearly written and the questions are in alignment with what I know to be in the frameworks.” The SMEs were asked about the range of difficulty represented by the items they reviewed. In general, they thought the items they reviewed adequately represented an appropriate range of difficulty. Two panelists asked to see more ASE type questions and one panelist expressed a desire to see a few more straight computation questions.
The SMEs were also asked about the clarity of the Content Strand and Cognitive Area definitions. They all thought the Content Strand definitions were well written and helpful, but three recommended more extensive review of the frameworks in advance of the meeting to better understand how some topics are defined and categorized (for example, greater than/less than signs and exponents). This comment may explain why there may have been confusion between the Number Sense and Patterns, Functions, and Algebra content strands because some topics in Patterns, Functions, and Algebra intuitively seem like they deal with numbers. Regarding the cognitive levels, all of the SMEs thought the definitions were clear, but four out of the six noted that the ASE level was hard to identify in practice. Summary To summarize the first content validity study for the MAPT for Math, all items were generally perceived as measuring the intended content strands and the intended cognitive levels. The results support the claim that the items represent the content domain defined by the tests specifications, but they also highlighted areas for future improvement. There appeared to be a need to better distinguish between the Application and ASE cognitive levels, but it is clear the SMEs agreed that both lower and higher-level skills were being measured. Another area investigated is why many of the items from the Patterns, Functions, and Algebra strand were perceived as Number Sense items. Follow-up analyses found there was some ambiguity in the curriculum frameworks where topics such as inequality place value, number lines, and general operations expressed as equations were categorized as Patterns, Functions and Algebra; but intuitively seem to be dealing with aspects of number sense. This discrepancy was resolved in the subsequent revision of the objectives within the Math curriculum frameworks (Martone, Goodridge, et al., 2004).

102
Reading Content Validity Results As mentioned earlier, there were 240 reading items reviewed in the content validity study, which represented nearly all of the items identified for potential use in the reading item pool. The content validity results for the reading skill dimension generally indicated a high level of congruence. Ninety percent of the items met or surpassed the congruence criterion (5 of 7 SMEs), and the association between the intended skill and the skill perceived to be measured by the SMEs was statistically significant (X2
(4)=366, p < .001). With respect to the Purposes for
Reading dimension, the overall congruence rating was 65%, and the association between intended purpose and the purpose perceived by the SMEs was also statistically significant (X2
(9)=356, p <
.001). A summary of the results for the Skill Areas is presented in Table VII.4. The Comprehension and Vocabulary & Meaning areas exhibited strong congruence with more than 90% of the items achieving the 5 of 7 SME criterion. The congruence percentage for the Word Recognition area was lower, at 76%. The numbers of SMEs classifying the items in the intended Skill Area is displayed in Figure VII.3. In general, these results show a strong degree of congruence between the skill areas intended to be measured by these items and the SMEs’ perceptions of the skill areas measured by each item.
Table VII.4
Skill Area # Items % Not
Congruent %
Unanimous % Congruent
Comprehension 109 6% 84% 94% Vocabulary & Meaning 76 7% 55% 93% Word Recognition 55 24% 27% 76%
Total 240 10% 62% 90% Notes: “Not Congruent” refers to items that were matched to the intended content strand by less than 5 of the 7 SMEs. “Unanimous” refers to items matched to the intended strand by all 7 SMEs. “Congruent” refers to items matched by 5-7 SMEs.
With respect to the Purposes for Reading dimension, the congruence levels were generally lower, ranging from 85% (Acquire Basic Skills and Word Analysis) to 17% (Perform a Task). These results are summarized in Table VII.5. The very low congruence rating for the Perform a Task purpose is due to 10 of the 36 items being primarily rated as reading to Gain Information, and a split viewpoint on 19 other items between Gain Information and Perform a Task. Figure VII.4 displays the numbers of SMEs classifying the items in the intended Purpose for Reading Area. These results served as the impetus for revisiting the test specifications and clarifying the dimensions used to characterize the MAPT for Reading (Martone, Smith et al., 2006, see Chapter II).

103
Figure VII.3
# Reading SMEs Matching Item to Intended Skill Area
0%
10%
20%
30%
40%
50%
60%
70%
80%
90%
0 1 2 3 4 5 6 7
# SMEs
Per
cen
t Word
Vocab
Comp
Skill
Table VII.5
Summary of Reading SMEs’ Content Validity Ratings by Purpose for Reading
Purpose for Reading # Items % Not
Congruent %
Unanimous % Congruent
Acquire Basic Skills & Word Analysis 55 15% 4% 85% Literary Experience 77 25% 55% 75% Gain Information 72 36% 28% 64% Perform a Task 36 83% 0% 17%
Total 240 35% 27% 65% Notes: “Not Congruent” refers to items that were matched to the intended content strand by less than 5 SMEs. Unanimous” refers to items matched to the intended strand by all 7 SMEs. “Congruent” refers to items matched by 5-7 SMEs.
Figure VII.4

104
# Reading SMEs Matching Item to Intended Purpose for Reading
0%
10%
20%
30%
40%
50%
60%
70%
80%
0 1 2 3 4 5 6 7
# SMEs
Per
cen
t
ABSWA
LE
GI
PT
Purpose
Note: ABSWA=Acquire Basic Skills & Word Analysis; LE=Literary Experience; GI=Gain Information; and PT=Perform a Task.
A final summary of the Reading content validity results is presented in Table VII.6. In this table, we compare the SMEs’ classifications of the items to the intended test specifications at each test level (EFL). The comparisons presented in Table VII.6 indicate very close Skill Area congruence between the percentages of items classified by the SMEs and the percentages in the item pool for Beginning Basic and High Intermediate. At Low Intermediate, there are fewer Word Recognition and Comprehension items than expected and more Vocabulary and Meaning items. For the Purposes for Reading dimension, the congruence is lower at all three levels, primarily due to the under-representation of the Perform a Task purpose at Low Intermediate and High Intermediate. It should be noted that the data presented in Table VII.6 pertain to the entire pool of MAPT for Reading items that were reviewed. Only items meeting the consensus criterion for the skill area became operational and were used in assembling the modules. Thus, the congruence for the items within the operational pool is higher. Furthermore, item writing and

105
pilot-testing activities for 2007 focused on adding longer reading passages to add items appropriate for Low Adult and High Adult secondary learners. These items were reviewed by independent SMEs and only items rated highly congruent to their objectives (i.e., > 4 on a 6-point scale) and classified into the intended content strand became operational.
Table VII.6
Comparison of Initial Test Specifications with SME Classifications: Reading
Beginning Basic Purposes for Reading
Skill Areas Acquire Basic
Skills & Word
Analysis
Literary Experience
Gain Information
Perform Task
Actual %
Target %
Word Recognition 50 0 0 0 50% 50% Vocabulary & Meaning 14 5 7 7 33% 30% Comprehension 0 1 11 5 17% 20%
Actual % 64% 6% 18% 12% Target % 50% 18% 17% 15%
Low Intermediate Purposes for Reading
Skill Areas Acquire Basic
Skills & Word
Analysis
Literary Experience
Gain Information
Perform Task
Actual %
Target %
Word Recognition 12 0 0 0 12% 20% Vocabulary & Meaning 16 12 13 3 44% 30% Comprehension 0 19 22 3 44% 50%
Actual % 28% 31% 35% 6% Target % 20% 30% 30% 20%
High Intermediate Purposes for Reading
Skill Areas Acquire Basic
Skills & Word
Analysis
Literary Experience
Gain Information
Perform Task
Actual %
Target %
Word Recognition 0 0 0 0 0% 0% Vocabulary & Meaning 7 10 11 0 28% 30% Comprehension 0 33 38 1 72% 70%
Actual % 7% 43% 49% 1% Target % 0% 42% 42% 16%

106
Summary of reading SMEs survey responses
The responses of the reading SMEs to the post-meeting survey indicated they understood their tasks and the test specifications, although one SME indicated the directions for the rating task were confusing. Five of the 7 SMEs responded “definitely yes” when asked whether they thought their item ratings would be useful for evaluating the degree to which the MAPT items adequately represented the Reading Skill areas; the other 2 SMEs responded “probably yes.” With respect to the utility of their ratings for evaluating the Purposes for Reading, 3 SMEs responded “definitely yes,” 3 responded “probably yes,” and 1 responded “not sure.” Six of the 7 SMEs indicated they thought the MAPT items generally represented the Reading Skill areas. The other SME thought all Skill Areas were well represented with the exception of the Word Recognition items. Four SMEs thought the different Purposes for Reading were well represented; however, one noted that it was difficult to classify Beginning Basic items with respect to purpose for reading. S/he commented that most of the Beginning Basic items inquiring about word meaning and other facts did not seem to fit any of the listed purposes. The other 2 SMEs were not sure about how well the MAPT items represented the different Purposes for Reading. These results were considered by the MAPT for Reading Test Specifications Revision Committee, which developed new dimensions that could be used to characterize the reading skills of adult learners (Sireci, Martone, et al., 2007). The report from this Committee is being considered by ACLS as they work on revisions to the ELA Curriculum Frameworks.
In terms of overall perception of the meeting, all of the SMEs reported that they enjoyed
the meeting and that it was easy for them to express their opinions. All SMEs indicated the group discussions were very helpful in the item rating process. On the open-ended questions, the SMEs provided several suggestions regarding future revisions of the MAPT for Reading, including (a) adding more “compare/contrast” items, (b) considering additional ways for testing word analysis skills for lower-level learners, and (c) adding items to better measure phonemic awareness and fluency. When asked to comment on the appropriateness of the range of difficulty of the items, 3 SMEs thought the range of difficulty was appropriate, but the other 4 thought more difficult items should be added for learners at High Intermediate and above. As mentioned earlier, item writing activities for the following year targeted the Low Adult and High Adult Secondary levels.
Summary
The content validity study for the MAPT for Reading generally revealed strong congruence among the intended reading skill areas and the areas perceived to be measured by the SMEs. With respect to Purposes for Reading, the results indicate that many of the items measuring Perform a Task were not perceived to be associated with that purpose by the SMEs. The definition of that purpose, and the degree to which it differs from reading to Gain Information has since been studied further and suggested refinements to the test specifications have been proposed (Sireci, Martone et al., 2007) and will be implemented after the MA ABE ELA Curriculum Frameworks are updated. The SMEs’ comments to the survey also suggested that (a) more items should be added to the pool targeted to the higher EFLs and (b) different types of items for measuring word recognition for lower-level learners should be considered. CEA and ACLS have responded to these suggestions by convening committees to revisit the ELA
107
Curriculum Frameworks and MAPT for Reading Test Specifications (see Appendix B).
MAPT for Math Alignment Study
In addition to the content validity studies that took place for each subject area test, an alignment study was also conducted for the MAPT for Math. This study built on the foundation of the content validity study but went into greater depth to examine the match of the assessment items to the underlying objectives specified in the MA ABE Curriculum Frameworks for Mathematics and Numeracy. The study applied Webb’s (1999) alignment criteria. The Webb alignment methodology is a widely used approach to demonstrate that an assessment measures the content and cognitive expectations as expressed in the state standards. The No Child Left Behind legislation requires states to demonstrate that their statewide assessment aligns with the statewide curriculum frameworks. A survey by Martone, Sireci and Delton (2007) contacted 24 Chief State School Officers to discover the method they used to evaluate the alignment of their state tests to the curriculum frameworks in their state. Seventy-nine percent of the responding states used the Webb methodology.
Participants The same six subject matter experts (SMEs) who participated in the MAPT for Math content validity study participated in the alignment study. The facilitator for the study was from the CEA at UMASS.
Procedure
Borrowing from Webb’s (1999) approach to alignment, the study involved three phases. Phase 1 entailed a detailed review of the Math ABE standards where the participants coded each of the 313 objectives across the four test levels based on one of the three cognitive levels required to demonstrate that skill (Knowledge & Comprehension, Application, or Analysis, Synthesis & Evaluation). The codes for each objective were then discussed among the group until a consensus cognitive level was determined for each objective. The discussions and debates required to reach consensus regarding the depth of knowledge categories also helped the participants to have a deeper understanding of the cognitive level terms and how they were operationalized in the objectives.
Phase 2 involved assembling 40-item booklets that represented the “straight” MST paths
at each EFL. The participants reviewed each 40-item test at each EFL and matched each item to one of the three cognitive levels (Knowledge & Comprehension, Application, or Analysis, Synthesis & Evaluation). Next, they were asked to match each item to up to three objectives. Finally, the participants summarized their view of the degree of alignment between the MAPT for Math and the Framework with a five point Likert-type question. Answer choices ranged from Perfect Alignment to Not Aligned in Any Way.
Phase 3 was a videotaped focus group discussion about the alignment results and the overall alignment process. Phases 1 through 3 were conducted over a three-month period.

108
Results from phases 1 and 2 were presented to the participants during Phase 3. Participants discussed these results as well as other possible approaches to data analyses. Data analysis The degree of alignment between the MAPT for Math and the Math ABE Standards was analyzed across four dimensions using average ratings and cutoff criteria proposed by Webb (Webb, Alt, Ely, & Vesperman, 2005). The four alignment dimensions suggested by Webb et al. were: (a) categorical concurrence, (b) depth of knowledge consistency, (c) range of knowledge correspondence, and (d) balance of representation. The analysis for each dimension is detailed below. Categorical concurrence compared the similarity of the expectations for student learning, as expressed through the content categories in the standards, to the assessments. The total number of item/objective matches, hits, within a standard was averaged across the six participants to determine the average number of items per standard. According to Webb (1999), to have alignment relative to this dimension, an assessment must have had at least six items measuring a standard. Depth of knowledge consistency compared the level of cognitive demand expressed in the specific objectives within each standard to the cognitive demand in each item that is matched to that objective. The main concern with this aspect of alignment was that assessment items should not be targeting cognitive skills that were below those required by the objectives. Results were classified as “below” the cognitive demand of the objective, “at” the same level, or “above” the cognitive level of the objective. The main criterion here was that what was tested should be at or above the same cognitive level as what is expected to be taught. The sum of the percentage at and above across all participants must be greater than or equal to 50% to meet the requirements for acceptable depth-of-knowledge consistency.
Range of knowledge correspondence analyzed the breadth of the standards as compared to the breadth of an assessment. This aspect of alignment looked at the number of objectives within a standard measured by at least one assessment item. To have sufficient alignment relative to range of knowledge, at least 50% of the objectives within a standard needed to be measured by at least one assessment item. This criterion assumed that students should be tested on at least half of the domain of knowledge. This part of the alignment process also assumed all of the objectives have equal weighting and all of the objectives accurately cover the skills needed to complete that standard.
Balance of representation focused on how evenly assessment items were distributed
across objectives within a standard to represent the breadth and depth of the standards. This aspect of alignment focused on the objectives that were assessed by an item and then examined the proportion of objectives measured compared to the number of items. The goal was to measure every assessed objective with at least two items. Specifically the calculation for the balance index for each standard is:

109
(1) where O=Total number of objectives hit for the standard; I(k) = Number of items corresponding to objective (k); and H = Total number of items hit for the standard (Roach, Elliott, & Webb, 2005). If the proportion approached zero, it signified many items were assessed by only a small number of objectives within a standard. If the proportion approached one, it signified the assessed objectives were matched to an equal number of items. A balance index of 0.7 or higher represented a balanced standard with items fairly evenly distributed among the objectives that were measured. Index values of 0.6 to 0.7 represented a weakly met balance of representation criterion. Results
The alignment results using Webb’s criteria for each dimension for each standard are shown in Table VII.7. Standards that do not meet the criterion for a dimension are shaded in dark grey and standards that barely meet the criterion for a dimension are in light grey. The MAPT for Math met the criteria for acceptable depth-of-knowledge consistency and balance of representation for all of the standards. The categorical concurrence requirements were met in 13 out of 16 standards (81%). The range of knowledge correspondence was the weakest dimension in that the requirement for this dimension was only met for one standard, and was weakly met for two other standards. The low acceptable range of knowledge finding across the standards is due to the large number of objectives within each standard and the limited number of items. There is an average of 20 objectives per standard. To meet the criteria for the range of knowledge on average 10 objectives from each strand would need to each be assessed only once in a 40 item test. Assessing this many objectives per standard is not realistic in a one-hour test like the MAPT, and given that some standards are more heavily weighted in the test specifications. Clearly, some objectives within a standard may require more than one item to fully assess that skill and so the range of knowledge dimension is least relevant to the MAPT.
Although the categorical concurrence requirements were generally met, there were three anomalies—Beginning Basic and Low Intermediate in the Patterns, Relations, and Algebra strand; and Low Adult Secondary in Geometry. For this criterion, the Number Sense strand has the highest average number of hits (greatest number of item/objective matches on average) while the Patterns, Relations, and Algebra strand has the lowest average number of hits. The distinction between these two strands can sometimes be confusing for participants, especially at the lower test levels. For example, some Number Sense objectives refer specifically to the operations (addition, subtraction, etc.), but the Patterns, Relations, and Algebra strand includes an objective referring to the mathematical signs for the operations (+, -, etc.). The distinction between when the item is asking about the skill and when it is asking about the symbol may not always have been clear to the participants. With respect to the Geometry and Measurement strand for Low Adult Secondary, there was only an average of 4.67 hits for this standard, which suggests a need to have more targeted Geometry and Measurement items at this level.

110
Table VII.7
Summary of Alignment Results Based on Webb Dimensions
EFL Standard Depth-of-Knowledge
Balance of Representation
Categorical Concurrence
Range of Knowledge
Number Sense Yes Yes Yes Weak
Patterns, Relations, and Algebra
Yes Yes No No
Statistics and Probability
Yes Yes Yes No Beginning
Basic
Geometry and Measurement
Yes Yes Yes No
Number Sense Yes Yes Yes No Patterns, Relations, and Algebra
Yes Yes No No
Statistics and Probability
Yes Yes Yes No Low
Intermediate
Geometry and Measurement
Yes Yes Yes No
Number Sense Yes Yes Yes No Patterns, Relations, and Algebra
Yes Yes Yes Weak
Statistics and Probability
Yes Yes Yes No High
Intermediate
Geometry and Measurement
Yes Yes Yes No
Number Sense Yes Yes Yes No Patterns, Relations, and Algebra
Yes Yes Yes Yes
Statistics and Probability
Yes Yes Yes No Low/High
Adult 2ndary
Geometry and Measurement
Yes Yes No No
Summary* 100% 100% 81% 13% * This calculation is the total number of standards that met the criteria divided by the total possible number (4 standards x 4 levels = 16).
In general, using Webb’s methodology, the MAPT for Math met the requirements for alignment relative to the depth and balance of the assessment. In terms of the cognitive complexity, well over 50% of the hits for the standards within each level were at a cognitive level that was at or above the objective to which the item was matched. In addition, with respect to balance of representation, of the objectives that are assessed at each test level, items were evenly dispersed among those objectives. Thus, the MAPT for Math appears to be well aligned with the MA ABE Curriculum Frameworks for Mathematics and Numeracy.

111
Survey of math SMEs’ view of degree of alignment
The participants were asked to rate their general opinion of the alignment between the standards and the assessment. Results for each level are presented in Table VII.8 (percentages are based on n=6). One participant was concerned that Beginning Basic needed more Knowledge and Comprehension level items to test students’ rote computational skills. Beyond that one participant, the responses indicated participants thought the assessments were acceptably aligned or required slight improvements.
Table VII.8
Participants’ Summary Evaluation Regarding the Degree of Alignment
Assessment Levels
Beginning Basic
Low Intermediate
High Intermediate
Low/High Adult 2ndary
Perfect alignment 0% 0% 0% 0% Acceptable alignment 67% 50% 67% 67% Needs slight improvement 17% 50% 33% 33% Needs major improvement 17% 0% 0% 0% Not aligned in any way 0% 0% 0% 0%
Summary
Using Webb’s criteria for evaluating alignment, the MAPT for Math appears well aligned to the Math ABE Standards. The MAPT for Math met Webb’s alignment criteria for depth-of-knowledge consistency and balance of representation across the standards on all four levels of the assessment. The assessment failed to meet the criteria for categorical concurrence for only three out of sixteen standards and specific recommendations for additional items were noted in the results. The weakest area of alignment for the MAPT for Math was the range of knowledge covered by the assessment. Only one standard met the criteria for this dimension.
MAPT for Math Content Representation Study
The test construction procedures and content validity studies described thus far indicate that external SMEs who rated MAPT items generally found them congruent with the test specifications and the MA ABE curriculum frameworks. Kaira and Sireci (2007) analyzed another aspect of the content validity of the MAPT for Mathematics and Numeracy by looking at the specific 40-item tests taken by learners during the first year the MAPT was operational (fiscal 2007). The purpose of their study was to determine if the test specifications were being represented for all learners who took a straight path, and also to see if there were differences in the content quality of the items across the tests learners took, which were defined by different paths or panels. To evaluate content quality, they used the SMEs’ ratings from the content validity study described earlier. In that study, each of 6 SMEs matched each item to a math content strand and cognitive skill level. Thus, the content or cognitive “match” for an item could

112
range from zero (no SMEs matched the item to its designated content or cognitive area) to 6 (all SMEs matched the item to its designated content or cognitive area).
Tables VII.9 and VII.10 present a summary of the results of the congruence between the
observed and intended distributions of items across the content strands and cognitive skill areas, respectively. The results are reported separately for each operational panel. Using a criterion of 10% difference between the targeted and observed proportion of items to signify a lack of congruence, they found only one case where this criterion was exceeded for content strands—Number Sense at High Intermediate for Panel A comprised 35% of the test instead of its targeted 25%. This deviation represents 14 items measuring this strand instead of 10. For cognitive level, all targeted specifications were within the 10% criterion.
Table VII.9
Content Strand Representation for MAPT for Math Straight Paths
% coverage Level Content Panel A Panel B Target
Beginning Basic
Low Intermediate
High Intermediate
Low/High Adult
Secondary
Geometry Patterns Statistics Number sense Geometry Patterns Statistics Number sense Geometry Patterns Statistics Number sense Geometry Patterns Statistics Number sense
17.5 12.5 27.5 42.5
25.0 17.5 25.0 32.5
22.5 22.5 20.0 35.0
20.0 32.5 35.0 12.5
20.0 10.0 30.0 40.0
27.5 15.0 22.5 35.0
25.0 25.0 25.0 25.0
20.0 30.0 35.0 15.0
25 15 25 35
25 20 25 30
25 25 25 25
25 30 30 15

113
Table VII.10
Cognitive Level Representation for MAPT for Math Straight Paths
Level Cognitive skill Panel A Panel B Target Beginning
Basic
Low Intermediate
High
Intermediate
Low/High Adult
Secondary
Knowledge Application/synthesis Knowledge Application/synthesis Knowledge Application/synthesis Knowledge Application/synthesis
42.5 58.0
42.5 57.5
27.5 72.5
22.5 77.5
40.0 60.0
35.0 65.0
27.5 72.5
15.0 85.0
41 59
35 65
25 75
18 82
Source: Kaira and Sireci (2007)
With respect to the content quality of the items, Kaira and Sireci (2007) found excellent consistency across the different paths taken by the learners. The mean number of SMEs who matched an item to the intended content strand or cognitive level did not differ significantly across the test levels (paths) or panels. In fact, all means were at or above 5 for content strand and all were above 4 for the cognitive level. These results, summarized in Table VII.11, reflect the careful screening criteria used to select items for the operational version of the MAPT based on all the data collected from the SMEs and from the pilot study.
Table VII.11
Mean Content and Cognitive Ratings for MAPT for Math Straight Paths
Level Panel x Content
Rating SD
x Cognitive Rating
SD
2 A 5.5 0.7 4.9 1.2 3 A 5.3 1.1 4.8 1.0 4 A 5.3 1.1 4.6 1.2 5 A 5.0 1.1 4.4 1.2 2 B 5.3 1.1 5.2 0.9 3 B 5.3 0.9 4.7 1.0 4 B 5.3 0.9 4.4 1.3 5 B 5.1 1.1 4.3 1.2
x 5.2 1.0 4.6 1.2 Source: Kaira and Sireci (2007)

114
3. Validity Evidence Based on Internal Structure Analysis of the internal structure of a test can provide validity information regarding the degree to which the dimensionality of the test data conforms to the expected dimensionality. The MAPT exams are designed to be unidimensional, that is, they are designed to measure a general continuum of reading or mathematics proficiency.
Methods for evaluating test structure include factor analysis, nonlinear factor analysis, and multidimensional scaling. However, these procedures are typically applied to intact test forms, not to adaptive tests where tests are uniquely constructed for each examinee. In the first version of this manual, we evaluated the dimensionality of the MAPT by examining the residuals from the IRT model used to calibrate the MAPT items. We also compared the residuals to those observed from data that were simulated to conform to the IRT model used to calibrate the MAPT data (see Sireci et al. 2006). The results indicated the residuals were small, generally normally distributed, and similar to those observed for the simulated data.
In this manual, we report on the results of two additional analyses of the internal structure
of the MAPT. Specifically, we evaluated the dimensionality of specific MAPT “paths” using multidimensional scaling (MDS) and nonlinear factor analysis. These two methods have been recommended for appraising the dimensionality of dichotomous item data (Gessaroli, & De Champlain, 1996) and performed better than exploratory factor analysis in simulation studies (Deng & Hambleton, 2008). Given that the MAPT is an MST, we needed to deal with the large amount of missing data in the item-by-examinee response matrix; hence the decision to focus on the most popular paths traveled by learners taking a MAPT. These paths represent groups of learners who took common sets of items and it is relatively straightforward to analyze the dimensionality of a set of items taken by common groups of examinees. However, because the MAPT is adaptive, the data will have restriction of range (i.e., be much more homogeneous) relative to typical educational test data. Therefore, we thought it would be important to use more than one method to analyze the data. We also ran some simulation analyses to evaluate the ability of the methods to correctly identify data of known dimensionality when the data possessed restricted variability (Deng & Hambleton, 2008).
In this section, we report the results from the factor, nonlinear factor, and MDS analyses.
All analyses were conducted on both the MAPT for Math and MAPT for Reading. Data Analyzed
The MAPT for Math had 244 items in the item pool at the time of this study and the MAPT for Reading had 222 items in the pool. The frequencies for the six most popular paths in each subject area are presented in Table VII.12. For Math, the number of learners taking one of the paths ranged from 354 (straight level 3 (Low Intermediate) path for Panel 1) to 401 (learners starting at level 2 (Beginning Basic) and moving to level 3 for the 2nd and 3rd stages of the test). For Reading, the sample sizes for each path ranged from 341 (level 2-level 3-level 3 path) to 1,741 (straight level 3 path). Although some of these sample sizes are small, they were deemed sufficient for these dimensionality analyses.

115
Table VII.12
Numbers of Learners taking the Six Most Popular Paths for MAPT for Math and Reading
Math Frequency Percentage(%) Reading Frequency Percentage (%)
PA: 2-3-3* 401 5.4 PA: 3-3-3 1714 17.6 PA: 3-3-3 399 5.4 PB: 3-3-3 1650 17.0 PB: 3-3-3 397 5.3 PA: 2-3-3 965 9.9 PB: 4-4-4 390 5.2 PB: 2-3-3 650 6.7 PB: 2-3-3 376 5.1 PA: 2-2-3 344 3.5 PB: 4-4-4 354 4.8 PB: 2-3-3 341 3.5 *PA:2-3-3 stands for path in Panel A, consisting of Module 2 in Stage 1, Module 3 in Stage 2, and Module 3 in Stage 3.
MDS results
We fit one- through to five-dimensional MDS solutions to the data for each path. The fit measures of STRESS and of R2 were used to evaluate the fit of the MDS models to the data, but only the R2 values (proportion of variance accounted for) are reported here (see Deng & Hambleton, 2008, for full results). If the one-dimensional solution accounted for at least 70% of the variation in the data (i.e., > .70), we concluded the data were essentially unidimensional. The R2 results are presented in Tables VII.13 and VII.14 for Math and Reading, respectively. The results for Math suggest 4 of the 6 paths are essentially unidimensional. The two paths that did not meet the R2 criterion were the straight paths for level 2 (Beginning Basic) for both panels. For Reading, all 6 paths met the criterion for essential unidimensionality. In general, the MDS results suggest the dimensionality of the MAPT data conforms to expectations. It is interesting to note that in the two cases (out of 12) where unidimensionality was questionable, the sample sizes were the smallest. Therefore, it would be good to replicate these analyses when larger sample sizes become available.
Table VII.13
MDS R2 Fit Indexes for Math
# Dimen.
PA: 2-3-3 PB: 2-3-3 PA: 4-4-4 PB: 4-4-4 PA: 3-3-3 PB: 3-3-3
5 .933 .926 .902 .926 .789 .804 4 .912 .911 .879 .902 .753 .768 3 .889 .893 .849 .870 .693 .727 2 .855 .869 .789 .793 .647 .645 1 .800 .790 .709 .705 .547 .562
Note: PA:2-3-3 stands for path in Panel A, consisting of Module 2 in Stage 1, Module 3 in Stage 2, and Module 3 in Stage 3.

116
Table VII.14
MDS R2 Fit Indexes for Reading #
Dimen. PA: 3-3-3 PB: 3-3-3 PA: 2-3-3 PB: 2-3-3 PA: 2-2-3 PB: 2-3-3
5 .983 .980 .976 .954 .950 .953 4 .978 .976 .970 .943 .936 .937 3 .972 .969 .961 .927 .917 .919 2 .961 .963 .948 .902 .884 .874 1 .929 .944 .927 .839 .829 .803
Note: PA:3-3-3 stands for path in Panel A, consisting of Module 3 in Stage 1, Module 3 in Stage 2, and Module 3 in Stage 3 (i.e., “straight” path).
Nonlinear factor analysis results
The nonlinear factor analyses were conducted using the NOHARM software (Fraser & MacDonald, 1988). The 6 paths for Math and Reading were fitted with the 1-dimensional model. The fit indices are shown in Table VII.15. A model that fits the data well will have small squared residuals and root mean square of residuals (RMSR) indices, and Tanaka indices close to 1.0. All three indices suggest the unidimensional model fits the data well, even the two math paths that did not reach the MDS R2 criterion. Based on these results, Deng and Hambleton (2008) concluded the nonlinear factor analyses indicated these MAPT data were essentially unidimensional.
Table VII.15
NOHARM Fit Statistics for Math and Reading
Test Path Sum Square of
Residual
Root Mean Square of Residual
Tanaka Index of Goodness of Fit
PB 4_4_4 0.076 0.010 0.929 PA 4_4_4 0.099 0.011 0.917 PB 2_3_3 0.100 0.011 0.904 PA 2_3_3 0.101 0.011 0.903 PB 3_3_3 0.137 0.013 0.888
Math
PA 3_3_3 0.144 0.014 0.883
PA 3_3_3 0.018 0.005 0.975 PB 3_3_3 0.023 0.005 0.972 PA 2_3_3 0.030 0.006 0.961 PB 2_3_3 0.044 0.007 0.950 P0 0_1_2 0.070 0.009 0.921
Reading
P1 0_1_2 0.076 0.010 0.917

117
4. Validity Evidence Based on Relations to Other Variables
Studying the relationships among test scores and other measures of the construct tested aids in understanding the degree to which test scores support their intended uses. As described in Chapter I, the MAPT is designed to measure ABE learners’ achievement with respect to the ABE curriculum frameworks in math and reading developed by the Massachusetts Department of Elementary and Secondary Education. There are no independent measures of learners’ achievement relative to these frameworks, which is why new tests targeted to these frameworks were developed in the first place. However, this situation makes criterion-related validation studies problematic at best. Nevertheless, it makes sense to explore the relationships among MAPT test scores and other tests for adult learners that measure math and reading skills. Data were available for some learners who took the MAPT on three other tests—the Tests of Adult Basic Education (TABE), the Tests of General Educational Development (GED), and Accuplacer (placement tests used in community colleges and some 4-year postsecondary institutions). Correlation analyses were run to explore the relationships among MAPT scores and these other assessments. In this section, we describe these studies. MAPT/Tests of Adult Basic Education (TABE) Correlations
While the MAPT was being developed, many ABE learners in Massachusetts were required to take the TABE. Although it has been documented that the TABE has poor overlap with the Massachusetts Curriculum Frameworks (Massachusetts Adult Basic Education Performance Accountability Working Group, 2002), the relationship between MAPT and TABE scores is of some interest. If two tests are measuring similar, but not identical, constructs we would expect a positive relationship among the scores from learners who took both tests. Given that many ABE learners who participated in the MAPT pilot tests also took a TABE test, we created a data file that included these two sets of scores and computed correlations between the TABE math test and the MAPT for Mathematics and Numeracy, and between the TABE reading test and the MAPT for Reading. This file contained 1,870 learners who had both TABE and MAPT math test scores, and 2,570 learners who had TABE and MAPT reading scores. The MAPT scores came from Pilot Test 2, which occurred in the fall of 2005. The TABE test scores came from fiscal year 2006 (July 2005, through May 2006).
Scatter plots displaying the relationships among the test scores are presented in Figures VII.5 and VII.6 for math and reading, respectively. The correlation for math was .71 and for reading was .66. These results are as expected. They indicate the two tests are measuring similar, but distinct constructs, which supports the concurrent validity of MAPT scores.

118
Figure VII.5
Scatter Plot of MAPT for Math and TABE Math Test Scores (n=1,870, r=.71)
Math
0
100
200
300
400
500
600
700
800
-4.0 -3.0 -2.0 -1.0 0.0 1.0 2.0 3.0 4.0
MAPT (Theta)
TA
BE
Figure VII.6
Scatter Plot of MAPT for Reading and TABE Reading Test Scores (n=2,570, r=.66)
Reading
0
100
200
300
400
500
600
700
800
-4.0 -3.0 -2.0 -1.0 0.0 1.0 2.0 3.0 4.0
MAPT (Theta)
TA
BE

119
MAPT/GED Correlations
Table VII.16 presents correlations among the GED and MAPT Math and Reading scores. All correlations were based on learners’ most recent MAPT scores and the tests were generally taken within 3 weeks of each other. The sample sizes for these analyses ranged from 315 (GED Reading and Math correlations) to 476 (MAPT Reading and GED Reading correlations). Given these sample sizes, all correlations were statistically significant. The largest correlation is between MAPT Math and GED Math. The next highest correlation is between MAPT Reading and GED Reading. Interestingly, the MAPT Math and Reading exhibited a higher correlation (.46) than the GED Math and Reading tests (.32). However, these correlations are based on slightly different samples of learners. In general, these results indicate that the MAPT Math and GED Math are measuring similar constructs. The MAPT for Reading and GED Reading are also highly related, but less so than the two math tests. In fact, the relationship between the two reading tests is about the same magnitude as the relationship between the MAPT math and Reading tests.
Table VII.16
MAPT/GED Correlations
Test MAPT-Math MAPT-Reading GED-Math MAPT-Reading .46 GED-Math .61 .38 GED-Reading .27 .49 .32 Note: All correlations are statistically significant at p <.01. Minimum sample size is 315.
MAPT/Accuplacer Correlations
The correlations among the MAPT and the relevant Accuplacer tests are presented in Table VII.17. For these analyses, the sample sizes were much smaller, ranging from n=40 (MAPT Math/Accuplacer Elementary Algebra) to 151 (MAPT/Accuplacer Reading). Nevertheless, the correlations were all large, in the expected direction, and statistically significant.
Table VII.17
MAPT/Accuplacer Correlations
Test MAPT-Math MAPT-Reading Accuplacer Arithmetic (n=76) .634* Accuplacer Algebra (n=40) .524* Accuplacer Reading (n=151) .614*
Note: All correlations are statistically significant at p <.01.
5. Validity Evidence Based on Response Processes It is hard to evaluate the cognitive processes learners’ employ when taking tests, but with

120
a computerized test such as the MAPT, we are able to analyze the amount of time it takes learners to respond to test questions. These data are useful for evaluating whether learners have enough time to take a test, whether they are guessing on the items without reading them, and whether they are engaged in taking the test. Thus, analysis of item response time data can provide insights into the validity of MAPT test scores in the sense that we can identify serious from non-serious test-taking behavior, or identify learners who simply did not have enough time to complete the tests. Given that learners may have unlimited time to complete the test, we deemed analysis of learners’ engagement in taking the MAPT more important to study at this juncture. Non-serious test taking behavior leads to invalid scores for learners, and could also lead to misleading estimates of item statistics. Delton (2008) analyzed the item response time data for the MAPT for Reading to evaluate the degree to which learners were engaged in “test-taking behavior.” She focused on the 198 reading items taken by the most learners and coded them based on item length, measured by the total number of characters in the item stem and each answer option. Short items were 200 characters or less, long items were 1,000 characters or more and medium items were everything in between. Response time data were collected for 8,253 examinees; however, given the adaptive nature of the MAPT, not every learner was exposed to every item. Of the 198 items, each learner responded to somewhere between 33 and 40 items.
The response time data were used to determine if each learner engaged in “solution behavior” or “random guessing behavior.” The following formula outlined from Wise and Kong (2005) was used
1 ,
0ij i
ij
if RT TSB
otherwise
≥ = ,
where ijRT is an examinee j’s response time to item i, and iT is a threshold that represents the
boundary between rapid-guessing and solution behavior. The thresholds were set using Wise and Kong’s guidelines where if an item contained less than 200 characters, a 3-second threshold was used; if an item contained more than 1,000 characters, a 10-second threshold was used; and for all items in between, a 5-second threshold was used. The ijSB was then used to calculate the overall
response time effort (RTE) for each examinee with the formula
ijj
SBRTE
k=∑ ,
where k is the number of items examinee j was exposed to. RTE scores range from 0 to 1 and indicate the proportion of items for which an examinee engaged in solution behavior. RTE scores provide information about learners’ efforts and the response time fidelity (RTF) scores provide information about each item. The RTF scores were determined by the formula
1
n
ijj
i
SB
RTFN=
=
∑,
where N is the number of examinees exposed to each item i. RTF scores also range from 0 to 1 and represent the proportion of learners engaging in solution behavior on an item.

121
Results The RTE scores were calculated for each examinee and ranged from 0 to 1 with a mean of 0.98. The RTE scores are displayed in a histogram in Figure VII.7. The distribution of RTE scores is highly negatively skewed which indicates that the vast majority of learners engaged in solution behavior. Overall, 90.4% of examinees exhibited solution behavior on every item to which they responded.
Figure VII.7
Histogram of RTE Scores
0.0000 0.2000 0.4000 0.6000 0.8000 1.0000
rte
0
1,000
2,000
3,000
4,000
5,000
Fre
qu
enc
y

122
The RTF was also calculated for each item to determine the proportion of examinees that exhibited solution behavior on the item. A histogram of the RTF scores is presented in Figure VII.8. The histogram is also highly negatively skewed and ranges from .93 to .99 with a mean of 0.99, which indicates that about 99% of the item responses reflected solution behavior. The frequency distributions of two items with low RTF values can be viewed in Figures VII.9 and VII.10. These items were both categorized as long items meaning the threshold for solution behavior is 10 seconds. The graphs display a clear spike at the lower end of the distribution below the 10-second mark, which represents the rapid guessing behavior.
Figure VII.8
Histogram of RTF scores.
0.93 0.94 0.95 0.96 0.97 0.98 0.99 1.00
rtf
0
20
40
60
80
100
Fre
qu
ency
To summarize these results, it appears the vast majority of learners who took the MAPT for Reading in fiscal 2007 took the test seriously (i.e., were engaged in solution behavior on virtually every item). These results are encouraging and suggest the item statistics estimated for MAPT items are based on motivated samples of test takers.
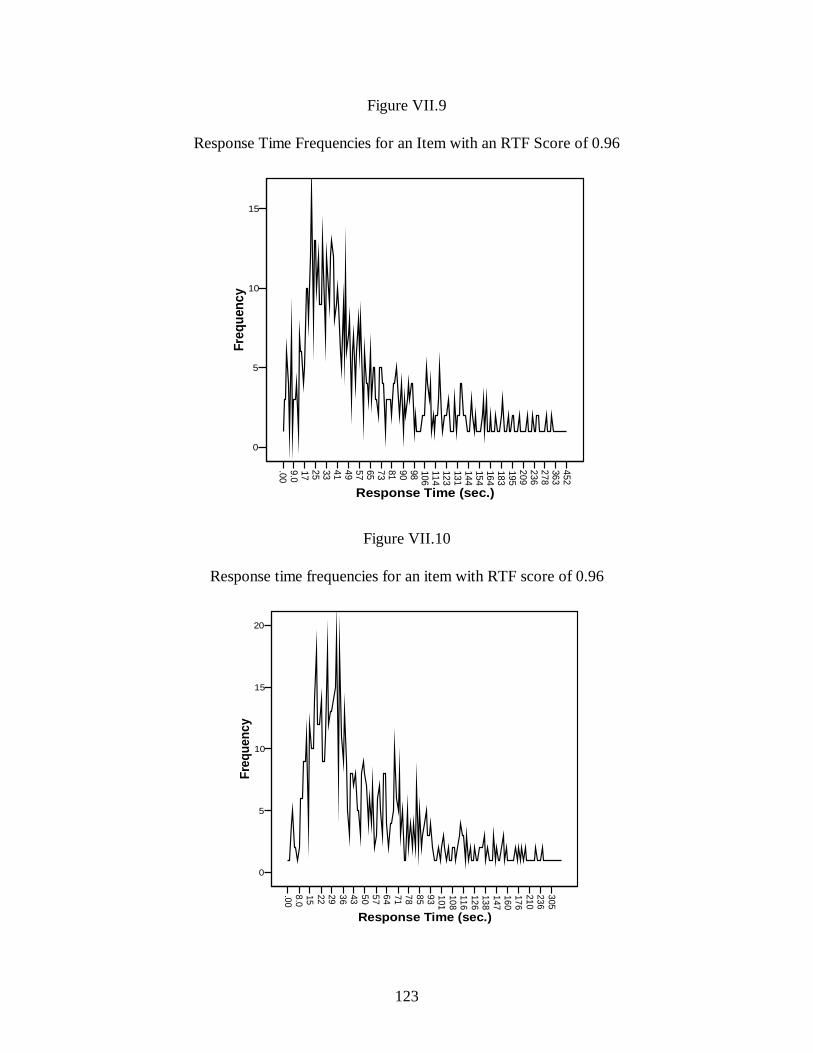
123
Figure VII.9
Response Time Frequencies for an Item with an RTF Score of 0.96
.009.01725 33 41 49 57 65 73 81 90 98 106114123131144154164183195209236278363452
Response Time (sec.)
0
5
10
15
Freq
uenc
y
Figure VII.10
Response time frequencies for an item with RTF score of 0.96
.008.015 22 29 36 43 50 57 64 71 78 85 93 101108116126138147160176210236305
Response Time (sec.)
0
5
10
15
20
Freq
uenc
y

124
6. Validity Evidence Supporting Evaluation of Educational Gain As discussed in Chapter V, under the NRS, learners’ educational gains are measured by comparing their prestest EFL with their posttest EFL. Specifically, for the purposes of the NRS, any learner who advances from one EFL to a higher EFL in the course of a given fiscal year is classified as demonstrating education gain. Any learner failing to advance in this manner, is considered to have not shown educational gain. Clearly, measuring gain in this manner is crude in the sense that learners just below a particular EFL cut-score will be classified as exhibiting gain if they make only minor progress, whereas learners just above a particular EFL cut-score may make substantial educational gains, but not reach the next EFL threshold. For this reason, we recommend evaluating gains based on the IRT theta or MAPT scale scores. Regardless of the best way to measure educational gain on the MAPT, because MAPT scores will be used for the analysis of educational gain under the NRS, it is important to evaluate the degree to which it is sensitive to such gains. In this chapter, we present the results from two studies of educational gain on the MAPT. The first study, reported in the first version of this Technical Manual, is based on simulation analysis. The second study, is based on the data from all learners tested in fiscal 2007, who were part of the NRS accountability system.
In evaluating educational gain under the NRS, it is important to keep in mind that because of measurement error there will always be some number of learners that show educational gain despite an insufficient increase in their true proficiency. Likewise, there will always be some learners who fail to show educational gain, even though their true gain is enough to be classified into the next EFL. When a learner is classified as exhibiting gain, but the gain is really due to measurement error, it is called a false positive error. When a learner truly advances an EFL, but due to measurement error is classified as not exhibiting gain, it is called a false negative error. Such errors will happen, even though as described in Chapter VI, the decision accuracy of the EFL classifications based on the MAPT is high. It is also important to note that learners’ gains are aggregated for NRS accountability purposes and the errors associated with the proportions of learners exhibiting gain are likely to be very small, relative to the error for a particular learner. Simulation Study For each subject, Reading and Mathematics and Numeracy, and each study condition, 25,000 simulated learners (simulees) were randomly assigned an initial true proficiency between 200 and 700. Each simulee was then administered a MAPT (administration 0), starting at the appropriate level given their true proficiency. Responses were drawn at random, given the item parameters and the simulees’ true proficiency. For example, if the probability of a correct response, given a particular item and a particular true proficiency, were .70, 70% of the time a correct response would be drawn and 30% of the time an incorrect response would be drawn. Simulees’ observed (i.e., estimated) scores on the initial (administration 0) MAPT were not used except to use to determine the appropriate starting level for the first recorded administration, administration 1. The remaining administrations, beginning with administration 1, were conceptualized as

125
constituting a single evaluation period, which in practice corresponds to the instruction that occurs within a given fiscal year. Over the course of an evaluation period, each simulee then takes two administrations and simulee proficiency increases by some amount, which is also varied as a study condition (in 10-point increments). At the conclusion of the evaluation period, each simulee was classified as having demonstrated gain or not with respect to their true gain and their observed gain, where the observed gain is what we expected from the operational MAPT administration. Gain was demonstrated by moving up at least one EFL between pretest and posttest. Classification success is defined here as the correspondence between the observed classification and the true classification for each simulee. For illustrative purposes, Table VII.18 considers the 8 possible score trends for simulees taking 3 administrations. These individual score trend examples warrant further discussion because understanding them is critical for understanding the study results.
Simulees 1 to 4 share the same true scores: all increase 40 points during the evaluation period (220, 240, 260); however because all the scores fall between 200 and 299, no true gain occurs (i.e., simulees 1-4 all remain in EFL 2). For simulee 1, the observed scores all remain between 200 and 299 and thus no observed gain occurred either. Therefore, simulee 1 is correctly classified. Simulee 2 has the same true scores as simulee 1 but the simulee 2 observed scores are all > 300. Clearly, there is considerable error in simulee 2’s observed scores. Still, even though simulee 2’s classification is based on erroneous data, the classification itself is nevertheless correct: both the true and observed classifications show no gain, because this simulee was misclassified as a Level 3 learner after Administration 1. Simulee 3, again with the same true scores, shows yet another pattern of observed scores: the observed scores start at level 3 but then move down to level 2. Since the simulee’s true score is increasing, the decline in observed score can only be attributed to measurement error. Nevertheless, the classification again remains correct: both the true and observed classifications show no gain. Simulee 4, again with the same true scores, shows yet another possible score trend. Simulee 4 shows gain by scoring at level two and then subsequently scoring at level 3. However, the true gain for simulee 4 was below the threshold for gain under the NRS, and is therefore an example of a false positive error.
Simulees 5 to 8 share the same true scores: 270, 290, and 310 across administrations 1, 2 and 3, respectively, and so these four simulees should be classified as exhibiting gain under the NRS, because they move from EFL 2 to EFL 3. Simulee 5’s observed scores demonstrate gain and therefore simulee 5’s classification is correct. Simulee 6 and 7, on the other hand, fail to show gain in their observed scores, remaining in levels 2 and 3 respectively, and therefore are examples of false negatives. Simulee 8 is also a false negative because while the true score moves up a level, the observed score moves down a level.
The simulees in Table VII.18 each gained 40 points, but in the simulation study, the gains varied from 0 to 100 in increments of 10. The study was conducted for both Reading and Mathematics and Numeracy. For each administration, 25,000 simulees were created and assigned an initial proficiency drawn from a uniform distribution between 200 and 700 (inclusive). Given the 11 levels of gain and 2 subject areas, the simulation study involved 550,000 simulees.

126
Table VII.18 Administration 1 Administration 2 Administration 3 Classification
Simulee true observed true observed True observed true observed
Observed Classification Success
1 220 212 240 237 260 272 no gain no gain correct 2 220 303 240 314 260 319 no gain no gain correct 3 220 306 240 261 260 273 no gain no gain correct
No True Gain
4 220 235 240 255 260 304 no gain gain false positive 5 270 262 290 288 310 317 gain gain correct 6 270 254 290 278 310 296 gain no gain false negative 7 270 332 290 344 310 361 gain no gain false negative
True Gain
8 270 308 290 326 310 294 gain no gain false negative

127
Figure VII.11 presents a summary of the results for the MAPT for Reading. The figure shows the proportion of simulees that correctly showed (or correctly failed to show) gain, erroneously showed gain (false positive error), and erroneously failed to show gain (false negative). Proportions are shown as a function of score gain. There are two features of this figure that deserve special emphasis. First, the upper dashed line indicates the proportion of simulees correctly classified. It is desirable that this line be as high as possible. For example, if all simulees gained 40 points over the course of the evaluation period, one would only expect about 56% to be correctly classified. This is perhaps an uncomfortably low percentage, however, when aggregating examinee performance (e.g., when reporting state results), the magnitude of this percentage is tempered by the second feature of the figure: the ratio of false negatives to false positives. The ratio of false negatives to false positives is of interest because upon aggregating results, false positives and false negatives cancel out. For example, given a sample of 100 examinees, all of whom gained 40 points over the of the evaluation period, the expected number of examinees correctly classified would be about 56 (56%), the expected number of false positives would be about 22 and the expected number of false negatives would also be about 22. However, note that if 22 examinees erroneously show gain and 22 erroneously fail to show gain, the net error is zero. That is, for this sample of 100, one could perfectly describe examinee classification despite the unfortunate fact that 44% of the examinees were wrongly classified! For this reason, it is especially desirable that the discrepancy between false positives and false negatives be minimized. Figure VII.12 presents the results for the MAPT for Mathematics and Numeracy. The proportion of correctly classified simulees is higher than that observed for Reading, as is the discrepancy between false positives and false negatives. These findings are consistent with the results from the decision consistency simulation study discussed in Chapter III, wherein it was found that Mathematics and Numeracy simulees were expected to be more accurately classified (into an EFL) for a given administration than were Reading simulees. Figures VII.13 and VII.14 show the net proportions of correct and incorrect simulee classifications versus the magnitude of score gain per evaluation period for Reading and Math, respectively. It can be seen that the net effects are similar to the simulated true values, which indicates the MAPT appears to be appropriate for evaluating gain at the aggregate (state, program) level. The results of the simulation study indicate that for individual simulees, accurate identification of the gain (or its absence) occurred about 63% of the time for Reading and about 72% of the time for Mathematics and Numeracy, when averaged across all possible score gains. However, the net (aggregate) results indicated very close agreement between the true percentages of learners who exhibited gain under the NRS conditions, and the observed gains expected based on the MAPT.

128
Figure VII.11
Proportion of Correct, False Positive, and False Negative Classificaitons Vs. Magnitude of Score Gain Per Evaluation Period (Reading; 2 Administrations Per Evaluation Period)
0.00
0.25
0.50
0.75
1.00
0 10 20 30 40 50 60 70 80 90 100
Magnitude of Score Gain Per Evaluation Period
Pro
portio
n o
f S
imule
es
78
observed educational gain (or absence of gain) is correct
gain observed due to error--false positive
gain unobserved due to error--false negative
Figure VII.12
Proportion of Correct, False Positive, and False Negative Classificaitons Vs. Magnitude of Score Gain Per Evaluation Period (Mathematics and Numeracy; 2 Administrations Per Evaluation Period)
0.00
0.25
0.50
0.75
1.00
0 10 20 30 40 50 60 70 80 90 100
Magnitude of Score Gain Per Evaluation Period
Pro
port
ion o
f S
imule
es
78
observed educational gain (or absence of gain) is correct
gain observed due to error--false positive
gain unobserved due to error--false negative

129
Figures VII.13
Proportion of Net Correct, Net False Positive, and Net False Negative Classificaitons Vs. Magnitude of Score Gain Per Evaluation Period (Reading; 2 Administrations Per Evaluation Period)
0
0.25
0.5
0.75
1
0 10 20 30 40 50 60 70 80 90 100
Magnitude of Score Gain Per Evaluation Period
Pro
por
tion
of S
imul
ees
h
net correct classification
net false postive error
net false negative error
Figure VII.14
Proportion of Net Correct, Net False Positive, and Net False Negative Classificaitons Vs. Magnitude of Score Gain Per Evaluation Period (Mathematics and Numeracy; 2 Administrations Per Evaluation Period)
0
0.25
0.5
0.75
1
0 10 20 30 40 50 60 70 80 90 100
Magnitude of Score Gain Per Evaluation Period
Pro
por
tion
of S
imul
ees
h
net correct classification
net false postive error
net false negative error
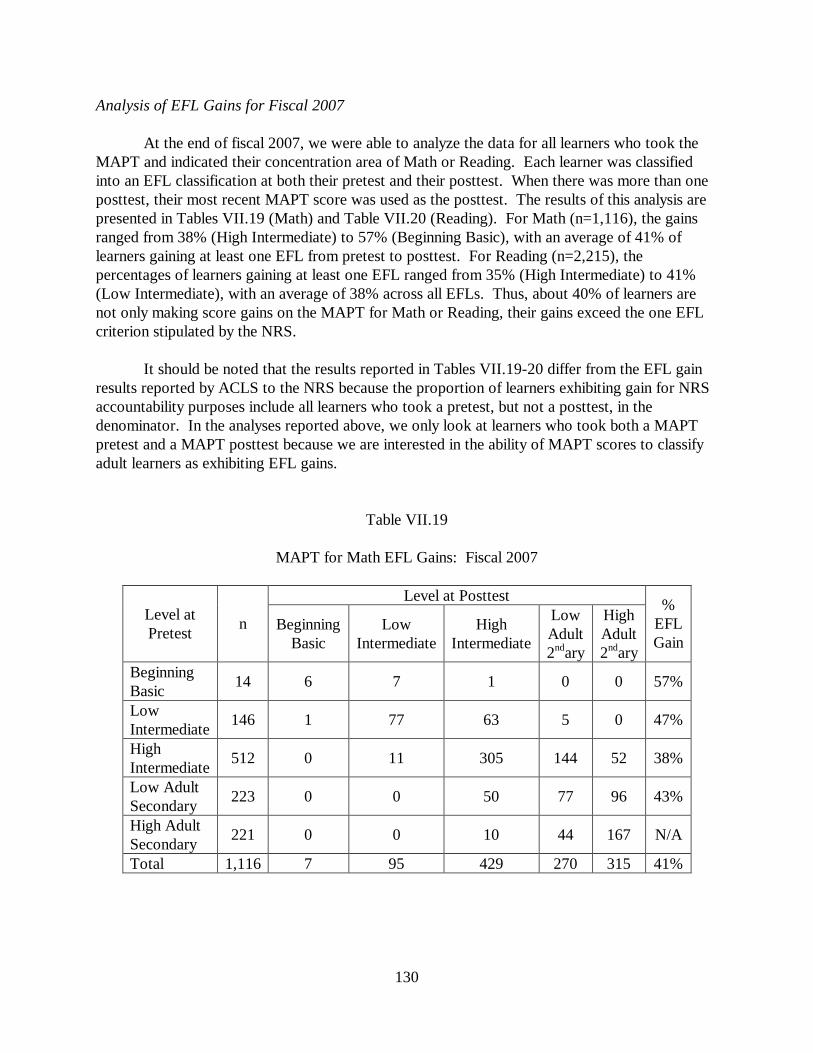
130
Analysis of EFL Gains for Fiscal 2007 At the end of fiscal 2007, we were able to analyze the data for all learners who took the MAPT and indicated their concentration area of Math or Reading. Each learner was classified into an EFL classification at both their pretest and their posttest. When there was more than one posttest, their most recent MAPT score was used as the posttest. The results of this analysis are presented in Tables VII.19 (Math) and Table VII.20 (Reading). For Math (n=1,116), the gains ranged from 38% (High Intermediate) to 57% (Beginning Basic), with an average of 41% of learners gaining at least one EFL from pretest to posttest. For Reading (n=2,215), the percentages of learners gaining at least one EFL ranged from 35% (High Intermediate) to 41% (Low Intermediate), with an average of 38% across all EFLs. Thus, about 40% of learners are not only making score gains on the MAPT for Math or Reading, their gains exceed the one EFL criterion stipulated by the NRS.
It should be noted that the results reported in Tables VII.19-20 differ from the EFL gain results reported by ACLS to the NRS because the proportion of learners exhibiting gain for NRS accountability purposes include all learners who took a pretest, but not a posttest, in the denominator. In the analyses reported above, we only look at learners who took both a MAPT pretest and a MAPT posttest because we are interested in the ability of MAPT scores to classify adult learners as exhibiting EFL gains.
Table VII.19
MAPT for Math EFL Gains: Fiscal 2007
Level at Posttest Level at Pretest
n Beginning Basic
Low Intermediate
High Intermediate
Low Adult 2ndary
High Adult 2ndary
% EFL Gain
Beginning Basic
14 6 7 1 0 0 57%
Low Intermediate
146 1 77 63 5 0 47%
High Intermediate
512 0 11 305 144 52 38%
Low Adult Secondary
223 0 0 50 77 96 43%
High Adult Secondary
221 0 0 10 44 167 N/A
Total 1,116 7 95 429 270 315 41%

131
Table VII.20
MAPT for Reading EFL Gains: Fiscal 2007
Level at Posttest Level at Pretest
n Beginning ABE
Low Intermediate
High Intermediate
Low Adult 2ndary
High Adult 2ndary
% EFL Gain
Beginning ABE
238 143 77 16 0 2 40%
Low Intermediate
535 40 273 201 13 8 41%
High Intermediate
785 3 96 414 149 123 35%
Low Adult Secondary
209 0 5 71 51 82 39%
High Adult Secondary
448 0 0 46 64 338 N/A
Total 2,215 186 451 748 277 553 38% To summarize our two studies of the sensitivity of the MAPT to learners’ gains we must first point out that each study has its strengths and limitations. The analysis of fiscal 2007 data has the disadvantage that we do not know the learners’ true gain status, we only observe whether or not gains were made. From those results we can tell substantial proportions of learners do complete an EFL. That finding is consistent with the hypothesis that the MAPT is appropriate for measuring EFL gains, but it does not “prove” the gains are correct. The simulation study simulated truth, but is limited in that we cannot generalize the results past the conditions we simulated. Nevertheless, that study also illustrated the MAPT’s sensitivity to EFL gains, particularly when scores were aggregated as they are under the NRS. Thus, the two studies taken together provide evidence in support of using the MAPT for measuring Massachusetts adult learners EFL gains. Given that the MAPT is aligned with the Massachusetts ABE curriculum frameworks, and that the cut-scores are aligned with the NRS EFLs, it appears the test is fulfilling one of its primary purposes—to measure educational gains for the NRS through EFL level completion.

132
7. Validity Evidence Based on Consequences of Testing As described earlier, an evaluation of the positive and negative consequences of a testing program can provide valuable information regarding the degree to which a test is fulfilling its intended goals and the degree to which the scores are appropriately used. One of the underlying principles of the MAPT is that it will improve instruction. Thus, this principle is a positive, intended consequence of the testing program. The logic behind this principle is that if a test were aligned to the curriculum frameworks, it would encourage teachers to teach to those frameworks.
At the time of this writing, it is too early to directly study whether the test is affecting instruction in a positive way, since it has been operational for just over one year and during this time ABE educators are still becoming fluent with the curriculum frameworks and the tests. However, we already see many positive consequences such as teachers becoming more familiar with using computers in their classroom, familiarizing their students with how to interact with a computer, and experiencing professional development workshops pertaining to assessment issues for adult learners. MAPTs’ Influence on Professional Development for ABE Teachers and Staff
As stated in Chapter I, our vision for the MAPT was to have the exam essentially created by adult educators in Massachusetts. By doing so not only would we maximize the link between instruction and assessment, we would also enable these educators to be part of the process and have some ownership over the exam. In accomplishing this goal we consequently provided considerable professional development opportunities for the ABE field. For example, we delivered over a dozen workshops across the state over a two-year period. About half of these workshops focused on item writing, the others focused on understanding educational tests (e.g. “Assessment 101”) and understanding the characteristics of the forthcoming MAPT. In all the professional development workshops, the curriculum frameworks from which the MAPT are derived were discussed. Additional workshops were provided to train teachers how to deliver the pilot tests, and eventually the MAPT, at their programs. We also provided a three-credit graduate course, which was free of charge to ABE teachers and staff throughout the state, although they were required to create test items to be considered for use on the MAPT as a course requirement. Fourteen teachers participated in the course. We also offered a 15-hour introduction to assessment course for the System for Adult Basic Education Support (SABES) curriculum and assessment coordinators throughout the state. The idea behind that course was to “train the trainers” so that the assessment literacy among ABE teachers and staff throughout the state would be elevated. Thus, a positive consequence of the MAPT testing program was that hundreds of ABE educators throughout Massachusetts were trained in assessment literacy, learned valuable item writing and editing skills, and became familiar with the learning standards in the Massachusetts ABE Curriculum Frameworks. Surveys of Learners Participating in the Pilot Tests
Evaluating the consequences of a testing program should involve investigation of students’ experiences taking the tests and ensuring irrelevant factors do not impede their performance.

133
Although we were concerned about the amount of time it might take learners to complete the pilot tests, we thought it was important to ask them a few questions to help us understand their test taking experience and background. Three survey items were presented to learners at the conclusion of Pilot Test 1. Two of these items were asked again during Pilot Test 2. These questions inquired about learners’ (a) perception of test difficulty, (b) opinion about the computer-based test delivery (Pilot 1 only), and (c) whether they were native English speakers. With respect to native language, about 1/3 of the Pilot 1 learners were not native speakers of English. This percentage increased to about 40% for Pilot Test 2.
With respect to perceived test difficulty, the majority of the learners thought the Pilot 1 tests were “about right” (Figure VII.15). The results for Pilot 2 (FigureVII.16) were very similar for Reading, but for Math, the percentage of learners rating the test “too hard” increased. This finding may be explained by the addition of more difficult items to the math item pool. About 68% of Pilot 1 learners and 57% of Pilot 2 learners found the test to be “just right.” Overall, these results suggest that the majority of learners felt comfortable with the difficulty level of the tests, but some perceived the tests as being too easy or difficult.
Figure VII.15
In Pilot Test 1, learners were asked, if they would prefer to take the test on a computer or in a paper-based format. The results are summarized in Figure VII.17. About 77% of the Pilot 1 sample responded they would prefer to take the test on the computer. The percentage preferring the computer was noticeably higher for Reading than for Math, and learners taking the Math exam had a noticeably higher omit rate for this question. Interestingly, of those who found Pilot 1 too
Pilot 1 Examinee responses to “How difficult was this test for you ? ”
13%
74%
10%
24%
58%
8%
0
10
20
30
40
50
60
70
80
90
100
too easy just right too hard
Response
Responses (%)
Reading Math

134
difficult, only 28% (5% of the total sample) indicated they would prefer a paper-based test, which suggests that the computer was not a major contributor to perceived test difficulty.
Figure VII.16
Figure VII.17
Pilot 1 Examinee responses to “If you had to take this test again, would you prefer to take it on the computer or on paper?”
17%
80%
19%
70%
0
10
20
30
40
50
60
70
80
90
100
computer paperResponse
Res
pon
ses
(%)
Reading
Math
Pilot 2 Examinee responses to “How difficult was this test for you ? ”
14%
74%
9%
36% 40%
20%
0
10
20
30
40
50
60
70
80
90
100
too easy just right too hard Response
Responses (%)
Reading Math
135
8. Other Validity Evidence The preceding sections in this chapter discussed specific studies or aspects of validity that can be categorized under the sources of validity evidence described in the Standards for Educational and Psychological Testing (AERA, et al., 1999). However, it is difficult to disentangle the various aspects of validity and separate them into distinct components. In fact, the argument that MAPT scores are appropriate for their intended purposes began in Chapter I and permeates this entire manual. The care with which the test specifications were developed, the way in which we evaluated item response and test completion times, the development of the computer basics tutorial, and the extensive training provided to educators throughout Massachusetts are all examples of promoting the validity of inferences derived from MAPT scores. In this section, we describe other activity and data that pertain to the MAPT involving our evaluation of potential threats to valid interpretation of learners’ proficiencies.
Reduction of Test Anxiety
Very few students enjoy taking tests and in ABE test anxiety is always a concern. Although it is unlikely we will ever develop tests that all students enjoy taking, we instituted several strategies to reduce ABE learners’ anxiety about the forthcoming tests. Our first strategy was to engage teachers in the process and get them excited about the new tests. We believe reducing teachers’ test anxiety is an important first step in addressing students’ anxiety. We also strived to ensure that test content was appropriate for and familiar to adult learners, and it is ACLS policy that learners are not tested within their first two weeks in a program. A third strategy for reducing test anxiety was the development of a computerized tutorial (described in Chapter III) that introduces learners to the testing system and familiarizes them with the item formats. In addition, we decided to conduct a small-scale “computer proficiency” study to discover students’ impressions and concerns regarding taking a test on the computer.
Computer proficiency study
ABE students vary not only in their familiarity with computers in general, but also in their knowledge of how to navigate through a computerized test and complete onscreen actions to answer test questions. To assess this variability, we conducted a small study where we designed a low-stakes computerized assessment and observed ABE learners as they responded to the test questions. The study involved 32 learners of various learning levels (i.e., beginning ABE to GED prep students) from several ABE programs in Massachusetts. These students completed a short series of test questions involving the following item formats: multiple-choice with radio buttons, drag and drop, drop-down menu, typing/fill-in, and multiple-multiple-choice. For further descriptions of these item formats, see Zenisky and Sireci (2002). We investigated several different item formats to evaluate the feasibility of future use of innovative item formats on the MAPT.
Most learners involved in this study exhibited at least a moderate level of familiarity with
basic computer actions (e.g., moving the mouse, scrolling, clicking) and many also demonstrated proficiency with more advanced skills (such as drag-and-drop and typing). Upwards of 80% of

136
students agreed that it was easy to use the mouse for each of the given tasks, and somewhat less (about 75%) reported the same for using the keyboard to type answers. However, many students exhibited considerable more difficulty typing responses, suggesting that additional training and experience in keyboarding may be necessary before extended open-response items could be used. Interestingly, 88% of students involved indicated it was “easy” or “very easy” to see the questions, figures, and answer choices on the computer screen, and 82% reported they were “comfortable” or “very comfortable” answering test questions on a computer.
In general, the students reviewed the item formats favorably. A summary of their
responses to the survey questions specific to each of the item formats is presented in Table VII.21. This summary presents only the percentage of students who “agreed” with each statement. Although the multiple-choice format was rated highest overall, the novel item types that took advantage of the computer interface (i.e., drag-and-drop and drop-down menu items) were rated slightly higher than the multiple-choice item with respect to clearness of directions and desire to see that item type on a test. The results suggest that ABE learners would not have difficulty taking a computerized test and that several different item formats are viable for the MAPT.
Table VII.21
Summary of Survey Responses Regarding Computerized Item Formats (n=32)
Item Format (% Agree)
Survey Item Multiple-Choice
Drag-and-Drop
Drop-Down Menu
Typing/ Fill-in
Multiple-Multiple-Choice
It was easy to see the words on the computer screen.
100 96.6 93.3 89.3 96.8
It was easy to see the pictures on the computer screen that you needed to use to answer one or both of the questions.
100 89.3 83.3 85.7 89.6
This kind of item was easy to answer. 96.7 93.1 96.6 85.7 93.5 It was easy to use the mouse to answer these questions.
90.3 86.2 93.2 79.4 80.7
The directions were easy to follow. 87.1 89.7 80.0 86.4 83.3 The directions were clear. 80.6 82.8 89.3 89.3 74.1 I would like to see this kind of item on a test.
79.9 82.8 80.0 82.8 74.1
Average % Agree 90.7 88.6 88.0 85.5 84.6

137
9. Test Security
Another threat to the validity of a testing program is theft of items. From test development through the release of the operational tests, test security has been a high priority. ABE teachers and administrators participated in the test development process at a number of important points, but the security of the item bank was ensured at all times. Prior to participating in the sensitivity review, content validity review, and/or standard setting process all panelists reviewed and signed a non-disclosure agreement. This document specified that all materials and knowledge about the MAPT and specific items were not to be discussed outside of the meeting. At the conclusion of each meeting all of the materials were collected and at no time were any potential operational items released in electronic form. Through the secure login process, ABE participants in the review process have also never had access to the item pool. A number of measures have been put in place to address security concerns for the operational MAPT. All test administrators must attend a four hour training to be able to administer the MAPT. The training is based on the test administrator manual. The manual is available at http://www.doe.mass.edu/acls/assessment/MAPT/teachermanual.doc. The manual walks the administrator through the assessment process using descriptions of the test and screen shots to illustrate what is asked of the student at each point before, during, and after the test. At the completion of the training the trained test administrators’ names are submitted to OWL Technical Support to receive unique logons and passwords. The test administrators will use their logon to submit technical support questions and to access the teacher only portions of the assessment (Practice Tests and Sample Questions). A trained test administrator or teacher administers the tests, and the test administrator is present throughout the entire testing period. Learners are allowed to use scrap paper, but the test administrators are trained to collect all papers at the conclusion of the testing session. If any questions arise during the testing process about computer functionality or test content, the test administrator has been trained to use the Send Message feature to request support. Each student also has a unique login and password that is requested through ACLS’s SMARTT SSL system. Each time a login is used, a record is created in the OWL system. If the MAPT for Reading or MAPT for Math were accessed, the status field will change to show the test has been accessed. While the MAPT is an untimed test, the training strongly recommends that students complete the test in one sitting within a two-hour time block. The training emphasizes that teaches should provide a two hour time period for students to test in a quiet setting where they can work undisturbed. If a student becomes ill or has a leave for an emergency they can come back later and continue testing where they left off. However, the test must be completed within 15 days of the start date. If this deadline were not met, the student will need to restart the test from the first question and will see a new set of questions. A retest is initiated only in this circumstance where the test is not completed and the 15 day testing window has expired. The training emphasizes that if a test has been completed a score cannot be invalidated and a retest cannot be granted. There is also a minimum two-month time interval between pre- and post-testing, to ensure the tests are being used only as intended. In addition, there is a maximum of three test

138
administrations per year. After the test is completed, the data are securely transferred back to the SMARTT system at regular intervals twice a day. One other effective way to enhance security is to increase the size of the MAPT item banks. The Massachusetts Department of Elementary and Secondary Education has invested significant resources to increase the size of the item bank. Currently, CEA is under contract to develop 1,750 new items for the MAPT over the next four years.
10. MAPT Test Accommodations
As mentioned in Chapter II, the MAPT were developed using the principles of Universal
Test Design (UTD), which is based on the idea that tests should be constructed and administered as flexibly as possible so that accommodations are unnecessary. Just as building codes now require wheelchair access ramps and other features to make them more accessible to people with disabilities, tests could be built with such special populations in mind (Thompson et al., 2002). As described by Thompson and Thurlow (2002)
The goal of applying universal design principles to assessments is to be able to design and develop assessments that allow participation of the widest range of students, and result in valid inferences about their performance. The need that many students have for accommodations could be reduced if assessments could be universally designed. (p. 1) One example of flexibility in MAPT test design is the standard time limit for the exam.
Learners are automatically given two hours to complete a MAPT exam, but the exams are designed to be completed in 60 minutes or less. The pilot studies and our analysis of fiscal 2007 test response time data confirmed that the majority of learners completed the test before the 60-minute mark. In addition, if learners need more than two hours to take the exam, they may return to test within 15 days and can restart the exam where they left off. In addition, the computerized-adaptive technology on which the MAPT is built allows the test to be tailored to the proficiency level of the specific learner taking the exam, which avoids presentation of items that are too difficult or too easy for learners.
Although the MAPT was constructed to be as flexible as possible to accommodate
learners with various disabilities, there may be many cases in which accommodations are necessary to get a more accurate measure of a particular learner’s knowledge and skills. According to ACLS policy, several accommodations may be granted for learners who may need them, since they are not considered to alter the construct (math or reading proficiency) measured on the MAPT. A list of these allowable accommodations is presented in Table VII.22. ABE teachers and administrators should consult ACLS regarding other accommodations or to discuss specific situations that may warrant one or more accommodations, other than those listed in Table VII.22.

139
Table VII.22
Allowable MAPT Accommodations by Accommodation Category Accommodations
Category Accommodation Extended time Multiple day / sessions Separate sessions Breaks
Timing
Time of day Separate room / Individual or small group administration Test Setting Specific area / Preferential seating Read-aloud presentation of instructions Oral translation of instructions into language other than English Sign language presentation of instructions Increase font size / Large print Braille Magnification devices/overlays / screen readers Oral presentation (MAPT for Math only) Familiar test administrator
Test Presentation
Noise buffers Recording answers/Scribe Touch screen
Response
Use of manipulation equipment (e.g., head-stick)
Summary of Validity Evidence Much of the information presented in this Technical Manual provides evidence related to the validity of interpretations of MAPT scores. Defensibility of test use and score interpretation starts with clear descriptions of the purposes of the test and of what it is measuring (Chapter II). Quality control and concern for equity in test development (Chapter III) must also be demonstrated, and the characteristics of the score scale should be thoroughly described (Chapter IV). Information regarding standard setting for specific uses of the test should be provided (Chapter V), as should information regarding measurement precision (Chapter VI). Finally, specific data gathered to provide validity evidence should be presented (this chapter). In developing the MAPT and investigating the properties of its scores, we have used various sources of validity evidence; involved external, independent subject matter experts; comprehensively evaluated item response data from ABE learners; and conducted simulation studies where appropriate. The end result of these test development and test evaluation endeavors is a strong argument that the MAPT fulfills its intended goals. That is, the MAPT measures the relevant portions of the Massachusetts ABE Curriculum Frameworks and is appropriate for evaluating learners’ gains and for judging accountability under the NRS. Of course, validation is an ongoing process and research on the validity of interpretations based on MAPT scores will continue into the foreseeable future (see Chapter IX).

140
VIII. Interpreting MAPT Test Scores
In Chapter IV, we described how the MAPT score scale was created, and in Chapter V we described how the cut-scores on the MAPT that distinguish among the NRS EFLs were set. In this chapter, we revisit the MAPT score scales and EFLs to ensure consumers of MAPT score information appropriately interpret these scores.
A sample score report for a learner who took the MAPT for Reading is presented in
Figure VIII.1, and sample score report for the MAPT for Mathematics and Numeracy is presented in Figure VIII.2. The first score report (Reading) illustrates a learner who obtained a score of 290 on the Reading test and is placed in the Massachusetts Learner Level “Emerging.” The NRS EFL is not reported to learners, but for NRS accountability purposes, this learner would be classified into the “Beginning Basic” level. S/he and would have to earn a score of 300 or higher upon retesting to be classified as exhibiting gain under the NRS.
Figure VIII.1
Sample Score Report: MAPT for Reading

141
The fictitious score report in Figure VIII.2 shows a learner who scored 473 on the MAPT for Mathematics and Numeracy, and is classified into the “Pre-GED” Massachusetts Learner Level. For NRS accountability purposes, the learner would be classified as “High Intermediate,” and would have to achieve a score of at least 500 upon retesting to be classified as achieving educational gain.
Figure VIII.2
Sample Score Report: MAPT for Math
Limitations of MAPT Scores MAPT scores represent an estimate of learners’ proficiency in math or reading according to objectives listed in the Massachusetts ABE Curriculum Frameworks and the skills listed in the NRS EFL descriptors. As we have stressed throughout this technical manual, educational tests, like all psychological measures, are imperfect. Therefore, it is possible that learners’ true proficiencies may be above or below the estimate provided by MAPT. A score range around the scaled score is provided as well, and educators are encouraged to use the score range in discussing learners’ performance on the MAPT. The learner levels and EFLs associated with MAPT scores are very general descriptions of proficiency. Although these descriptions are useful for understanding learners’ performance on the test and for a general description of their skills, other information should be used to describe the strengths and weaknesses of individual learners. For example, the MAPT does not provide diagnostic information within either subject area. Such information would require a much longer exam to reliably measure subcomponents of the math and reading domains. At this juncture, use of the MAPT for placement into instructional programs is also not recommended, although used in conjunction with other information about learners’ knowledge, skills, and abilities, programs may find MAPT scores helpful for such placement, particularly when both pretest and posttest scores are available.

142
Educators who help adult learners interpret their MAPT scores should stress that these scores are approximations of where the learners stand on a continuum of content taught in various ABE classes. They should also stress that any score gains on the MAPT scale are merely indicators of progress on this continuum. In those cases where a learner’s scale score decreases from pretest to posttest, potential reasons for such score decline should be discussed with the learner. Interpreting Aggregate MAPT Scores The MAPT scores are appropriate for measuring adult learners educational gains with respect to the NRS EFLs. However, some caution is needed when interpreting mean MAPT scale scores, due to the nonlinear transformation from the equal-interval IRT (theta) scale to the 200-700 MAPT score reporting scale (as described in Chapter IV). Establishing NRS cut-scores on the theta scale and then forcing them to conform to 100-point intervals means each 100-point interval on the MAPT scale may not correspond to equal distances along the underlying IRT scale. That inequality is what is illustrated in the slightly nonlinear transformation functions shown in Figures IV.1 and IV.2.
Equal interval scales have attractive properties—most notably the property implied by their name: the comparability of equal size intervals throughout the scale range. A thermometer is an everyday example of an equal interval scale: the difference between 20°F and 30°F represents the same difference in the height of mercury in a tube as the difference between 80°F and 90°F. For test score scales, equal interval measurement means that a 10 point gain at, say, Beginning Basic refers to the same increase in amount of proficiency as 10 points gained at level High Intermediate. Additionally, this property allows certain arithmetic operations and certain comparisons among values to be meaningfully made. However, when single scores are of interest (e.g., an examinee wishes to know how many points he or she needs to move to the next EFL), the advantages of equal interval measurement are not needed. Equal interval measurement is also not necessary for measuring gain under the NRS because in this context gain is defined by advancement from one level to another not the magnitude of gain. Indeed, the advantages of equal interval measurement are only present when summarizing or comparing scores. Consequently, the arithmetic mean and standard deviation cannot meaningfully be computed for MAPT scores except conditionally in the ranges 201-399, 400-499, and 500-699. (Of course, computing of these statistics is easily done for any set of MAPT scores; however, their meaningfulness is subject to doubt when based on scores spanning multiple ranges.) For this reason, it is recommended that θ scores be used for any analyses that require computation of these statistics.
In summary, for reporting individual scores or for computing gain under the NRS, MAPT
scale scores are convenient and comprehensible. When summarizing multiple scores or comparing scores gains spanning multiple educational functioning levels, it is advisable to use IRT proficiency scores rather than MAPT scale scores.

143
IX. Looking Forward: Next Steps for the MAPT During fiscal 2007, thousands of adult learners took one or more MAPT exams (see Appendix E for numbers of MAPT tests administered, by month). These learners took assessments targeted to the instruction they received, and their performance was judged against national proficiency standards developed by the U.S. Department of Education (DAEL, 2006). However, educational test development and test evaluation are dynamic processes. As more and more adult learners take the MAPT, we will learn more about its utility for instructional and accountability purposes, and our goal is to continuously improve the MAPT to help serve the assessment needs of adult learners and educators in Massachusetts. Even at this early point in this new testing program, our research and experience points to several areas that could be investigated. A listing of some of our current research and test development activities include:
• Developing assessments for Adult Basic Education Literacy (Level 1) students • Revisiting the MAPT for Reading test specifications to revise or clarify the Purposes for
Reading, and revise or clarify the Skill Area of Word Recognition • Embellishment of the item pools for both subject areas to keep the content domain fresh.
Developing and piloting new items, particularly more difficult items on the Reading test. Each year, new items are added to the pool and calibrated onto the operational scale (see Chapter IV)
• Developing score reports to support the diagnosis of specific skills acquired or lacking at the class or program level
• New, non-multiple-choice, item formats could be piloted to see if they improve measurement of learners’ knowledge and skills. At this point, some innovative math items have been developed and so it is possible future MAPT exams will include these new item formats
• Although learners throughout the Commonwealth have successfully taken MAPT exams, this is not the case in the Massachusetts prison system where prisoners are not allowed access to the Internet. An important task for the near future should be to provide access to the MAPT for incarcerated learners
• Currently, there are no MAPT exams for learners at the lowest levels (pre-literate). Work has already begun on the development of Level 1 tests that can be integrated into the current MAPT
• The MAPT could also be extended into other subject areas such as Writing, Civics, and Computer Technology. The cost of developing tests in these areas is formidable, but the advantages of the MAPT design would improve assessment of these proficiencies. Assessment of English proficiency is another area in which new MAPT exams could be extremely useful.
• To better evaluate the utility of the MAPT, the opinions and experiences of ABE educators and learners throughout the Commonwealth will be systematically solicited. Surveys, interviews, and focus groups are some means through which the effects of MAPT will be evaluated.
• The use of the MAPT for evaluating educational gain should be further evaluated by studying typical gains made by learners, and by establishing criteria for gains within EFLs that represent meaningful amounts of achievement.

144
The utility of the MAPT is just starting to unfold. These tests are important components
of the curriculum, instruction, assessment, and accountability activities that are key learners’ success in reaching their educational goals. By keeping the assessment process collaborative among the field of ABE educators, the Massachusetts Department of Education, the test developers, and the learners, these exams will continue to meet the assessment needs of adult educators throughout the Commonwealth.

145
References
Adult and Community Learning Services (2005a). Massachusetts adult basic education curriculum framework for the English language arts. Malden: MA: Massachusetts Department of Education. Available at http://www.doe.mass.edu/acls/frameworks.
Adult and Community Learning Services (2005b). Massachusetts adult basic education
curriculum framework for mathematics and numeracy. Malden: MA: Massachusetts Department of Education. Available at http://www.doe.mass.edu/acls/frameworks.
American Educational Research Association, American Psychological Association, & National
Council on Measurement in Education (1999). Standards for educational and psychological testing. Washington, DC: American Educational Research Association.
American Federation of Teachers, National Council on Measurement in Education, & National
Education Association (1990). Standards for teacher competence in educational assessment of students. Washington, DC: American Federation of Teachers.
Anastasi, A. (1988). Psychological testing (6th edition). New York: Macmillan. Angoff, W. H. (1971). Scales, norms, and equivalent scores. In R. L. Thorndike (Ed.),
Educational measurement (pp. 508-600). Washington, DC: American Council on Education.
Baldwin, P. & Sireci, S. G. (2003, December). Preliminary specifications for ACLS Mathematics
and Numeracy Proficiency Tests. Center for Educational Assessment Research Report No. 510. Amherst, MA: Center for Educational Assessment, University of Massachusetts Amherst.
Bartram, D., & Hambleton, R. K. (Eds.) (2006). Computer-based testing and the internet:
Issues and advances. West Sussex, England: John Wiley & Sons. Bloom, B. S., et al. (Eds.). (1956). Taxonomy of educational objectives: Handbook I, cognitive
domain. New York: D. McKay. Brennan, R. L. (2002, October). Estimated standard error of a mean when there are only two
observations. CASMA Technical Note Number 1. Iowa City, IA: Center for Advanced Studies in Measurement and Assessment, University of Iowa.
Cizek, G. J. (1996). Setting passing scores. [An NCME instructional module]. Educational
Measurement: Issues and Practice, 15 (2), 20-31. Cizek, G. J. (2001). More unintended consequences of high-stakes testing. Educational
Measurement: Issues and Practice, 20 (4), 19-27.

146
Cizek, G. J., Bunch, M. B., & Koons, H. (2004). Setting performance standards: Contemporary methods. Educational Measurement: Issues and Practice, 23(4), 31-50.
Cronbach, L. J. (1971). Test validation. In R.L. Thorndike (Ed.). Educational measurement
(2nd ed., pp. 443-507). Washington, DC: American Council on Education. Curry, D., Schmitt, M. J., & Waldron, S. (1996, July). Framework for adult numeracy standards:
The mathematical skills and abilities adults need to be equipped for the future, Boston, MA: The Adult Numeracy Practitioners Network.
Delton, J. Using reponse time to examine examinee effort. Center for Educational Assessment
Research Report No. 667. Amherst, MA: Center for Educational Assessment, University of Massachusetts.
Deng, N., & Hambleton, R. K. Checking the dimensionality of the Massachusetts Adult
Proficiency Test with both real and simulated data. Center for Educational Assessment Research Report No. 673. Amherst, MA: Center for Educational Assessment, University of Massachusetts.
Division of Adult Education and Literacy (2006, July). Implementation guidelines: Measures
and methods for the national reporting system in adult education. Office of Vocational and Adult Education, U.S. Department of Education, Washington: DC. Available at http://www.nrsweb.org/foundations/implementation_guidelines.aspx.
Downing, S. M., & Haladyna, T. M. (1997). Test item development: Validity evidence from
quality assurance procedures. Applied Measurement in Education, 10, 61-82. Ferrara, S., Perie, M., & Johnson, E. (2002, April). Setting performance standards: The item-
descriptor matching procedure. Paper presented at the meeting of the National Council on Measurement in Education, New Orleans, LA.
Ferrara, S., Perie, M., & Johnson, E. (2008). Matching the judgmental task with standard setting
panelist expertise: The item-descriptor matching procedure. Journal of Applied Testing Technology, 9 (1). http://www.testpublishers.org/Documents/JATT2008_Ferrara%20et%20al.%20IDM.pdf.
Fraser, C., & Mac Donald, R. P. (1988). NOHARM: Least squares item factor analysis.
Multivariate Behavioral Research 23, 267-269. Gessaroli, M. E., & De Champlain, A. F. (1996). Using an approximate chi-square statistic to
test the number of dimensions underlying the responses to a set of items. Journal of Educational Measurement, 33, 157-179.
Guilford, J. P. (1946). New standards for test evaluation. Educational and Psychological
Measurement, 6, 427-439.

147
Haladyna, T. M. (1994). Developing and validating multiple-choice test items. Hillsdale: Lawrence Erlbaum.
Haladyna, T. M., & Downing, S. M. (1989). A taxonomy of multiple-choice item writing rules.
Applied Measurement in Education, 2, 37-50. Hambleton, R. K. (1989). Principles and selected applications of item response theory. In R. Linn
(Ed.), Educational Measurement (3rd ed., pp. 147-200). New York: Macmillan. Hambleton, R. K. (2001). Setting performance standards on educational assessments and criteria
for evaluating the process. In G. J. Cizek (Ed.), Setting performance standards: Concepts, methods, and perspectives (pp. 89–116). Hillsdale, NJ: Erlbaum.
Hambleton, R. K. & Novick, M. (1973). Toward an integration of theory and method for criterion-
referenced tests. Journal of Educational Measurement, 10(3), 159-170. Hambleton, R. K., & Pitoniak, M. J. (2006). Setting performance standards. In R. Brennan (Ed.)
Educational measurement: 4th edition (pp. 433-470). Westport, CT: Praeger. Hambleton, R. K., & Swaminathan, H. (1985). Item response theory: principles and
applications. Boston, MA: Kluwer Academic Publishers. Hambleton, R. K., Swaminathan, H., & Rogers, H. J. (1991). Fundamentals of item response
theory. Newbury Park, CA: Sage. Hambleton, R. K., Zaal, J. N., & Pieters, P. (1991). Computerized adaptive testing: Theory,
applications, and standards. In R. K. Hambleton & J. N. Zaal (Eds.), Advances in educational and psychological testing (pp. 341–366). Norwell, MA: Kluwer.
Han, K. T., Baldwin, P., & Sireci, S. G. (2006). Analyses of differential item functioning of
potential MAPT items. Center for Educational Assessment Research Report No. 612. Amherst, MA: Center for Educational Assessment, University of Massachusetts.
Huff, K. L., & Sireci, S. G. (2001). Validity issues in computer-based testing. Educational
Measurement: Issues and Practice, 20 (3), 16-25. Impara, J.C., & Plake, B.S. (1997). Standard setting: An alternative approach. Journal of
Educational Measurement, 34, 353-366 Jenkins, J. G. (1946). Validity for what? Journal of Consulting Psychology, 10, 93-98.
Jodoin, M. L., Zenisky, A. L., & Hambleton, R. K. (2006). Comparison of the psychometric properties of several computer-based test designs for credentialing exams with multiple purposes. Applied Measurement in Education, 19, 203-220.

148
Kaira, L. T., & Sireci, S. B. (2007). Evaluating the content validity of a multistage adaptive test. Center for Educational Assessment Research Report No. 656. Amherst, MA: Center for Educational Assessment, University of Massachusetts.
Kane, M. T. (1992). An argument-based approach to validity. Psychological Bulletin, 112, 527-
535. Kane, M. T. (1994). Validating the performance standards associated with passing scores.
Review of Educational Research, 64, 425–461.
Kane, M. T. (2001). So much remains the same: Conception and status of validation in setting standards. In G. Cizek (Ed.), Setting performance standards: Concepts, methods and perspectives (pp. 53-88). Mahwah, NJ: Erlbaum.
Karantonis, A., & Sireci, S. G. (2006). The bookmark standard setting method: A literature review. Educational Measurement: Issues and Practice, 25 (1), 4-12.
Li, S. (2006). Evaluating the consistency and accuracy of the proficiency classifications using item
response theory. Unpublished doctoral dissertation, University of Massachusetts Amherst. Linn, R. L., & Gronlund, N. E. (2000). Measurement and assessment in teaching (8th edition).
Upper Saddle River, NJ: Prentice-Hall. Livingston, S. A., & Lewis, C. (1995). Estimating the consistency and accuracy of classifications
based on test scores. Journal of Educational Measurement, 32, 179-197. Livingston, S. A., & Zieky, M. J. (1982). Passing scores: A manual for setting standards of
performance on educational and occupational tests. Princeton, NJ: Educational Testing Service.
Livingston, S. A., & Zieky, M. J. (1989). A comparative study of standard setting methods.
Applied Measurement in Education, 2, 121-141. Luecht, R. (2005). Some useful cost-benefit criteria for evaluating computer-based test delivery
models and systems. Journal of Applied Testing Technology (available at http://www.testpublishers.org/Documents/JATT2005_rev_Criteria4CBT_RMLuecht_Apr2005.pdf).
Martone, D. (2007). Exploring the process and results of teachers’ participation in an
assessment-standards alignment study. Unpublished dissertation, University of Massachusetts Amherst.

149
Martone, D., Goodridge, B., Moses, M., & Titzel. J. (2004, September). Refinements to ABE mathematics standards for assessment purposes. Center for Educational Assessment Research Report No. 548. Amherst, MA: Center for Educational Assessment, University of Massachusetts.
Martone, D., Sireci, S. G., & Delton, J. (2007). Methods for evaluating the alignment between
state curriculum frameworks and state assessments. Center for Educational Assessment research report No 603. Amherst, MA: Center for Educational Assessment, University of Massachusetts Amherst
Martone, D., Smith, C., Kaira, L., & Sireci, S. G. (2006). Proposed revised specifications for
MAPT for reading. Center for Educational Assessment Research Report No. 548. Amherst, MA: Center for Educational Assessment, University of Massachusetts.
Massachusetts Adult Basic Education Performance Accountability Working Group (2002,
September). PAWG final report. Malden, MA: Massachusetts Department of Education. Available at http://www.doe.mass.edu/acls/pawg/report0902.pdf.
Massachusetts Department of Elementary and Secondary Education (2005). 2004 MCAS
technical report. Malden, MA: Author. Available at http://www.doe.mass.edu/mcas/2005/news/04techrpt.doc.
Meara, K. P., Hambleton, R. K., & Sireci, S. G. (2001). Setting and validating standards on
professional licensure and certification exams: A survey of current practices. CLEAR Exam Review, 12 (2), 17-23.
Messick, S. (1989). Validity. In R. Linn (Ed.), Educational measurement, (3rd ed.) (pp. 13-
103). Washington, DC: American Council on Education. Mislevy, R. J., & Knowles, K. T. (Eds.) (2002). Performance assessments for adult education:
Exploring the measurement issues. Washington, DC: National Academy of Sciences Press.
Nellhaus, J. M. (2000). States with NAEP-like performance standards. In M. L. Bourque & S.
Byrd. Student performancestandards on the National Educational Assessment of Educational Progress: Affirmation and improvements (pp. 99–130). Washington, DC: National Assessment Governing Board. Retrieved July 23, 2005 from http://www.nagb.org/pubs/student perfstandard.pdf.
Nunnally, J. C. (1978). Psychometric theory. New York: MacGraw-Hill. O’Neil, T., Sireci, S. G., & Huff, K. L. (2004). Evaluating the consistency of test content across two
successive administrations of a state-mandated science assessment. Educational Assessment, 9, 129-151.

150
Plake, B. S. (1998). Setting performance standards for professional licensure and certification. Applied Measurement in Education, 11(1), 65-80.
Popham, W. J. (1992). A tale of two test-specification strategies. Educational Measurement:
Issues and Practice, 11(2), 16-17, 22. Ramsey, P. A. (1993). Sensitivity review: The ETS experience as a case study. In P.W. Holland
& H. Wainer (Eds.), Differential item functioning (pp. 367-388). Hillsdale, New Jersey: Lawrence Erlbaum.
Roach, A. T., Elliott, S. N., & Webb, N. L. (2005). Alignment of an alternate assessment with
state academic standards: Evidence for the content validity of the Wisconsin Alternate Assessment. The Journal of Special Education, 38(4), 218-231.
Rudner, L.M. (2001). Computing the expected proportions of misclassified examinees. Practical Assessment, Research & Evaluation, 7(14).
Rudner, L.M. (2004). Expected classification accuracy. Paper presented at the annual meeting of the National council on Measurement in Education. San Diego, CA.
Sands, W. A., Waters, B. K., & McBride, J. R. (Eds.) (1997). Computerized adaptive testing: From inquiry to operation. Washington, DC: American Psychological Association.
Shepard, L. A. (1993). Evaluating test validity. Review of Research in Education, 19, 405-450. Sireci, S. G. (1998a). Gathering and analyzing content validity data. Educational Assessment, 5,
299-321. Sireci, S. G. (1998b). The construct of content validity. Social Indicators Research. Sireci, S. G. (2003a). Content validity. Encyclopedia of psychological assessment (pp. 1075-
1077). London: Sage. Sireci, S. G. (2003b). Validity. Encyclopedia of psychological assessment (pp. 1067-1069).
London: Sage. Sireci, S. G. (2004). Computerized-adaptive testing: An introduction. In J. Wall & G. Walz
(Eds). Measuring up: Assessment issues for teachers, counselors, and administrators (pp. 685-694). Greensboro, NC: CAPS Press.
Sireci, S. G., Baldwin, P., Keller, L. A., Valle, M., Goodridge, B., Leonelli, E., Schmitt, M. J.,
Tamarkin, K., & Titzel, J. (2004). Specifications for the ACLS Mathematics and Numeracy Proficiency Tests. Center for Educational Assessment Research Report No. 513. Amherst, MA: Center for Educational Assessment, University of Massachusetts.

151
Sireci, S.G, Baldwin, P., Martone, A., Zenisky, A., Hambleton, R.K., & Han, K. T. (October, 2006) Massachusetts Adult Proficiency Tests Technical Manual. Center for Educational Assessment, University of Massachusetts Amherst.
Sireci, S G., Martone, A., Smith, C., Kaira, L., Coffey, N., Haller, L. H., Hartwick, L., O’Brien,
A., McGill, D., Stearns, D., & Schwerdtfeger, J. (2007). Proposed revisions to the MAPT for reading test specifications. Center for Educational Assessment Research Report No. 632. Amherst, MA: Center for Educational Assessment, University of Massachusetts
Sireci, S. G., Li, S., Martone, A., Valle, M., Bayer, J., Kelly, J., Hanley, S., Greene, S., Royer, J.
M., & Schwerdtfeger, J. (2004). Specifications for the ACLS Reading Proficiency Tests. Center for Educational Assessment Research Report No. 514. Amherst, MA: Center for Educational Assessment, University of Massachusetts.
Sireci, S. G., & Mullane, L. A. (1994). Evaluating test fairness in licensure testing: the sensitivity
review process. CLEAR Exam Review, 5 (2) 22-28. Sireci, S. G., Robin, F., Meara, K., Rogers, H. J., & Swaminathan, H. (2000). An external
evaluation of the 1996 Grade 8 NAEP Science Framework. In N. Raju, J.W. Pellegrino, M.W. Bertenthal, K.J. Mitchell & L.R. Jones (Eds.), Grading the nation’s report card: Research from the evaluation of NAEP (pp. 74-100). Washington, DC: National Academy Press.
Sireci, S. G., Robin, F., & Patelis, T. (1999). Using cluster analysis to facilitate standard setting.
Applied Measurement in Education, 12, 301-325. Stein, S. (2000). Equipped for the future content standards: What adults need to know and be
able to do in the 21st century. Washington, DC: National Institute for Literacy. ED Pubs document EX0099P.
Thompson, S., & Thurlow, M. (2002, June). Universally designed assessments: Better tests for
everyone! Policy Directions, Number 14. Minneapolis, MN: National Center on Educational Outcomes.
Thompson, S., Thurlow, M., & Malouf, D. B. (2004). Creating better tests for everyone through
universally designed assessments. Journal of Applied Testing Technology, 6(1). Available at http://www.testpublishers.org/jattart.htm.
Toops, H. A. (1944). The criterion. Educational and Psychological Measurement, 4, 271-297. Valle, M., & Sireci, S. G. (2003, December). Developing specifications for ACLS reading
proficiency tests. Center for Educational Assessment Research Report No. 511, Amherst, MA: Center for Educational Assessment, University of Massachusetts Amherst.

152
Valle, M., Sireci, S. G., Bayer, J., Kelly, J., Hanley, S., & Greene, S. (2004). Proposed refinements to ABE Reading Test Specifications: Revisions to the Reading Standards for Assessment. Center for Educational Assessment Research Report No. 555. Amherst, MA: Center for Educational Assessment, University of Massachusetts.
Wainer, H. (Ed.) (2000). Computerized adaptive testing: A primer (2nd edition). Hillsdale, NJ:
Lawrence Erlbaum. Webb, N. L. (1999). Research monograph no. 18: Alignment of Science and Mathematics
standards and assessments in four states. Washington, D.C.: Council of Chief State Schools Officers.
Webb, N. L., Alt, M., Ely, R., Cormier, M., & Vesperman, B. (2005). The WEB alignment tool: Development, refinement, and dissemination. Washington, D.C.: Council of Chief State School Officers.
Wise, S. L. & Kong, X. (2005). Response time effort: A new measure of examinee motivation in computer-based tests. Applied Measurement in Education, 18(2), 163-183.
Zenisky, A. L., & Sireci, S. G. (2002). Technological innovations in large-scale assessment.
Applied Measurement in Education, 15, 337-362. Zimowski, M., Muraki, E., Mislevy, R. J., & Bock, R. D. (2002). BILOG-MG [Computer
software]. Lincolnwood, IL: Scientific Software International.

153
Appendices
Appendix A
List of Center for Educational Assessment Research Reports Related to MAPT
Year CEA
Report # Citation
2003 CEA-510 Sireci, S. G., Baldwin, P. Preliminary Specifications for ACLS Mathematics and Numeracy Proficiency Tests.
2003 CEA-511 Valle, M., & Sireci, S. G. Preliminary specifications for ACLS Reading Proficiency Tests.
2004 CEA-513 Sireci, S. G., Baldwin, P., Keller, L. A., Valle, M., Goodridge, B., Leonelli, E., Schmitt, M. J., Tamarkin, K., & Titzel, J. Specifications for the ACLS Mathematics and Numeracy Proficiency Tests.
2004 CEA-516 Sireci, S. G., Li, S., Martone, A. , Valle, M. Bayer, J., Kelly, J., Hanley, S., Greene, S., Royer, J. M., & Schwerdtfeger, J. Specifications for the ACLS Reading Proficiency Tests.
2004 CEA-535 O’Neil, T., Zenisky, A. L., & Sireci, S. G. Viability analysis of current computer-based testing options for adult basic education in the state of Massachusetts.
2004 CEA-536 Zenisky, A. L., Hambleton, R. K., & Sireci, S. G. Computerized testing options for adult basic education assessment in Massachusetts.
2004 CEA-548 Martone, D., Goodridge, B., Moses, M., & Titzel, J. Refinements to ABE mathematics standards for assessment purposes.
2004 CEA-555 Valle, M., Sireci, S. G., Bayer, J., Kelly, J., Hanley, S., & Greene, S. Proposed refinements to ABE Reading Test Specifications: Revisions to the Reading Standards for Assessment.
2005 CEA-563 Zenisky, A. L., & Sireci, S. G. No adult left behind, either: Creating large-scale computer-based tests for adult basic education students.
2005 CEA-583 Baldwin, P., Martone, D., Zenisky, A., Sireci, S. G., & Hambleton, R. K. Massachusetts Adult Proficiency Tests: Summary of spring 2005 pilot test results.
2006 CEA-593 Zenisky, A. L., & Baldwin, P. Using item response time data in test development and validation: Research with beginning computer users.
2006 CEA-600 Sireci, S. G., Baldwin, P., Martone, D., Hambleton, R. K., & Zenisky, A. L. Massachusetts Adult Proficiency Tests Technical Manual.
2006 CEA-603 Martone, D., Sireci, S. G., & Delton. Methods for evaluating the alignment between state curriculum frameworks and state assessments.
2006 CEA-607 Sireci, S. G. Test accommodations and the Massachusetts Proficiency Test for adults.
2006 CEA-612
Han, K., Baldwin, P., & Sireci, S.G. Analyses of differential item functioning of potential MAPT items. Center for Educational Assessment Research Report No. 612. Amherst, MA: Center for Educational Assessment, University of Massachusetts.

154
Year CEA
Report # Citation
2006 CEA-614 Martone, D., Smith, C., Kaira, L., Sireci, S. G., Coffee, N., Haller, H., Hartwick, L., O’Brien, A., McGill, D., Stearns, D., & Schwerdtfeger, J. Proposed revised specifications for MAPT for reading.
2007 CEA-632 Sireci, S G., Martone, A., Smith, C., Kaira, L., Coffey, N., Haller, L. H., Hartwick, L., O’Brien, A., McGill, D., Stearns, D., & Schwerdtfeger, J. Proposed revisions to the MAPT for reading test specifications.
2007 CEA-634 Sireci, S. G., Baldwin, P., Martone, D., & Han, K. Establishing achievement levels on a multi-stage computerized-adaptive test: An application of the Item Descriptor Matching Method.
2007 CEA-640 Sireci, S. G., Wells, C. S., Baldwin, P., & Han, K. T. Evaluating item parameter drift in computerized-adaptive testing.
2007 CEA-656 Kaira, L. T., & Sireci, S. B. Evaluating the content validity of a multistage adaptive test.
2007 CEA-657 Shea, C. M., & Sireci, S. G. Combining standard setting and content validity studies.
2007 CEA-663 Wells, C. S., Sireci, S. G., & Han, K. T. Identifying item parameter drift in multistage adaptive tests.
2007 CEA-668 Liang, T., Wells, C.S., & Sireci, S. G. Evaluating item parameter drift in computerized adaptive testing.
2008 CEA-667 Delton, J. Using reponse time to examine examinee effort.
2008 CEA-668 Lam, W., Li., S., & Sireci, S. G. Evaluating decision consistency and decision accuracy on a multistage test.
2008 CEA-673 Deng, N., & Hambleton, R. K. Checking the dimensionality of the Massachusetts Adult Proficiency Test with both real and simulated data.
2008 CEA-676
Martone, A., Sireci, S. G., & Griffin, L. (2008, April). Exploring the process and results of teachers’ participation in an assessment-standards alignment study. Paper presented at the annual meeting of the New England Educational Research Organization.

155
Appendix B
Lists of MAPT Committee Members
MAPT for Mathematics and Numeracy - Test Specification Development Committee Barbara Goodridge Lowell Adult Education Center Esther Leonelli Notre Dame Education Center Mary Jane Schmitt TERC Kenny Tamarkin System for Adult Basic Education Support Judith Titzel World Education Jane Schwerdtfeger Massachusetts Department of Education Stephen G. Sireci Center for Educational Assessment Staff Peter Baldwin Center for Educational Assessment Staff Lisa A. Keller Center for Educational Assessment Staff Mercedes Valle Center for Educational Assessment Staff
MAPT for Reading - Test Specification Development Committee
Jeri Bayer Northern Essex Community College Sylvia Greene Cambridge Community Learning Center Stephen Hanley WAITT House Janet Kelly Read/Write/Now Adult Literacy Center, Springfield James M. Royer University of Massachusetts Amherst Jane Schwerdtfeger Massachusetts Department of Education Stephen G. Sireci Center for Educational Assessment Staff Shuhong Li Center for Educational Assessment Staff Andrea Martone Center for Educational Assessment Staff Mercedes Valle Center for Educational Assessment Staff
MAPT for Mathematics and Numeracy - Item Reviewers
Barbara Goodridge Lowell Adult Education Center Marilyn Moses Brockton Adult Education Center Judith Titzel World Education
MAPT for Reading - Item Reviewers
Jackie Coelho QCC Continuing Education Program, Worcester Sylvia Greene Cambridge Community Learning Center Janet Kelly Read/Write/Now Adult Literacy Center, Springfield Deborah McGill The Immigration Learning Center, Malden

156
Sensitivity Review Committee
Bob Chulu Chancellor’s College Saul Augustine Catholic Charitable/Haitian Multiservice Center Ernest Best Mass ALL Papa Diop Perkins Community Center and WAITT House Sylvia Greene Cambridge Community Learning Center Maria Kallifanou QCC/College at CitySquare Amy Park Asian American Civic Association Victor Tavares SER-Jobs for Progress (Family Center)
MAPT for Mathematics and Numeracy - Content Validity Panel
Jeanne Almanzar Valley Opportunity Council Barbara Goodridge Lowell Adult Education Center Martha Mangan Lowell Adult Education Center Suzanne Martin Brockton Adult Education Center Marilyn Moses Brockton Adult Education Center Lee Wertheimer Valley Opportunity Council
MAPT for Reading - Content Validity Panel
Jon Chapman Crittenton Sylvia Greene Cambridge Community Learning Center Helen Haller Jamaica Plain Community Center Stephen Hanley WAITT House Laurie Hartwick Lawrence Adult Learning Center Andrea O'Brien Lawrence Adult Learning Center Jane Schwerdtfeger Massachusetts Department of Education
MAPT for Mathematics and Numeracy - Standard Setting Panel
Jeanne Almanzar Valley Opportunity Council Donna Cornellier Massachusetts Department of Education Patricia Donovan World Education Veronica Kell Mount Wachusett Community College Raymunda Lagmay-Carter Cambridge Community Learning Center Julianne Leger-Fullerton International Institute of Boston Esther Leonelli Notre Dame Education Center Shirley Lyon Northern Essex Community College Judith Titzel World Education Lee Wertheimer Valley Opportunity Council

157
MAPT for Reading - Standard Setting Panel 2006
Jeri Bayer Northern Essex Community College Jon Chapman Crittenton Nancy Coffey Operation Bootstrap, Lynn Janet Fischer Northern Essex Community College Helen Haller Jamaica Plain Community Center Stephen Hanley WAITT House Laurie Hartwick Lawrence Adult Learning Center Janet Kelly Read/Write/Now Adult Literacy Center, Springfield Andrea O'Brien Lawrence Adult Learning Center Jane Schwerdtfeger Massachusetts Department of Education
David Stearns Jamaica Plain Community Center
MAPT for Reading - Standard Setting Panel 2007
Jeanne Almanzar Valley Opportunity Council Mary Diggle The Log School/FDNH, Dorcester, MA Martha Jean Community Action Inc., Haverhill, MA Judy Kocik Literacy Project, Amherst Evonne Peters Operation Bootstrap
Maureen McIsaac Middlesex Community College, Bedford Glenna Zelenski Lawrence Adult Learning Program Michelle Faith-Brown Read/Write/Now, Springfield, MA Jody Price South of Boston Linda Johnson United South End Settlements Kimberly Kayser Mt. Wachusett Comm. College/Devens Adult Learning Ctr. Bllu Catalano Worker Education Program Boston Area
MAPT for Reading - Test Specification Revision Committee
Helen Haller Jamaica Plain Community Center Andrea O'Brien Lawrence Adult Learning Center Laurie Hartwick Lawrence Adult Learning Center Deborah McGill The Immigration Learning Center, Malden Nancy Coffey Operation Bootstrap, Lynn David Stearns Jamaica Plain Community Center

158
MAPT for Reading - Beginning Literacy Test Development Sylvia Greene Cambridge Community Learning Center Maureen McIsaac Middlesex Community College, Bedford Ellen Crevison Literacy Volunteers of America, Quincy Judith Kocik Literacy Project, Amherst Susan Haberstroh Blue Hills Regional Technical School, Canton
Reading Adult Basic Education Standards Revision Project
Susan Lane Riley SCALE, Somerville Toni Borge Bunker Hill Community College Ellen Koretz Charlestown Commun. Center/North Shore Comm. College Glenna Zalenski Lawrence Adult Learning Program Evonne Peters Marblehead Public Schools Beverly Rosario Massachusetts Department of Corrections, Norfolk Amy Trawick University of Tennessee, Knoxville. Jane Schwerdtfeger Massachusetts Department of Education Drey Martone Center for Educational Assessment Staff

159
Appendix C
Links to Additional Resources
ACLS General Website http://www.doe.mass.edu/acls ACLS Assessment Website http://www.doe.mass.edu/acls/assessment/ The above URL links to: MAPT Login Page (for MAPT tests, practice tests, and Sample Questions) MAPT
Practice Tests (20 Items) MAPT Computer Basics MAPT Teacher and Test Administrator Manual FY08 Correlation of MAPT Scores to ABE Curriculum Frameworks, Grade Level
Equivalents (GLEs), and National Reporting System (NRS) Levels MAPT Learner Information Sheet Testing--Standardized and Otherwise--and the Massachusetts ABE Pilot Test: A Curriculum Unit for ABE Classes ACLS Curriculum Frameworks http://www.doe.mass.edu/acls/frameworks/
NRS Website http://www.nrsweb.org Education Functioning Level Descriptors http://www.nrsweb.org/docs/EFL_Descriptors.doc
MAPT for Mathematics and Numeracy Test Specification Report http://www.doe.mass.edu/acls/mailings/2004/0709/ (see Assessment Update) MAPT for Reading Test Specification Report http://www.doe.mass.edu/acls/mailings/2004/0709/ (see Assessment Update)
Massachusetts ABE Curriculum Framework for Mathematics and Numeracy http://www.doe.mass.edu/acls/frameworks/mathnum.doc

160
Appendix D
Expanded NRS EFL Descriptions
Expanded Reading NRS definitions NRS EFL descriptors are in bold. Additional skills relevant to the MA Curriculum Frameworks are in regular font. Beginning Basic (GLE 2.0-3.9) • Individual can read simple material on familiar subjects • Comprehend simple and compound sentences in single or linked paragraphs containing
a familiar vocabulary • Fill out basic form information • Strategies for decoding • Basic sight word vocabulary • Read very basic instructions • Read controlled vocabulary stories (Sam and Pat stories) • Read high interest stories with familiar vocabulary (sports, horoscopes, celebrities) –
personally relevant, everyday experiences • Read silently • Displays with white space, and simple graphics Low Intermediate Basic (GLE 4.0-5.9) • Individual can read text on familiar subjects that have a simple and clear underlying
structure (e.g., clear main idea, chronological order) • Can use context to determine meaning • Can interpret actions required in specific written directions • Read familiar subject text • Traditional structure text – first sentences main idea, ordered examples • Transition from learning to read to reading to learn • Read some Early English News • Concrete not abstract reading – not necessary to be personally relevant • Not controlled vocabulary • Simplified biographies • Some health materials written for the general public • Read local papers, USA Today • Begin to study for learner’s permit • Still need familiar vocabulary • Use context to determine meaning • Graphics with more information High Intermediate Basic (GLE 6.0-8.9)

161
• Individual is able to read simple descriptions and narratives on familiar subjects or from which new vocabulary can be determined by context
• Can make some minimal inferences about familiar texts • Compare and contrast information from such texts but not consistently • Read non-fiction descriptions • Longer, multi-paragraph texts with longer paragraphs that require readers to sustain interest • Can handle academic content • Reading to learn • Working with Pre-GED materials • Reading is more automatic • Can read independently • Can learn content area subjects from reading (science, social studies) • Developing academic vocabulary • Sophisticated in interpreting literature • Independently using more reading strategies • Identify and utilize prefix, suffix, and root words with unfamiliar vocabulary • Authentic texts – poems, drama • Popular reading magazines • Periodicals with short passages Low Adult Secondary (GLE 9.0-10.9) • Individual can comprehend expository writing and identify spelling, punctuation, and
grammatical errors • Can comprehend a variety of materials such as periodicals and nontechnical journals
on common topics • Can comprehend library reference materials • Can identify the main idea in reading selections • Use a variety of context issues to determine meaning • Understand different literary devices – character development, simile/metaphor, elements of
fiction, tone, figurative language • Context used to interpret tone • Use schemas to interpret reading • Use whole text for more sophisticated understanding • Apply information from text • Understand more sophisticated texts • Comprehend array of genres • Read non-technical journals • Compare/contrast and infer ideas • Read popular novels • Basic periodicals (Time magazine) – more issue oriented • Herald editorial

162
High Adult Secondary (11.0-12.9) • Individual can comprehend, explain, and analyze information from a variety of literacy
works, including primary source materials and professional journals • Can use context cues • Higher order processes to interpret meaning of written material • Comprehend sarcasm/irony (e.g. political cartoons) • Relate information to ideas, synthesize ideas • Make sophisticated connections • Abstract and theoretical understanding • Develop new ideas based on texts to create new meaning • Evaluate persuasiveness of author/text • Make judgments of text – credibility • Determine bias in sophisticated texts • Read classic novels • Globe editorials • Complete college applications, FAFSA application

163
Expanded Math NRS definitions NRS EFL descriptors are in bold. Additional skills relevant to the MA Curriculum Frameworks are in regular font. Beginning Basic (GLE 2.0-3.9) • Individual can count, add, and subtract three digit numbers • Can perform multiplication through 12 • Can identify simple fractions • Perform other simple arithmetic operations • count, add, subtract 3 digit #’s • number line • compare order • multiplication through 12 • identify simple fractions (1/2, ¼) • perform other simple arithmetic operations • linear measurement in inches, cm • simple word problems (+, -) • measure using whole #’s • identify common shapes (triangle, square, circle) • understand +, -, = • time – hours • skip count to 100 start at 0-2, 5, 10 • identify and count bills in coins • simple patterns Low Intermediate Basic (GLE 4-5.9) • Individual can perform with high accuracy all four basic math operations using whole
numbers up to three digits • Can identify and use all basic mathematical symbols • perform w/high accuracy all 4 basic math operations using whole numbers up to 3 digits (w/3
digit dividend for division • identify and use all basic math symbols (+, -, =, x, division) • identify odd/even • understand math terms – sum, diff., product, quotient • horizontal equations • read and interpret bar graphs • simple pie charts – visually identify components • percentages (25, 50, 75) – recognize • understand concepts of % and how relate to fractions (50% = ½) • several problem solving strategies (guess/check, estimate, draw pictures)

164
• round to 10s & 100s • decimals (2 places) content of money • more complex patterns (use 4 operations) – able to verbalize the pattern • compare areas, volumes, weights • linear measurement to ½ (ruler) • identify simple measurement relationships in one system (3ft = 1yd) • understand liquid measurements • extract simple info from a table • translate written words into mathematical expressions (basic operations, single step) • word problems w/ 4 operations, w/ whole numbers • identify & use >, < w/ whole #’s • time- minutes, quarter/half hour • understand characteristics of simple shapes High Intermediate Basic (GLE 6-8.9) • Individual can perform all four basic math operations with whole numbers and
fractions • Can determine correct math operations for solving narrative math problems • Can convert fractions to decimals and decimals to fractions • Can perform basic operations on fractions • perform all 4 math operations w/ whole #’s and fractions & decimals • determine correct math operations for solving math narrative problems • convert fractions to decimals and vice versa • perform basic operations on fractions • fractions & percentages and apply/compute (1/10, 1/3, 1/5, ½, ¼) (10%, 20%, 50%) • understand why round & what should round to • linear measurements (3 yds = ____ ft) • apply equivalences, proportional reasoning • read & interpret most graphs (id pt on line graphs) • put into on graphs from table • 2 stop word problems • translate more complex words into expressions (2 step) • calculate (+, -) w/equivalences • patterns w/2 steps • know labels of graphs • calc. perimeter & area • word problems w/common fractions & decimals • id neg #s in real life (thermometer) • understand properties of shapes Low Adult Secondary (GLE 9-10.9)

165
• Individual can perform all basic math functions with whole numbers, decimals, and fractions
• Can interpret and solve simple algebraic equations, tables, and graphs • Can develop own tables and graphs • Can use math in business transactions • perform all basic math functions w/whole numbers, fractions, & decimals • interpret and solve simple algebraic equations, tables & graphs • develop own tables and graphs • use math in business transactions • all measurement conv. & calculate • find whole given parts w/% • multi decision word problems – not straight computation • calc. volume • 3D shapes • math vocab (multiplication, (), square root, all GED vocab) • order of operations • solve equations w/substitution • apply problem solving skills to complex problems (reversibility) • apply formulas – plug values • basic probability – simple concept • proportional reasoning • identify relevant vs. extra info • emerging understanding of triangles, angles, perpendicular, parallel • concept of slope High Adult Secondary (GLE 11-12.9) • Individual can make mathematical estimates of time and space • Can apply principles of geometry to measure angles, lines, and surfaces • Can also apply trigonometric functions • make mathematical estimates of time and space • apply principles of geometry to measure angles, lines & surfaces • apply trigonometric functions (tang., cos. sin.) • pythogoreoum theory • calc. w/neg #’s • determine problem • 3D coordinate planes • plot points on 2D plane • simplify equations • distance=rate x time • quadratic equations • apply concepts of triangles, angles, perpendicular, parallel • operate w/integers

166
• complex fractions • compute slope • dist between points • abstract thinking and making a judgments – evaluation and synthesis

167
Appendix E
MAPT Test Administrations by Week: Fiscal 2007 Figure E-1 presents the number of MAPT tests taken for fiscal 2007. The total number of tests administered was 18,587, which includes learners who took the tests more than one posttest as well as learners who only took a pretest. Relatively few learners took the tests in the summer months, and the busiest assessment season was in the fall (September-October), followed by the late spring (May-June).
MAPT Tests by Week 7/06-6/07
0
200
400
600
800
1000
1200
1 3 5 7 9 11 13 15 17 19 21 23 25 27 29 31 33 35 37 39 41 43 45 47 49 51
Week Number
# T
ests
Total tests taken Fiscal 2007: 18,587


![€¦ · Web viewAppendix. Mathematics Proficiency Guide for Teachers of Adult Education ACLS, August 2019 2 [Type the document title] Mathematics Proficiency Guide for Teachers](https://img.dokumen.tips/doc/110x75/5e0a61fdef304c01fc693892/web-viewappendix-mathematics-proficiency-guide-for-teachers-of-adult-education.jpg)