Embed Size (px)
Citation preview

MASS WASTING IN THE WESTERN GALAPAGOS ISLANDS
A Thesis
by
HILLARY FAWN HALL
Submitted to the Office of Graduate Studies of
Texas A&M University
in partial fulfillment of the requirements for the degree of
MASTER OF SCIENCE
August 2011
Major Subject: Oceanography

Mass Wasting in the Western Galapagos Islands
Copyright 2011 Hillary Fawn Hall

MASS WASTING IN THE WESTERN GALAPAGOS ISLANDS
A Thesis
by
HILLARY FAWN HALL
Submitted to the Office of Graduate Studies of
Texas A&M University
in partial fulfillment of the requirements for the degree of
MASTER OF SCIENCE
Approved by:
Chair of Committee, William Sager
Committee Members, Niall Slowey
Robert Weiss
Head of Department, Piers Chapman
August 2011
Major Subject: Oceanography

iii
ABSTRACT
Mass Wasting in the Western Galapagos Islands. (August 2011)
Hillary Fawn Hall, B.S., University of Washington
Chair of Advisory Committee: Dr. William Sager
Oceanic island volcanoes such as those in the Hawaiian, Canary and Galapagos
Islands are known to become unstable, causing failures of the subaerial and submarine
slopes of the volcanic edifices. These mass wasting events appear to be the primary
source of destruction and loss of volume of many oceanic islands, but our knowledge of
mass wasting is still rudimentary in many seamount and island chains. To better
understand mass wasting in the western Galapagos Islands, multi-beam bathymetry and
backscatter sidescan sonar images were used to examine topography and acoustic
backscatter signatures that are characteristic of mass wasting. Observations show that
mass wasting plays an important role in the development of Galapagos volcanoes.
While volcanic activity continues to conceal the submarine terrain, the data show that
four forms of mass wasting are identified including debris flows, slumps sheets, chaotic
slumps, and detached blocks. A total of 23 mass wasting features were found to exist in
the western Galapagos Islands, including fourteen debris flows with one that
incorporated a set of detached blocks, seven slump sheets, and one chaotic slump. Some
of the indentified features have obvious origination zones while the sources of others are
not clearly identifiable. Approximately 73 percent of the surveyed coastlines are

iv
affected by slumping on the steep upper slopes and ~64 percent are affected by debris
flows on the lower slopes. Unlike the giant landslides documented by GLORIA imagery
around the Hawaiian Islands, the western Galapagos Islands appear to be characterized
by small slump sheets existing along the steep shallow submarine flanks of the island
and by debris flows that are flanked by rift zones and extend off the platform. This
study indicates that submarine mass wasting is widespread in the western Galapagos,
suggesting that the production of small-scale downslope movement is part of the erosive
nature of these oceanic volcanic islands.

v
DEDICATION
I dedicate this thesis to my family.
To my parents, Robert and Barbara, and my brother, Jason, for their unconditional love
and inspiration. To Theresa and Phillip Milligan for their encouragement and support
through all of my schooling. To Manav Vashisth for always being by my side and
putting me back on track whenever I started to go astray. I would also like to dedicate
this thesis to the memory of my grandmother Irma, who will be always in my heart.
This work is for all of you.

vi
ACKNOWLEDGEMENTS
I would like to thank my committee chair, Dr. Sager, and my committee
members, Dr. Slowey, and Dr. Weiss, for their guidance and support throughout the
course of this research.
I also want to extend my gratitude to the following organizations and people:
The University of Washington Department of Oceanography for the opportunity to
participate in research in the Galapagos Islands during the TN189 cruise aboard the R/V
Thomas G Thompson, Mark Holmes at the University of Washington for going above
and beyond to help me obtain and analyze my data, and to Jennifer Glass for answering
questions and keeping me in the loop. Thanks also go to my friends and colleagues and
the department faculty and staff for making my time at Texas A&M University a great
experience.

vii
TABLE OF CONTENTS
Page
ABSTRACT .............................................................................................................. iii
DEDICATION .......................................................................................................... v
ACKNOWLEDGEMENTS ...................................................................................... vi
TABLE OF CONTENTS .......................................................................................... vii
LIST OF FIGURES ................................................................................................... ix
LIST OF TABLES .................................................................................................... xi
1. INTRODUCTION ................................................................................................. 1
1.1 Background Information ............................................................................... 1
1.2 Previous Work ............................................................................................... 4
2. METHODS ............................................................................................................ 6
2.1 Data Acquisition ............................................................................................ 6
2.2 Data Processing ............................................................................................. 8
2.3 Data Interpretation ......................................................................................... 9
3. RESULTS .............................................................................................................. 12
3.1 Cerro Azul Region ........................................................................................ 20
3.2 Le Cumbre Region ........................................................................................ 22
3.3 Volcan Ecuador Region ................................................................................ 29
3.4 Roca Redonda Region ................................................................................... 37
3.5 Volcan Wolf Region ...................................................................................... 44
3.6 Canal Isabela Region ..................................................................................... 52
4. DISCUSSION ....................................................................................................... 59
5. CONCLUSION ..................................................................................................... 63

viii
Page
REFERENCES .......................................................................................................... 64
VITA ......................................................................................................................... 68
ix
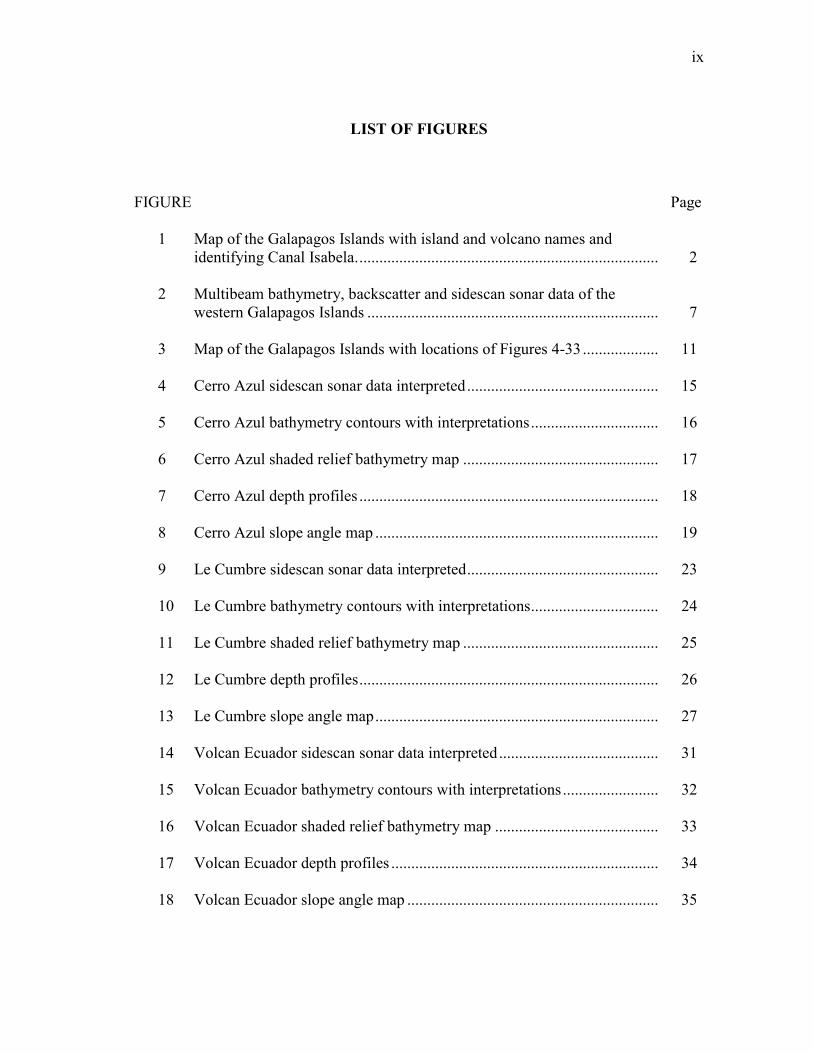
LIST OF FIGURES
FIGURE Page
1 Map of the Galapagos Islands with island and volcano names and
identifying Canal Isabela. ........................................................................... 2
2 Multibeam bathymetry, backscatter and sidescan sonar data of the
western Galapagos Islands ......................................................................... 7
3 Map of the Galapagos Islands with locations of Figures 4-33 ................... 11
4 Cerro Azul sidescan sonar data interpreted ................................................ 15
5 Cerro Azul bathymetry contours with interpretations ................................ 16
6 Cerro Azul shaded relief bathymetry map ................................................. 17
7 Cerro Azul depth profiles ........................................................................... 18
8 Cerro Azul slope angle map ....................................................................... 19
9 Le Cumbre sidescan sonar data interpreted ................................................ 23
10 Le Cumbre bathymetry contours with interpretations ................................ 24
11 Le Cumbre shaded relief bathymetry map ................................................. 25
12 Le Cumbre depth profiles ........................................................................... 26
13 Le Cumbre slope angle map ....................................................................... 27
14 Volcan Ecuador sidescan sonar data interpreted ........................................ 31
15 Volcan Ecuador bathymetry contours with interpretations ........................ 32
16 Volcan Ecuador shaded relief bathymetry map ......................................... 33
17 Volcan Ecuador depth profiles ................................................................... 34
18 Volcan Ecuador slope angle map ............................................................... 35

x
FIGURE Page
19 Roca Redonda sidescan sonar data interpreted .......................................... 39
20 Roca Redonda bathymetry contours with interpretations .......................... 40
21 Roca Redonda shaded relief bathymetry map ............................................ 41
22 Roca Redonda depth profiles ..................................................................... 42
23 Roca Redonda slope angle map ................................................................. 43
24 Volcan Wolf sidescan sonar data interpreted ............................................. 46
25 Volcan Wolf bathymetry contours with interpretations ............................. 47
26 Volcan Wolf shaded relief bathymetry map............................................... 48
27 Volcan Wolf depth profiles ........................................................................ 49
28 Volcan Wolf slope angle map .................................................................... 50
29 Canal Isabela sidescan sonar data interpreted ............................................ 54
30 Canal Isabela bathymetry contours with interpretations ............................ 55
31 Canal Isabela shaded relief bathymetry map .............................................. 56
32 Canal Isabela depth profiles ....................................................................... 57
33 Canal Isabela slope angle map ................................................................... 58

xi
LIST OF TABLES
TABLE Page
1 Cruise Data ................................................................................................. 8
2 A Listing of Slide and Slump Feature Characteristics. .............................. 13

1
2
1. INTRODUCTION
1.1 Background Information
The Galapagos Island Archipelago, a chain of hot-spot produced volcanoes, are
located 1000 km off the northwest coast of South America [Wilson and Hey, 1995].
Recent radiometric dating studies of Espanola, the oldest and longest dormant island,
show that some of the islands have been present for at least the last 3.3 Ma [Bailey,
1976]. The oceanic crust that the islands are built on is not older than 10 Ma [Simkin,
1984] and therefore the islands must be younger. The spacing and locations of the
volcanoes in the western Galapagos Islands can be seen in Figure 1. For the purpose of
this investigation the area defined as the western Galapagos Islands is the area of the
archipelago that lies to the west of Santa Cruz and Santiago islands. The youngest and
most active volcanoes in the archipelago are located on Isabela and Fernandina Islands,
which are located at the western edge of the platform due to eastward movement of the
Nazca Plate relative to the Galapagos hot-spot [Gripp & Gordon, 2002]. While the
Galapagos Islands have many active volcanoes, Fernandina Island’s Le Cumbre volcano
is the most active in the archipelago with greater than 20 witnessed eruptions in the past
two centuries [Simkin and Siebert, 1994], the most recent in April 2009. Continued
volcanism off the west coast of Fernandina and Isabela Island acts to cover the seafloor
[Geist et al., 2006].
Though these islands are geologically young and continue to erupt and grow
larger, the steep cliff faces of the shorelines indicate that the islands have begun to1
This thesis follows the style of Geochemistry, Geophysics, Geosystems.

2
Figure 1. Map of the Galapagos Islands with island and volcano names and identifying Canal Isabela. Inset shows location
with respect to North and South America. Data obtained from MGDS GeoMap App.

3
14
experience mass wasting. Mass wasting is defined as the downhill movement of soil and
rock under the influence of gravity. Coleman and Prior [1988] state that the following
types of mass wasting are common to the subaqueous environment: 1) falls which are
defined as the free-fall of rock, mud or sand sized particles which are restricted to very
steep, near-vertical underwater slopes, 2) slides which are defined as the movement of a
sediment mass along discrete basal shear planes, 3) debris flows which consist of
sediment containing larger clasts that are supported in a matrix, 4) liquefaction flows
which occur when loosely packed, coarse grained sediment collapses, and 5) turbidity
flows which occur due to a downslope transport of sediment that is supported by an
upward component of fluid turbulence. Moore et al. [1989] described debris avalanches
as material generated by collapse along listric faults and they noted that a slump is
generated by the slow ocean-ward movement of a portion of the volcanic flank. Keating
et al. [2000] described chaotic slumping as downslope movement with a highly
disorganized morphology and often contain detached blocks composed of massive slide
blocks that remain intact during downslope movement. The debris avalanches and
slumps described by Moore et al.[1989] and the chaotic slumping and detached blocks
described by Keating et al. [2000] are all considered specific examples of slide types
within the spectrum defined by Coleman and Prior [1988].
The most commonly identified form of mass wasting on oceanic islands is slides
and a variable range of sizes have been found in seafloor images obtained by surveying
the submerged flanks of volcanic islands [Holcomb and Searle, 1991; Lenat et al.,1989;
Moore et al., 1989]. In oceanic island volcanoes, these slides can be characterized by a

4
14
headwall scar and a displaced mass [Hampton et al., 1996]. Giant slides are well
documented on the Hawaiian Ridge [Moore, 1964; Fornari et al., 1979; Moore et al.,
1989], in the Canary Islands [Holcomb and Searle, 1991; Watts and Masson, 1995;
Stillman, 1999] and at Reunion Island [Lenat et al., 1989; Gillot et al., 1994]. A number
of factors are thought to cause the stresses that lead to these collapses: volcanic
spreading [Borgia, 1994], dike intrusions [McGuire et al., 1990; Elsworth & Voight,
1995], accumulation of eruptive products on steep slopes [Murray and Voight, 1996],
earthquakes [Montalto et al., 1996; McGuire, 1996], magma chamber inflation and
deflation [Lo Giudice & Rasa, 1992], and changing sea levels [Firth et al., 1996].
Giant slides in the western Galapagos are not as common as in the Hawaiian
Islands; however, they are known to occur. Furthermore, steep cliff faces observed at
the southwest flank of Cerro Azul [Naumann and Geist, 2000], the west face of Pinta
[Cullen and McBirney, 1987] and the west face of Santa Fe [Geist et al., 1985] can be
interpreted as subaerial headwall scars. The halving of Volcan Ecuador, located at the
northwestern most tip of Isabela Island, is a particularly dramatic example. Geist et al.
[2002] state that the entire west half of the volcano slid along a listric fault into the
abyssal depths of the platform. This slide generated two distinct slide features, a
headwall scar identified in the topography and a debris toe at the base of the slide
identified in the bathymetry.
1.2. Previous Work
Using MR-1 sidescan sonar data, Geist et al. [2006] and Geist et al. [2008]
identified five submarine geomorphic provinces in the western Galapagos including

5
14
large deep-water lava fields, submarine rift zones, terraces, shallow submarine flanks,
and mass wasting and erosional deposits. These articles include detailed figures of the
geological interpretations of the sidescan sonar data, indicating all of these five
provinces. Geist et al. [2006] also indicated that subaerial lava flows have been
truncated by wave erosion, producing unstable clastic deposits on over-steepened upper
slopes.
Using EM300 bathymetry and MR1 sidescan sonar data, Glass et al. [2007]
identified volcanic cones of varying morphologies (e.g. pointed, cratered, flat topped and
breached), vents, large deep-water lava flows and additional submarine rift zones on
Isabela and Roca Redonda islands.
Though Geist et al.[2006] and Glass et al. [2007] identify mass wasting in the
western Galapagos using sidescan sonar data, neither has detailed the types of mass
wasting that have occurred. The purpose of this project is to use multibeam bathymetry
and backscatter along with sidescan sonar data collected in the western Galapagos
Islands to determine the location, size and morphology of mass wasting to better
understand its role and to help further the understanding of the geomorphology of the
Galapagos Islands. This knowledge will help to understand the way that oceanic island
volcanoes erode during their continued growth and evolution as well as determining the
size of mass wasting deposits.

6
14
2. METHODS
2.1 Data Acquisition
This study is based on sonar-derived bathymetry and backscatter data. These
data, which cover the areas shown in Figure 2, were acquired during several research
cruises around the islands, including the TN188, TN189 and DRFT04RR cruises.
Multibeam bathymetry and backscatter data (Figure 2a and 2c, respectively) were
collected during the TN188 and TN189 research cruises onboard the R/V Thomas G.
Thompson in January 2006 using a Kongsberg Simrad 30 kHz EM300 sonar system.
The hull-mounted EM300 transducer array transmits 135 beams per ping with vertical
and horizontal resolution approximately 0.2 and 2% of water depth, respectively. Ship
navigation was by P-Code GPS and motion sensing/attitude corrections were made with
a POS/MV Model 320 vertical reference unit. Additional bathymetry data and sidescan
sonar data were obtained from the National Geophysical Data Center (NGDC) and the
Marine Geosciences Data System (MGDS) for the 2001 DRFT04RR cruise. This cruise
focused on the western edge of the Galapagos platform and collected EM120 multibeam
bathymetry and MR1 sidescan sonar backscatter data [Fornari et al., 2001; Kurz et al.,
2001; Harpp et al., 2003; Geist et al., 2005, 2006] (Figures 2b and 2d, respectively).
Methods of data collection are described by Geist et al. [2006]. Individual cruise
information can be found in Table 1.

7
14
Figure 2. Multibeam bathymetry, backscatter and sidescan sonar data of the western
Galapagos. (A) EM300 (25 m resolution) multibeam bathymetry from TN188 and
TN189 cruises. (B) EM120 multibeam bathymetry (100 m resolution) from DRFT04RR
cruise. (C) EM300 backscatter from TN188 and TN189 (gridded at 25 m resolution) (D)
MR1 sidescan sonar data from DRFT04RR cruise (gridded at 8 m resolution). Sidescan
images are plotted with dark representing high backscatter and light, low backscatter or
acoustic shadow.

8
14
Table 1. Cruise Data.
Cruise ID Ship Institution Cruise
Dates
Navigation
Types
Instrument
(primary)
DRFT04RR Roger
Revelle
University of
California, Scripps
Institution of
Oceanography
(UC/SIO)
2001-08-23
to
2001-09-25
GPS Simrad
EM120
TN188 Thomas G
Thompson
University of
California, Santa
Barbara
2005-12-03
to
2006-01-10
GPS Simrad
EM300
TN189 Thomas G
Thompson
University of
Washington,
Department of
Oceanography
2006-01-12
to
2006-01-26
GPS Simrad
EM300
2.2 Data Processing
EM300 bathymetry data collected during the TN188 and TN189 cruises were
cleaned using Caris software. This software was used to open and view the soundings
received by the Simrad EM300 and to remove soundings that seems to be outliers, i.e.,
out of place and artificial. The recognition of outlier data was based on knowing
roughly the bathymetry of the study area and being able to recognize when soundings do
not fit a smooth curve or appear out of place. After the data were cleaned, a grid of
some resolution was created that was exported out of Caris as a .xyz file. A low
resolution grid, 100 m in this case, was chosen to begin with to ensure that all data are
included into the grid and no interpolation was necessary. A gridded digital bathymetry
model (DBM) was generated from the .xyz files using Fledermaus. Using the

9
14
Fledermaus software package, an analysis was run on the gridding to determine if a
higher resolution could be obtained. In this study, after analysis of the gridding, a final
resolution of 25 meters was chosen for the EM300 bathymetry data.
The backscatter data were loaded into GeoCoder where they were gridded and
a mosaic was created which was exported as a .tiff file. MR1 sidescan sonar data
collected during the DRFT04RR cruise have been plotted with the convention that dark
represents high backscatter and light is low backscatter or acoustic shadow.
2.3 Data Interpretation
Geist et al.[2006] indicated that areas of mass wasting in the western Galapagos
Island can be identified in the bathymetry record as areas of smooth, steep slopes with
moderate to low backscatter amplitude and downslope lineations in the sidescan data. In
GLORIA sonograph imagery taken in the Canary Islands, Holcomb and Searle [1991]
described a speckled or mottled backscatter pattern that is indicative of large slide
deposits where each speckle represents a blocky hillock.
The DBM and mosaics were examined in Fledermaus to co-register the EM300
bathymetry with the MR1 sidescan sonar data. The co-registration was completed by
identifying features, such as distinctive volcanic cones in both the bathymetry and the
sidescan sonar data. The co-registered images were used to identify mass wasting
characteristics described by Geist et al. [2006] and Holcomb and Searle [1991]. The
Fledermaus images were then exported as ASCII files and opened in ArcMAP for
determination of lengths, widths and areas of the identified slides. The length, width and
areas of the identified slides were determined using the spatial statistics tool in ArcMap.

10
14
A new polygon, called a “feature” in ArcMAP, was created to outline the co-registered
slide locations identified in Fledermaus. The spatial statistics tool was then used to
determine the areas of the new feature while the measure tool was used to determine
their lengths and widths at the largest point in the slide. This procedure was completed
three times to verify accuracy and as long as the bounds of the feature are clearly defined
and remain the same each time, this method can be reproduced and was used to
determine the areas of all slides identified in this study. The percent of coastline
affected by mass wasting was determined by using the measure tool in ArcMAP to
determine the total amount of coastline that was surveyed and then to divide the amount
of coastline that has mass wasting features by the total amount surveyed. The mass
wasting features were measured at their widest point.
For this study, the western Galapagos was divided into five regions based on
the presence of mass wasting in the data and these regions were named after the
volcanoes located nearest to the region. These regions are identified in Figure 3 and
their sizes are based on the division of the bathymetry and sidescan data into a 1:50,000
scale in the 2001 DRFT04RR cruise report [Kurz et al., 2001].

11
Figure 3. Map of the Galapagos Islands with locations of Figures 4-33. Numbers correspond to subsequent figures.
12
11
3. RESULTS
Bathymetry and sidescan data indicate that most volcanic slopes show evidence
of mass wasting in the western Galapagos. The data show that four forms of mass
wasting are identified including debris flows, slump sheets, chaotic slumps, and
detached blocks. Debris flows are identified in the sidescan sonar data as having
moderate to low backscatter amplitude and downslope lineations in the sonar images,
giving the effect of a streaky appearance. Slump sheets are identified as having
moderate backscatter amplitude with folds that give the impression of a rippled
appearance in sidescan sonar images. Chaotic slumps are identified as having moderate
to low backscatter amplitude with a mottled or speckled appearance in sidescan sonar
images. Detached blocks are identified in sidescan sonar images by a margin of high
backscatter amplitude, appearing dark in the images, with upper surfaces characterized
by low backscatter amplitude, which appear white, indicating acoustic shadow.
Submarine rift zones are characterized by highly reflective mottled backscatter in the
sidescan sonar data and as linear or gently curving ridges in the bathymetry. Large
deep-water lava fields are characterized as irregularly shaped areas of higher reflectivity.
The areas of the bathymetric expression of the slides were defined by the existence of
horseshoe shaped embayments (concave contours) on the upper slopes and bulges
(convex contours) on the lower slopes. Table 2 lists the slide and slump features by both
name and acronym and sidescan sonar and bathymetry interpretations of length and
width at the widest point as well as the calculated areas.

13
Table 2. A Listing of Slide and Slump Feature Characteristics.
Sidescan Sonar Bathymetry
Acronym Area (km2) Length (km)
Width (km)
Area (km2) Length (km) Width (km)
Type
Total Length of
Surveyed
Coastline (km)
% of Total
Area
affected
Cerro Azul Region
35.97
Cerro Azul South Slide CAS 17.51 7.23 4.60 44.86 10.63 5.11 DF
Cerro Azul Southwest Slide CASW 21.32 6.42 4.69 208.31 19.81 15.39 DF
56.99
Slump Cerro Azul SCA 55.38 33.07 1.83 N/A N/A N/A SS
91.92
Le Cumbre Region
48.92
Le Cumbre Southwest Slide LCSW 27.62 10.54 4.03 66.96 12.45 5.02 DF
Le Cumbre Northwest Slide LCNW 46.59 10.88 5.02 166.19 12.43 11.37 DF
Le Cumbre North Slide LCN 111.98 6.76 14.96 101.29 5.66 16.33 DF
66.91
Slump Le Cumbre West SLCW 26.89 17.65 1.61 N/A N/A N/A SS
Slump Le Cumbre North SLCN 93.72 19.54 1.16 N/A N/A N/A SS
76.03
Volcan Ecuador Region
32.50
Volcan Ecuador West Slide VEW 36.30 9.27 5.51 68.22 10.96 7.29 DF w/ DB
Volcan Ecuador Northwest Slide VENW 28.36 12.28 4.22 57.44 12.71 5.77 DF
Volcan Ecuador North Slide VEN 43.05 7.78 5.71 64.95 10.09 9.03 DF
67.99
Slump Volcan Ecuador West SVEW 13.57 4.35 2.13 N/A N/A N/A SS
Slump Volcan Ecuador North SVEN 56.39 28.14 1.62 N/A N/A N/A SS
100.00

14
Table 2. Continued
Sidescan Sonar
Bathymetry
Acronym
Area (km2)
Length (km) Width (km)
Area (km2) Length (km) Width (km)
Type
Total Length of
Surveyed
Coastline (km)
% of Total
Area
affected
Roca Redondo Region
34.51
Roca Redondo Southwest Slide RRSW 68.40 14.28 6.82 120.82 16.41 10.01 DF
Roca Redondo Northwest Slide RRNW 60.96 12.97 6.90 55.81 11.27 6.22 DF
Roca Redondo Northeast Slide RRNE 32.72 10.97 6.23 77.05 12.66 10.35 DF
Roca Redondo Southeast Slide RRSE N/A N/A N/A 81.04 13.92 7.93 N/A
100.00
Volcan Wolf Region
48.81
Volcan Wolf North Slide VWN 91.56 13.23 10.21 88.43 10.36 9.23 DF
Volcan Wolf East Slide VWE 57.15 5.71 9.72 162.90 16.34 10.34 DF
40.08
Slump Volcan Wolf North SVWN 86.26 36.27 2.26 N/A N/A N/A SS
Slump Volcano Wolf East SVWE 33.86 7.06 2.53 N/A N/A N/A SS
88.77
Canal Isabela Region
15.70
Slump Canal Isabela SCI 70.12 11.37 13.57 93.57 15.23 13.81 CS
Total % Area Covered in Slides
64.47
Total % Area Covered in Slumps 72.76

15
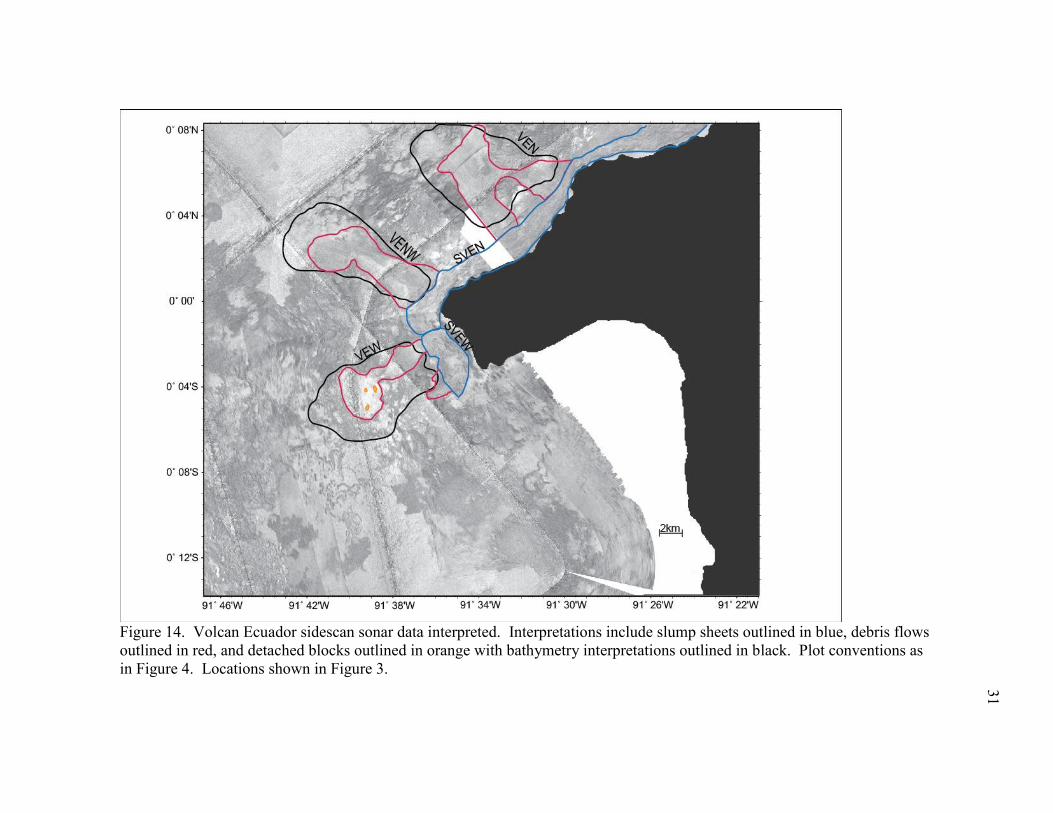
Figure 4. Cerro Azul sidescan sonar data interpreted. Interpretations include slump sheets outlined in blue and debris flows
outlined in red, with bathymetry interpretations outlined in black. High backscatter plotted in dark tone and low backscatter or
acoustic shadow as light tone. Islands shown in grey. Location shown in Figure 3.

16
Figure 5. Cerro Azul bathymetry contours with interpretations. Contour interval is 25 meters. Interpretations are the same as
in Figure 4.

17
Figure 6. Cerro Azul shaded relief bathymetry map. Indicates the locations of scarps and lines show locations of depth cross
section profiles A to A’ and B to B’, which are shown in Figure 7.

18
Figure 7. Cerro Azul depth profiles. Locations shown in Figure 6.

19
Figure 8. Cerro Azul slope angle map. Colors are indicative of average slope angle, with lighter colors representing steeper
slopes.
20
19
3.1 Cerro Azul Region
The Cerro Azul region contains one slump, SCA, and two debris flows, CAS and
CASW. The slump lies on the steep upper slopes of Isabela Island and can only be
identified in the sidescan sonar image (Figure 4). The slump sheet is identified as
having moderate backscatter amplitude with folds that give the impression of a rippled
appearance in sidescan sonar images. The slump has a length of 33.1 km and a width of
1.8 km. The area of this slump in the sidescan sonar data is 55.4 km2.
Both CAS and CASW debris flows can be differentiated in both the sidescan
sonar and the bathymetry (Figure 5) are located between rift zone ridges and exist in
large horseshoe shaped embayments (Figures 4 & 5). Both slide areas defined by
sidescan sonar exist within the bounds of the bathymetry interpretations, but are
significantly smaller in area.
CAS is located off the southernmost tip of Isabela Island and terminates in water
depth of approximately 2700 meters. In the sidescan sonar data, this slide is identified
with downslope lineations and extends for 7.2 km from the base of the slump sheets, has
a maximum width of 4.6 km and an area of 17.5 km2. Based on the bathymetry this slide
features extends 10.6 km from the base of the slump sheet, has a maximum width of 5.1
km and an area of 44.9 km2. The shaded relief bathymetry map, Figure 6, illuminates an
area of steeper, rough slope on the northwest valley wall. The depth profile A to A’
(Figure 7) indicates that there is a general concave upward trend in the upper slope with
a decrease in slope with increased water depth and a hummocky bulge that begins at
~2200 meters depth, indicating a displaced mass on the lower slope. The slope angle

21
19
map shows that the slide is located in an amphitheatre shaped valley where the edges of
the slide and the surrounding rift zone has a higher slope of ~30 degrees whereas the
amphitheatre floor has a lower slope angle of ~10-20 degrees which decreases to nearly
zero off the platform (Figure 8). This slide appears to have a combined source of
subaerial and submarine, originating from both the two small subaerial horseshoe
embayments, as well as the embayment on the upper submarine slopes.
CASW is located to the west of CAS and continues off the platform to terminate
in water depths of ~3375 meters. In the sidescan sonar data, this slide is identified by a
mottled and streaky appearance and exists off the platform. It has a length of 6.4 km, a
width of 4.7 and an area of 21.3 km2. The bathymetry shows that this slide extends from
the base of the slump sheet for a distance of 19.8 km, has a maximum width of 15.9 km
and an area of 208.3 km2. The shaded relief bathymetry map (Figure 6) shows steep,
rough slopes that border the NW and SE edges of the slide canyon. The continuity of
the steep, rough slopes on the NW side implies a scarp that borders this edge of slide. In
Figure 7, profile B-B’ shows that this slide has a general concave upward trend with a
decrease in slope angle with increased water depth. A rough surface texture begins at
~3000 meters depth and continues to a depth of ~3600 meter, where there is a bulge
indicating a debris toe on the seafloor. The concave upward slope trend from the upper
slope changes to a linear slope at the base. It like the concave upward trend has been
filled by a sediment sheet. The slope angle map defines the CASW slide valley with
steeper slopes on the NW, N and SE sides and shallower slopes on the canyon floor
(Figure 8). This slide is directly related to the subaerial embayment on the southwest tip

22
19
of Cerro Azul volcano. Based on bathymetric calculations, this slide is the largest in the
western Galapagos Islands.
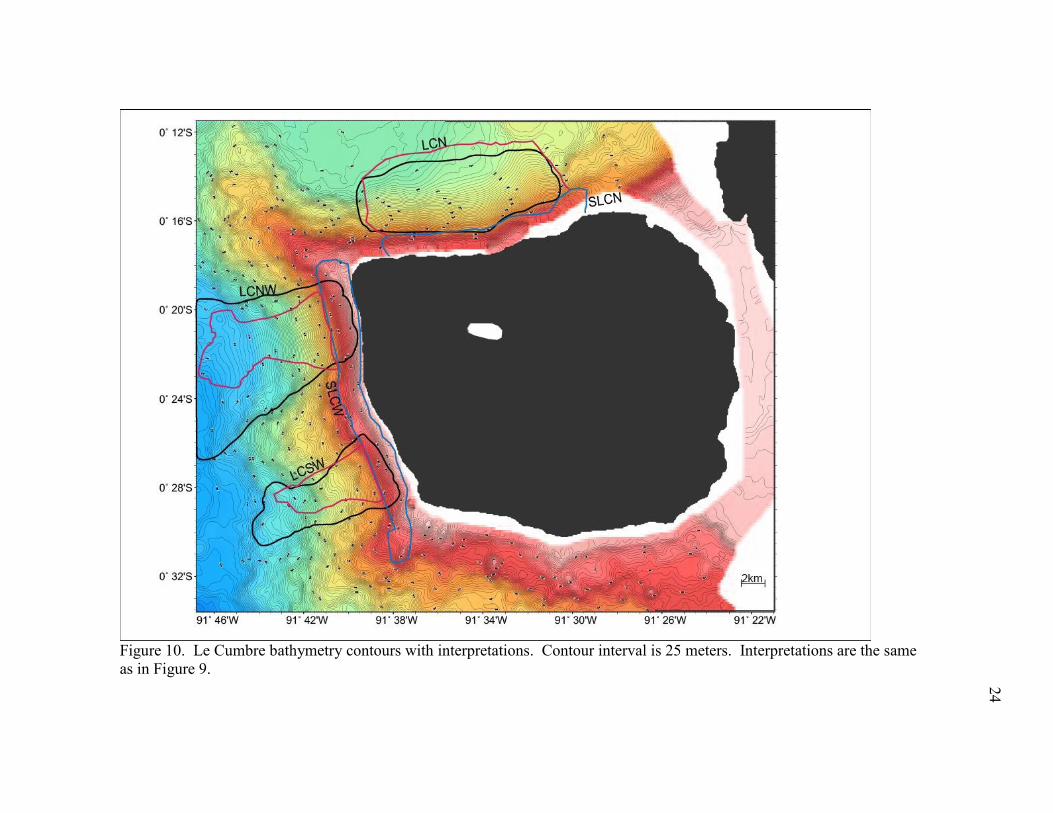
3.2 Le Cumbre Region
The Le Cumbre/Fernandina region contains two slumps, SLCW and SLCN and
three debris flows, LCSW, LCNW and LCN. The slump sheets are located on the steep
upper slopes of Fernandina Island, can only be identified in the sidescan sonar image
(Figure 9) and have similar characteristics to slumps offshore of Cerro Azul. SLCW is
on the west side of Fernandina, has a length of 17.7 km, width of 1.6 km, and area of
27.0 km2. SLCN is on the north side of Fernandina Island, has a length of 19.5 km,
width of 1.2 km and area of 93.7 km2.
All three debris flows, LCSW, LCNW and LCN, can be differentiated in both the
sidescan sonar and the bathymetry (Figure 10). The slide areas defined by sidescan
sonar extend slightly beyond the bounds of the bathymetry interpretations, yet are still
smaller in area.
LCSW is located off the west coast of Fernandina Island and ends in water depth
of ~3000 meters. This debris flows is located between rift zone ridges. In the sidescan
sonar data, this slide has downslope lineations which are interrupted by lava flows and
volcanic cones. Based on sidescan sonar data, this slide extends for 10.5 km from the
base of the slump sheets, has a maximum width of 4.0 km and an area of 27.6 km2.
Based on the bathymetry this slide feature extends to the base of the platform for 12.5
km and includes part of the area covered by the slump sheet. It has a maximum width of
5.0 km and an area of 66.9 km2. The shaded relief bathymetry map (Figure 11)

23
Figure 9. Le Cumbre sidescan sonar data interpreted. Interpretations include slump sheets outlined in blue and debris flows
outlined in red with bathymetry interpretations outlined in black. Plot conventions as in Figure 4. Location shown in Figure 3.
24
Figure 10. Le Cumbre bathymetry contours with interpretations. Contour interval is 25 meters. Interpretations are the same
as in Figure 9.

25
Figure 11. Le Cumbre shaded relief bathymetry map. Indicates the locations of scarps and lines show locations of depth cross
section profiles A to A’, B to B’, C to C’ and D to D’, which are shown in Figure 12.

26
Figure 12. Le Cumbre depth profiles. Locations shown in Figure 11.

27
Figure 13. Le Cumbre slope angle map. Plot conventions as in Figure 8.

28
27
shows rough bathymetry of the rift zones that contrast with the smoother seafloor and
horseshoe shape of the slide valley. The depth profile A to A’ (Figure 12) indicates that
there is a general concave upward trend in the slope with a decrease in slope angle with
increased water depth. A bumpy texture begins at ~1100 meters depth and continues to
the interpreted base of the slide indicating a series of discrete debris deposits. The slope
angle map shows that the edges of the slide are not as clearly defined with sharp steep
sides and the surrounding rift zone terrain has a higher slope of ~30 degrees compared to
the lower angle of ~ 10-20 degrees in the slide area (Figure 13). This slide occurs in an
isolated submarine embayment and has no apparent subaerial source.
LCNW is located off the west coast of Fernandina Island, north of LCSW and
ends off the platform at a water depth of ~3275 meters. This debris flows is located
between rift zone ridges. In the sidescan sonar data, this slide is indentified by
downslope lineations and extends for 10.9 km from the base of the slump sheets, has a
maximum width of 5.0 km and an area of 46.6 km2. Based on the bathymetry this slide
feature extends for 12.4 km and includes part of the area covered by the slump sheet. It
has a maximum width of 11.4 km and an area of 166.2 km2 as a minimum because the
slide extends out of the data region The shaded relief bathymetry map (Figure 11)
illuminates a scarp that bounds the northern edges of the slide, the horseshoe shaped
embayment and the smooth bathymetry of the slide area. The depth profile B to B’
(Figure 12) indicates that there is a general concave upward trend in the slope with a
decrease in slope angle with increased water depth with a bumpy texture that begins at
~1500 meters depth and continues to the interpreted base of the slide. The slope angle

29
27
map sharply defines the slide’s amphitheatre-shaped valley, by the contrast between the
steep edges and the smooth bottom. The edges of the slide and the surrounding rift zone
have a higher slope of ~30 degrees compared to ~25 degrees on the upper slopes,
decreasing to ~10 degrees on the lower slope and nearing zero as the slide extends off
the platform (Figure 13). This slide occurs in an isolated submarine embayment that has
no apparent subaerial source.
LCN is located off the north coast of Fernandina Island and ends in water depth
of ~2375 meters. In the sidescan sonar data, this slide is identified by downslope
lineations and extends for 6.7 km from the base of the slump sheets, has a maximum
width of 15.0 km and an area of 112.0 km2. Based on the bathymetry this slide extends
from the base of the slump sheets for 5.7 km, has a maximum width of 16.3 km and an
area of 101.3 km2. The shaded relief bathymetry map (Figure 11) highlights the smooth
bathymetry of the slide area. The depth profiles C to C’ and D to D’ (Figure 12) indicate
that there is a general concave upward trend in the slope with a flattening of the slope
with increased depth. The slope angle map shows that the slide is located in a broad
amphitheatre with steep upper slopes that near zero at depth (Figure 13). This slide
occurs off the concave north coast of Fernandina, implying that the submarine slide
feature is part of a larger collapse that shaped the north side of the volcano.
3.3 Volcan Ecuador Region
The Volcan Ecuador region contains two slump sheets, SVEW and SVEN, one
debris flow which incorporates detached blocks, VEW, and two debris flows, VENW
and VEN. The slumps can only be identified in the sidescan sonar image (Figure 14)

30
27
and have the same ropy fold characteristics as the Cerro Azul region. SVEW is located
on the steep northwestern most tip of Isabela Island and has a length of 4.4 km, width of
2.1 km, and area of 13.6 km2. SVEN is located on the steep upper north slope of Isabela
Island, and has. It has a length of 28.1 km, width of 1.6 km and area of 56.4 km2.
All three debris flows, VEW, VENW and VEN, can be differentiated in both the
sidescan sonar and the bathymetry (Figure 15) and are located between rift zone ridges.
The slide areas defined by bathymetry extend slightly beyond the bounds of the sidescan
sonar interpretations and are larger in area.
VEW is located off the northwestern tip of Isabela Island and ends in water depth
of ~2575 meters. In the sidescan sonar data, this slide has a mottled and streaky
appearance which is interrupted by lava flows and volcanic cones. Within this slide the
sonar image shows three detached blocks which can be identified by a margin of high
backscatter amplitude, appearing dark in the images, with upper surfaces characterized
by low backscatter amplitude, which appear white. Based on sidescan sonar data, this
slide extends for 9.3 km from the base of the slump sheets, has a maximum width of 5.5
km and an area of 36.3 km2. The detached blocks have an approximate length of 0.2 km.
Based on the bathymetry this slide extends to the base of the platform for 11.0 km, has a
maximum width of 7.3 km and an area of 68.2 km2. The shaded relief bathymetry map
(Figure 16) illuminates a steep, sharp, linear scarp that bounds the northernmost edge of
the slide. This image also shows a horseshoe shaped embayment, a debris toe at the base
of the slide and the smooth texture of the slide valley floor. The depth profile A to A’
(Figure 17) indicates that there is a general concave upward trend in the slope with a
31
Figure 14. Volcan Ecuador sidescan sonar data interpreted. Interpretations include slump sheets outlined in blue, debris flows
outlined in red, and detached blocks outlined in orange with bathymetry interpretations outlined in black. Plot conventions as
in Figure 4. Locations shown in Figure 3.

32
Figure 15. Volcan Ecuador bathymetry contours with interpretations. Contour interval is 25 meters. Interpretations are the
same as in Figure 14.

33
Figure 16. Volcan Ecuador shaded relief bathymetry map. Indicates the locations of scarps and lines show locations of depth
cross section profiles A to A’, B to B’ and C to C’, which are shown in Figure 17.

34
Figure 17. Volcan Ecuador depth profiles. Locations shown in Figure 16.

35
Figure 18. Volcan Ecuador slope angle map. Plot conventions as in Figure 8.

36
35
decrease in slope angle with increased water depth. A hummocky signature begins at
~1500 meters depth and continues to a depth of ~2250 meters. This profile also shows a
bulge that begins at ~1900 meters depth and continues to the base of the slide, indicating
the location of a debris toe. The slope angle map (Figure 18) defines the slide valley
shape with steeper slopes on the sides and lower floor and shows a scarp on the north
side and steep slopes on the southeast side. The map also shows several features on the
lower floor that are part of the debris toe bulge. The edges of the slide, the surrounding
rift zones, and the upper slope of the slide have a slope of >30 degrees, while the lower
slope decrease from 25 to <10 degrees at the base of the slide. This slide is directly
adjacent to the subaerial embayment and is associated with the collapse of Volcan
Ecuador.
VENW is located off the northwestern tip of Isabela Island, north of VEW and
ends off the platform at a water depth of ~3175 meters. In the sidescan sonar data, this
slide is defined by downslope lineations and extends for 12.3 km from the base of the
slump sheets, has a maximum width of 4.2 km and an area of 28.4 km2. Based on the
bathymetry this slide feature extends for 12.7 km from the base of the slump sheet, has a
maximum width of 5.8 km and an area of 57.4 km2. The shaded relief bathymetry map
(Figure 16) illuminates a short scarp that bounds the upper northeastern edge of the slide
area. These data also show the horseshoe shaped embayment and the smooth
bathymetry of the slide valley floor. The depth profile B to B’ (Figure 17) indicates that
there is a general concave upward trend in the slope with a decrease in slope angle with
increased water depth. The profile is generally smooth indicating a lack of large debris

37
35
deposits in the slide valley. The slope angle map shows that the slide has as similar
signature to the VEW slide with several patches if high slope near the bottom of the slide
valley that may represent debris piles (Figure 18). This slide occurs in an isolated
submarine embayment and has no apparent subaerial source.
VEN is located off the north coast of Isabela Island and terminates at the base of
the platform in water depth of ~3000 meters. In the sidescan sonar data, this slide is
defined by downslope lineations and extends for 7.8 km from the base of the slump
sheets, has a maximum width of 5.7 km and an area of 43.1 km2. Based on the
bathymetry this slide feature extends from below the slump sheets for 10.1 km, has a
maximum width of 9.0 km and an area of 65.0 km2. The shaded relief bathymetry map
(Figure 16) illuminates a broad smooth valley for the slide area. The depth profile C to
C’ (Figure 17) indicates that there is a general concave upward trend in the slope with a
flattening of the slope with increased depth. The smooth slope indicates only little
debris piles on the slope. The slope angle map shows that the slide is located in an
amphitheatre valley with shallow slopes less than 20 degrees that near zero in deep water
(Figure 18). This slide occurs in an isolated submarine embayment and has no apparent
subaerial source.
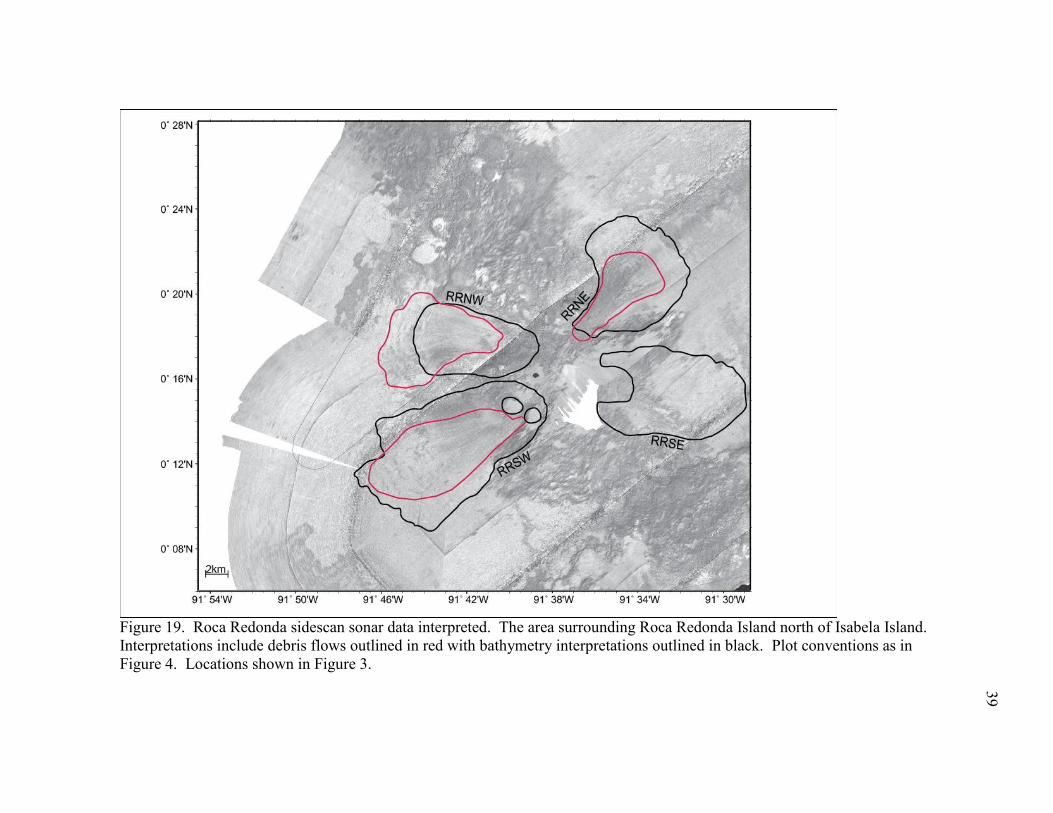
3.4 Roca Redonda Region
The Roca Redonda Region contains four debris flows, RRSW, RRNW, RRNE,
and RRSE. No slumps were found in this region. Three debris flows, RRSW, RRNW,
and RRNE can be differentiated in both the sidescan sonar and the bathymetry data,
identified with downslope lineations in the sidescan sonar (Figure 19) and by concave

38
35
contours on the upper slopes and a fanning of the contours (convex contours) on the
seafloor off the platform in the bathymetry data (Figure 20). RRSE can only be
identified in the bathymetry data by the same characteristics as the other three slides.
All four flows are located between rift zone ridges. The slide areas defined by sidescan
sonar are smaller in area than the areas defined by bathymetry because they are
narrower. The shaded relief bathymetry map (Figure 21) illuminates the smooth
bathymetry of the horseshoe shaped embayments that each slide exists within. The
depth profiles (Figure 22) indicate that there is a general concave upward trend in the
slope with a decrease in slope angle with increased water depth. The slope angle map
shows the amphitheatre like valley that the slide exists in and shows that the edges of the
slide and the surrounding rift zone have a higher slope of ~30 degrees compared to the
lower angle of ~ 10 degrees in the slide valley floor (Figure 23). The source of all four
slides appears to be a combination of a subaerial sources associated with the steep cliff
faces of Roca Redonda Island as well as the submarine embayments of each slides’
respective upper slope.
RRSW is located off the southwest tip of Roca Redonda Island, just north of
Isabela Island and terminates in water depth of ~3225 meters. Based on sidescan sonar
data, this slide extends for 14.3 km from the island, has a maximum width of 6.8 km and
an area of 68.4 km2. Based on the bathymetry this slide extends 16.4 km, has a
maximum width of 10.0 km and an area of 120.8 km2.
RRNW is located off the northwest tip of Roca Redonda Island, north of RRSW
and ends off the platform at a water depth of ~ 3075 meters. Based on sidescan sonar
39
Figure 19. Roca Redonda sidescan sonar data interpreted. The area surrounding Roca Redonda Island north of Isabela Island.
Interpretations include debris flows outlined in red with bathymetry interpretations outlined in black. Plot conventions as in
Figure 4. Locations shown in Figure 3.

40
Figure 20. Roca Redonda bathymetry contours with interpretations. The area surrounding Roca Redonda Island north of
Isabela Island. Contour interval is 25 meters. Plot conventions as in Figure 19.

41
Figure 21. Roca Redonda shaded relief bathymetry map. Indicates the locations of scarps and cross section profiles A to A’ in
the southwest, B to B’ in the northwest, C to C’ in the northeast and D to D’ in the southeast.

42
Figure 22. Roca Redonda depth profiles. Profile A to A’ in red, B to B’ in blue, C to C’ in green and D to D’ in orange show
a general concave upward trend in the slope of the slide. Profile C to C’ has a hummocky texture that begins at ~2100 meters
and continues to the base of the slide and a bulge that can be seen at ~2950 meters indicating a displaced mass. Profile D to D’
shows a headwall scarp located at ~1800 meters depth.

43
Figure 23. Roca Redonda slope angle map. The slope angle map shows the amphitheatre like valley that the slide exists in
and shows that the edges of the slide and the surrounding rift zone have a higher slope of ~30 degrees compared to the lower
angle of ~ 10 degrees in the slide area.

44
43
data, this slide extends for 13.0 km from the base of the slump sheets, has a maximum
width of 6.9 km and an area of 61.0 km2. Based on the bathymetry this slide extends for
11.3 km, has a maximum width of 5.8 km and an area of 57.4 km2.
RRNE is located off the northeast tip of Roca Redonda Island, just north of
Isabela Island and ends in water depth of ~ 3050 meters. Based on sidescan sonar data,
this slide extends for 11.0 km, has a maximum width of 6.2 km and an area of 32.7 km2.
Based on the bathymetry this slide extends 12.7 km, has a maximum width of 10.4 km
and an area of 77.1 km2. The depth profile C to C’ (Figure 22) indicates that the slope
of the slide has a hummocky texture that begins at ~2100 meters and continues to the
base of the slide. The profile also shows a bulge that can be seen at ~2950 meters which
indicates a displaced mass.
RRSE is located off the southeast tip of Roca Redonda Island and ends in water
depth of ~ 2850 meters. Based on the bathymetry this slide extends 13.9 km, has a
maximum width of 7.9 km and an area of 81.04 km2. A scarp, ~150 meters high can be
identified in the bathymetry (Figure 20), the shaded relief bathymetry map (Figure 21),
Profile D to D’ (Figure 22), and in the slope angle map (Figure 23).
3.5 Volcan Wolf Region
The Volcan Wolf region contains two slump sheets, SVWN ad SVWE, and two
debris flows, VWN and VWE. The slump sheets are located on the steep upper slopes
of Isabela Island, can only be identified in the sidescan sonar image and have the same
characteristics as the slumps off of Cerro Azul (Figure 24). SVWN is on the north side

45
43
of Isabela, has a length of 36.3 km, width of 2.3 km, and area of 86.3 km2. SVWN is on
the east side of Isabela, has a length of 7.06 km, width of 2.5 km and area of 33.9 km2.
Both debris flows, VWN and VWE, can be identified in both the sidescan sonar
and the bathymetry data. They are identified with downslope lineations in the sidescan
sonar (Figure 24) and by concave contours on the upper slopes and a fanning of the
contours (convex contours) on the seafloor at the base of the slope in the bathymetry
data (Figure 25) and are located between rift zone ridges.
VWN is located off the north coast of Isabela Island and ends in water depth of
~3000 meters. This debris flow is located between rift zone ridges. Based on sidescan
sonar data, this slide extends for 13.2 km from the base of the slump sheets, has a
maximum width of 10.2 km and an area of 91.6 km2. Based on the bathymetry this slide
extends to the base of the platform for 10.4 km, has a maximum width of 9.2 km and an
area of 88.4 km2.
The shaded relief bathymetry map (Figure 26) illuminates a scarp that borders
the eastern side of the slide, the horseshoe shaped embayment of the slide, and indicates
that the lower slope has a hummocky texture which can also be seen in depth profile A
to A’ (Figure 27). In contrast, the upper slopes have a smooth bathymetry, which can be
seen in depth profile B to B’. The depth profiles A to A’ and B to B’ (Figure 27)
indicate that there is a general concave upward trend in the slope with a shallowing of
the slope with increased depth with a hummocky structure that begins at ~2150 meters
depth and continues to the interpreted base of the slide. Profile A to A’ shows a bulge at
~2400 meters and continues to the base of the slide, indicating a debris toe at the base of

46
Figure 24. Volcan Wolf sidescan sonar data interpreted. The area off the coast of Volcan Wolf on the northeastern tip of
Isabela Island. Interpretations include slump sheets outlined in blue and debris flows outlined in red, with bathymetry
interpretations outlined in black. Plot conventions as in Figure 4. Locations shown in Figure 3.

47
Figure 25. Volcan Wolf bathymetry contours with interpretations. Contour interval is 25 meters. Interpretations are the same
as in Figure 24.

48
Figure 26. Volcan Wolf shaded relief bathymetry map. Illuminates the smooth bathymetry of the upper slopes and a
hummocky texture on the lower slopes. This map also indicates the locations of scarps and cross section profiles A to A’ and
B to B’ in the north and C to C’ in the east.

49
Figure 27. Volcan Wolf depth profiles. Shows the profile of A to A’ in red with a hummocky texture that begins at ~2150
meters and continues to the base of the slide and a bulge that begins at ~2400 meters and continues to the base of the slide.
Profile B to B’ in blue shows the smooth texture of the upper slopes. Profile C to C’ shows a hummocky texture which begins
at ~200o meters and continues to the base of the slide. with a rough surface texture that begins at ~3000 meters of depth and
continues to a depth of ~3600 meter, where there is a bulge.

50
Figure 28. Volcan Wolf slope angle map. The slope angle map shows that the edges of the slide and the rift zone have a
higher slope of ~30 degrees compared to the upper slopes of the slide area that have a 20 degree slope and shallow out with
depth to nearly zero at the base of the slide.

51
50
the slide. The slope angle map shows this same bulge which is identifiable by an
increase in slope (Figure 28). The slope angle map also shows that the edges of the slide
and the surrounding rift zones have a higher slope of ~30 degrees compared to the upper
slopes of the slide area that have a 20 degree slope and shallow out with depth to nearly
zero at the base of the slide. This slide occurs off the concave north coast of Isabela,
suggesting that the source for these deposits is subaerial.
VWE is located off the east coast of Isabela Island and ends in water depth of
~2975 meters. Based on sidescan sonar data, this slide extends for 5.7 km from the base
of the slump sheets, has a maximum width of 9.7 km and an area of 57.2 km2. Based on
the bathymetry this slide extends for 16.3 km, has a maximum width of 10.3 km and an
area of 162.9 km2 as a minimum because the slides extends out of the data region. The
shaded relief bathymetry map (Figure 26) indicates that the upper slopes have a smooth
bathymetry while the lower slope has a hummocky morphology, which can be seen in
depth profile C to C’ (Figure 27). This profile also shows a general concave upward
trend in the slope with a decrease in slope angle with increased water depth. The
hummocky texture begins at ~2000 meters depth and continues to the interpreted base of
the slide. The slope angle map shows that the edges of the slide and the rift zone have a
higher slope of ~30 degrees compared to the upper slopes of the slide area that have a 20
degree slope and shallow out with depth to nearly zero at the base of the slide (Figure
28). This slide occurs in an isolated submarine embayment and has no apparent
subaerial source.

52
50
3.6 Canal Isabela Region
The Canal Isabela region contains one large chaotic slump, SCI, which is
identified by moderate backscatter amplitude with a mottled or speckled appearance in
the sidescan sonar data (Figure 29). It has a length of 11.4 km, width of 13.6 km, and
area of 70.1 km2. The slump sheet is located to the east of Isabela Island and to the west
of Santiago Islands within Canal Isabela which is located on the platform. The slump is
identified by areas of hummocky terrain on the platform floor between the islands and
by areas of concave contours on the upper slopes of Santiago Island in the bathymetry
data (Figure 30). It has a length of 15.2 km, width of 13.8 km and area of 93.6 km2.
The shaded relief bathymetry map (Figure 31) shows the hummocky deposits between
the islands and three scarps that appear on the upper slopes of Isabela Island and three
scarps that are located on the upper slopes of Santiago Island as well as one scarp that is
located across the side of one of the pointed cones identified by Glass et al. [2007]. The
scarps that are on the upper slopes of Isabela Island are ~40 meters high. The scarps
located on the upper slopes of Santiago Island range from 100 to 150 meters high. The
scarp located on the pointed cone is ~20 meters high. Depth profile A to A’ and B to B’
both show a hummocky texture indicative of diffuse mass wasting across the canal
(Figure 32). Profile B to B’ shows a 125 meter high scarp that lies on the upper slopes
of Santiago Island starting at 300 meters of depth. This profile also highlights the
extremely steep slope of the island. The slope angle map shows that the upper slopes of
Santiago and Isabela Islands are near 80 degrees while the platform between the islands
has a slope near zero (Figure 33). This map also identifies ridges of higher slope within

53
50
the hummocky region which could be indicative of aggregation of materials from either
a single large slide or multiple small slides. There is no clear source for this slump
deposit.

54
Figure 29. Canal Isabela sidescan sonar data interpreted. The area located to the east of Isabela Island and southwest of
Santiago Island. Interpretations include chaotic slump outlined in green, with bathymetry interpretations outlined in black.
Plot conventions as in Figure 4. Locations shown in Figure 3.

55
Figure 30. Canal Isabela bathymetry contours with interpretations. Contour interval is 25 meters. Interpretations are the same
as in Figure 24.

56
Figure 31. Canal Isabela shaded relief bathymetry map. Illuminates the hummocky texture of the canal floor and smooth
upper slopes of the flanks of the islands. This map also indicates the locations of scarps and cross section profiles A to A’ and
B to B’.

57
Figure 32. Canal Isabela depth profiles. Shows the profile of A to A’ in red with a hummocky texture that continues along the
full length of the canal. Profile B to B’ in blue shows the smooth steep texture of the upper slopes as well as a 125 meter high
scarp that lies on the upper slopes starting at 300 meters of depth. This profile also highlights the extremely steep slope of the
island.

58
Figure 33. Canal Isabela slope angle map. The slope angle map shows that the upper slopes of Santiago Island and Isabela
Island are near 80 degrees while the platform between the islands has a slope near zero. This map also identifies ridges of
higher slope within the hummocky region which could be indicative of aggregation of materials from either a single large slide
or multiple small slides.

59
58
4. DISCUSSION
Approximately 73 percent of the coastlines of the western Galapagos Islands
have been affected by some form of downslope movement. Debris flows affect ~64 of
lower slopes of the western Galapagos. This indicates that, at least at the western edge
of the platform, mass wasting plays a significant role in the development of these
volcanoes. The flanks of the southwestern and northern tips of Isabela Island and the
west flank of Fernandina Island lie at the unbutressed edge of the Galapagos platform.
The growth of the islands on this steep edge may lead to an increased instability of the
submarine flanks, causing unstable deposits on over-steepened slopes. This observation
would lead one to believe that the western Galapagos may be more susceptible to mass
wasting along this edge when compared to the rest of the archipelago platform.
Geist et al. [2006] identified only four areas of mass wasting to the west and
north of Fernandina Island, but this study has found that a total of 23 mass wasting
features were found to exist in the western Galapagos Islands. Of the nine types of mass
wasting identified by Coleman and Prior [1988], Moore et al.[1989], and Keating et
al.[2000], only four types are observed in the sonar imagery of the western Galapagos
Islands. Fourteen debris flows with one that incorporated a set of detached blocks, seven
slump sheets, and one chaotic slump were interpreted.
The average slide in the western Galapagos Islands is identified by downslope
lineations in the sidescan sonar images, has concave contours on the upper slopes and a
fanning of the contours (convex contours) at the base of the slope in the bathymetry, is
located within a horseshoe shaped embayment and has a generally concave upward trend

60
58
in the slope with a decrease in slope angle with increased water depth and a hummocky
texture towards the distal end of the slide.
Twelve of the fourteen interpreted debris flows are flanked by submarine rift
zones ridges identified by Geist et al. [2006] and Glass et al. [2007]. The existence of
these rift zones ridges has generated a concave area of the submarine slope between the
rifts. The combination of the concave regions between rifts mixed with dike intrusions,
earthquakes, and magma chamber inflation and deflation within the rifts may lead to a
weakening of these concave areas, causing it to be more susceptible to downslope
movement. The slides that exist within these concave or horseshoe shaped embayments
are most likely to be a product of mass wasting due to these geological processes. In the
sedimentary record, repeated landslides would be bounded above and below by large
accumulations of sediments that would be horizontal, while the slide deposits would be a
discontinuous chaotic mass of volcanic origin. The slides that do not exist within these
horseshoe shaped embayments are most likely produced due to continuous erosional
processes on the steep upper slopes of the islands. The small repeated failures of the
flanks would likely lead to small, thin and continuous mass wasting events instead of
large thick individual slides. These continuous events will lead to a thicker
accumulation of deposits.
The western Galapagos Islands are still in the beginning shield building stages
and continued volcanism at the western edge of the Galapagos platform, both submarine
and subaerial, act to resurface and conceal the submarine terrain and therefore other
evidence of mass wasting, such as the existence of thick slides deposits and headwall

61
58
scarps. Slides that have more sharply defined edges are younger and have been affected
less by continued volcanism.
Sidescan sonar and bathymetry definitions of the slides’ lengths, widths and
areas are different. The bathymetry definitions are generally larger than the sidescan
sonar definitions indicating that the sidescan sonar measurements have been decreased
due to covering by continued volcanism. An example of this can be seen in both Figure
4 and Figure 24 where a large deep water lava flow, an irregularly shaped area of higher
reflectivity, exists within the region of the slide which is defined by the bathymetry.
This causes the area of the slide defined by sidescan sonar to be smaller than the area
defied by bathymetry. This indicates that sidescan sonar detection of mass wasting
features will only be able to determine minimum measurements.
When compared to the Hawaiian Islands, the areas and lengths of slides
interpreted along the western Galapagos are significantly less. Moore et al.[1989]
describes more than 68 major slides along the full axis of the Hawaiian Ridge, each
more than 20 km long, and cover about one half of the flanks of the ridge. Watts and
Mason [1995] identified a giant landslide on the north flank of Tenerife, Canary Islands
that was ~ 100 km long and 80 km wide. These giant slides, imaged by GLORIA, have
been determined to occur through all stages of volcano shield building. Though the
numerous and large volume slides of the Hawaiian and Canary Islands are not mirrored
in the bathymetry of the western Galapagos, the existence of subaerial sector collapse
scars, like that of Volcan Ecuador, the proximity of the platform to the abyssal plain,
and the growth of the islands on the steep platform edge suggest that larger mass wasting

62
58
events may have occurred in the history of the Galapagos Islands, but that the evidence
for such events lie outside of the study area or has been masked by the submarine
volcanism. Geist et al. [2002] explains that catastrophic sector collapse(s) of Volcan
Ecuador’s western flank most likely slid to abyssal depths off the platform evidenced by
the existence of hummocky terrain, primarily obscured by young lava flows, to a
distance of 20 km from the west coast. Other sector collapses known to occur in the
western Galapagos, including the southwest flank of Cerro Azul [Naumann and Geist,
2000], the west face of Pinta [Cullen and McBirney, 1987] and the west face of Santa Fe
[Geist et al., 1985] indicate that giant slides are likely.
The maximum resolution of the bathymetry data is 25m. The thickness of mass
wasting features could not be determined in the bathymetry because the thicknesses were
unable to be differentiated reliably from the original shape of the volcano. Additional
data, such as sub-bottom or seismic profiles will be necessary to determine the thickness
of the slides and their respective volumes. The uncertainty in the slide definition is
variable because another person may decide to draw the edges of the slide differently
because their perception of the slide bounds may be different.

63
58
5. CONCLUSION
Four types of mass wasting have been identified in the western Galapagos Island
including slump sheets, debris flows, detached blocks, and chaotic slumping. A total of
23 mass wasting features were found to exist in the western Galapagos Islands, including
fourteen debris flows with one that incorporated one set of detached blocks, seven slump
sheets, and one chaotic slump with hummocky terrain. Some of the indentified features
have obvious origination zones while the sources of others are not clearly identifiable.
Approximately 73 percent of the surveyed coastlines are affected by slumping on the
steep upper slopes and ~64 percent are affected by debris flows on the lower slopes.
Unlike the giant landslides documented by GLORIA imagery around the Hawaiian
Islands, the western Galapagos Islands appear to be characterized by small slump sheets
existing along the steep shallow submarine flanks of the island and by debris flows that
are flanked by rift zones and extend off the platform. The slumps have areas ranging
from 13.6 km2 to 93.7 km
2, lengths varying from 4.4 to 36.3 km and widths ranging
from 1.2 to 2.5 km. These debris flows range from 4.0 to 15.4 km at their widest point
and are less than 17 km long. This study indicates that submarine mass wasting is
widespread in the western Galapagos, suggesting that the production of small-scale
downslope movement is part of the erosive nature of these oceanic volcanic islands.

64
64
REFERENCES
Bailey, K., (1976), Potassium-Argon ages from the Galapagos Islands, Science,
192(4238), 465-467, DOI:10.1126/science.192.4238.465.
Borgia, A., (1994), Dynamic basis of volcanic spreading, Journal of Geophysical
Research, 99(B9), 17791-17804, DOI: 10.1029/94JB00578.
Coleman, J., and D. Prior (1988), Mass wasting on continental margins, Annual
Review of Earth and Planetary Sciences, 16, 101-119, DOI:
10.1146/annurev.ea.16.050188.000533.
Cullen, A., and A. McBirney (1987), The volcanic geology of petrology of Isla Pinta,
Galapagos Archipelago, Geological Society of America Bulletin, 98, 294-301,
DOI: 10.1130/0016-7606(1987)98.
Elsworth, D., and B. Voight (1995), Dike intrusion as a trigger for large earthquakes and
failure of volcano flanks, Journal of Geophysical Research, 100, 6005-6024.
Firth, C., I. Stewart, W. McGuire, S, Kershaw, and C. Vita-Finzi (1996), Coastal
elevation changes in eastern Sicily: Implications for volcano instability at Mount
Etna, in McGuire W., P. Jones, and J. Neuberg (eds) Volcano instability on the Earth
and other planets, Geological Society [London] Special Publication, 110, 153-167,
DOI: 10.1144/GSL.SP.1996.110.01.1.
Fornari, D., J. Moore, and L. Calk (1979), A large submarine sand rubble flow on the
Kilauea Volcano, Hawaii, Journal of Volcanology and Geothermal Research, 5(3-4),
239-256, DOI: 10.1016/0377-0273(79)90018-0.
Fornari, D., M. Kurz, D. Geist, P. Johnson, G. Peckman, and D. Scheirer (2001), New
perspectives on the structure and morphology of the submarine flanks of Galapagos
volcanoes – Fernandina and Isabela, EOS Trans. AGU, 82(47), Fall Meet. Suppl.,
Abstract T41D-06.
Geist, D., A. McBirney, and R. Duncan (1985), Geology of Sante Fe Island: The oldest
Galapagos Volcano, Journal of Volcanology and Geothermal Research, 52, 65-82,
DOI: 10.1016/0377-0273(85)90056-3.
Geist, D., W. White, F. Albarede, K. Harpp, R. Reynolds, J. Blichert-Toft, and M. Kurz.
(2002), Volcanic evolution in the Galapagos: The dissected shield of Volcan
Ecuador. Geochemistry Geophysics Geosystems, 3(10), 1061, DOI:
10.1029/2002GC000355.

65
65
Geist, D., T. Naumann, J. Standish, M. Kurz, K. Harpp, W. White, and D. Fornari
(2005), Wolf Volcano, Galapagos Archipelago: Melting and magmatic evolution at
the margins of a mantle plume, Journal of Petrology, 46(11), 2197-2224, DOI:
10.1093/petrology/egi052.
Geist, D., D. Fornari, M. Kurz, K. Harpp, S. Adam Soule, M. Perfit, and A. Koleszar
(2006), Submarine Fernandina: Magmatism at the leading edge of the Galapagos hot
spot, Geochemistry Geophysics Geosystems, 7(12), CiteID Q12007, DOI:
10.1029/2006GC001290.
Gillot, P., J. Lefevre, and P. Nativel (1994), Model for the structural evolution of the
volcanoes of Reunion Island, Earth Planetary Science Letter, 122, 291-302, DOI:
10.1016/0012-821X(94)90003-5.
Glass, J., D. Fornari, H. Hall, A. Cougan, H. Berkenbosch, M. Holmes, S.White, and G.
De La Torre (2007), Submarine geomorphology of the western Galapagos based on
EM-300 bathymetry and MR1 side-scan sonar, Geochemistry Geophysics
Geosystems, 8(3), CiteID Q03010, DOI: 10.1029/2006GC001464.
Gripp, A., and R. Gordon (2002), Young tracks of hot-spots and current plate velocities,
Geophysical Journal International, 150, 321-361.
Hampton, M., H. Lee, and J. Locat (1996), Submarine Slides, Reviews of Geophysics,
34, 33-59.
Harpp, K., D. Fornari, D. Geist and M. Kurz (2003), Genovesa Submarine Ridge: A
manifestation of plume-ridge interaction in the northern Galapagos Islands, Geochemistry Geophysics Geosystems, 4(9), 8511, DOI: 10.1029/2003GC000531.
Holcomb, R., and R. Searle (1991), Large slides from oceanic volcanoes, Marine
Geotechnology, 10(1-2), 19-32, DOI: 10.1080/10641199109379880.
Keating, B., C. Helsley, and I. Karogodina (2000), Sonar studies of submarine mass
wasting and volcanic structures off Savaii Island, Samoa, Pure and Applied
Geophysics, 157(6-8), 1285-1313, DOI: 10.1007/s000240050026.
Kurz, M., D. Fornari, D. Geist, and Shipboard Scientific Party (2001), Cruise report
Leg-4 R/V Roger Revelle, National Science Foundation Ocean Sciences Division
Marine Geology & Geophysics OCE – 0002461.
Lenat, J., P. Vincent, and P. Bachelery (1989), The off-shore continuation of an active
basaltic volcano: Piton de la Fournaise (Reunion Island, Indian Ocean); Structural
and geomorphological interpretation from seabeam mapping, Journal of Volcanology
and Geothermal Research., 36(1-3), 1-36, DOI: 10.1016/0377-0273(89)90003-6.

66
66
Lo Giudice, E., and R. Rasa (1992), Very shallow earthquakes and brittle deformation in
active volcanic areas: The Etnean region as an example, Tectnophysics, 202(2-4),
257-268, DOI: 10.1016/0040-1951(92)90111-I.
McGuire, W., A. Pullen, and S. Saunders (1990), Recent dyke-induced large scale
block movement at Mount Etna and potential slope failure, Nature, 343, 357 – 359,
DOI: 10.1038/343357a0.
McGuire, W. (1996), Volcano instability: A review of contemporaneous themes, in
McGuire W., P. Jones, and J. Neuberg (eds), Volcano Instability on the Earth and
other planets, Geological Society [London] Special Publication, 110, 1–23.
Montalto, A., S. Vicinguerra, S. Menza, and G. Patane (1996), Recent seismicity of
Mount Etna: Implication for flank instability, Geological Society [London] Special
Publications, 110, 169-177, DOI: 10.1144/GSL.SP.1996.110.01.13
Moore, J. (1964), Giant Submarine slides on Hawaiian Ridge, U.S. Geological Survey
Open File Rep., 501-D, D95-D98.
Moore, J., D. Clague, R. Holcomb, P. Lipman, W. Normark, and M. Torresan (1989),
Prodigious submarine slides on Hawaiian Ridge, Journal of Geophysical Research,
94, 17484-17645.
Murray, J., and B. Voight (1996), Slope stability and eruption prediction on the eastern
flank of Mount Etna, Geological Society [London] Special Publication, 110, 111-
114, DOI: 10.1144/GSL.SP.1996.110.01.08.
Naumann, T., and D. Geist (2000), Physical volcanology and structural development of
Cerro Azul volcano, Isabela Island, Galapagos: Implications for the development of
Galapagos-style shield volcanoes, Bulletin Volcanology, 61(8), 497-514, DOI:
10.1007/s004450050008.
Simkin, T. (1984), Geology of the Galapagos Islands, in Galapagos (Key Environments),
edited by R. Perry, 15–41, Elsevier, New York.
Simkin, T., and L. Siebert (1994), Volcanoes of the World, 2nd
ed., 349, Geoscience
Press, Arizona.
Stillman, C. (1999), Giant Miocene slides and the evolution of Fuerteventura, Canary
Islands, Journal of Volcanology and Geothermal Research, 94, 89-104, DOI:
10.1016/S0377-0273(99)00099-2.
Watts, A., and D. Masson (1995), A giant slide on the north flank of Tenerife, Canary
Islands, Journal of Geophysical Research, 100, 24487-24498.

67
67
Wilson, D., and R. Hey (1995), History of rift propagation and magnetization intensity
for the Cocos-Nazca spreading center, Journal of Geophysical Research, 100(B7),
10041-10056, DOI: 10.1029/95JB00762.

68
68
VITA
Name: Hillary Fawn Hall
Address: In care of the Department of Oceanography
Texas A&M University
Eller O&M Building
MS 3146
College Station, TX 77843-3146
Email Address: [email protected]
Education: B.S., Oceanography, The University of Washington at Seattle,
2006
B.S., Earth and Space Sciences, The University of Washington at
Seattle, 2006
M.S., Oceanography, Texas A&M University, 2011
Publications and presentations:
Glass, J., D. Fornari, H. Hall, A. Cougan, H. Berkenbosch, M. Holmes, S.White and G.
De La Torre (2007), Submarine geomorphology of the western Galapagos based on
EM-300 bathymetry and MR1 side-scan sonar, Geochemistry Geophysics Geosystems,
8(3), CiteID Q03010, DOI: 10.1029/2006GC001464.
Hall, H., W. Sager (2009), Mass Wasting of the Western Galapagos. American
Geophysical Union Fall Meeting, Abstract #NH41C-1261 and poster presentation.