Embed Size (px)
Citation preview
ORIGINAL ARTICLE
Mass spectrometry imaging of amino neurotransmitters:a comparison of derivatization methods and application in mousebrain tissue
Clara Esteve1 • Else A. Tolner2 • Reinald Shyti3 • Arn M. J. M. van den Maagdenberg2,3 •
Liam A. McDonnell1,4
Received: 26 June 2015 / Accepted: 19 September 2015 / Published online: 8 January 2016
� The Author(s) 2016. This article is published with open access at Springerlink.com
Abstract The detection of small polar compounds such
as amino neurotransmitters by MALDI mass spectrometry
imaging has been hindered by low-detection sensitivity and
background interferences. Recently, several of on-tissue
chemical derivatization strategies have been independently
reported that enable their detection. Here, we present a
comparison between these methods, and demonstrate the
visualization of the distributions of up to 23 amino
metabolites in tissue. We applied this methodology to
detect alterations of these compounds after inducing an
experimental cortical spreading depression in mouse brain,
which causes profound transient alterations in key neuro-
transmitters in one hemisphere and is relevant for migraine
and various other neurological disorders.
Keywords Mass spectrometry imaging �Neurotransmitters � Chemical derivatization � Amino
acids � Mouse brain
1 Introduction
Neurotransmitters (NTs) play a vital role in nerve cell
communication and regulate a variety of biological pro-
cesses and behaviours (Lowe 2011). Several NTs are small
polar compounds containing one amino group, like amino
acids and monoamines. Abnormal concentrations of this
neurotransmitters and consequent dysfunction of neural
systems are linked to various central nervous system dis-
orders such as schizophrenia (Hirvonen and Hietala 2011),
Parkinson’s disease (Klein et al. 2010), Alzheimer’s dis-
ease (Lanari et al. 2006), migraine (D’Andrea and Leon
2010), and depression (Mitani et al. 2006). Visualization of
changes in the concentrations of NTs in situ will be
essential in understanding their role in various neuro-
physiological processes in different regions of the brain,
but until recently has not been feasible.
The advent of mass spectrometry imaging (MSI) as a
tool to determinate the distribution of small molecules
present in tissue samples (Norris and Caprioli 2013; Fuji-
mura and Miura 2014; McDonnell and Heeren 2007), has
opened the door to apply the technology also to the
detection of amino neurotransmitters. MSI allows spatially-
correlated mass spectrometry analysis to simultaneously
assess the distributions of panels of biomolecules in tissue
sections. Determination of the spatial localization of NTs
by MSI would allow us to directly examine their role
within pathological processes, thereby contributing to a
better understanding of the pathophysiology of the brain
(Miura et al. 2010; Sugiura et al. 2012, 2014). However,
the analysis of amino metabolites by MSI has proven dif-
ficult because of their low-ionization efficiency, spectral
interferences from MALDI matrix-background ions or
tissue components, ion suppression effects and analyte in-
source fragmentation.
Electronic supplementary material The online version of thisarticle (doi:10.1007/s11306-015-0926-0) contains supplementarymaterial, which is available to authorized users.
& Liam A. McDonnell
1 Center for Proteomics and Metabolomics, Leiden University
Medical Center, Einthovenweg 20, 2333 ZC Leiden, The
Netherlands
2 Department of Neurology, Leiden University Medical Center,
Leiden, The Netherlands
3 Department of Human Genetics, Leiden University Medical
Center, Leiden, The Netherlands
4 Fondazione Pisana per la Scienza ONLUS, Pisa, Italy
123
Metabolomics (2016) 12:30
DOI 10.1007/s11306-015-0926-0
Chemical derivatization is a well-established strategy
for the detection of amino metabolites using capillary
electrophoresis, gas chromatography and high-performance
liquid chromatography (Zhang et al. 2014; Denoroy et al.
2008; Yoon 2013). Recently such methods have begun to
be applied to MSI (Toue et al. 2014; Manier et al. 2014;
Shariatgorji et al. 2014, 2015) but importantly no system-
atic comparisons have been performed. Through derivati-
zation the amino neurotransmitters are more easily and
more uniformly ionized, and their mass increased; the
result is increased detection sensitivity for a range of amino
neurotransmitters and less background ions interfering with
the analysis.
Here we have systematically compared the recently
reported on-tissue chemical derivatization protocols in
order to improve the detection of amino metabolites and
neurotransmitters by MSI. The optimized methods were
then used for the visualization of amino neurotransmitter
levels and distributions following cortical spreading
depression (CSD), the electrophysiological correlate of
migraine with aura. The lack of lack of clear histopatho-
logical features following CSD prevents the histology-de-
fined microdissection workflows used in typical molecular
pathology research. Instead we use MSI to annotate tissues
based on their MS profiles and thereby identify which
regions have altered biomolecular profiles (even if they
were unexpected or are not distinct using established his-
tological and histochemical methods). By applying neuro-
transmitter MSI here we report, for the first time, the first
direct measure of altered amino neurotransmitters follow-
ing CSD, a process tightly implicated in migraine, stroke
and traumatic brain injury (Lauritzen et al. 2011).
2 Materials and methods
2.1 Chemicals
2,5-Dihydroxybenozic acid (DHB), a-cyano-4-hydrox-
ycinnamic acid (CHCA), N,N0-dihydroxysuccinimidyl car-
bonate (DSC), N,N-dimethyl-amino-p-phenylenediamine,
trifluoroacetic acid (TFA), 4-hydroxy-3-methoxycin-
namaldehyde (CA), 2,3-diphenyl-pyranylium tetrafluoro-
borate (DPP-TFB), poly-L-lysine solution, acetonitrile
(ACN) and methanol (MeOH) were obtained from Sigma-
Aldrich (St. Louis, MO, USA). The standards of glycine,
cysteine, leucine, glutamine, tryptophan, dopamine, and
norepinephrine were also purchased from Sigma-Aldrich.
Indium tin oxide (ITO)-coated glass slides were purchased
from Bruker Daltonics (Bremen, Germany). p-N,N,N-
trimethylammonioanilyl N-hydroxysuccinimidyl carbamate
iodide (TAHS) was synthesized as descried previously
(Shimbo et al. 2009).
2.2 Animal protocol
Female C57BL/6J mice of 3 months of age were used.
Non-treated mouse brain was used for method develop-
ment. Cortical spreading depression (CSD) was evoked by
topical KCl application to the cortex (SHAM experiments
used NaCl, which does not induce CSD events) and mon-
itoring was performed as described previously (Shyti et al.
2015). In brief, surgery was performed using 1.5 %
isoflurane anesthesia in pressurized air. A cranial window
was prepared above the occipital cortex of the right
hemisphere (ca. 3.5 mm posterior, 2 mm lateral from
bregma). For evoking CSD events a cotton ball soaked in
300 mM KCl was placed for 30 s on the dura overlaying
the occipital cortex. This was followed by a wash with
150 mM NaCl. Using this approach, seven CSDs were
evoked by repeated application of KCl with an interval of
5 min. The CSDs were monitored by recording cortical
DC-potential changes via a glass microelectrode that was
placed in the frontal sensorimotor cortex (0.5 mm anterior,
2 mm lateral from bregma; depth 300 lm). In case of a
SHAM treatment, a cotton ball was soaked in 1 M NaCl
instead of KCl. Directly after the last CSD, or after the last
application of 1 M NaCl in case of the SHAM animal, the
mouse was sacrificed by decapitation and the brain quickly
isolated and stabilized prior to freezing using a tissue heat-
stabilizor device (StabilizorTM, Denator AB, Sweden). This
strategy minimizes metabolite post-mortem degradation
and preserves metabolite localisation (Sugiura et al. 2014).
The tissues were stored at -80 �C until use. Brain tissues
were sectioned at 12 lm thickness using a cryostat (1720
Digital, Leica, Rijswijk, The Netherlands) at -20 �C and
thaw-mounted onto an ITO-coated glass slide previously
coated with poly-L-lysine (0.05 % in water). Note for the
analysis of the SHAM and CSD animals cortical brain
sections were selected from the region between CSD
induction (ca. 3.5 mm posterior to Bregma) and electro-
physiology monitoring (0.5 mm anterior to Bregma).
2.3 Derivatization method
We first explored the derivatization of amino metabolites in
solution with TAHS, CA, and DPP-TFB under specific
conditions following the recommended methods for similar
derivativization reactions (Manier et al. 2011; Shimbo et al.
2009; Toue et al. 2014; Rebane et al. 2012). Standards of
glycine, cysteine, leucine, glutamine, tryptophan, dopamine
and norepinephrine were used for testing. For derivatization
with TAHS, 40 lL of reagent dissolved in ACN (5 mg/mL)
were mixed with 40 lL of standards (100 lg/mL) and
120 lL borate buffer (0.2 M, pH 8.8). The mixture was kept
at 55 �C during 1 h. For derivatization with CA, 100 lL of
reagent (2 mg/mL in MeOH) were mixed with 100 lL of
30 Page 2 of 9 C. Esteve et al.
123
standards and kept at 37 �C for 1 h. In the case of derivati-
zation with DPP-TFB, 100 lL of reagent (2 mg/mL in
MeOH) were mixed with 100 lL of standards dissolved in
borate buffer (0.2 M, pH 8.65) and kept at RT for 1 h. Before
analysis, samples were cooled to RT. A volume of 0.5 lL of
the samples was deposited onto the MALDI sample target
and air-dried. Next, 0.5 lL of DHB (30 mg/mL in 70 %
MeOH, 0.1 % TFA) was deposited atop of the sample and air
dried before immediate MALDI-Fourier transform ion
cyclotron resonance (FTICR)-MS analysis.
To perform on-tissue derivatization of amino metabo-
lites and neurotransmitters (NTs) the SunCollect sprayer
(SunChrom, Friedrischsdorf, Germany) was used. Fresh
solutions of derivatization reagents were prepared on the
same day. TAHS (5 mg/mL in 50 % ACN) was applied
using three layers at a flow rate of 10 lL/min and the brain
sections were incubated overnight at 55 �C. For the on-
tissue derivatization with CA (4 mg/mL in 50 % MeOH),
three layers were sprayed using a flow rate of 10 lL/min.
The brain tissue sections were then incubated at 37 �Covernight. Finally, for the reaction with DPP-TFB (5 mg/
mL in 100 % MeOH), 5 layers at a flow rate of 10 lL/min
were applied. For complete derivatization, the brain sec-
tions were kept overnight at RT.
For matrix deposition, fresh DHB (30 mg/mL in 70 %
MeOH and 0.1 % TFA) solution was sprayed using two
layers at 5 lL/min followed by six layers at 10 lL/min.
2.4 MALDI-MSI analysis
MALDI-MSI sample preparation optimization experiments
were performed using an UtlrafleXtreme MALDI-TOF/TOF
(Bruker Daltonis Inc., Billerica, MA, USA). The data were
acquired in the ion reflection mode using external calibra-
tion. For accurate mass analysis a 9.4 T SolariX MALDI-
FTICR (Bruker Daltonics) was used. MS data were acquired
in positive mode using lock-mass calibration in the rangem/z
50–500 by averaging signals from 500 laser shots. MSI was
performed with a spatial resolution of 125 lm for sagittal
sections and 100 lm for coronal sections. The MALDI-TOF
average mass spectra were normalized to their total-ion-
count (TIC) while no normalization was required for the
MALDI-FTICR spectra. Data acquisition, processing, and
data visualization were performed using the software suite
FlexControl 3.4, ftmsControl 2.0, FlexImaging 4.1 and
DataAnalysis 4.2 from Bruker Daltonics.
3 Results and discussion
The on-tissue detection of amino metabolites and NTs by
MALDI MSI has been notoriously challenging, mainly due
to the low-ionization efficiency and the background
spectral interferences from the MALDI matrix. In order to
increase analysis sensitivity, a strategy is proposed that is
based on on-tissue derivatization followed by high-reso-
lution MS measurement. For that purpose, derivatization
reagents were chosen that have been demonstrated to
enhance the detection of amino metabolites in MALDI
MSI. The selected compounds were commercially avail-
able derivatization reagents CA (Manier et al. 2014) and
DPP-TFB (Shariatgorji et al. 2014, 2015), and home-syn-
thesized derivatization reagent TAHS (Rebane et al. 2012;
Shimbo et al. 2009). Derivatization reactions of amino
groups with each derivatization reagent are shown in
Supplementary Figure 1.
Prior to on-tissue experiments the derivatization reagents
were tested in-solution. A mixture of standards of amino
acids and amines, (glycine, cysteine, leucine, glutamine,
tryptophan, dopamine and norepinephrine) were allowed to
react with the derivatization reagents. The resulting
derivatives were analysed using MALDI-FTICR-MS; for all
derivatization reagents the derivatization led to the forma-
tion of [M]? ions with no observable [M]2? or [M ? Na]?
ions. Peaks corresponding to each derivative were observed,
with mass shifts of ?177.1022 for TAHS derivatives,
?160.05188 for CA derivatives, and ?215.0855 for DPP-
TFB derivatives. The differences between the theoretical
and observed m/z values of each derivatized standard com-
pound were\1 ppm.
3.1 Optimization of on-tissue derivatization
conditions for amino metabolites MALDI MSI
In order to maximize detection sensitivity and maintain the
spatial distribution of amino metabolites in tissue, we
optimized the derivatization reaction conditions. The
effects of incubation time, derivatization reagent concen-
tration, solvent composition, and amount of reagent solu-
tion applied to the tissue were optimized for each of the
three derivatization reagents. Besides this, the absence of
matrix and different organic matrices were also tested.
Reaction temperature was chosen according to the
parameters suggested in the published methods (Manier
et al. 2014; Shariatgorji et al. 2014; Toue et al. 2014).
Derivatization reactions were kept overnight at 55 �C for
TAHS, which is necessary to suppress an undesired side
reaction between TAHS and the phenolic hydroxyl group
of Tyr (Toue et al. 2014). Based on the experience of
Manier et al. (2014) a temperature of 37 �C was used for
CA reaction. The TPP-TFB reaction was performed at RT,
as reported by Shariatgorji et al. (2014). To date no com-
parison of these three derivatization methods has been
reported.
The optimal concentration of derivatization reagent was
investigated by achieving the highest detection sensitivity
Mass spectrometry imaging of amino neurotransmitters: a comparison of derivatization methods… Page 3 of 9 30
123
but without the negative effect of large interferences from
derivatization reagent peaks. TAHS was dissolved in 50 %
MeOH at concentrations of 2–10 mg/mL; CA was dis-
solved in 50 % ACN at concentrations of 2.5–10 mg/mL;
and DPP-TFB was dissolved in 100 % MeOH at concen-
trations of 1–10 mg/mL. Variations in the solvent com-
position did not influence the efficiency of the on-tissue
derivatization reaction. Trials were performed by spraying
1–5 layers using a flow rate of 10 lL/min with different
derivatization reagents, using DHB as a matrix. The
deposition of the derivatization reagent has a critical effect
on the detection of amino metabolites, as shown in Sup-
plementary Figure 2. The figure shows, as an example, the
visualization of consecutive sagittal sections sprayed with
increasing layers of TAHS (10 mg/mL) and CA (2 mg/
mL). Initially an increase in the amount of derivatization
reagent provides a higher intensity of derivatized amino
metabolites (e.g. glyine-CA derivative). However, when
excess derivatization reagent is added, the signal of the
derivatization reagent itself can dominate, as shown for
GABA-TAHS derivative. We, therefore, defined an opti-
mum derivatization preparation by maximizing the detec-
tion sensitivity of the derivatized amino metabolites
without the derivatization reagent as the mass spectrum’s
base peak. Optimized concentration and spraying condi-
tions for each derivatization reagent were: TAHS (5 mg/
mL, 3 layers at 10 lL/min); CA (4 mg/mL, 3 layers at
10 lL/min); DPPTFB (5 mg/mL, 5 layers at 10 lL/min).
The influence of reaction time was assayed between 1
and 24 h for all derivatization reagents. For the highest
detection sensitivity of the compounds, an incubation of
approximately 22–24 h was found to be necessary for a
complete derivatization reaction. Longer periods of time
did not result in an increase in signal intensity.
The co-spraying of derivatization reagent and MALDI
matrix has been reported to be, in some cases, an effective
strategy to minimize loss of spatial resolution and increase
the efficiency of the workflow (Manier et al. 2014).
Matrices were simultaneously applied to the tissue sections
in order to maintain consistent analyte extraction and
crystallization conditions. To achieve the same amount of
derivatization reagent and matrix as when they were
sprayed separately, they were mixed together using the
following concentrations: TAHS (2.1 mg/mL) and DHB
(30 mg/mL) in 50 % ACN and 0.1 % TFA; CA (1.7 mg/
mL) and DHB (30 mg/mL) in 50 % MeOH and 0.1 %
TFA; and DPP-TFB (3.6 mg/mL) and DHB (30 mg/mL) in
80 % MeOH and 0.1 % TFA. The spraying method for
DHB was used to deposit the combination of DHB and
derivatization reagent and the slides were kept for 24 h at
their corresponding temperature reactions. The resulting
images did not reveal improvements in signal intensities or
image quality. However, the derivatization of some amino
compounds was much less effective. This could be
explained by the fact that a DHB acidic solution is required
for an effective ionization in positive mode, which gives an
unsuitable derivatization reaction environment, which in
most of cases, require soft basic pH conditions (Toue et al.
2014; Rebane et al. 2012; Shimbo et al. 2009).
In MALDI MSI the choice of matrix is critical for
determining which molecules can be analysed and with
which sensitivity. Some derivatization reagents, like TAHS
and DPP-TFB, form positively charged derivatives that
enable their analysis without the addition of matrix
(Shariatgorji et al. 2014, 2015). To determine the best MSI
method, consecutive tissue sections were analysed using
DHB, CHCA, or in the absence of matrix. For DHB, the
method described above was used, whereas for CHCA
(5 mg/mL in 50 % ACN, 0.3 % TFA) was sprayed in 5
layers (1 layer at 5 lL/min, 1 layer at 15 lL/min, and 3
layers at 20 lL/min). The results showed a dramatic
reduction in the signal of DPP-TFB derivatized amino
metabolites in absence of matrix, severely limiting the
detection of the derivatized metabolites. The MALDI
matrices CHCA and DHB gave similar signal intensities
for the derivatized amino metabolites. DHB was selected
because the images displayed a slightly lower metabolite
delocalization.
From these results we determined the optimal on-tissue
derivatization procedures (cf. Sect. 2). In brief, brain tissue
sections were sprayed using the three different derivatiza-
tion reagents and left to react for 24 h at optimal temper-
atures. Subsequently, tissue sections were spray-coated
with DHB and MALDI-MSI data acquired using ultra high
mass resolution MALDI-FTICR-MSI.
3.2 Visualization of derivatized amino metabolites
in brain sections by MALDI-FTICR-MS
For the comparative study of the three different derivati-
zation reagents, consecutive WT mouse brain sagittal
sections were used. None of the amino metabolites could
be visualized in the absence of derivatization reagent. The
peaks of the derivatized compounds were not present in the
matrix or tissue controls, which consisted of, respectively,
a space adjacent to the tissue or a consecutive tissue section
subjected to all the sample treatment but in absence of
derivatization reagent. A representative spectra from the
metabolites derivatized with the different derivatization
reagents is shown in Supplementary Figure 3.
The analysis was performed using ultra high resolution
MALDI-FTICR-MS. Supplementary Table 1 shows the
detected TAHS-, CA- and DPP-TFB-derivatized amino
metabolites, including the theoretical and observed m/z
values of each derivative. All mass errors were below 2 ppm
using external calibration. Figure 1 shows a selection of
30 Page 4 of 9 C. Esteve et al.
123
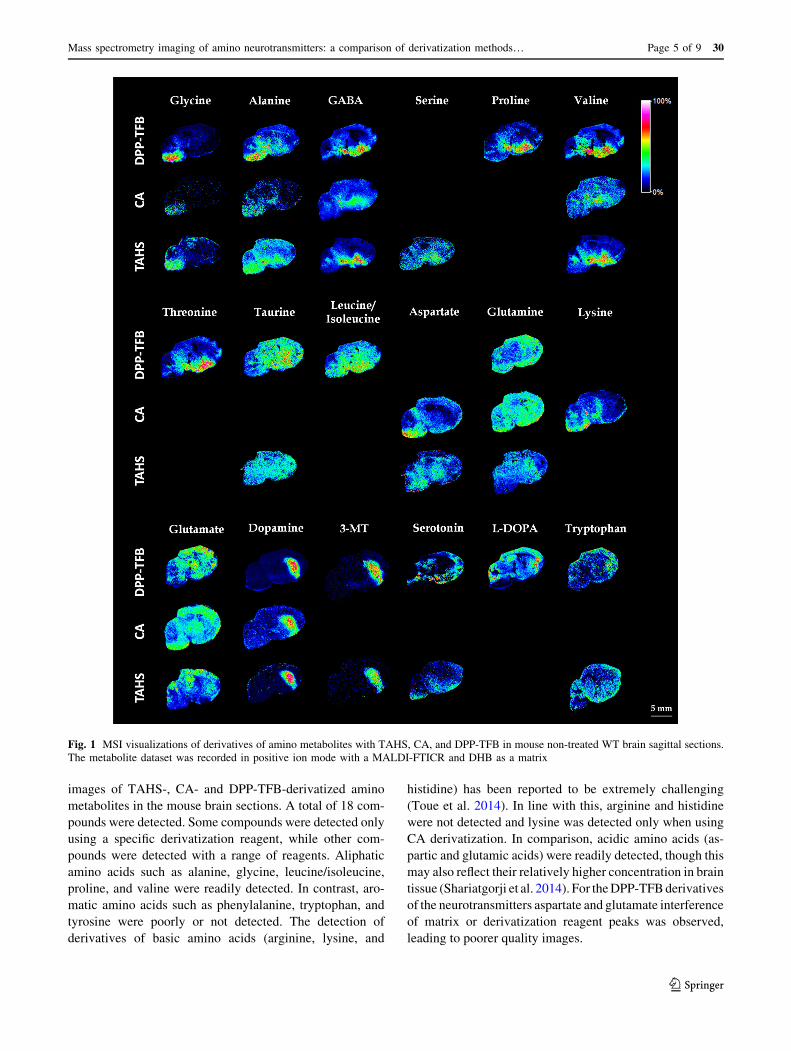
images of TAHS-, CA- and DPP-TFB-derivatized amino
metabolites in the mouse brain sections. A total of 18 com-
pounds were detected. Some compounds were detected only
using a specific derivatization reagent, while other com-
pounds were detected with a range of reagents. Aliphatic
amino acids such as alanine, glycine, leucine/isoleucine,
proline, and valine were readily detected. In contrast, aro-
matic amino acids such as phenylalanine, tryptophan, and
tyrosine were poorly or not detected. The detection of
derivatives of basic amino acids (arginine, lysine, and
histidine) has been reported to be extremely challenging
(Toue et al. 2014). In line with this, arginine and histidine
were not detected and lysine was detected only when using
CA derivatization. In comparison, acidic amino acids (as-
partic and glutamic acids) were readily detected, though this
may also reflect their relatively higher concentration in brain
tissue (Shariatgorji et al. 2014). For the DPP-TFB derivatives
of the neurotransmitters aspartate and glutamate interference
of matrix or derivatization reagent peaks was observed,
leading to poorer quality images.
Fig. 1 MSI visualizations of derivatives of amino metabolites with TAHS, CA, and DPP-TFB in mouse non-treated WT brain sagittal sections.
The metabolite dataset was recorded in positive ion mode with a MALDI-FTICR and DHB as a matrix
Mass spectrometry imaging of amino neurotransmitters: a comparison of derivatization methods… Page 5 of 9 30
123
The visualization of the derivatized amino metabolites
show, in several cases, high intensities and specific localiza-
tions. In several cases MALDI-FTICR-MS analysis verified
the presence of signals consistent with the three different
derivatives, like for glycine, alanine, GABA, valine, and
dopamine. Distributions were also consistent with previously
published data. For example GABA was found to be most
abundant in hypothalamus, midbrain, and basal forebrain,
which is consistent with previous reports (Alreja et al. 2000;
Shariatgorji et al. 2014). GABA is a dominant NT in
hypothalamus and plays an important role in hypothalamic
inhibitory circuits (Decavel and Vandenpol 1990). Glutamate
was detected in many structures of the brain but was mostly
localized in striatal and cortical regions, in agreement with
what has been published before (Shariatgorji et al. 2014).
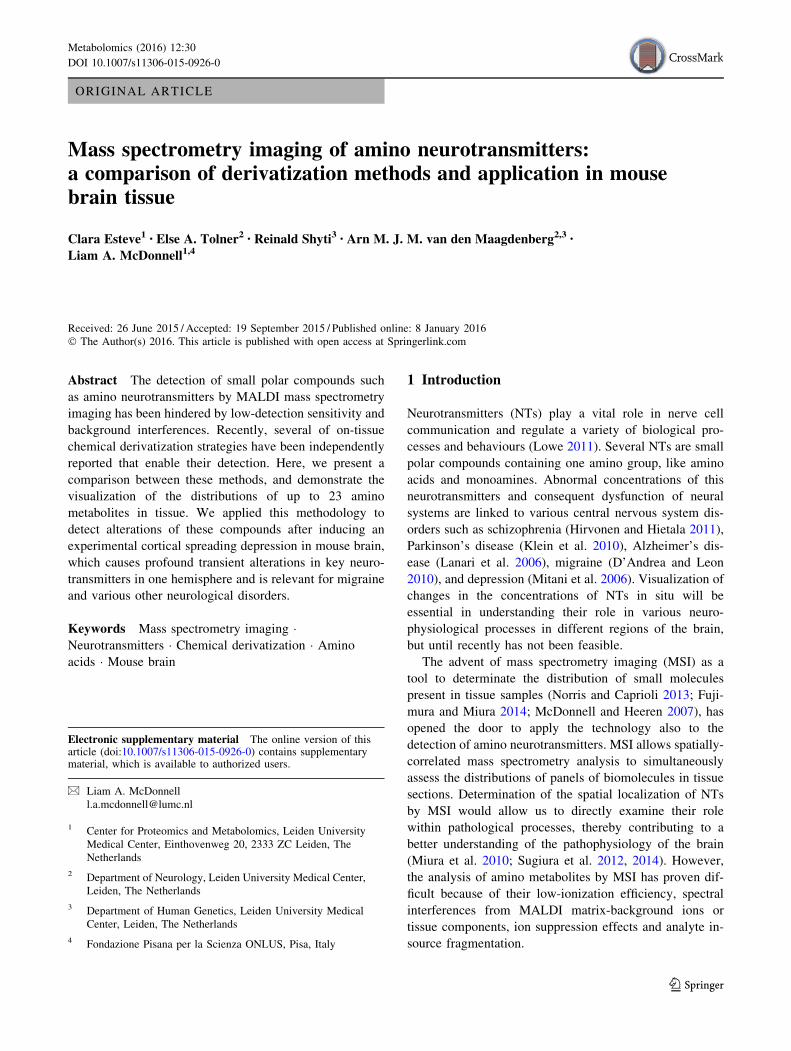
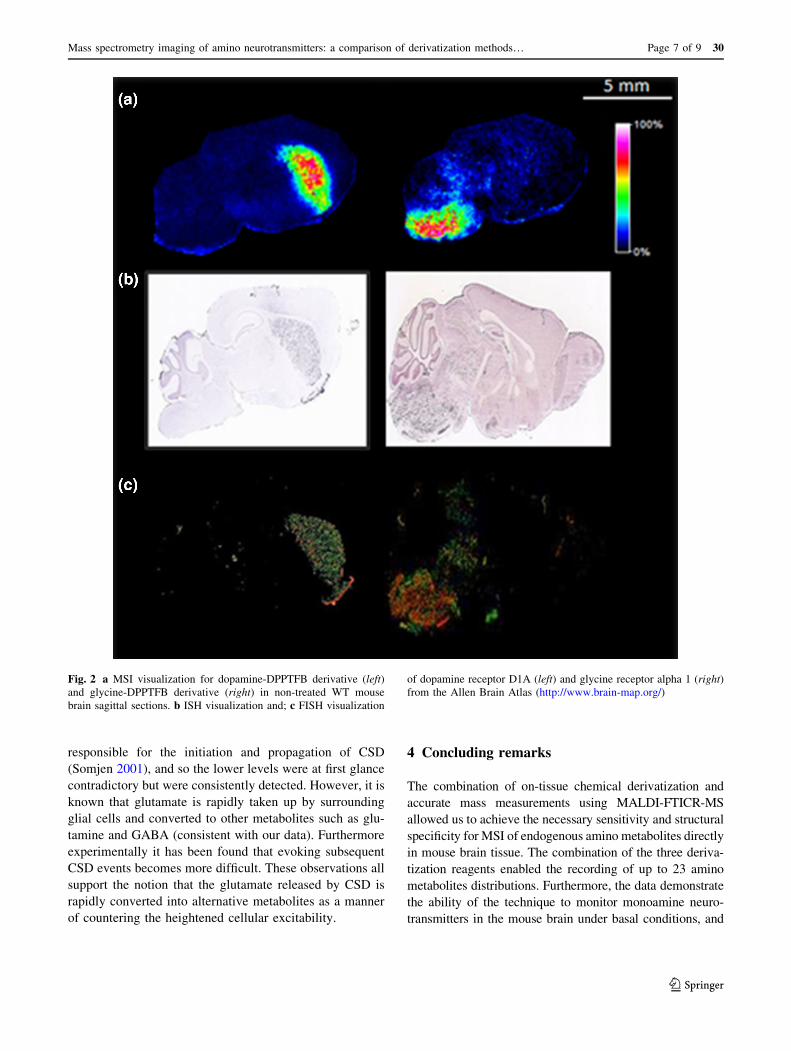
Notably, the distribution observed for some derivatized
amino metabolites is consistent with gene expression data
contained in the Allen Brain Atlas (Lein et al. 2007) for
their corresponding receptors. Clear examples of such
correlation was provided for amino metabolites glycine and
dopamine by comparing the MS images of DPP-TFB
derivatives of metabolites dopamine and glycine to in situ
hybridization (ISH) and fluorescent in situ hybridization
(FISH) images of dopamine receptor D1A and glycine
receptor alpha 1 subunit expression, respectively (Fig. 2).
In the case of dopamine, both the dopamine derivative
analysed by MALDI-FTICR-MS and its receptor show
good agreement, being located mainly in the striatum,
cortical subplate, and palladium. Notably, derivatized
metabolite 3-methoxytyramine (3-MT), a metabolite of
dopamine, is also localized in the same brain regions In
case of glycine, the visualization of derivatives shows a
localization in medulla and pons where also the glycine
receptor, alpha 1 subunit is also expressed (Fig. 2).
This evaluation showed that for most amino compounds,
the maximum MALDI signals and the best spatial distribu-
tion were obtained by spraying DPP-TFB dissolved in
100 % MeOH. This reaction produces charged N-alkyl
pyridinium ions that are readily detected with high sensi-
tivity in MALDI-MSI. However, in some specific cases like
in the analysis of negatively charged ions other reagents
showed better results. For that reason, we can conclude that
the three derivatization reagents work in a somewhat com-
plementary manner and that the use of a combination of
different reagents can be a valuable strategy for the detection
of a wider range of amino metabolites.
3.3 Visualization of amino neurotransmitters
changes in mouse brain that underwent CSD
in one hemisphere
The combination of on-tissue derivatization strategies
together with ultra high mass resolution MSI led us to
investigate the chemical and spatial extent of disturbances in
amino metabolites that follow CSD, evoked in one hemi-
sphere leaving the other hemisphere as an internal control
(Jones et al. 2012). Seven CSD events, spaced 5 min apart,
were evoked in one hemisphere after which the animal was
immediately sacrificed, the brain removed and heat stabi-
lized using a Denator Stabilizor instrument. To differentiate
changes related to the surgical procedure, but not to CSD,
also an analysis of a SHAM-operated animal was performed.
The SHAM animal underwent an identical surgical proce-
dure except that KCl was replaced with NaCl, which does not
induce a CSD (Shyti et al. 2015). 6 CSD and 6 SHAM brain
sections were analysed, randomly sampled from the region
between where CSD was evoked and recorded, to assess the
reproducibility of the results. Furthermore, since the three
derivatization methods gave complementary results and can
be used to validate amino metabolite changes, they were all
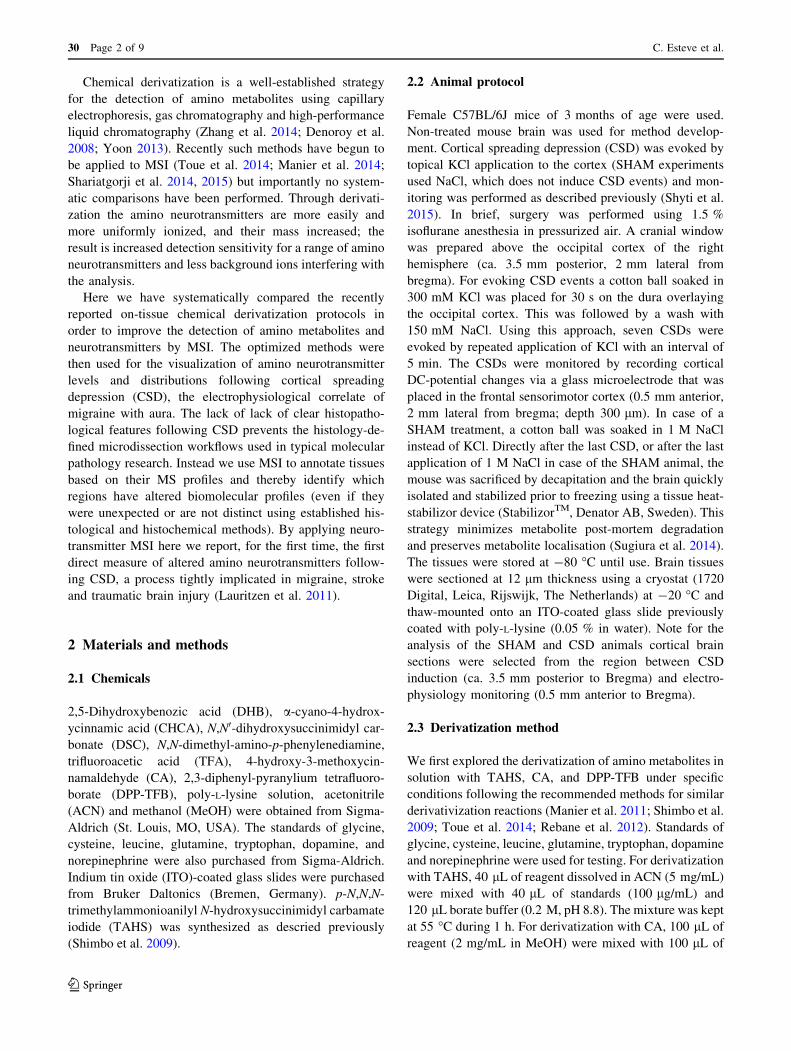
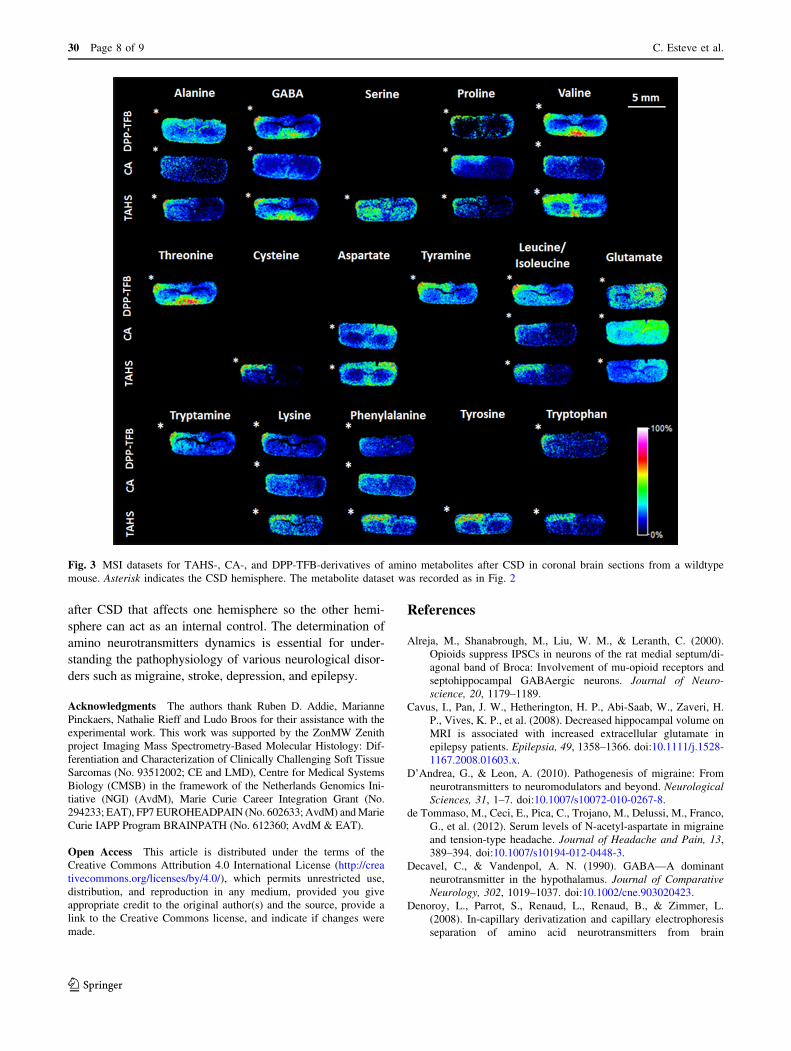
used for the analysis of mouse brain sections. Figure 3 shows
the visualization of several derivatized amino metabolites
obtained by MALDI-FTICR-MS in which the hemisphere in
which CSD was induced is marked with an asterisk. The
images reveal amino metabolites that showed clear con-
tralateral changes (both increased and decreased signal
intensities) after CSD, which were not observed in the
SHAM experiments (Supplementary Figure 4). The
increased signal of some amino metabolites after CSD
allowed us to detect new compounds that were not detected
under the SHAM condition, namely the metabolites cysteine,
tyramine, tryptamine, phenylalanine, and tyrosine. Figure 3
shows clear differences between the CSD and the control
hemisphere. Contralateral differences were evident in cor-
tical structures, but less so in subcortical structures further
away from the cortex, for all datasets, as observed previously
(Jones et al. 2012). Several free amino metabolites (alanine,
GABA, serine, proline, valine, cysteine, leucine/isoleucine,
lysine, phenylalanine, tyrosine, tryptophan) were detected
with increased intensities in the CSD hemisphere. On the
other hand, aspartate and glutamate were found to be
decreased in the CSD-affected hemisphere. No changes were
observed for metabolites glycine, taurine, glutamine, dopa-
mine, 3-MT, and L-DOPA (Supplementary Figure 5).
Disturbances in several amino metabolites have been
previously associated with CSD both in brain tissue (Jones
et al. 2012; Cavus et al. 2008; Levy and Degnan 2013;
Fabricius et al. 1993) and body fluids (Ragginer et al. 2012;
de Tommaso et al. 2012). Our MSI experiments revealed a
significant increase in several amino metabolites in the
cortex after CSD, notably GABA, an inhibitory neuro-
transmitter that counters the excitatory glutamate released
by CSD. The intensities of the excitatory amino neuro-
transmitters glutamate and aspartate were found to be
decreased in the CSD affected cortex. The release of
excitatory neurotransmitters, particularly glutamate, is
30 Page 6 of 9 C. Esteve et al.
123
responsible for the initiation and propagation of CSD
(Somjen 2001), and so the lower levels were at first glance
contradictory but were consistently detected. However, it is
known that glutamate is rapidly taken up by surrounding
glial cells and converted to other metabolites such as glu-
tamine and GABA (consistent with our data). Furthermore
experimentally it has been found that evoking subsequent
CSD events becomes more difficult. These observations all
support the notion that the glutamate released by CSD is
rapidly converted into alternative metabolites as a manner
of countering the heightened cellular excitability.
4 Concluding remarks
The combination of on-tissue chemical derivatization and
accurate mass measurements using MALDI-FTICR-MS
allowed us to achieve the necessary sensitivity and structural
specificity for MSI of endogenous amino metabolites directly
in mouse brain tissue. The combination of the three deriva-
tization reagents enabled the recording of up to 23 amino
metabolites distributions. Furthermore, the data demonstrate
the ability of the technique to monitor monoamine neuro-
transmitters in the mouse brain under basal conditions, and
Fig. 2 a MSI visualization for dopamine-DPPTFB derivative (left)
and glycine-DPPTFB derivative (right) in non-treated WT mouse
brain sagittal sections. b ISH visualization and; c FISH visualization
of dopamine receptor D1A (left) and glycine receptor alpha 1 (right)
from the Allen Brain Atlas (http://www.brain-map.org/)
Mass spectrometry imaging of amino neurotransmitters: a comparison of derivatization methods… Page 7 of 9 30
123
after CSD that affects one hemisphere so the other hemi-
sphere can act as an internal control. The determination of
amino neurotransmitters dynamics is essential for under-
standing the pathophysiology of various neurological disor-
ders such as migraine, stroke, depression, and epilepsy.
Acknowledgments The authors thank Ruben D. Addie, Marianne
Pinckaers, Nathalie Rieff and Ludo Broos for their assistance with the
experimental work. This work was supported by the ZonMW Zenith
project Imaging Mass Spectrometry-Based Molecular Histology: Dif-
ferentiation and Characterization of Clinically Challenging Soft Tissue
Sarcomas (No. 93512002; CE and LMD), Centre for Medical Systems
Biology (CMSB) in the framework of the Netherlands Genomics Ini-
tiative (NGI) (AvdM), Marie Curie Career Integration Grant (No.
294233; EAT), FP7 EUROHEADPAIN (No. 602633; AvdM) and Marie
Curie IAPP Program BRAINPATH (No. 612360; AvdM & EAT).
Open Access This article is distributed under the terms of the
Creative Commons Attribution 4.0 International License (http://crea
tivecommons.org/licenses/by/4.0/), which permits unrestricted use,
distribution, and reproduction in any medium, provided you give
appropriate credit to the original author(s) and the source, provide a
link to the Creative Commons license, and indicate if changes were
made.
References
Alreja, M., Shanabrough, M., Liu, W. M., & Leranth, C. (2000).
Opioids suppress IPSCs in neurons of the rat medial septum/di-
agonal band of Broca: Involvement of mu-opioid receptors and
septohippocampal GABAergic neurons. Journal of Neuro-
science, 20, 1179–1189.
Cavus, I., Pan, J. W., Hetherington, H. P., Abi-Saab, W., Zaveri, H.
P., Vives, K. P., et al. (2008). Decreased hippocampal volume on
MRI is associated with increased extracellular glutamate in
epilepsy patients. Epilepsia, 49, 1358–1366. doi:10.1111/j.1528-
1167.2008.01603.x.
D’Andrea, G., & Leon, A. (2010). Pathogenesis of migraine: From
neurotransmitters to neuromodulators and beyond. Neurological
Sciences, 31, 1–7. doi:10.1007/s10072-010-0267-8.
de Tommaso, M., Ceci, E., Pica, C., Trojano, M., Delussi, M., Franco,
G., et al. (2012). Serum levels of N-acetyl-aspartate in migraine
and tension-type headache. Journal of Headache and Pain, 13,
389–394. doi:10.1007/s10194-012-0448-3.
Decavel, C., & Vandenpol, A. N. (1990). GABA—A dominant
neurotransmitter in the hypothalamus. Journal of Comparative
Neurology, 302, 1019–1037. doi:10.1002/cne.903020423.
Denoroy, L., Parrot, S., Renaud, L., Renaud, B., & Zimmer, L.
(2008). In-capillary derivatization and capillary electrophoresis
separation of amino acid neurotransmitters from brain
Fig. 3 MSI datasets for TAHS-, CA-, and DPP-TFB-derivatives of amino metabolites after CSD in coronal brain sections from a wildtype
mouse. Asterisk indicates the CSD hemisphere. The metabolite dataset was recorded as in Fig. 2
30 Page 8 of 9 C. Esteve et al.
123
microdialysis samples. Journal of Chromatography A, 1205,
144–149. doi:10.1016/j.chroma.2008.07.043.
Fabricius, M., Jensen, L. H., & Lauritzen, M. (1993). Microdialysis of
interstitial amino-acids during spreading depression and anoxic
depolarization in rat neocortex. Brain Research, 612, 61–69.
doi:10.1016/0006-8993(93)91644-8.
Fujimura, Y., & Miura, D. (2014). MALDI mass spectrometry
imaging for visualizing in situ metabolism of endogenous
metabolites and dietary phytochemicals. Metabolites, 4,
319–346. doi:10.3390/metabo4020319.
Hirvonen, J., & Hietala, J. (2011). Dysfunctional brain networks and
genetic risk for schizophrenia: Specific neurotransmitter sys-
tems. CNS Neuroscience & Therapeutics, 17, 89–96. doi:10.
1111/j.1755-5949.2010.00223.x.
Jones, E. A., Shyti, R., van Zeijl, R. J. M., van Heiningen, S. H.,
Ferrari, M. D., Deelder, A. M., et al. (2012). Imaging mass
spectrometry to visualize biomolecule distributions in mouse
brain tissue following hemispheric cortical spreading depression.
Journal of Proteomics, 75, 5027–5035. doi:10.1016/j.jprot.2012.
06.025.
Klein, J. C., Eggers, C., Kalbe, E., Weisenbach, S., Hohmann, C.,
Vollmar, S., et al. (2010). Neurotransmitter changes in dementia
with Lewy bodies and Parkinson disease dementia in vivo.
Neurology, 74, 885–892.
Lanari, A., Amenta, F., Silvestrelli, G., Tomassoni, D., & Parnetti, L.
(2006). Neurotransmitter deficits in behavioural and psycholog-
ical symptoms of Alzheimer’s disease.Mechanisms of Ageing and
Development, 127, 158–165. doi:10.1016/j.mad.2005.09.016.
Lauritzen, M., Dreier, J. P., Fabricius, M., Hartings, J. A., Graf, R., &
Strong, A. J. (2011). Clinical relevance of cortical spreading
depression in neurological disorders: Migraine, malignant stroke,
subarachnoid and intracranial hemorrhage, and traumatic brain
injury. Journal of Cerebral Blood Flow and Metabolism, 31,
17–35. doi:10.1038/jcbfm.2010.191.
Lein, E. S., Hawrylycz, M. J., Ao, N., Ayres, M., Bensinger, A.,
Bernard, A., et al. (2007). Genome-wide atlas of gene expression
in the adult mouse brain. Nature, 445, 168–176. doi:10.1038/
nature05453.
Levy, L. M., & Degnan, A. J. (2013). GABA-based evaluation of
neurologic conditions: MR spectroscopy. American Journal of
Neuroradiology, 34, 259–265. doi:10.3174/ajnr.A2902.
Lowe, C. R. (2011). The future: Biomarkers, biosensors, neuroinfor-
matics, and e-neuropsychiatry. International Review of Neuro-
biology, 101, 375–400.
Manier, M. L., Reyzer, M. L., Goh, A., Dartois, V., Via, L. E., Barry,
C. E., et al. (2011). Reagent precoated targets for rapid in-tissue
derivatization of the anti-tuberculosis drug isoniazid followed by
MALDI imaging mass spectrometry. Journal of the American
Society for Mass Spectrometry, 22, 1409–1419. doi:10.1007/
s13361-011-0150-8.
Manier, M. L., Spraggins, J. M., Reyzer, M. L., Norris, J. L., &
Caprioli, R. M. (2014). A derivatization and validation strategy
for determining the spatial localization of endogenous amine
metabolites in tissues using MALDI imaging mass spectrometry.
Journal of Mass Spectrometry, 49, 665–673. doi:10.1002/jms.
3411.
McDonnell, L. A., & Heeren, R. M. A. (2007). Imaging mass
spectrometry. Mass Spectrometry Reviews, 26, 606–643. doi:10.
1002/mas.20124.
Mitani, H., Shirayama, Y., Yamada, T., & Kawahara, R. (2006).
Plasma levels of homovanillic acid, 5-hydroxyindoleacetic acid
and cortisol, and serotonin turnover in depressed patients.
Progress in Neuro-Psychopharmacology and Biological Psychi-
atry, 30, 531–534. doi:10.1016/j.pnpbp.2005.11.021.
Miura, D., Fujimura, Y., Yamato, M., Hyodo, F., Utsumi, H.,
Tachibana, H., et al. (2010). Ultrahighly sensitive in situ
metabolomic imaging for visualizing spatiotemporal metabolic
behaviors. Analytical Chemistry, 82, 9789–9796. doi:10.1021/
ac101998z.
Norris, J. L., & Caprioli, R. M. (2013). Analysis of tissue specimens
by matrix-assisted laser desorption/ionization imaging mass
spectrometry in biological and clinical research. Chemical
Reviews, 113, 2309–2342. doi:10.1021/cr3004295.
Ragginer, C., Lechner, A., Bernecker, C., Horejsi, R., Moeller, R.,
Wallner-Blazek, M., et al. (2012). Reduced urinary glutamate
levels are associated with the frequency of migraine attacks in
females. European Journal of Neurology, 19, 1146–1150.
doi:10.1111/j.1468-1331.2012.03693.x.
Rebane, R., Oldekop, M.-L., & Herodes, K. (2012). Comparison of
amino acid derivatization reagents for LC-ESI-MS analysis.
Introducing a novel phosphazene-based derivatization reagent.
Journal of Chromatography B-Analytical Technologies in the
Biomedical and Life Sciences, 904, 99–106. doi:10.1016/j.
jchromb.2012.07.029.
Shariatgorji, M., Nilsson, A., Goodwin, R. J. A., Kallback, P.,
Schintu, N., Zhang, X., et al. (2014). Direct targeted quantitative
molecular imaging of neurotransmitters in brain tissue sections.
Neuron, 84, 697–707. doi:10.1016/j.neuron.2014.10.011.
Shariatgorji, M., Nilsson, A., Kallback, P., Karlsson, O., Zhang, X.,
Svenningsson, P., et al. (2015). Pyrylium salts as reactive
matrices for MALDI-MS imaging of biologically active primary
amines. Journal of the American Society for Mass Spectrometry,.
doi:10.1007/s13361-015-1119-9.
Shimbo, K., Yahashi, A., Hirayama, K., Nakazawa, M., & Miyano, H.
(2009). Multifunctional and highly sensitive precolumn reagents
for amino acids in liquid chromatography/tandem mass spec-
trometry. Analytical Chemistry, 81, 5172–5179. doi:10.1021/
ac900470w.
Shyti, R., Eikermann-Haerter, K., van Heiningen, S. H., Meijer, O. C.,
Ayata, C., Joels, M., et al. (2015). Stress hormone corticosterone
enhances susceptibility to cortical spreading depression in
familial hemiplegic migraine type 1 mutant mice. Experimental
Neurology, 263, 214–220. doi:10.1016/j.expneurol.2014.10.015.
Somjen, G. G. (2001). Mechanisms of spreading depression and
hypoxic spreading depression-like depolarization. Physiological
Reviews, 81, 1065–1096.
Sugiura, Y., Honda, K., Kajimura, M., & Suematsu, M. (2014).
Visualization and quantification of cerebral metabolic fluxes of
glucose in awake mice. Proteomics, 14, 829–838. doi:10.1002/
pmic.201300047.
Sugiura, Y., Zaima, N., Setou, M., Ito, S., & Yao, I. (2012).
Visualization of acetylcholine distribution in central nervous
system tissue sections by tandem imaging mass spectrometry.
Analytical and Bioanalytical Chemistry, 403, 1851–1861.
doi:10.1007/s00216-012-5988-5.
Toue, S., Sugiura, Y., Kubo, A., Ohmura, M., Karakawa, S.,
Mizukoshi, T., et al. (2014). Microscopic imaging mass spec-
trometry assisted by on-tissue chemical derivatization for
visualizing multiple amino acids in human colon cancer
xenografts. Proteomics, 14, 810–819. doi:10.1002/pmic.
201300041.
Yoon, H.-R. (2013). Determination of plasma dibasic amino acids
following trimethylsilyl-trifluoroacyl derivatization using gas
chromatography-mass spectrometry. Archives of Pharmacal
Research, 36, 366–373. doi:10.1007/s12272-013-0038-1.
Zhang, M., Fang, C., & Smagin, G. (2014). Derivatization for the
simultaneous LC/MS quantification of multiple neurotransmit-
ters in extracellular fluid from rat brain microdialysis. Journal of
Pharmaceutical and Biomedical Analysis, 100, 357–364. doi:10.
1016/j.jpba.2014.08.015.
Mass spectrometry imaging of amino neurotransmitters: a comparison of derivatization methods… Page 9 of 9 30
123