Embed Size (px)
Citation preview

MASS SPECTROMETRY BASED TECHNIQUES FOR IN VIVO
NEUROCHEMICAL MONITORING
by
Peng Song
A dissertation submitted in partial fulfillment
of the requirements for the degree of
Doctor of Philosophy
(Chemistry)
in the University of Michigan
2012
Doctoral Committee:
Professor Robert T. Kennedy, Chair
Professor Philip C. Andrews
Professor Zhan Chen
Associate Professor Kristina I. Håkansson
© Peng Song
All Rights Reserved
2012

ii
To family and friends

iii
ACKNOWLEDGEMENTS
I am deeply grateful to my advisor, Professor Robert T. Kennedy, whose coaching and
support guided me through the 5 demanding years of PhD program. I would also like to
thank the Kennedy group members whom I was very fortunate to overlap or interact with,
for the sharing of their ideas, inspiring discussions, cordial friendship and valuable career
advice.
I acquired the bulk of my mass spectrometry knowledge from Professor Kristina
Håkansson’s Chem 647. It proved to be highly valuable for my later research. I was also
lucky enough to spend one semester in her group where I got exposure to the state of art
mass spectrometry research.
I thank Professor Zhan Chen very much for his kindness and confidence in me. He
provided valuable input which prompted me to think deeper on my research. What I
learned from his spectroscopy class laid a good foundation for my future industrial R&D
needs.
I would like to thank Professor Philip Andrews for his keen interest in my research,
insightful discussion and sharing his group’s expertise and equipment.
I would also like to express my appreciation to faculties and staff from different
departments and institutions of U of M who assisted me on various issues ranging from
visa application to computer support.
It was a privilege to become friends with so many wonderful people in Ann Arbor.
Although many have left to pursue different paths of life in other places and I will soon
embark on my own journey, the time spent together with them will always be a cherished
memory.
Last but not least, I want to thank my family, especially wife, the future Dr.Jing Nie, for
their unconditional love and support.

iv
TABLE OF CONTENTS
DEDICATION…………………………………………………………………………...ii
ACKNOWLEDEMENTS………………………………………………………………iii
LIST OF FIGURES………………………………………………………………….....vii
LIST OF TABLES……………………………………………………………………….x
LIST OF APPENDICES………………………………………………………………..xi
LIST OF ABBREVIATIONS………………………………………………………….xii
ABSTRACT…………………………………………………………………………….xiv
CHAPTER 1. INTRODUCTION……………………………………………………….1
Bio-analytical Mass Spectrometry………………………………………………………...1
In Vivo Neurochemical Monitoring……………………………………………………….4
Technologies for Dialysate Analysis……………………………………………………...9
Liquid Chromatography-Mass Spectrometry……………………………………………10
High Speed Liquid Chromatography…………………………………………………….12
Tandem Mass Spectrometry and Triple Quadrupole Mass Spectrometer……………….20
Dissertation Overview…………………………………………………………………...23
CHAPTER 2. COMPREHENSIVE CLASSICAL NEUROTRANSMITTER
ANALYSIS USING BENZOYLATION UHPLC-
MS………………………………………………………………………………………..26
Introduction…………………………………………………………………………..…..26
Experimental Section…………………………………………………………………….30

v
Result and Discussion……………………………………………………………………34
Conclusion……………………………………………………………………………….49
CHAPTER 3. A MASS SPECTROMETRY “SENSOR” FOR IN VIVO
ACETYLCHOLINE MONITORING WITH FIVE SECONDS TEMPORAL
RESOLUTION………………………………………………………………………….51
Introduction…………………………………………………………………………..…..51
Experimental Section…………………………………………………………………….53
Result and Discussion……………………………………………………………………58
Conclusion……………………………………………………………………………….70
CHAPTER 4. CAPILLARY UHPLC-MS FOR HIGH THROUGHPUT IN VIVO
MONITORING…………………………………………………………………………71
Introduction………………………………………………………………………………71
Experimental Section…………………………………………………………………….73
Result and Discussion……………………………………………………………………76
Conclusion……………………………………………………………………………….88
CHAPTER 5. FUTURE DIRECTIONS……………………………………………....89
Benzoylation of Neuropeptides…………………………………………………………..89
Acetylcholine Mass Spectrometry Sensor with Higher Temporal Resolution…………..91
Mass Spectrometry Sensor for Other Neurotransmitters………………………………...92
Quantitative Metabolomics Using C12/C13 Differential Benzoylation…………………93
APPENDICES…………………………………………………………………………..99
Droplet nanoLC Fraction Collection…………………………………………………….99
MALDI-TOF Amino Acids Analysis…………………………………………………..103
vi
LC-MS Method of Water Soluble Vitamin Analysis…………………………………..104
Common LC-MS Instrument Troubleshooting…………………………………………106
REFERENCES……………………………………………………………………...…108

vii
LIST OF FIGURES
Figure 1.1 Schematic of the electrospray ionization process……………………………...2
Figure 1.2 operating principle of quadrupole mass analyzer……………………………...3
Figure 1.3 Structure of neurons and neurotransmission…………………………………..5
Figure 1.4 Depiction of a concentric microdialysis probe………………………………...8
Figure 1.5 Dependence of temporal resolution and relative recovery on sampling flow
rate using 2 mm microdialysis probes…………………………………………………….9
Figure 1.6 Online LC-MS setup using ESI as the ionization source…………………….12
Figure 1.7 Hypothetical Van Deemter curves of 5-, 3-, 1 µm particles…………………15
Figure 1.8 Schematic of the cross-section of a fused-core particle...................................16
Figure 1.9 van Deemter plot for the five columns using naphthalene…………………...17
Figure 1.10 SEM-picture of the typical porous structure of monolithic silica columns…18
Figure 1.11 Effect of temperature on the reduction of viscosity for three different
effluents…………………………………………………………………………………..19
Figure 1.12 Plate height vs linear velocity at various temperatures for well-retained
solutes……………………………………………………………………………………19
Figure 1.13 MS/MS mode of QqQ mass spectrometers…………………………………22
Figure 2.1 Chemical structure of targeted neurotransmitters and metabolites and reaction
scheme of benzoylation using benzoyl chloride………………………………..………..29
Figure 2.2 Ion chromatogram for all 17 analytes………………………………………..34

viii
Figure 2.3 MS/MS spectra of benzoylated DA and 5-HT………………………………36
Figure 2.4 Peak area and peak area ratio of HVA and DA in a repeatedly analyzed
standard solution…………………………………………………………………………38
Figure 2.5 Mass chromatogram traces of neurotransmitters and metabolites detected in
vivo from rat nucleus accumbens………………………………………………………...40
Figure 2.6 Dual probe microdialysis of the mesolimbic pathway………………………47
Figure 2.7 Microdialysis in the mPFC…………………………………………………..49
Figure 3.1 Illustration of fluidic design for coupling microdialysis to segmented flow
ESI-MS…………………………………………………………………………………..55
Figure 3.2 Ion suppression of d4-acetylcholine by the inorganic salt in aCSF shown by
FIA coupled to ESI-MS/MS……………………………………………………………..59
Figure 3.3 Determination of interference of acetylcholine measurement using LC-ESI-
MS/MS…………………………………………………………………………………..60
Figure 3.4 Quantitative performance of droplet-microdialysis-ESI-MS acetylcholine
detection set up………………………………………………………………………..…62
Figure 3.5 Carryover at the ESI probe liquid connection characterized by infusing
discrete droplets………………………………………………………………………….64
Figure 3.6 Measurement of temporal resolution and comparison……………………….65
Figure 3.7 Recording of response to in vivo microinjection of neostigmine…………….67
Figure 3.8 Recording of in vivo response to a TTX microinjection……………………..70
Figure 4.1 Parallel comparison of four HPLC columns for gradient separation of 10
neurotransmitters…………………………………………………………………………82

ix
Figure 4.2 Comparison of peak width of early eluting GABA and late eluting DA under
different LC conditions…………………………………………………………………83
Figure 4.3 Chromatograms of 7 min gradient at 25 µL/min and 3.5 min gradient at 50
µL/min using HALO™ 500 µm X 10 cm column………………………………………84
Figure 4.4 Loss of concentration sensitivity of the 3.5 min capillary LC method compared
to the 7 min microbore LC method………………………………………………………85
Figure 4.5 Traces of detected neurochemicals from rat brain dialysate………………....87
Figure 5.1 Chromatographic traces of doubly benzoylated leu-enkaphalin and its MS/MS
spectrum………………………………………………………………………………….91
Figure 5.2 System for high temporal resolution sampling……………………………….92
Figure 5.3 Adenosine signal detected by mass spectrometry “sensor” in vivo…………..93
Figure 5.4 Workflow of metabolomics experiment using differential benzoylation and
parallel MS acquisition…………………………………………………………………..95
Figure 5.5 Experimental setup and data obtainable from online HPLC with QqQ in
parent ion scan mode…………………………………………………………………….96
Figure 5.6 Two step metabolomics MS experiment coupled by droplet LC fraction
collection…………………………………………………………………………………97

x
LIST OF TABLES
Table 2.1 MRM conditions of 17 benzoylated neurotransmitters and metabolites and
their internal standards…………………………………………………………………..37
Table 2.2 Figures of merit for benzoylation-HPLC-MS method………………………..39
Table 3.1 Analyte MRM conditions……………………………………………………..56
Table 4.1 LC conditions for different columns…………………………………………..74
Table 4.2 dMRM parameters for neurochemicals and their internal standard…………..76

xi
LIST OF APPENDICES
Appendix A: Droplet nanoLC Fraction Collection………………………………………99
Appendix B: MALDI-TOF Amino Acids Analysis……………………………………103
Appendix C: LC-MS Method of Water Soluble Vitamin Analysis……………………104
Appendix D: Common LC-MS Instrument Troubleshooting…………………………106

xii
LIST OF ABBREVIATIONS
3-MT 3-methoxyltyramine
5-HIAA 5-Hydroxyindoleacetic acid
5-HT serotonin
AA amino acid
ACh acetylcholine
ACN acetonitrile
aCSF artificial cerebrospinal fluid
Ado adenosine
Asp aspartate
Bz benzoyl group
BzCl benzoyl chloride
CE capillary electrophoresis
Ch choline
DA dopamine
DMSO dimethyl sulfoxide
Dns dansyl group
DnsCl dansyl chloride
DOPAC 3,4-Dihydroxyphenylacetic acid
ESI electrospray ionization
GABA gama aminobutyric acid
Glu glutamate
Gly glycine
HPLC high performance liquid chromatography
HVA Homovanillic acid
i.d. inner diameter
IS internal standard
LC liquid chromatography
LOD limit of detection
m/z mass to charge ratio
MALDI matrix assisted laser desorption
MD microdialysis

xiii
mPFC medial prefrontal cortex
MRM multiple reaction monitoring
MS mass spectrometry
MW molecular weight
NAc nucleus accumbens
NE norepinephrine
NM normetanephrine
o.d. outer diameter
PFD perfluorodecalin
QqQ triple quadrupole mass spectrometer
RSD relative standard deviation
Ser serine
STD standard deviation
Tau taurine
TOF time of flight
UHPLC ultrahigh pressure liquid chromatography

xiv
ABSTRACT
Neurotransmitter concentration in vivo reflects various behavioral and
pharmacological events. Therefore, the measurement of neurochemical dynamics in live
behaving animals’ brain is of crucial importance for the fundamental understanding of the
central nervous system and the development of therapies for neurological disorders.
Previously published neurochemical monitoring methods, although being capable
of measuring one or one class of neurotransmitters, fall short of truly multiplexed
neurochemical monitoring. We developed a liquid chromatography-tandem mass
spectrometry based assay of all commonly studied small molecule neurotransmitters,
detecting 17 neurotransmitters and metabolites sampled in vivo at basal level. Prior to
LC-MS analysis, amine and phenol containing analytes were benzoylated using benzoyl
chloride, significantly improving chromatographic separation and mass spectrometric
sensitivity. Additionally, stable isotope labeled internal standard was produced for each
analyte, by reacting with commercially available 13
C6 benzoyl chloride. The quantitative
performance was enhanced. It demonstrated the ability to work with high spatial (1 mm)
and high temporal resolution (1 min) monitoring.
A benzoylation UHPLC-MS method was further developed into a faster and
scaled down version. A two-fold improvement in throughput and four-fold reduction in
sample consumption was achieved using a capillary column packed with high efficiency

xv
particles. It was suitable for high temporal resolution monitoring with conventional
microdialysis sampling.
For the neurotransmitter, acetylcholine, in vivo monitoring, high temporal
resolution and high sensitivity are strongly desired due to its low basal levels and rapid
changes during neuroexcitation such as behavioral activation. Current technologies do
not meet these specific characteristics well. Electrochemical sensors have high temporal
resolution but lack sensitivity while the opposite holds true for HPLC based methods. We
developed an online acetylcholine monitoring method using segmented flow
microdialysis - mass spectrometry. This novel acetylcholine “sensor” combines 5 s
temporal resolution with 5 nM detection limit capable of detecting basal levels.
Additionally, other analytes such as choline and the acetylcholine esterase inhibitor,
neostigmine can both be detected simultaneously, demonstrating the versatility of mass
spectrometry for detection. Tested in vivo, this setup captured both acetylcholine increase
in response to acetylcholine esterase inhibition and decrease due to neuronal inhibition by
tetradotoxin.

1
CHAPTER 1
INTRODUCTION
Bioanalytical Mass Spectrometry
Mass spectrometry is one of the fastest growing fields in analytical science today.
Its rapid development is to a large extent fueled by its broad application in bio-analysis,
with increasingly high resolution and more varieties of tandem MS capabilities, mass
spectrometry proves to be an invaluable tool for elucidating structures and determining
the quantities of bio-molecules. In areas such as proteomics, metabolomics, lipidomics,
and glycomics, mass spectrometry has become the central tool1-3
.
Mass spectrometry did not see large scale biological application until successful
development of “soft” ionization methods such as electrospray ionization (ESI) and
matrix assisted laser desorption ionization (MALDI) in the late 1980s. Previous
ionization methods such as electron impact (EI) ionization tend to break the covalent
bond of bio-molecules, causing extensive fragmentation which complicates data
interpretation. “Soft” ionization techniques are able to convert bio-molecules from
condensed phase to charged gas phase ions without breaking the intra-molecular
chemical bonds. In some cases, even non-covalent inter-molecular interactions can be
preserved while bio-molecules go through soft ionization processes. Compared to

2
MALDI, ESI is a continuous ionization method and is easier to couple with online
purification methods such as chromatography and capillary electrophoresis. In the ESI
process, as analytes pass through the spray needle, excess charge is created by the high
voltage applied at the needle. A Taylor cone is formed as the result of solvent surface
tension and the electric field. Charged liquid droplets coming off the tip of the Taylor
cone fly towards the mass spectrometer’s inlet which is the counter electrode in the
closed circuit. Meanwhile, droplets shrink in size as solvent evaporates with the
assistance of heat and gas. They split into smaller droplets as the Coulomb repulsion
exceeds solvent surface tension. Eventually, charged droplets become gas phase ions
without solvent molecules and some ions are sampled into the mass spectrometer (Figure
1.1). Commonly studied molecules in biology such as nucleotides, proteins, peptides, and
a large number of metabolites can be readily ionized through ESI.
Figure 1.1 Schematic of the electrospray ionization process4. Reproduced with
permission from John Wiley and Sons.

3
Although all mass spectrometers measure m/z of gas phase ions, their mass
analyzers operate according to different physical principles, which determines the
instruments’ strengths and weaknesses5. The quadrupole mass analyzer is made of 4
parallel rods arranged as shown in Figure 1.2. DC voltage (U) superimposed with AC (V
cos ωt) voltage is applied on the conductive rods. At a given U, V and ω, only ions of
certain m/z will have stable trajectories in the resulting electric field. Ions with unstable
trajectory will not make it through the analyzers and are unable to reach the detector.
Quadrupole mass analyzers generate mass spectra by varying the electric parameters over
time to allow ions of different m/z values to reach the detector. They are simple and
robust but have low mass resolution (usually unit mass resolution) and limited m/z range
(usually a few thousand). However, performance can be improved by coupling with
additional mass analyzers in tandem and using multistage mass filtration, such as in triple
quadrupole and Q-TOF mass spectrometers.
Figure 1.2 Operating principle of quadrupole mass analyzer. Ions with stable trajectory
(red) will make through the analyzer while ions with unstable trajectory (blue) will not
make to the detector.
+
+
-
-
+(U-V cosωt) -(U-V cos ωt)x
zy
source
ion optics
quadrupoledetector

4
In this dissertation, we describe several methods using ESI-triple quadrupole mass
spectrometers coupled with different separation and sample manipulation techniques for
continuous monitoring of neurochemical changes in the brains of live animals, and
demonstrate the versatility, robustness, sensitivity and selectivity of using mass
spectrometry for neurochemical analysis.
In Vivo Neurochemical Monitoring
Neurotransmitters are key components controlling nervous system function. Upon
stimulation, neurons release pre-packaged neurotransmitters into the synapse. Some
neurotransmitters subsequently bind to receptors located on the membrane of post
synaptic neurons, inducing responses that promote or inhibit the post synaptic neuron’s
action potential. Neurotransmitters not binding with receptors are metabolized by
extracellular enzymes or recycled by pre-synaptic neurons. Some neurotransmitters also
bind to autoreceptors on the pre-synaptic membrane, becoming part of the feedback
control mechanism6 (Figure 1.3). Being involved in all kinds of brain functions and
activities, the extracellular level of neurotransmitters and their metabolites reflects these
events, providing clues for understanding the overall neuronal circuits and revealing the
molecular basis of these processes. However, current analytical tools are not capable of
measuring neurochemicals directly from the 20-50 nm wide6 synaptic cleft of intact
brains. Instead, existing technologies detect neurochemicals spilling over from the
synaptic cleft into larger brain extracellular space. On one hand, it provides an averaged
view of the multiple neurons’ activity in that particular brain area, on the other hand,
neurotransmitters diffusing out potentially affect other neurons and this extra-synaptic
transmission is called volume transmission. Nevertheless, the measurement of extra-

5
synaptic neurochemicals provides invaluable information that allows scientists to gain
substantial insight of the nervous system and facilitates the development of therapies for
neurological disorders7.
Figure 1.3 Structure of neurons and neurotransmission. (a) Neuronal structure and
synaptic features. Dendrites collect chemical input from neighboring neurons, which
influences the membrane potential of the neuron. Once the threshold membrane potential
is reached, an action potential is generated and travels from the cell body down the axon
toward the terminal boutons. Myelin ensheathment of neurons increases the speed of
action potential propagation. (b) Neurotransmission at synapses. Neurotransmitters
diffuse across the synapse to interact with and bind to receptors on the postsynaptic
neuron. If a neurotransmitter binds to an autoreceptor on the presynaptic neuron, a

6
negative feedback loop is initiated to inhibit further release. Signaling is terminated via
enzyme degradation or reuptake into the presynaptic terminal by transporters. Other
supportive neuronal cells such as glia can also release and take up neurotransmitters7.
Reproduced with permission from Annual Reviews.
Temporal and spatial resolution are two challenges for continuous monitoring of
neurochemicals in live brains. Neurochemical events occur on vastly different time scales.
Exocytosis and re-uptake processes happen at the millisecond levels, while sustained
changes induced by pharmacological activation may last hours. Ideally the monitoring
techniques will have adequate temporal resolution to be able to capture concentration
dynamics across all time scales8.
The brain is a highly heterogeneous organ. Brain regions 1 mm apart may perform
entirely different functions. It is imperative for the analytical methods to be able to
discern such small spatial differences, especially when small model animals such as mice
and rats are used for in vivo studies. Electrochemical sensors represent an important class
of in vivo monitoring tools and electrodes can have high temporal resolution thanks to the
fast readout of electrical signals (millisecond level) and high spatial resolution due to the
advancement of modern material science and manufacturing technologies. However, bare
electrodes can only detect electrochemically active neurochemicals, such as the
monoamines and some of their metabolites. For the non-electrochemically active species,
catalytic enzymes are coated on the electrode surface to convert such analytes into redox
products such as H2O2. One electrochemical sensor typically detects only one analyte.
Microelectrode arrays allow multiplexed detection but at the expense of spatial resolution
and are still far from exhaustive, in addition to other hurdles. Another disadvantage of
using electrochemical sensors is their high background signal due to the presence of
interferences. Endogenous redox species such as ascorbic acid and H2O2 are present in
7
the brain, and the lack of chemical separation comprises the specificity. In many cases,
basal levels of neurochemicals cannot be reliably determined.
The major competing technologies to electrochemical sensors are sampling
techniques such as microdialysis and low flow push-pull perfusion. After neurochemicals
are collected from the brain, a myriad of analytical tools can be employed, offering more
sensitivity and flexibility in determining the sample’s chemical content. Microdialysis is
the most prevalent in vivo sampling method. The key element of this technique is the
microdialysis probe (Figure 1.4). After implantation in the brain, artificial saline solution
is perfused through. The tip of the microdialysis probe is made of a piece of semi
permeable membrane, which allows free diffusion of small molecules and ions. Bigger
molecules, such as proteins and poly nucleotides are blocked from entering the probe.
Because the neurochemical concentration is higher in the brain than within the probe, the
chemical gradients drive the endogenous small molecules through the membrane into the
probe. Continuously infusing saline solution then carries the collected analytes from the
brain for analysis. The sample, called dialysate or microdialysate is either analyzed online
by a fast analytical method, or more commonly, collected as temporally resolved
fractions and analyzed offline, usually by slower but more powerful techniques.

8
Figure 1.4 Depiction of a concentric microdialysis probe7. Reproduced with permission
from Annual Reviews.
Using microdialysis coupled with online fast capillary electrophoresis system, a
temporal resolution of ~ 10 s has been previously achieved for Glu and Asp monitoring9.
Offline analysis allowed more flexibility. For example, using segmented flow
microdialysis integrated with microfluidic CE system, temporal resolution as high as 2 s
could be attained10
. In another example, offline analysis permitted the use of a slower
capillary HPLC method, but all amino acid neurotransmitters could be detected at 10 s
temporal resolution11
.
Microdialysis is not an exhaustive sampling method. Its recovery depends on the
analytes’ property, membrane type and length, flow rate and in vivo environment. It
typically has 0.5-3 mm of active membrane lengths, operate at 0.5-2 µL/min flow rate
range. Longer membrane improves the recovery of analytes, but compromises the spatial
resolution. Lower flow rate enhances relative recovery but decreases sample volume
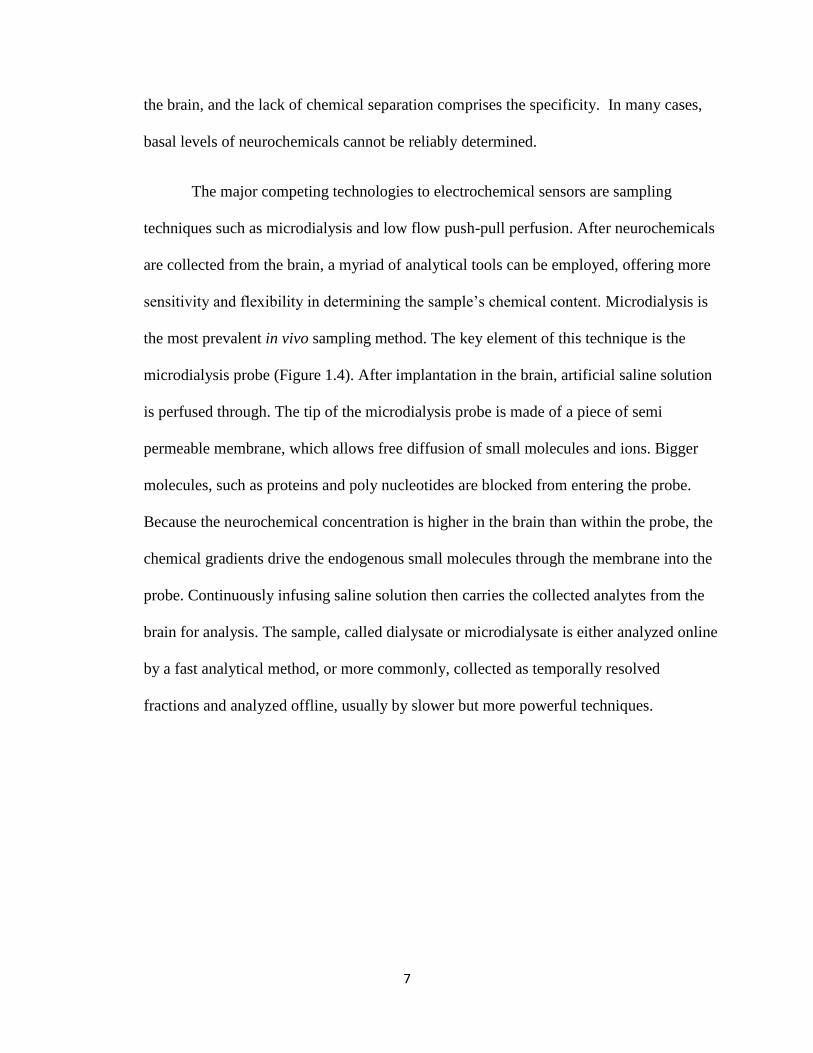
available for analysis and causes more mixing, also sacrificing temporal resolution10
(Figure 1.5).
9
Figure 1.5 Dependence of temporal resolution and relative recovery on sampling flow
rate using 2 mm microdialysis probes10
. Reproduced with permission from Elsevier.
Technologies for Dialysate Analysis
HPLC based methods are popular for dialysate analysis. High sensitivity
electrochemical (EC), fluorescence, and mass spectrometric detectors are typically used
because of the low analyte concentration in dialysate. HPLC-EC methods have been the
workhorse of monoamine neurotransmitter analysis for decades. Due to the intrinsic
chemical structures of DA, NE, 5-HT and some of their metabolites, they can be easily
oxidized and generate current on the electrode surface12
.
Amino acid neurotransmitters are routinely detected using fluorescence detectors.
Amino acids do not produce strong intrinsic fluorescence, so a fluorescent tag is linked to
their amine functional group prior HPLC separation. The pre-column derivatization
serves two purposes. In addition to enhanced fluorescent signal, the label also increases
hydrophobicity of highly hydrophilic amino acid neurotransmitters, facilitating reversed-
phase LC separation.

10
Besides HPLC, capillary electrophoresis (CE) methods have seen wide
application in brain dialysate analysis. Compared to HPLC, CE methods are usually
much faster, resolving neurotransmitters in seconds rather than in minutes at high
separation efficiency. Meanwhile, sample consumption in CE is minute compared to
HPLC. These features are highly advantageous for high temporal resolution monitoring,
which produces large numbers of low volume samples. With the addition of chiral
selection agents like cyclodextrin, chiral separation can be achieved on CE. This is of
special interest because D and L amino acids perform distinct biological functions and
the ability to resolve them provides deeper insight of their respective roles13
. The bulk of
CE methods applied in neuroscience use laser induced fluorescence (LIF) due to its good
sensitivity (low nM detection limit) and ease of implementation. The majority of CE-LIF
methods have been used for analyzing amino acid neurotransmitters because of their
relatively higher in vivo level. The much lower monoamine levels demand higher peak
capacity to separate the interferences14
.
Immuno- and enzymatic assays have also been used to monitor chemicals in the
brain, such as glucose, glutamate, and neuropeptides. These assays can be miniaturized
and automated, and are therefore adaptable to be used on microfluidic devices with the
goal of lower sample and reagent consumption, higher throughput and better temporal
resolution15
. Neuropeptides have traditionally been analyzed by enzyme or radio
immunoassays12
. Cross reactivity sometimes compromises the specificity in complex
dialysate samples. Radio immunoassay also poses a potential safety hazard and suitable
enzymatic or immuno assays have yet to be developed for some neurochemicals.
Liquid Chromatography- Mass Spectrometry
11
Today, the hyphenated technology of liquid chromatography and mass
spectrometry is one of the most preferred analysis formats for complex biological
samples. There have been a number of LC-MS methods dedicated for neurochemical
measurement16-19
. The mass spectrometer is a powerful LC detector, being relatively
universal and providing additional information regarding the analytes’ molecular
structure (Figure 1.6). On the other hand, LC separation prior to MS is also a prerequisite
for obtaining high quality mass spectra from complex biological samples. Most LC-MS is
coupled via ESI as the ionization method and it has long been observed that ESI is highly
susceptible to matrix effect20
. Co-ionizing species in the sample matrix suppress or
enhance ionization efficiency of analytes. For biological samples, high concentrations of
salt results in severe signal suppression of bio-molecules. The LC step removes inorganic
salt and separates other matrix components, partially alleviating the matrix effect20, 21
. At
its current stage of development, the resolving power of HPLC is still not adequate for
completely separating all matrix components in biological samples and co-elution will
still occur. The gold standard of correcting for remaining matrix effect and intrinsic
ionization efficiency in LC-MS is through the use of stable isotope labeled internal
standards.Chapter 2 and Chapter 4 describe the development of LC-MS methods for
comprehensive neurochemical analysis. These methods employ stable isotope internal
standard for every analyte, thus overcoming the Achilles Heel of LC-MS quantification.

12
Figure 1.6 Online LC-MS setup using ESI as the ionization source.
High Speed Liquid Chromatography
In vivo monitoring experiments generate large numbers of samples. A single
experiment can produce well over 100 samples per day. The requirement for analytical
throughput and robustness is high, but conventional HPLC methods typically take 20 - 30
min per sample, significantly limiting analysis throughput.
In this work, we examined use of high-speed HPLC to the separate all classical
neurotransmitters. Such work involved careful consideration of LC parameters such as
gradient time, flow rate, column and particle size for the best balance of separation
efficiency and analysis time.
+
-
H.V.
power
supplym/z
Time
HPLC column Mass spectrometer
ESI
chromatogram
mass spectrum
MS inlet
LC effluent

13
Separation efficiency is often evaluated using plate height H, which is governed
by the Van Deemter equation. It shows the relationship between separation efficiency and
linear velocity u.
H= A + B/u + Cu (Equation 1.1)
A is the term for Eddy diffusion, band broadening caused by different flow path in
the column for analyte molecules. B is the term for longitudinal diffusion, band
broadening caused by analyte molecules’ diffusion in the longitudinal direction of the
column. C is the term for resistance to mass transfer, band broadening due to the non-
instantaneous equilibrium of analyte distribution between the stationary phase and mobile
phase and between the stagnant intra-particle mobile phase and moving interstitial mobile
phase.
High speed HPLC uses high linear velocity to drive separations faster. As the
linear velocity increases, the plate height increases due to resistance to mass transfer (C
term), leading to the loss of separation efficiency23
. So the key for fast HPLC is to
improve the mass transfer term so efficiency does not suffer excessively at high velocity.
Several technologies are available to mitigate the adverse effect of the mass transfer limit
at fast HPLC conditions.
Ultrahigh Pressure Liquid Chromatography
One way for improving LC efficiency at high velocity is to use smaller totally
porous particles for packed columns. The mobile phase mass transfer resistance (between
stagnant intra-particle mobile phase and moving the interstitial mobile phase) decreases
proportionally to the square of particle size. Additionally, A term also drops

14
proportionally to the particle diameter. The advantages of using smaller particles for high
speed separation are twofold: the optimum velocity is higher and the loss of efficiency is
less at higher velocities (Figure 1.7). The drawback of this approach is that column
backpressure is inversely proportional to the square of particle diameter. Going from 3
µm particles to 1.7 µm particles triples the column back pressure at the same flow rate.
For fast separation, the back pressure of sub 2 micron particle columns easily exceed the
6000 psi limit of conventional HPLC instruments. So separation using this type of
chromatographic media is often referred to as Ultrahigh Pressure Liquid Chromatography
(UHPLC). The high operating pressure also exacerbates frictional heating. This
phenomenon causes uneven radial and longitudinal heat distribution in the column. While
the longitudinal thermal gradient tends not to harm the column efficiency, the radial one
does. In this respect, narrow bore and capillary columns are more preferable due to their
better heat dissipation24
. Chapter 2 describes a UHPLC method for comprehensive high
throughput analysis of all classical neurotransmitters. Operating at 8000 psi, 17 analytes
of a large range of polarity are resolved within 8 min.

15
Figure 1.7 Hypothetical van Deemter curves of 5-, 3-, 1 µm particles24
. Reproduced with
permission from Annual Reviews.
Core-shell particles
Another approach to achieve fast and efficient LC separation is use of fused core
particles with porous outer layer and solid inner core (Figure 1.8). The principle for high
efficiency of such particles is similar to that of the sub 2 micron UHPLC particles, which
lies in the shortened diffusion distance of analyte in the stagnant mobile phase, resulting
in a smaller C term (Figure 1.9). The backpressure created by core-shell particles is much
less than the totally porous counter sub 2 micron particles due to its bigger total size.
Modern HPLC instruments are capable of operating columns packed with such particles
for high throughput applications. In addition, the thermal conductivity of fused core
particles is higher so the detrimental radial heating effect is reduced. Moreover, the size
distribution of fused core particles is narrower, resulting in more uniform particles which

16
in turn facilitate homogenous packing leading to a smaller A term25
. The disadvantage of
this technology is the reduced loading capacity. The smaller surface areas of fused core
particles resulted in more than 2 fold reduction in sample loading capacity26
. Chapter 4
explores fused core particles for improved analysis throughput and successfully halves
the analysis time of the UHPLC method described in Chapter 2.
Figure 1.8 Schematic of the cross-section of a fused-core particle. Adapted from
www.advanced-materials-tech.com.
17
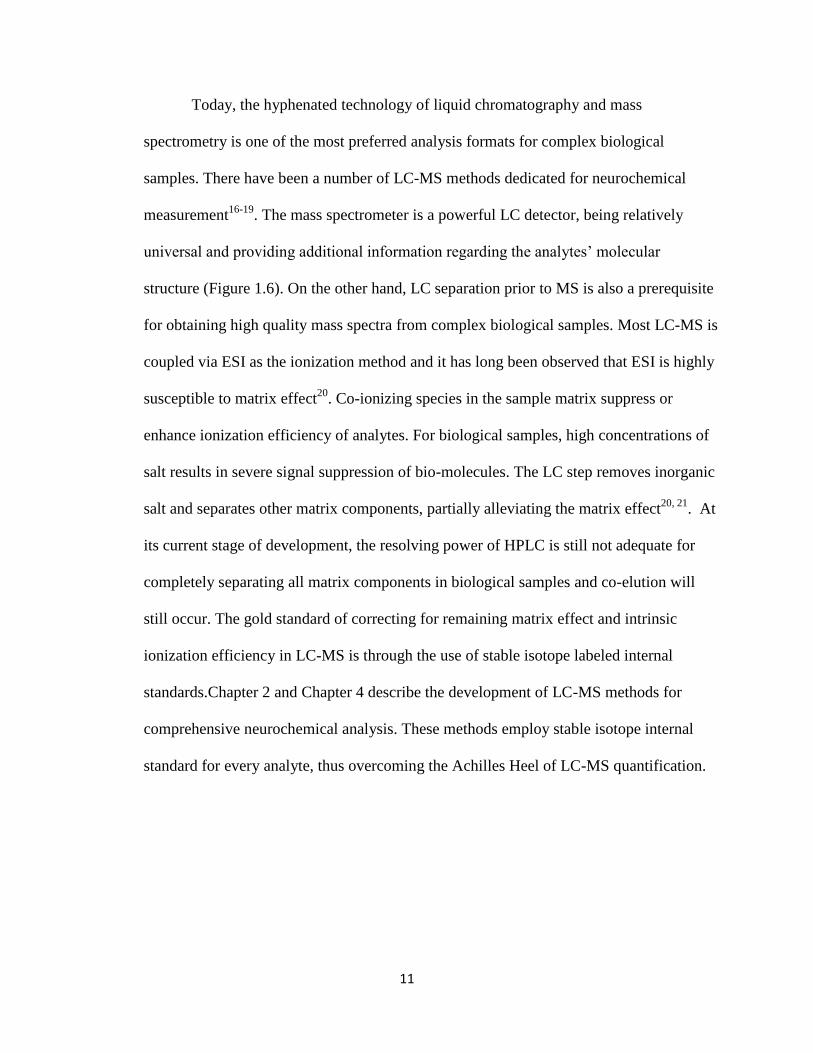
Figure 1.9 van Deemter plot for the five columns using naphthalene. The mobile phase
was 50:50 ACN:water. Columns tested were 1) Waters Acquity BEH C18, 2.1 X 100 mm,
1.7 µm; 2) Agilent Zorbax Extended-C18, 2.1 X 100 mm, 1.8 µm; 3) Thermo Hypersil
Gold, 2.1 X 100 mm, 1.9 µm; 4) Halo C18, 2.1 X 100 mm, 2.7 µm; 5) Supelco Ascentis
Express C18, 2.1 X 100 mm, 2.7 µm27
. Reproduced with permission from Wiley and Sons.
Monolith Column
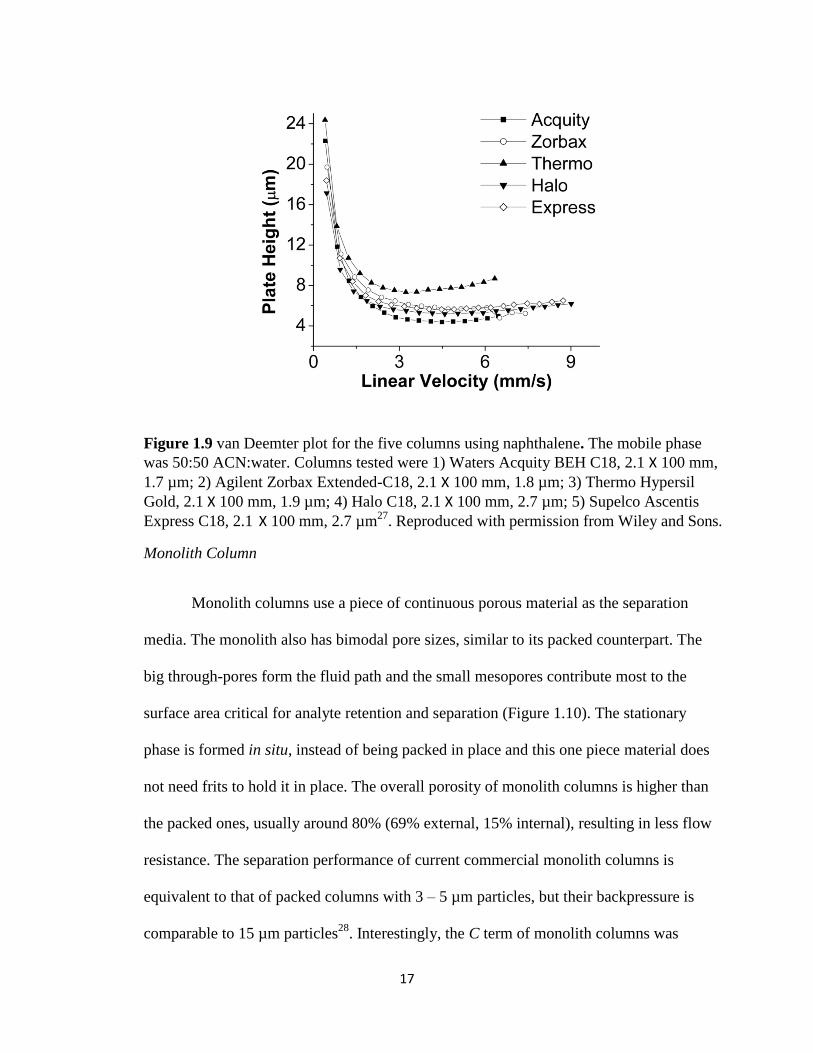
Monolith columns use a piece of continuous porous material as the separation
media. The monolith also has bimodal pore sizes, similar to its packed counterpart. The
big through-pores form the fluid path and the small mesopores contribute most to the
surface area critical for analyte retention and separation (Figure 1.10). The stationary
phase is formed in situ, instead of being packed in place and this one piece material does
not need frits to hold it in place. The overall porosity of monolith columns is higher than
the packed ones, usually around 80% (69% external, 15% internal), resulting in less flow
resistance. The separation performance of current commercial monolith columns is
equivalent to that of packed columns with 3 – 5 µm particles, but their backpressure is
comparable to 15 µm particles28
. Interestingly, the C term of monolith columns was

18
repeatedly demonstrated to be smaller than their packed counterparts29
. These findings
support the notion that monolith columns possess faster mass transfer rates than packed
columns. With the high permeability and fast mass transfer, monolith columns are
suitable for fast LC separations. Unfortunately, only a few monolithic columns are
currently commercially available (Merck Chromolith Phenomenex Onyx, and Dionex
Pepswift) with limited options regarding column chemistry and size. This option was not
explored in this dissertation.
Figure 1.10 SEM-picture of the typical porous structure of monolithic silica columns30
.
Reproduced with permission from Wiley and Sons.
High temperature
Using elevated temperature is another way of achieving fast LC separation.
Higher temperature reduces mobile phase viscosity, permitting the use of higher flow rate
without exceeding the pressure limit (Figure 1.11)31
.

19
Figure 1.11 Effect of temperature on the reduction of viscosity for three different
effluents31
. Reproduced with permission from Elsevier.
At the same time, higher temperature also improves the rate of stationary phase
and stagnant mobile phase mass transfer, resulting in a significantly smaller C terms
(Figure 1.12)32
.
Figure 1.12 Plate height vs linear velocity at various temperatures for well-retained
solutes. Δ, 25 °C (decanophenone, k’= 12.2); ,80 °C (dodecanophenone, k’ = 7.39); □,
120 °C (tetradecanophenone, k’= 12.3); ○, 150°C (tetradecanophenone, k’= 7.00)33
.
Reproduced with permission from ACS.

20
In addition to reduced flow impedance and enhanced mass transfer, high
temperature also decreases the retention of analytes on reversed phase columns. The
effect of 4-5 oC increase in temperature roughly equals that of 1% increase in organic
modifier for neutral compounds in RPLC31
. In some cases, 100% water could be used as
the sole mobile phase for separation under high temperatures, making HPLC “greener”
by avoiding use of expensive and toxic organic modifiers. High temperature LC has not
yet seen extensive applications due to several reasons. In addition to requirement for the
temperature control element such as column heater, solvent pre-heater, solvent cooler,
many analytes and most column stationary phase are not stable under high temperatures34
.
The few commercially available stationary phases that are capable of withstanding > 100
oC temperature include organic-silica hybrid (Waters BEH columns) and zirconia based
columns (ZirChrom).
Tandem Mass Spectrometry and Triple Quadrupole Mass Spectrometer
Tandem mass spectrometry makes multi stage m/z measurements of selected
analyte ions. When soft ionization is used, tandem MS first determines the m/z of
molecular ions (parent ions), then fragments them into smaller pieces and analyzes the
m/z of the fragment ions (daughter ions). This extra step provides more insight in the
molecular structure, and adds an extra level of selectivity. The most commonly used
tandem MS method is collision activated dissociation (CAD). It breaks up parent ions by
colliding them with inert gas molecules. This technique usually breaks the labile covalent
bonds with high efficiency. Novel tandem MS techniques such as electron capture
dissociation (ECD), electron transfer dissociation (ETD), and negative ion electron
capture dissociation (niECD) are capable of preserving labile functionalities, providing

21
additional, sometimes crucial information regarding parent ion’s structure. Our study
focused on quantitative analysis of known compounds, so the fragmentation with the
highest yield, CAD, was used to achieve maximum sensitivity.
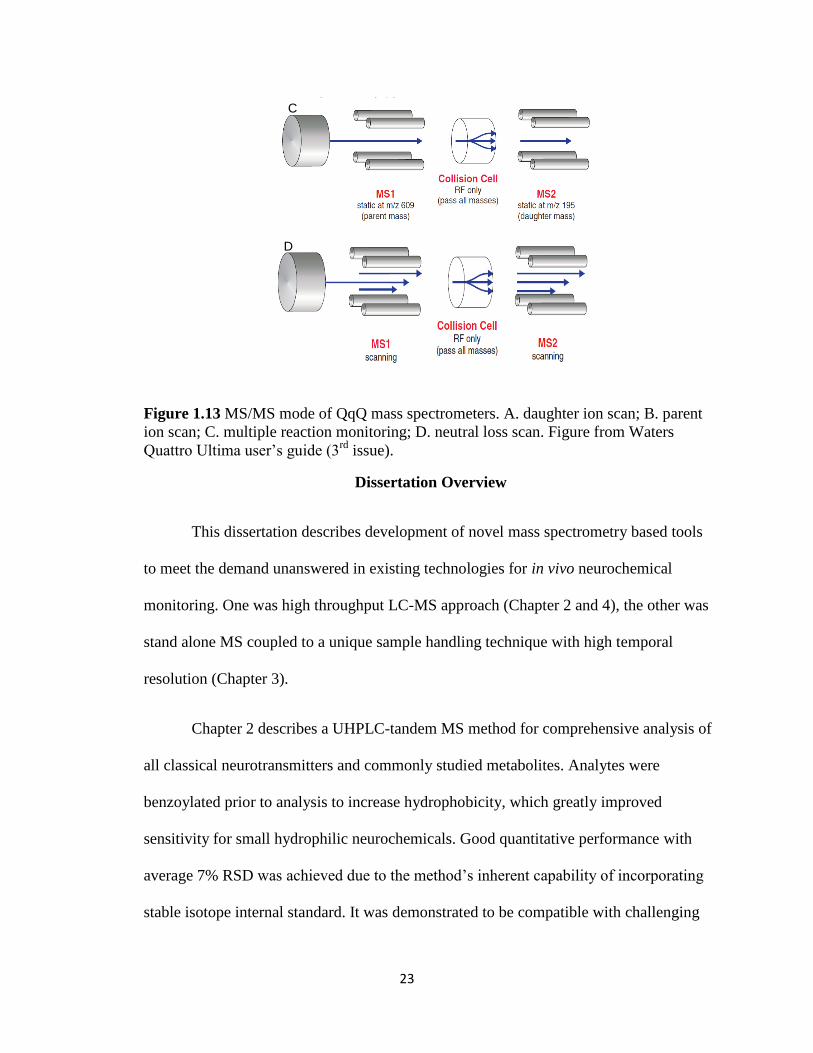
Triple quadrupole mass spectrometers (QqQ) are generally considered the most
suitable instrument for targeted analysis. As its name indicates, the QqQ instrument
consists of three quadrupoles, or more exactly, two quadrupole mass analyzers and a
quadrupole ( hexpole in many cases) collision cell. Ions selected in the first quadrupole
collide with inert gas molecules in the collision cell and fragment into smaller pieces. The
fragment ions then enter the second analyzer. There are several operating modes for the
QqQ. MS1 utilizes only one of the two mass analyzers, either in full scan mode or dwells
on a particular m/z. MS/MS mode requires the two mass analyzers to work in
coordination. In daughter (product) ion scan mode, the first analyzer passes known parent
ions of certain m/z. The collision cell fragments these ions and let all fragments to pass to
the second mass analyzer where the daughter ions are scanned (Figure 1.13 A). The
parent (precursor) ion scan mode is opposite of daughter ion scan mode. Here the second
analyzer fixes on a certain daughter ion while the first analyzer scans all possible parent
ions (Figure 1.13 B). The multiple reaction monitoring (MRM) is a unique mode of
operation that makes the QqQ top choice for targeted analysis. In this mode, both mass
analyzers dwell on specific m/z s. The first analyzer passes only certain parent ions while
the second analyzer lets through only the corresponding daughter ions (Figure 1.13 C).
Although fewer ions reach the detector, the dual filtering of both parent and daughter
ions significantly reduces the noise. There are usually gains in signal to noise ratio which
explains the higher sensitivity of MRM. Dwelling on ion pairs rather than scanning over

22
a certain range, MRM also has fast duty cycle, a feature important for online coupling
with high efficiency separations. Another unique operating mode is the neutral loss scan.
Certain molecules, when going through the CAD process, lose mass corresponding to a
neutral molecule such as H2O or CO2. Neutral loss mode scans parent/daughter ion pairs
at a constant m/z offset, the value of which is the molecular weight of the neutral
molecule (Figure 1.13 D). For loss of water, the offset is 18.
For mass spectrometric detection of low level neurochemicals from large number
of samples, both high sensitivity and fast readout are needed. All work described in this
dissertation used MRM mode of QqQ to meet such demands.
A
B
23
Figure 1.13 MS/MS mode of QqQ mass spectrometers. A. daughter ion scan; B. parent
ion scan; C. multiple reaction monitoring; D. neutral loss scan. Figure from Waters
Quattro Ultima user’s guide (3rd
issue).
Dissertation Overview
This dissertation describes development of novel mass spectrometry based tools
to meet the demand unanswered in existing technologies for in vivo neurochemical
monitoring. One was high throughput LC-MS approach (Chapter 2 and 4), the other was
stand alone MS coupled to a unique sample handling technique with high temporal
resolution (Chapter 3).
Chapter 2 describes a UHPLC-tandem MS method for comprehensive analysis of
all classical neurotransmitters and commonly studied metabolites. Analytes were
benzoylated prior to analysis to increase hydrophobicity, which greatly improved
sensitivity for small hydrophilic neurochemicals. Good quantitative performance with
average 7% RSD was achieved due to the method’s inherent capability of incorporating
stable isotope internal standard. It was demonstrated to be compatible with challenging
C
D

24
microdialysis sampling at high temporal and spatial resolution. With 17 analytes resolved
in 8 min, this method was the highest throughput among all HPLC methodologies
dedicated to comprehensive in vivo neurochemical monitoring.
Chapter 3 demonstrates the possibility of using only mass spectrometry to
monitor low level neurotransmitter acetylcholine. An elaborate sample handling and
introduction system was designed using segmented flow microdialysis with the goal of
reducing sample dispersion during transport. After careful optimization of sample
treatment, plumbing and detection parameters, this unique microdialysis-mass
spectrometry system was capable of online monitoring of acetylcholine together with
other molecules at 5 second temporal resolution. This mass spectrometry acetylcholine
“sensor” was on par with existing electrochemical sensors, but excelled in sensitivity and
multiplexed analyte capability.
Chapter 4 examines the feasibility of increasing the speed of the UHPLC-MS
analysis described in Chapter 2 by capillary UHPLC-MS. Operating a capillary column
packed with high efficiency fused core particles at very high linear velocity, a twofold
improvement in throughput was achieved with adequate chromatographic resolution.
Sample consumption was reduced to 0.5 µL and mobile phase consumption was also
decreased four fold. The compromises in other areas under fast LC conditions is
discussed and the causes are examined and proposals for further improvement are
presented.
Chapter 5 discusses new possibilities originating from the knowledge and
experience gained from previous method development. Preliminary data suggests the

25
feasibility of adding neuropeptides to the portfolio of the benzoylation UHPLC-MS
method. The mass spectrometry “sensor” approach could be expanded to include more
neurotransmitters and achieve higher temporal resolution using alternative sampling
technique. The benzoylation reaction can be adapted to quantitative metabolomics due to
the availability of stable isotope labeled reagent. A unique experimental setup using
online LC-MS and segmented flow fraction collection is proposed for quantitative amine
and phenol containing biomarker discovery.

26
CHAPTER 2.
COMPREHENSIVE CLASSICAL NEUROTRANSMITTER ANALYSIS USING
BENZOYLATION UHPLC-MS
Reproduced in part from (Song, Mabrouk et al. 2012). Copyright 2012 American Chemical Society
Introduction
Monitoring neurotransmitter concentration dynamics in the living brain is a
critically important tool in neuroscience. In vivo measurements enable study of the
relationship between neurotransmitter concentrations in relevant brain nuclei and
behavior, drug effects, or disease states. Since its inception, microdialysis sampling has
been the preeminent tool for making such measurements 35-37
. In this approach, a semi-
permeable membrane probe is inserted into the brain and perfused with artificial cerebral
spinal fluid (aCSF). Molecules in the extracellular space diffuse across the membrane
according to their concentration gradient and are collected into fractions which are
analyzed for neurotransmitter or metabolite content. This tool has been invaluable for
neuroscience, e.g. it has been used to demonstrate that all drugs of abuse activate the
mesolimbic dopamine (DA) system 38
, glutamate (Glu) sustains drug seeking behavior 39,
40,and adenosine (Ado) is a modulator of sleep
41. The technique is also used clinically for

27
studying epilepsy 42
and brain trauma 43, 44
and plays a prominent role in the
pharmaceutical industry when screening novel neurological and psychiatric therapeutics.
A key to using microdialysis is analysis of sample fractions 12
. Many assays for
neurotransmitters have been developed using high performance liquid chromatography
(HPLC)-electrochemical detection 45, 46
, HPLC-fluorescence detection 47
, capillary
electrophoresis-laser induced fluorescence 48, 49
, immunoassay50
and more recently,
HPLC-mass spectrometry (MS) 18, 19, 51
. Despite extensive research into methods for
chemical analysis of dialysate, all methods presently in use can only determine a subset
of common small molecule neurotransmitters. Therefore, studies that require monitoring
different types of neurotransmitters must use multiple assays which increases costs and
time required for equipment maintenance, method development and analysis. Use of
multiple assays also increases sample volume requirements and animal usage. Assays that
measure only a single or few neurotransmitters also preclude discovering involvement of
unanticipated neurotransmitter systems. A comprehensive analytical method for
neurotransmitter measurements would be of great value to the neurosciences by revealing
previously unknown neurotransmitter interactions. Such a method could also accelerate
neurological drug development by allowing rapid evaluation of the effect of novel
compounds in the brain. Any such method must be sensitive enough for dialysate samples
and have sufficient throughput for the many samples generated from in vivo experiments.
Here we report a HPLC-MS method for the measurement of 12 of the most
commonly studied neurotransmitters or neuromodulators (Figure 2.1A) including ACh,
Ado, DA, norepinephrine (NE), serotonin (5-HT), histamine (Hist), Glu, glycine (Gly),
aspartate (Asp), γ-aminobutyric acid (GABA), serine (Ser), and taurine (Tau). The

28
method also assays the metabolites homovanillic acid (HVA), 5-hydroxyindole-3-acetic
acid (5-HIAA), 3,4-dihydroxyphenylacetic acid (DOPAC), normetanephrine (NM) and 3-
methoxytyramine (3-MT). The method is compatible with challenging experiments which
generate low concentration samples such as using small microdialysis probes for high
spatial resolution and fast sampling rates (60 s/sample) for high temporal resolution in
vivo monitoring.
A major difficulty to overcome in developing such an assay is identifying
chromatographic conditions that can resolve the highly polar neurochemicals while
remaining compatible with MS detection. We discovered that derivatization with benzoyl
chloride renders the compounds more hydrophobic so that they can be separated by
reversed phase chromatography. Derivatization also increases sensitivity and provides a
convenient way to improve quantification by stable-isotope labeled internal standards
generated using 13
C6 benzoyl chloride. Importantly, benzoyl chloride reacts with primary
and secondary amines, phenols, and ribose-hydroxyl groups (Figure 2.1B) allowing
nearly all small organic molecule neurotransmitters to be labeled. ACh, which cannot be
labeled by benzoyl chloride, is directly detected in this method. Rapid derivatization and
an 8 min separation time give the method sufficient throughput for the large number of
samples generated by microdialysis experiments. The method uses commercial
instrumentation and readily available reagents; therefore, it can easily be adopted by
other laboratories.

29

30
Figure 2.1 Chemical structure of targeted neurotransmitters and metabolites (A).
Reaction scheme of benzoylation using benzoyl chloride (B)
Experimental Section
Chemicals and Reagents
All chemicals, drugs and reagents were purchased from Sigma Aldrich (St. Louis,
MO) unless otherwise noted. Water and acetonitrile are Burdick & Jackson HPLC grade
purchased from VWR (Radnor, PA). 10 mM stock solution of each analyte was made in
HPLC water and kept at -80 oC. Standard mixture was diluted from stock using aCSF
consisting of 145 mM NaCl, 2.68 mM KCl, 1.10 mM MgSO4, 1.22 mM CaCl2, 0.50 mM
NaH2PO4, and 1.55 mM Na2HPO4, adjusted pH to 7.4 with 0.1 M NaOH. Calibration
curves were made using standards at 50 nM, 500 nM, 1000 nM, 5000 nM, 10000 nM for
Gly, Ser and Tau; 5 nM, 50 nM, 100 nM, 500 nM, 1000 nM for Asp, Glu, GABA, Hist,
Ado, HVA, 5-HIAA and DOPAC; 0.5 nM, 5 nM, 10 nM, 50 nM, 100 nM for ACh, 5-HT,
NE, DA, NM and 3-MT. Internal standard was 1 mM Gly, Ser and Tau, 100 µM Asp,
Glu, GABA, Hist, Ado, HVA, 5-HIAA, and DOPAC and 10 µM 5-HT, NE, DA, NM and
3-MT derivatized with 13
C6 benzoyl chloride using the same procedure as 12
C reagent,
B

31
then diluted 100 fold in DMSO containing 1% formic acid. d4-ACh (C/D/N isotopes,
Pointe-Claire, Canada) was spiked into the reaction mixture to a final concentration of
100 nM.
Microdialysis
Adult male Sprague-Dawley rats (Harlan, Indianapolis, IN) weighing between
295 and 355 g were used. Ketamine (65 mg/kg i.p.) and dexdormitor (0.25 mg/kg i.p.)
were used for operative anesthesia. For dual probe experiments, concentric microdialysis
lanted unilaterally in both the VTA (1 mm long
probe) and NAc (1.5 mm long probe) according to following coordinates from bregma
and dura: anterior-posterior (AP) -5.3, medial-lateral (ML) + 0.5, dorsal-ventral (DV) –
8.0 mm and AP + 1.2, ML + 1.4 and DV -7.8 mm, respectively. For single probe
experiments, probes (3 mm long) were implanted into the mPFC from bregma and dura:
AP +3.0, ML + 0.5, DV – 4.0 (Paxinos and Watson 2007). Probes were secured to the
skull by acrylic dental cement and metallic screws. Following surgery, rats were allowed
to recover and experiments were performed later. Animals were awake and freely moving
with access to food and water throughout the experiment. Microdialysis probes were
flushed at 1.5 µL/min with aCSF for 3 h using a Chemyx (Stafford, TX) Fusion 400
syringe pump. Perfusion flow rate was reduced to 0.6 µL/min and samples were collected
every 20 min for VTA-NAc experiments. For mPFC experiments, perfusion flow rates
were reduced to 1 µL/min to generate 1 µL samples. 1 µL fractions were diluted with 4
µL aCSF, then treated same way as 5 µL sample described below. Following collection
of basal fractions, VTA lines were switched to aCSF containing 50 µM bicuculline for
the duration (2 h) of experiments. Though 12 µL of dialysate were collected per fraction,

32
only 5 µL of total volume was used for analysis. For mPFC, following 20 min of basal
fraction collections, 1 µM neostigmine was perfused through the probe for 5 min.
Benzoylation reaction
5 µL of standard or sample was mixed with 2.5 µL borate buffer (sodium
tetraborate, 100 mM) and 2.5 µL benzoyl chloride (2% in acetonitrile, v/v). The mixture
was vortexed and 2.5 µL internal standard was added before LC-MS analysis.
HPLC-MS analysis
The HPLC system was a Waters (Milford, MA) nanoAcquity HPLC. A Waters
BEH C18 column (1 mm X 100 mm, 1.7 µm, 130 Å pore size) was used for separation.
Mobile phase A was 10 mM ammonium formate, 0.15% (v/v) formic acid in water.
Mobile phase B was acetonitrile. The mobile phase gradient for all 17 analytes was:
initial, 0% B; 0.1 min, 15% B; 2 min, 20% B; 2.3 min, 25% B; 2.31 min, 50% B; 5.31
min, 50% B; 5.57 min, 65 % B; 6.57 min, 65%B; 6.58 min, 0% B; 8.0 min, 0% B.
The flow rate was 100 μL/min and sample injection volume was 9 µL in partial
loop injection mode. Autosampler was kept at ambient temperature and column was
maintained at 27 oC. A Waters/Micromass Quattro Ultima triple quadrupole mass
spectrometer was used for detection. Atmospheric pressure ionization source was
operated in positive ESI mode at 3 kV. Source temperature was 140 oC and desolvation
temperature was 400 oC. Cone gas and desolvation gas flowed at 150 L/h and 500 L/h,
respectively.
MRM conditions are listed in Table 2.1. Interchannel delay and intercycle delay
were both 10 ms. Automated peak integration was performed using Waters Masslynx
version 4.1. All peaks were visually inspected to ensure proper integration. Calibration

33
curves were constructed based on peak area ratio (Panalyte/PI.S.) versus concentrations of
internal standard by linear regression.
Statisical analysis
Data were transformed to percent of baseline measurement to normalize
pretreatment levels to 100 percent. All analyses were performed in Graphpad (La Jolla,
CA) Prism 5. The measurements were all continuous variables and the Kolmogorov-
Smirnov test was used to assess normality of the residuals for each individual repeated
measurement and this assumption was met. A two-tailed repeated measures analysis of
variance (RM ANOVA) was performed on all microdialysis data followed by a post-hoc
Tukey test to test the pairwise difference between every time point and baseline (i.e.
100%). Although animal numbers were relatively small (n = 8 for the bicuculline study
and n = 5 for the neostigmine study), following baseline we collected 7 (for bicuculline)
and 60 (for neostigmine) measures over time on each animal, enabling analyses of
variation in the outcomes both between and within animals. In addition, with 8 animals in
one group and 5 in the other, and 8 repeated measures on each animal, a RM ANOVA
will have more than 90% power to detect a mean difference of 50 percentage points
between the two groups at a 0.05 level of significance (assuming correlations of 0.25 of
the repeated measures, and standard deviations of 10 percentage points in each group).
RM ANOVA is the primary statistical test used for such continuous measurements. Since
the two experiments (i.e. bicuculline and neostigmine) were performed independently,
and did not contain control groups since basal levels were taken as control, no
randomization was necessary. However, the individual who processed the data was blind
to any expected outcomes for each measure.

34
Results and Discussion
HPLC-MS of benzoylated neurotransmitters
All analytes of interest were benzoylated (except ACh), resolved by reversed
phase HPLC, and detected by MS/MS (Figure 2.2). Amino acids were singly benzoylated
while monoamines containing phenolic groups were doubly or triply labeled as
determined by the mass detected. Protonated benzoylation products (MW+1) were
observed by positive electrospray ionization (ESI) for primary, secondary amines and
ribose hydroxy groups. For analytes containing only phenol groups (HVA, DOPAC, 5-
HIAA), the ammonium adduct of their products (MW+18) was detected. For ACh, the
unlabeled molecular ion was used for detection.
Figure 2.2 Ion chromatogram for all 17 analytes. The concentration of each analyte was:
ACh (10 nM); Tau (1000 nM); Hist (100 nM); Ser (1000 nM); Asp (100 nM); Gly (1000
nM); Glu (100 nM); GABA (100 nM); Ado (100 nM); 5-HIAA (100 nM); HVA (100
nM); NM (10 nM); 5-HT (10 nM); DOPAC (100 nM); 3-MT (10 nM); NE (10 nM); and
DA (10 nM).
0
20
40
60
80
100
0 1 2 3 4 5 6 7 8
Re
lati
ve
Ab
un
da
nc
e
Time (min)
ACh
Tau
Hist
Glu
GABA
Ado
5-HIAA
HVA
NM
5-HT
3-MT
DASer
Asp, Gly DOPAC
NE

35
Analytes were detected by MS/MS under collision activated dissociation (CAD)
conditions; therefore, the fragmentation of each analyte was examined to determine the
best product ions to use for quantification (Table 2.1). For most benzoylated analytes, the
benzoyl fragment (m/z 105) was the most abundant product ion (Figure 2.3, top) and was
subsequently used for multiple reaction monitoring (MRM). 5-HT generated additional
fragment ions (m/z 160, m/z 264) besides the benzoyl fragment (Figure 2.3, bottom). The
unique fragment (m/z 264) was selected for MRM of 5-HT. Most analytes were fully
labeled yielding a single chromatographic peak; however, benzoylated Ado produced two
peaks corresponding to N6-benzoyl-Ado and 3’-O-benzoyl-Ado. The latter product is a
result of activity of the 3’-hydroxy group on the ribose ring in nucleophilic substitutions52,
53. Besides m/z 105, both N6-benzoyl-Ado and 3’-O-benzoyl-Ado generated a
characteristic m/z 136 fragment corresponding to an adenine moiety under MS/MS
conditions. The 3’-O-benzoyl-Ado produced more abundant fragment ions and was
chosen for MRM quantification. For ACh, the quanternary ammonium residue (m/z 87)
after loss of acetyl ester was used for quantification.

36
Figure 2.3 MS/MS spectra of benzoylated DA (top) and 5-HT (bottom). Benzoylated 5-
HT gave a unique fragment of 264 m/z besides the characteristic 105 m/z (benzoyl group).
Most other benzoylated analytes like DA produced only 105 m/z in CAD.
100 150 200 250 300 3500
20
40
60
80
100
264
160
105
Rela
tive A
bundance
m/z
m/z 264
m/z 105
100 150 200 250 300 3500
20
40
60
80
100 105
Re
lative
Ab
und
ance
m/z
m/z 105
m/z 105
m/z 105

37
Table 2.1 MRM conditions of 17 benzoylated neurotransmitters and metabolites and
their internal standards.
analyte precursor
m/z product m/z
cone voltage
(V)
collision
energy
dwell time
(ms)
ACh 146 87 35 15 150
d4-ACh 150 91 35 15 150
Bz-Gly 180 105 35 10 75 13
C6Bz-Gly 186 111 35 10 75
Bz-GABA 208 105 35 20 150 13
C6Bz-GABA 214 111 35 20 150
Bz-Ser 210 105 35 20 50 13
C6Bz-Ser 216 111 35 20 50
Bz-Hist 216 105 35 20 50 13
C6Bz-Hist 222 111 35 20 50
Bz-Tau 230 105 35 10 50 13
C6Bz-Tau 236 111 35 10 50
Bz-Asp 238 105 35 10 75 13
C6Bz-Asp 244 111 35 10 75
Bz-Glu 252 105 35 20 150 13
C6Bz-Glu 258 111 35 20 150
Bz-Ado 372 136 35 30 75 13
C6Bz-Ado 378 136 35 30 75
Bz-5HT 385 264 60 20 150 13
C6Bz-5HT 397 270 60 20 150
Bz-NE 482 105 60 30 150 13
C6Bz-NE 500 111 60 30 150
Bz-DA 466 105 70 30 150 13
C6Bz-DA 484 111 70 30 150
Bz-HVA 304 105 35 15 150 13
C6Bz-HVA 310 111 35 15 150
Bz-5HIAA 313 146 35 15 150 13
C6Bz-5HIAA 319 146 35 15 150
Bz-NM 374 105 60 15 150 13
C6Bz-NM 386 111 60 15 150
Bz-3MT 376 105 35 20 150 13
C6Bz-3MT 388 111 35 20 150
Bz-DOPAC 394 105 35 20 150 13
C6Bz-DOPAC 406 111 35 20 150
38
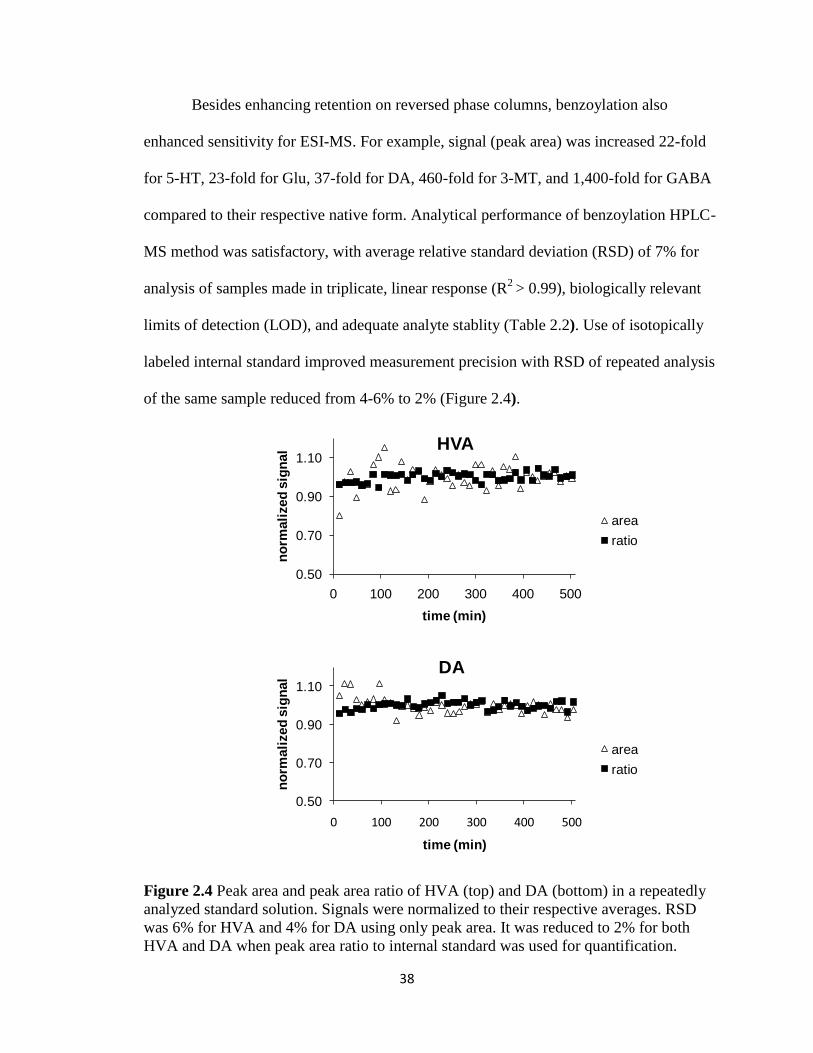
Besides enhancing retention on reversed phase columns, benzoylation also
enhanced sensitivity for ESI-MS. For example, signal (peak area) was increased 22-fold
for 5-HT, 23-fold for Glu, 37-fold for DA, 460-fold for 3-MT, and 1,400-fold for GABA
compared to their respective native form. Analytical performance of benzoylation HPLC-
MS method was satisfactory, with average relative standard deviation (RSD) of 7% for
analysis of samples made in triplicate, linear response (R2
> 0.99), biologically relevant
limits of detection (LOD), and adequate analyte stablity (Table 2.2). Use of isotopically
labeled internal standard improved measurement precision with RSD of repeated analysis
of the same sample reduced from 4-6% to 2% (Figure 2.4).
Figure 2.4 Peak area and peak area ratio of HVA (top) and DA (bottom) in a repeatedly
analyzed standard solution. Signals were normalized to their respective averages. RSD
was 6% for HVA and 4% for DA using only peak area. It was reduced to 2% for both
HVA and DA when peak area ratio to internal standard was used for quantification.
0.50
0.70
0.90
1.10
0 100 200 300 400 500
no
rmali
zed
sig
nal
time (min)
HVA
area
ratio
0.50
0.70
0.90
1.10
0 100 200 300 400 500
no
rmali
zed
sig
nal
time (min)
DA
area
ratio

39
Table 2.2 Figures of merit for benzoylation-HPLC-MS method
Note: RSDs were calculated by comparing peak area of 3 individually derivatized standards at approximate
in vivo concentrations, thus evaluating both reaction and analytical variability. Dynamic range tested for
linearity was 500 – 10,000 nM for Gly, Ser and Tau; 5 – 100 nM for HVA, 5-HIAA, NM, 3-MT and
DOPAC; 50 – 1000 nM for GABA, Asp, Glu, Hist and Ado; 0.5 – 100 nM for ACh,5-HT, NE and DA.
Percent remaining was calculated by comparing peak area of stored standard solution (room temperature
for a week) to a freshly derivatized standard solution. Basal concentration of each analyte in dialysate from
different brain regions is listed. These values are not corrected for microdialysis probe recovery.
Microdialysis
To demonstrate utility of the method under conditions requiring good spatial
resolution, we performed dual probe microdialysis experiments in the mesolimbic
pathway, i.e. the ventral tegmental area (VTA) and the nucleus accumbens (NAc).
Though probes were only 1 mm and 1.5 mm in length, respectively, we detected all
analyte RSD
(n = 3)
LOD
(nM) R
2
% remaining
after storage
(n = 3)
basal in vivo dialysate concentration
VTA (n = 8) NAc (n = 8) mPFC (n = 5)
Gly 5 500 0.9933 80 ± 18 4 ± 2 µM 7 ± 2 µM 7 ± 1 µM
GABA 5 2 0.9989 114 ± 10 0.04 ± 0.01 µM 0.03 ± 0.01 µM 44 ± 8 nM
Ser 11 250 0.9975 94 ± 21 6.4 ± 0.8 µM 20 ± 6 µM 10 ± 4 µM
Tau 7 250 0.9995 86 ± 21 12 ± 4 µM 4 ± 1 µM 4.3 ± 0.6 µM
Asp 10 50 0.9987 109 ± 19 0.6 ± 0.1 µM 0.7 ± 0.1 µM n.d.
Glu 8 5 0.9995 107 ± 14 0.9 ± 0.2 µM 1.9 ± 0.3 µM 0.7 ± 0.3 µM
DA 4 0.03 0.9981 109 ± 14 3 ± 1 nM 8 ± 2 nM 2.2 ± 0.4 nM
NE 10 0.2 0.9997 97 ± 7 1.4 ± 0.2 nM 2.0 ± 0.5 nM 2.0 ± 0.4 nM
5-HT 4 0.1 0.9998 118 ± 19 0.36 ± 0.06 nM 0.32 ± 0.08 nM 0.36 ± 0.08 nM
Hist 13 2 0.9961 118 ± 14 1.2 ± 0.5 nM 0.8 ± 0.2 nM 1.0 ± 0.4 nM
Ado 4 25 0.9974 102 ± 15 18 ± 3 nM 28 ± 5 nM n.d.
3-MT 1 0.05 0.9999 116 ± 18 2.2 ± 0.3 nM 1.7 ± 0.4 nM n.d.
DOPAC 5 2 0.9973 103 ± 5 0.8 ± 0.1 µM 5 ± 1 µM 110 ± 9 nM
HVA 4 0.5 0.9973 108 ± 3 0.12 ± 0.01 µM 0.7 ± 0.2 µM 49 ± 9 nM
NM 2 0.1 0.9996 102 ± 2 0.8 ± 0.1 nM 0.46 ± 0.03 nM 2.7 ± 0.9 nM
5-HIAA 7 5 0.9999 115 ± 20 1.1 ± 0.1 µM 0.67 ± 0.07 µM 0.26 ± 0.04 µM
ACh 7 0.5 0.9963 non-labeled 8 ± 2 nM 15 ± 2 nM 3.8 ± 0.6 nM

40
expected neurochemicals in these samples (Figure 2.5). Basal neurotransmitter
concentrations in VTA and NAc dialysate, reported in Table 2.2, are within the expected
range 54, 55
.
%
0
100 ACh
0.50 1.00 1.50 2.00 2.50 3.00 3.50 4.00 4.50 5.00 5.50 6.00 6.50 7.00 7.50
%
0
100d4-ACh
Time (min)
Bz-Tau
%
0
100
13C6Bz-Tau
0.50 1.00 1.50 2.00 2.50 3.00 3.50 4.00 4.50 5.00 5.50 6.00 6.50 7.00 7.50
%
0
100
Time (min)
Bz-Hist
13C6Bz-Hist
%
0
100
0.50 1.00 1.50 2.00 2.50 3.00 3.50 4.00 4.50 5.00 5.50 6.00 6.50 7.00 7.50
%
0
100
Time (min)
13C6Bz-Ser
Bz-Ser
%
0
100
0.50 1.00 1.50 2.00 2.50 3.00 3.50 4.00 4.50 5.00 5.50 6.00 6.50 7.00 7.50
%
0
100
Time (min)
13C6Bz-Gly
Bz-Gly
%
0
100
0.50 1.00 1.50 2.00 2.50 3.00 3.50 4.00 4.50 5.00 5.50 6.00 6.50 7.00 7.50
%
0
100
Time (min)

41
13C6Bz-Asp
Bz-Asp
%
0
100
0.50 1.00 1.50 2.00 2.50 3.00 3.50 4.00 4.50 5.00 5.50 6.00 6.50 7.00 7.50
%
0
100
Time (min)
13C6Bz-Glu
Bz-Glu
%
0
100
0.50 1.00 1.50 2.00 2.50 3.00 3.50 4.00 4.50 5.00 5.50 6.00 6.50 7.00 7.50
%
0
100
Time (min)
%
0
100
0.50 1.00 1.50 2.00 2.50 3.00 3.50 4.00 4.50 5.00 5.50 6.00 6.50 7.00 7.50
%
0
100
Time (min)
13C6Bz-GABA
Bz-GABA
13C6Bz-Ado
Bz-Ado
%
0
100
0.50 1.00 1.50 2.00 2.50 3.00 3.50 4.00 4.50 5.00 5.50 6.00 6.50 7.00 7.50
%
0
100
Time (min)
13C6Bz-5HIAA
Bz-5HIAA
%
0
100
0.50 1.00 1.50 2.00 2.50 3.00 3.50 4.00 4.50 5.00 5.50 6.00 6.50 7.00 7.50
%
0
100
Time (min)

42
13C6Bz-HVA
Bz-HVA
%
0
100
0.50 1.00 1.50 2.00 2.50 3.00 3.50 4.00 4.50 5.00 5.50 6.00 6.50 7.00 7.50
%
0
100
Time (min)
13C6Bz-NM
Bz-NM
%
0
100
0.50 1.00 1.50 2.00 2.50 3.00 3.50 4.00 4.50 5.00 5.50 6.00 6.50 7.00 7.50
%
0
100
Time (min)
Bz-5HT
13C6Bz-5HT
%
0
100
0.50 1.00 1.50 2.00 2.50 3.00 3.50 4.00 4.50 5.00 5.50 6.00 6.50 7.00 7.50
%
0
100
Time (min)
13C6Bz-DOPAC
Bz-DOPAC
%
0
100
0.50 1.00 1.50 2.00 2.50 3.00 3.50 4.00 4.50 5.00 5.50 6.00 6.50 7.00 7.50
%
0
100
Time (min)
13C6Bz-3MT
Bz-3MT
%
0
100
0.50 1.00 1.50 2.00 2.50 3.00 3.50 4.00 4.50 5.00 5.50 6.00 6.50 7.00 7.50
%
0
100
Time (min)
43
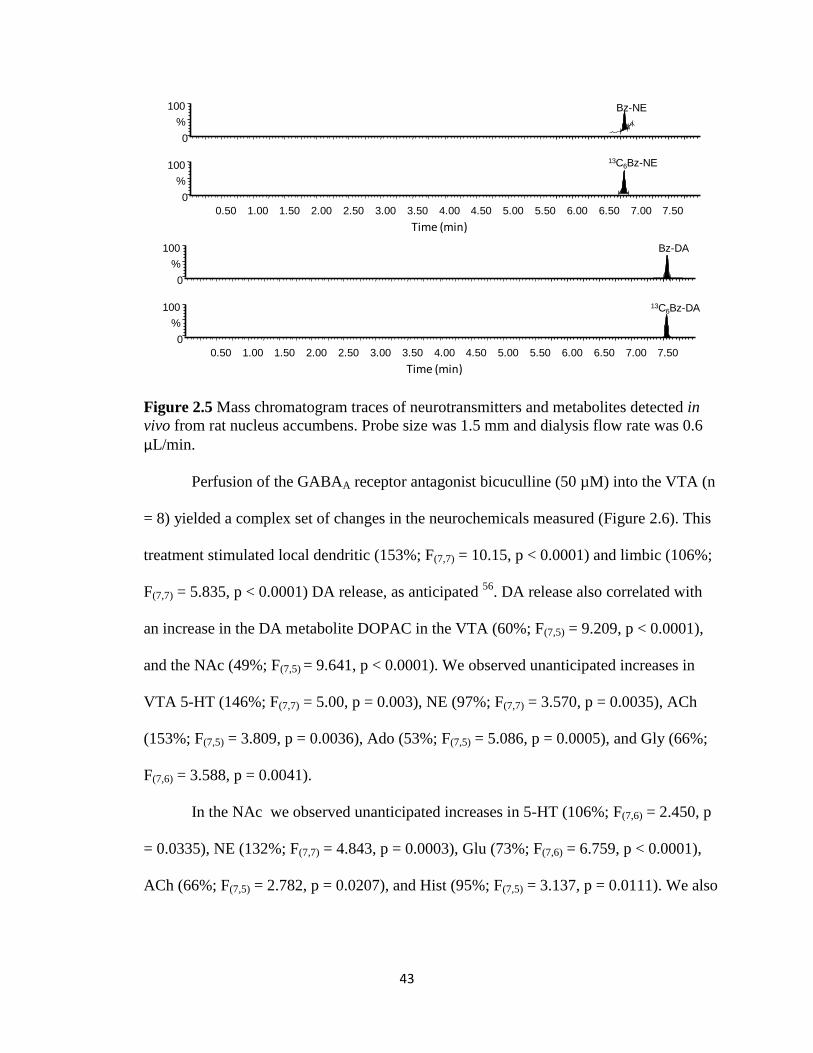
Figure 2.5 Mass chromatogram traces of neurotransmitters and metabolites detected in
vivo from rat nucleus accumbens. Probe size was 1.5 mm and dialysis flow rate was 0.6
µL/min.
Perfusion of the GABAA receptor antagonist bicuculline (50 µM) into the VTA (n
= 8) yielded a complex set of changes in the neurochemicals measured (Figure 2.6). This
treatment stimulated local dendritic (153%; F(7,7) = 10.15, p < 0.0001) and limbic (106%;
F(7,7) = 5.835, p < 0.0001) DA release, as anticipated 56
. DA release also correlated with
an increase in the DA metabolite DOPAC in the VTA (60%; F(7,5) = 9.209, p < 0.0001),
and the NAc (49%; F(7,5) = 9.641, p < 0.0001). We observed unanticipated increases in
VTA 5-HT (146%; F(7,7) = 5.00, p = 0.003), NE (97%; F(7,7) = 3.570, p = 0.0035), ACh
(153%; F(7,5) = 3.809, p = 0.0036), Ado (53%; F(7,5) = 5.086, p = 0.0005), and Gly (66%;
F(7,6) = 3.588, p = 0.0041).
In the NAc we observed unanticipated increases in 5-HT (106%; F(7,6) = 2.450, p
= 0.0335), NE (132%; F(7,7) = 4.843, p = 0.0003), Glu (73%; F(7,6) = 6.759, p < 0.0001),
ACh (66%; F(7,5) = 2.782, p = 0.0207), and Hist (95%; F(7,5) = 3.137, p = 0.0111). We also
13C6Bz-NE
Bz-NE
%
0
100
0.50 1.00 1.50 2.00 2.50 3.00 3.50 4.00 4.50 5.00 5.50 6.00 6.50 7.00 7.50
%
0
100
Time (min)
13C6Bz-DA
Bz-DA
%
0
100
0.50 1.00 1.50 2.00 2.50 3.00 3.50 4.00 4.50 5.00 5.50 6.00 6.50 7.00 7.50
%
0
100
Time (min)

44
observed an unexpected reduction in GABA (34%; F(7,6) = 2.291, p = 0.0452) in the NAc
(Figure 2.6).
To demonstrate the utility of the method under conditions of high temporal
resolution, we used 60 s sampling in the medial prefrontal cortex (mPFC) to observe
changes in ACh release following a 5 min local perfusion of the ACh esterase inhibitor
neostigmine (1 µM; n = 5). Neostigmine perfusion caused a prompt increase in ACh
(518%; F(60,4) = 4.193, p < 0.0001 ) levels in the mPFC as anticipated (Figure 2.7A). We
also observed a large (229%; F(60,4 = 4.443, p < 0.0001) transient increase in Glu
concentration (Figure 2.7 B). Neostigmine perfusion had no effect on DA, GABA (Figure
2.7 C, D) or other measured neurotransmitters (data not shown). Basal neurotransmitter
concentrations in mPFC dialysate are reported in Table 2.2.
HPLC-MS of neurotransmitters
This study demonstrates that HPLC-MS is suitable for measuring all the most
commonly studied low molecular weight neurotransmitters, neuromodulators, and
metabolites in a single analysis based on both direct detection (ACh) and benzoylation.
Unlike reagents that target only primary amines, benzoyl chloride also labels secondary
amines, phenols, and ribose hydroxyl groups. This allows several neurochemicals which
do not have primary amine groups, such as DOPAC, 5-HIAA, and HVA, to be labeled.
Even though many molecules can be detected directly by MS without derivatization,
labeling of polar neurotransmitters has several distinct advantages. Benzoylation
enhances reversed phase LC retention, improves ESI-MS sensitivity, and allows for a
low-cost stable isotope internal standard.

45
Although benzoyl chloride has been used for polyamine analysis 57
, we found that
some specific conditions were necessary to achieve reproducible results for
neurotransmitter detection. Borate buffer was preferred over other basic buffers for
derivatization because it improved precision in catecholamine measurements. We believe
that this is because borate forms a reversible complex with catechol groups 58
and
protects them against oxidation under the high pH conditions used for labeling 59
.
Another issue is that metabolites labeled at multiple sites became hydrophobic and
insoluble in 100% aqueous solution; therefore, 25% organic solvent content in the
reaction mixture was used to keep these compounds in solution.
Benzoyl chloride labeling is similar to dansyl chloride labeling previously
reported for metabolomics 60
but has several advantages due to its structural simplicity. A
preliminary study revealed that monoamines which were multiply-labeled with the dansyl
group had low CAD efficiency on our triple quadrupole mass spectrometer, rendering
MRM of these analytes unsuitable for high sensitivity analysis. In contrast, multiply
labeled benzoylated monoamines are easily fragmented. 13
C dansyl chloride must be
synthesized for differential labeling using light and heavy isotope reagent 60
while 13
C6
benzoyl chloride is commercially available at relatively low cost. Dansylation requires 30
min reaction time at elevated temperatures while the benzoylation reaction was instant at
room temperature. Unlike dansyl chloride, excess benzoyl chloride is completely
hydrolyzed so there is no need to scavenge reagent after the reaction. Importantly, neither
benzoyl chloride nor the benzoylated product is light sensitive in contrast to dansyl
chloride and its derivatives.

46
The HPLC separation time is 8 min and total analysis time for each sample is
around 12 min, taking into account autosampler injection, elution, and column re-
equilibration. Over 80 samples plus standards are routinely analyzed per day in our
laboratory using this method. Such throughput is important for microdialysis since
hundreds of samples are typically generated per study.
Mesolimbic regulation by GABA
To demonstrate the utility of this system, we investigated GABAergic control of
the mesolimbic pathway. The mesolimbic pathway is made up of DA containing cells
which originate in the VTA and extend to the NAc. This pathway is intensively studied
for its role in reward processing, motivation and addiction since all drugs of abuse
activate this pathway 38, 61, 62
. GABA, primarily from VTA interneurons, is an important
regulator of the mesolimbic pathway 63, 64
and blockade of GABAA receptors stimulates
mesolimbic DA release 56
. Evidence suggests that the rewarding effects of opiates,
cannabinoids, and benzodiazepines rely on their ability to activate the mesolimbic DA
pathway by inhibiting GABAergic interneruons in the VTA 64-66
. Neurotransmitters other
than dopamine regulated by GABA have received less attention. Here our method has
uncovered previously unknown GABAergic involvement in several neurotransmitter
systems apart from DA as bicuculline perfusion into the VTA not only evoked the
expected increase in NAc DA23
(and DA metabolite, DOPAC) but also 5-HT, NE, Glu,
ACh, and Hist while reducing GABA levels. Locally in the VTA, bicuculline enhanced
not only dendritic DA (and DOPAC), but also evoked local 5-HT, NE, ACh, Ado, and
Gly release (Figure 2.6). These results show that GABAergic control of the VTA is not
limited to limbic DA release and that a complex interplay between several neuronal

47
substrates is involved in mesolimbic activation, and possibly reward. These
measurements also demonstrate compatibility with high spatial resolution experiments.
The VTA is ~1 mm in height x ~1 mm in width 67
, so a 1 mm long x 250 µm diameter
dialysis probe was used. Small probe produces low recovery (~10 %) requiring high
sensitivity - a criterion met by the current method.
Figure 2.6 Dual probe microdialysis of the mesolimbic pathway. Bicuculline (50 µM)
was perfused in the VTA while monitoring neurotransmitters both locally and distally in
the NAc. Heat map shows all changes of neurochemicals monitored where colors
correlate with changes expressed as percentage of baseline. Times in heat map are
referenced to infusion of biculline. RM ANOVA and a post-hoc Tukey test were
performed to compare basal levels against post drug levels. *p < 0.05, **p < 0.01, ***p <
0.001 compared to basal level in the respective brain region.
Prefrontal ACh and Glu interaction
We also measured prefrontocortical signaling to test the method under the
challenging condition of a high sampling rate. The mPFC is a known center of emotional
and cognitive function and is often studied in psychiatric and attentional disorders 68, 69
.
To uncover physiologically and behaviorally relevant neurotransmitter interactions in the

48
mPFC, common microdialysis sampling rates (i.e. 10- 30 min/sample) remain inadequate.
Here we have made such measurements every 60 s to better capture concentration
dynamics on a more physiologically relevant time scale 69
. Measurement at short
intervals requires high sensitivity (1 µL samples are collected containing femtomoles of
analyte) and good throughput because of the large number of samples generated (e.g., 80
samples per session in Figure 2.7).
The ACh esterase inhibitor neostigmine (5 min perfusion) elevated ACh
concentrations in the mPFC as expected, but also correlated with a transient increase in
mPFC Glu concentration. This result suggests that muscarinic or nicotinic ACh receptors
in the mPFC are responsible for stimulating Glu release. Past studies have shown that
exogenous ACh receptor agonists such as nicotine enhance cognition and stimulate Glu
activity in the mPFC 70
. Our data show that stimulated endogenous ACh is capable of
enhancing Glu release in this brain area. This ACh-Glu interaction may play a role in
cognition and the beneficial effects of drugs which stimulate ACh receptors 70
.
Interestingly other neurotransmitter systems, including the monoamines, were left
unaffected by neostigmine perfusion. These results show how a comprehensive view of
neuropharmacological effects can be assayed by the method. They also show the value
of the temporal resolution as the transient rise of Glu would likely be undetected at longer
sampling intervals.

49
0 10 20 30 40 50 60 70 800
100
200
300
400
*
******
**
neostigmine 1M
time (min)
% b
asal G
lu
0 10 20 30 40 50 60 70 800
50
100
150
200
neostigmine 1M
time (min)
% b
asal G
AB
A
0 10 20 30 40 50 60 70 800
200
400
600
800
*
***
******
neostigmine 1M
*
time (min)
% b
asal A
Ch
0 10 20 30 40 50 60 70 800
50
100
150
200
neostigmine 1M
time (min)
% b
asal D
A
a b
c d
Figure 2.7 Microdialysis in the mPFC. Neostigmine (1 µM) was perfused (black bar) for
5 min in the mPFC while neurotransmitters were monitored locally. Dialysate was
collected every 60 s. Error bar is + 1 SEM (n = 5). Data was expressed as percent of
baseline levels. RM ANOVA and a post-hoc Tukey test to compare basal levels against
post drug levels. *p < 0.05, **p < 0.01, ***p < 0.001 compared to basal mPFC level.
Conclusion
The results show that benzoylation with HPLC-MS is a robust method for
determination of small molecule neurotransmitters and metabolites. The method allows
17 neurotransmitters and metabolites to be detected with 8 min separation at
concentrations from picomolar to micromolar. Internal standard is conveniently generated
using commercial 13
C6 reagent, enabling improved quantification. The
comprehensiveness, low sample volume requirement, sensitivity, and throughput make
this method valuable for neurochemical monitoring under challenging conditions such as
small brain regions (VTA) and at short intervals. These properties will make the method
widely applicable for pharmacological and brain disorder studies. The good temporal

50
resolution will be important for correlating neurotransmitter concentrations to behaviors
which change on similar time scales.

51
CHAPTER 3.
A MASS SPECTROMETRY “SENSOR” FOR IN VIVO ACETYLCHOLINE
MONITORING WITH FIVE SECOND TEMPORAL RESOLUTION
Reproduced in part from (Song, Hershey et al. 2012). Copyright 2012 American Chemical Society
Introduction
Chemical monitoring in a complex microenvironment such as the brain of live
subjects requires methods that have high selectivity, low detection limits, and rapid
temporal responses. Electrochemical and optical sensors have proven effective for some
analytes; however, it is often difficult to develop probes with the necessary performance
and many analytes are not amenable to these approaches71
. Continuous sampling methods,
such as microdialysis, coupled to analytical techniques offer an alternative to sensors; but,
with only a few exceptions, the relatively slow rate of analysis is a hindrance to achieving
comparable temporal resolution to sensors9, 72
. Mass spectrometry (MS) coupled with
continuous ionization methods is an attractive choice for chemical sensing because it
allows high-speed analysis with the selectivity and resolving power needed for complex
mixtures. The concept of MS-based sensing has been well-documented for volatile
organic monitoring73
. Ambient ionization methods have potential for monitoring
condensed phase environments that are accessible to the ionization source74
. For less

52
accessible environments, such as in vivo, it is necessary to couple the mass spectrometer
to a sampling probe. In one example, microdialysis was coupled with fast atom
bombardment MS to monitor penicillin G in the bloodstream of a live rat; however, the
sample was collected in an injection valve before transferring to the ionization source so
that temporal resolution was limited by the time required to collect sufficient sample,
which was 20 min75
. Microdialysis sampling has also been coupled online with liquid
chromatography (LC)-MS76
; but, sample collection and LC separation slow the overall
process.
In this report we couple microdialysis sampling directly with electrospray
ionization (ESI)-MS to monitor neurotransmitter, metabolite, and drug in the brain of live
rats at 5 s temporal resolution. Dilution of the sample stream reduces ionization
suppression and fast scanning by MS allows rapid, online assay. Segmenting the sample
stream into nanoliter droplets is used to prevent temporal distortion due to Taylor
dispersion as concentration pulses collected by the probe are transported to the MS15
.
Segmented flow also facilitates offline analysis by providing a convenient way of storing
nanoliter samples for later analysis10
.
The MS “sensor” is applied to monitoring acetylcholine, a neurotransmitter
involved in a myriad of functions including cognition70
, memory77
, addiction78
,and
movement79
. Dysregulation of acetylcholine is associated with neurological disorders
such as schizophrenia, Parkinson’s disease and Alzheimer’s disease80, 81
. Measurement of
acetylcholine in the brain of live animals is of great value for better understanding the
role of cholinergic neurotransmission in normal and pathological states. Enzyme
modified electrochemical sensors for acetylcholine have been reported with temporal

53
resolution better than 10 s82, 83
; however, high background from choline, a metabolite of
acetylcholine that is rapidly generated by acetylcholinesterase in the extracellular space,
compromises this technique so that basal concentrations cannot be detected83
.
Alternatively, choline can be monitored by electrochemistry as a surrogate for
acetylcholine69
. Acetylcholine is frequently monitored in vivo using microdialysis
sampling and offline analysis by HPLC with electrochemical or MS detection. These
methods are highly sensitive and capable of detecting basal acetylcholine levels in vivo12,
84-88; however, the LC methods are slow and consume microliter samples making them
incompatible with high temporal resolution. Recently, matrix assisted laser desorption
ionization (MALDI)-MS was used to detect acetylcholine and choline in dialysate
samples; however, this method is only compatible with offline analysis and 60 s temporal
resolution89
. We find that microdialysis coupled with segmented flow ESI-MS provides a
convenient way to monitor acetylcholine at high temporal resolution. Further, the method
allows simultaneous monitoring of drugs or metabolites illustrating the versatility of
microdialysis with segmented flow ESI-MS for in vivo sensing.
Experimental Section
Chemicals and reagents
All chemicals were purchased from Sigma-Aldrich (St. Louis, MO) unless
otherwise specified. HPLC grade water and methanol were from Burdick & Jackson
(Muskegon, MI). d4-acetylcholine was purchased from C/D/N isotopes (Pointe-Claire,
Canada ). Artificial cerebrospinal fluid (aCSF) solution contained 145 mM NaCl, 2.68
mM KCl, 1.0 mM MgSO4.7H2O, 1.22 mM CaCl2, 1.55 mM Na2HPO4, 0.45 mM
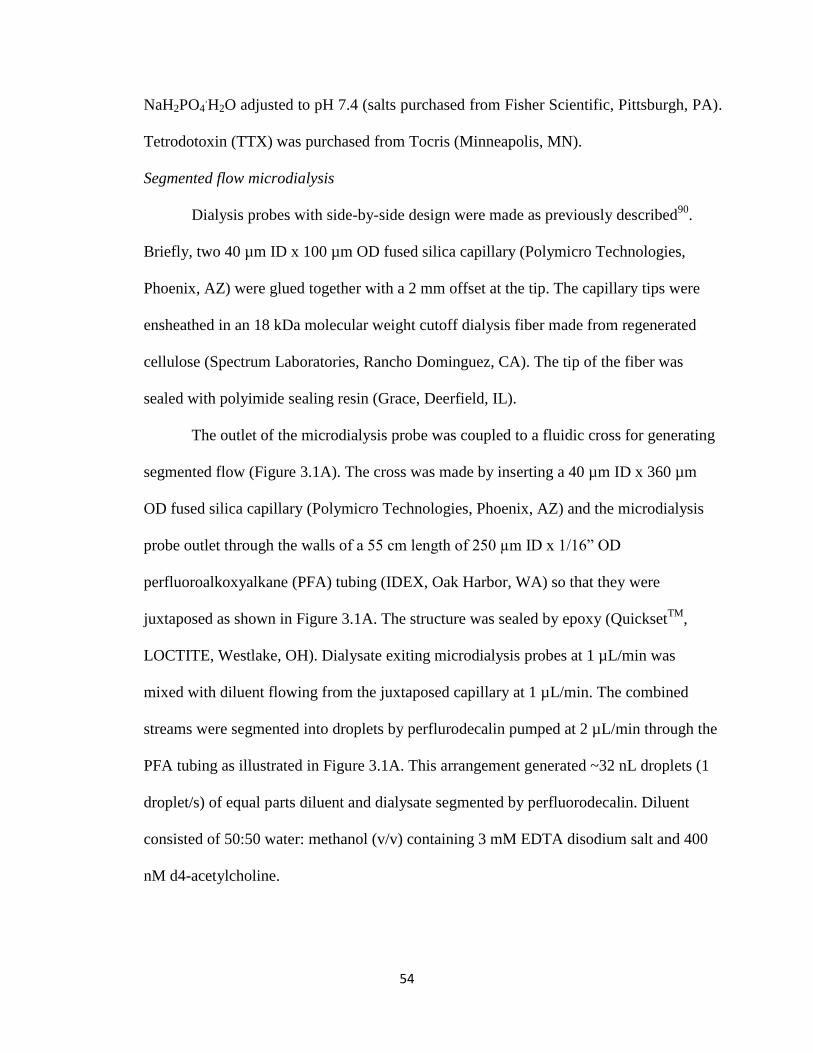
54
NaH2PO4.H2O adjusted to pH 7.4 (salts purchased from Fisher Scientific, Pittsburgh, PA).
Tetrodotoxin (TTX) was purchased from Tocris (Minneapolis, MN).
Segmented flow microdialysis
Dialysis probes with side-by-side design were made as previously described90
.
Briefly, two 40 µm ID x 100 µm OD fused silica capillary (Polymicro Technologies,
Phoenix, AZ) were glued together with a 2 mm offset at the tip. The capillary tips were
ensheathed in an 18 kDa molecular weight cutoff dialysis fiber made from regenerated
cellulose (Spectrum Laboratories, Rancho Dominguez, CA). The tip of the fiber was
sealed with polyimide sealing resin (Grace, Deerfield, IL).
The outlet of the microdialysis probe was coupled to a fluidic cross for generating
segmented flow (Figure 3.1A). The cross was made by inserting a 40 µm ID x 360 µm
OD fused silica capillary (Polymicro Technologies, Phoenix, AZ) and the microdialysis
probe outlet through the walls of a 55 cm length of 250 µm ID x 1/16” OD
perfluoroalkoxyalkane (PFA) tubing (IDEX, Oak Harbor, WA) so that they were
juxtaposed as shown in Figure 3.1A. The structure was sealed by epoxy (QuicksetTM
,
LOCTITE, Westlake, OH). Dialysate exiting microdialysis probes at 1 µL/min was
mixed with diluent flowing from the juxtaposed capillary at 1 µL/min. The combined
streams were segmented into droplets by perflurodecalin pumped at 2 µL/min through the
PFA tubing as illustrated in Figure 3.1A. This arrangement generated ~32 nL droplets (1
droplet/s) of equal parts diluent and dialysate segmented by perfluorodecalin. Diluent
consisted of 50:50 water: methanol (v/v) containing 3 mM EDTA disodium salt and 400
nM d4-acetylcholine.

55
Figure 3.1 Illustration of fluidic design for coupling microdialysis to segmented flow
ESI-MS. (A) Droplet generation device before it was sealed with epoxy; (B) Droplet
coalescence connection.; (C) Liquid connection at ESI probe. Droplets contained green
food dye to facilitate visualization. HV stands for high voltage.
To facilitate online MS analysis, dialysate droplets were coalesced into bigger
ID tube into a 5 cm length of 500 µm ID x 1/16” OD PFA tubing (see Figure 3.1B). The
coalescence junction was made by sliding a piece of fluorinated ethylene propylene (FEP)
tubing (IDEX, Oak Harbor, WA) over the two pieces of 1/16” OD PFA tubing butted
together to form a zero dead volume union (Figure 3.1B). For online analysis, wherein
droplets were transported directly from the probe to the ESI source, the total infusion
flow rate was 4 µL/min. For offline analysis, wherein samples were collected and then
pumped into the ESI source, the infusion flow rate was 2 µL/min.
Electrospray ionization – mass spectrometry
Droplets were pumped into a 32 gauge ESI needle for MS analysis. PFA tubing
containing samples was interfaced to the ESI needle using a polyether ether ketone

56
(PEEK) zero dead volume union (ZU1TFPK, Valco, Houston, TX). For better
visualization, the PEEK zero dead volume union was replaced with a transparent Teflon
tee in Figure 3.1C.
In other experiments, the 32 gauge stainless steel ESI needle was replaced with a
modified fused silica capillary of the same size (100 µm ID x 238 µm OD) to reduce
carryover between droplets. The fused silica needle was coated on the outside with
Au/Pd alloy by a sputter coater (SC7620 Mini, Emitech, Kent, TN). The inner surface
was derivatized by infusing 100 µL of 1% trichloro(1H,1H,2H,2H-perfluorooctyl)silane
in hexadecane followed by flushing with 300 µL of hexane and then He for 3 min.
The ESI source was interfaced to a Micromass/Waters (Milford, MA) Quattro
Ultima triple quadrupole mass spectrometer. ESI voltage was 2.5 kV. The nebulizing gas
was at 100 psi for an infusion flow rate of 4 µL/min but was decreased to 60 psi for 2
µL/min. The source temperature was maintained at 100 ºC. The desolvation temperature
was 200 ºC. The desolvation gas flow rate was 200 L/h and cone gas flow rate was set at
150 L/h. The MS was operated in multiple reaction monitoring (MRM) mode using
conditions listed in Table 3.1. Conditions for LC-MS acetylcholine analysis were
described previously91
.
Table 3.1 Analyte MRM conditions
Note: Three analytes were monitored together during in vivo experiments: acetylcholine, d4-acetylcholine,
and choline or acetylcholine, d4-acetylcholine and neostigmine. Total MS cycle time was ~ 0.2 s.
Temporal resolution and carryover measurement
analyte transition dwell time (ms) cone voltage collision energy
acetylcholine 14687 70 35 15
d4-acetylcholine 15091 70 35 15
choline 10460 70 35 15
neostigmine 223208 70 35 20

57
Carryover of the ESI probe was characterized by infusing discrete droplets
containing alternately 0 and 1 µM acetylcholine dissolved in 50:50 aCSF:diluent (v/v). A
series of droplets were formed by moving one end of a PFA tubing (500 µm ID x 1/16”
OD ) up and down between aqueous sample layer and oil layer in a glass vial, while the
other end of the tubing was connected to syringe pump operating at pull mode (4 µL/min).
Then the tubing was moved to another vial containing different concentrations of sample
and a train of new droplets was formed in the same fashion. The tip of the PFA tubing
was thoroughly rinsed when switching sampled solutions to eliminate carryover at
droplet generation step.
Temporal resolution of the online microdialysis segmented flow ESI-MS system
was measured by recording step increases in acetylcholine concentration created by quick
transfer of dialysis probes between high and low concentration standard. To determine
the effect of segmenting flow, a similar experiment was performed but by-passing the
segmenting cross. Instead, the dialysate was mixed with diluent via a tee (C360QTPKG6,
Valco, Houston, TX) at 1:1 ratio.
Surgery and in vivo experiments
All animal experiments were performed according to protocols approved by the
University of Michigan Committee for the Use and Care of Animals. Male Sprague-
Dawley rats (Harlan, Indianapolis, IN) were anesthetized with ketamine (65 mg/kg,
intraperitoneal (I.P.) injection) and dexdomitor (0.25 mg/kg, I.P.) and placed in a
stereotaxic frame (Kopf Instruments, Tujunga, CA). A burr hole was drilled +0.2 mm
anterior-posterior and ±3.0 mm laterally from bregma to target the dorsomedial striatum67
.
The microdialysis probe was lowered so that the active area extended 4.8 mm to 6.8 mm

58
from the top of the skull. One hour after probe insertion, neostigmine (5 µM) or TTX
(100 µM) was microinjected. Boosters of ketamine (30 mg/kg, I.P.) and dexdomitor (0.13
mg/kg, I.P.) were given as needed. For microinjection experiments, a 20
OD capillary was glued so that the outlet was near the middle of the probe active area and
100 µm spaced from the membrane surface. A Picospritzer (General Valve, Fairfield,
VA ) was used to infuse 200 nL of drug solution over 4 s from the capillary for each
microinjection.
Data analysis
Segmented flow ESI-MS data was recorded by Masslynx 4.1 (Waters, Milford,
MA) and exported as txt files for plotting and processing. The C-Unipolar Peak Areas
detection function of Igor Pro 6.21 (WaveMetrics, Lake Oswego, OR) was used for peak
detection and peak height determination. Peak height ratio to internal standard was used
for quantification.
Results and Discussion
Direct ESI-MS analysis of acetylcholine in microdialysate droplets
Initial experiments were performed using flow injection analysis (FIA) to
determine if acetylcholine dissolved in aCSF could be detected by direct ESI tandem MS
(MS/MS). This study showed that signal for acetylcholine in aCSF was about 20-fold
lower than that in water (Figure 3.2 A and B), presumably due to ionization suppression.
Two-fold dilution of dialysate samples with water reduced ionization suppression and
increased the signal ~2.5-fold relative to that in aCSF to yield a low nanomolar detection
limit (Figure 3.2 C).

59
Figure 3.2 Ion suppression of d4-acetylcholine by the inorganic salt in aCSF shown by
FIA coupled to ESI-MS/MS (15091). 50 nM d4-acetylcholine was dissolved in water
(A), aCSF (B) and diluted aCSF (C). Ion intensity was shown on the top right corner. FIA
flow rate was 100 µL/min. Acquisition started right after sample injection.
Another potential problem faced by direct ESI-MS/MS determination of
acetylcholine in aCSF was interference. Using LC-MS/MS analysis of in vivo dialysate
samples, we detected an additional peak besides acetylcholine corresponding to the same
MRM transition (146 87), as has been previously reported84, 86
(Figure 3.3 A). Because
this peak would interfere with direct ESI-MS/MS analysis, we further studied its origin.
Removing MgSO4 from aCSF eliminated this peak suggesting that it was due to Mg2+
cluster ions (Figure 3.3 B). Addition of 3 mM EDTA disodium salt to dialysate samples
to chelate Mg2+
effectively reduced the interference (Figure 3.3 B) allowing direct
detection of acetylcholine by ESI-MS/MS.

60
Figure 3.3 Determination of interference of acetylcholine measurement using LC-ESI-
MS/MS. (A) Analysis of dialysate samples: (i) MRM (14687) trace for acetylcholine
(ACh) showing interference; (ii) MRM (15091) trace for d4-acetylcholine. (B)
Determination of source of acetylcholine interference and its reduction. (i) LC-ESI-
MS/MS (15091) trace of 1 µM d4-acetylcholine in aCSF; (ii) LC-ESI-MS/MS
(14687) trace of aCSF without MgSO4 showing no interfering peak; (iii) LC-ESI-
MS/MS (14687) trace of regular aCSF blank solution showing interference; (iv) LC-
ESI-MS/MS (14687) trace of regular aCSF blank spiked with 3 mM EDTA showing
reduction of interfering peak. Retention time of interference and ACh was aligned with
dashed lines.
Based on these experiments, and the desire to obtain high temporal resolution
measurements, we designed the system shown in Figure 3.1 to interface microdialysis
sampling to ESI-MS. The microdialysis stream was segmented into droplets using
perfluorodecalin to avoid dispersion of collected samples during transport and storage

61
(for offline measurements) as previously demonstrated10
. As the sample stream was
segmented, it was diluted with neat solvent containing EDTA, to chelate Mg2+
, and d4-
acetylcholine, to provide an internal standard.
The segmented flow dialysate stream was coupled directly to the ESI source as
shown in Figure 3.1. Figure 3.4 illustrates that infusion of perfluorodecalin-segmented
acetylcholine containing droplets through the ESI source yields distinct current bursts
corresponding to each droplet sample. During infusion of samples, perfluorodecalin was
removed from the ESI needle by the nebulization gas and produced no signal in the mass
spectra. The orthogonal spray geometry was advantageous because oil and non-ionized
salt present in the sample were dissipated or deposited on a shield opposing the ESI
needle instead of entering the MS inlet. In previous reports of segmented flow ESI-MS,
the aqueous droplets were either desegmented prior to ESI-MS92-95
or directly ionized
through nanospray under sufficiently low voltage and flow rate96
. Compared to previous
methods, the ESI format used here proved to be simple (no desegmentation) , robust (no
clogging for example) and compatible with a wide range of experimental conditions
including different flow rates and voltages.
Direct infusion of droplets containing different acetylcholine concentrations
revealed a linear increase in MS/MS signal in the concentration range expected for
dialysate samples (Figure 3.4). The limit of detection (LOD) was 5 nM based on the
sampled concentration required to achieve signal to noise ratio of 3.

62
Figure 3.4 Quantitative performance of droplet-microdialysis-ESI-MS acetylcholine
detection set up. (A) Calibration curve as ratio of signal for acetylcholine to internal
standard (I.S.) Standard was prepared in aCSF. (B) Trace of different concentrations of
acetylcholine by segmented flow ESI-MS/MS. Inset shows enlarged view of 16 samples
at 100 nM. Result was obtained by sampling from different concentration acetylcholine
standard solutions using the system shown in Figure 3.1
System temporal resolution
Temporal resolution is an important consideration for in vivo measurements.
Choline pulses lasting just a few seconds have been detected in vivo by sensors
suggesting the need for temporal resolution at that level to capture such dynamics69
. To
preserve temporal resolution, dialysate was segmented at 1 s intervals; but the 0.5 s
duration of these droplets (with 0.5 s for oil) was too short for adequate analysis time
during online detection. This was because the MS cycle time was 200 ms (time required
for MRM scans for acetylcholine, d4-acetylcholine, and either a metabolite, choline, or
drug, neostigmine), allowing only 2 to 3 scans per 0.5 s droplet. To obtain more scans per

63
droplet, we coalesced the 32 nL droplets into 160 nL droplets thus increasing the droplet
duration to 2.4 s at a total flow rate of 4 µL/min (2 µL/min of oil, 1 µL/min of dialysate,
and 1 µL/min of diluent). Coalescence was reproducible as the RSD of the resulting
droplet peak width was 7%; however, it did reduce the best possible temporal resolution.
In principle, slower flow rates and narrower ESI needle could be used with droplets that
were the original collected size and not coalesced; however, this would increase the
overall analysis time and increase the possibility of clogging. As discussed below, the
overall temporal resolution was not substantially compromised by this approach.
Once droplets are segmented they should preserve the temporal resolution of the
measurement; however, when flowing over hydrophilic surfaces the aqueous samples can
wet the surface allowing mixing or carryover between droplets to reduce temporal
resolution. The stainless steel needle commonly used for ESI-MS contributed to
carryover when segmented samples were pumped through it (Figure 3.5 A,B). In contrast,
a modified fused silica capillary (hydrophobic inner surface) eliminated this carryover
(Figure 3.5 C).

64
Figure 3.5 Carryover at the ESI probe liquid connection characterized by infusing
discrete droplets containing 1 M acetylcholine and then step decrease to 0 M using: (A)
a low dead volume union and steel ESI needle; (B) a zero dead volume union and steel
ESI probe; and (C) a zero dead volume union and modified fused silica ESI needle.
The temporal resolution with continuous flow was 16 s (Figure 3.6 A). In contrast,
the temporal resolution of the segmented flow setup under identical microdialysis
conditions and using same length of transfer tubing, was 5 s (Figure 3.6 B), which was
defined as tres ≈ φ/f (φ is the number of plugs required to see a change from 10 to 90 %, f
is the plug frequency)97
.

65
Figure 3.6 Measurement of temporal resolution and comparison. (A) Temporal response
to a step change from 500 nM to 5 µM acetylcholine using microdialysis coupled directly
to ESI-MS/MS without segmented flow. (B) Temporal response for the same experiment
with segmented flow and online analysis. Droplets were analyzed at total flow rate of 4
µL/min. (C) Temporal response for same experiment using segmented flow and offline
analysis. Droplets were collected in tubing and analyzed offline at infusion rate of 2
µL/min.
Two factors limit the temporal resolution of the segmented flow ESI-MS system.
First is the limited scan speed of the MS. A faster scanning instrument would allow
online detection of small droplets without coalescing, a step that sacrificed temporal

66
resolution. Alternatively, this issue can be solved by analyzing the droplets offline at
slower flow rate to accommodate the maximal scan rate. As shown in Figure 3.6 B-C,
temporal information was unchanged when analyzing droplet samples at lower flow rate
offline showing the potential for this approach. The other factor determining system
temporal resolution was the swept volume of the microdialysis probe. Dispersion of
concentration gradients crossing the membrane while being swept from the probe limits
the temporal resolution to a few seconds10
. Based on this lower limit for microdialysis,
the compromises made to account for the mass spectrometer scan rate were not highly
detrimental. It may be possible to achieve sub-second temporal resolution by using
alternative sampling methods98
.
In vivo testing
A typical acetylcholine trace from in vivo measurements in an anesthetized rat
striatum is shown in Figure 3.7 A.

67
Figure 3.7 Recording of response to in vivo microinjection of neostigmine. Figure
showed a sample trace for simultaneous detection of (A) acetylcholine (ACh); (B)
internal standard, d4-acetylcholine (d4-ACh); and (C) neostigmine (Neo). Arrow
indicates beginning of each microinjection. Insert is a magnified view of the 1st
microinjection for neostigmine detection. (D) Averaged acetylcholine response to
neostigmine microinjection (dotted line) overlaid with averaged neostigmine signal (solid
line), (n = 6, error bar = SEM). Response of 2 to 3 droplets were binned in to one data
point at 10 s interval for the averaged plot.

68
After an initial equilibration period (data not shown), a stable signal was achieved
that corresponded to an average dialysate concentration of 10 ± 3 nM (SEM, n = 3 rats),
in line with reported values83, 88, 99
. Considering that in vitro recovery was 20%, this result
corresponds to approximately 50 nM in vivo concentration (although in vitro recovery is
not always a good approximation of in vivo recovery100
).
Microinjection of 200 nL of 5 µM neostigmine, an inhibitor of
acetylcholinesterase, yielded a robust acetylcholine transient increase up to 280 ± 71 % of
baseline (n = 6 injections from 3 rats). The signal for the internal standard d4-
acetylcholine (Figure 3.7 B) remained stable during microinjection showing that the
changes in acetylcholine were not due to artifacts such as instrument drift or changes in
ionization efficiency.
An advantage of MS detection is that it can be used to monitor multiple analytes
simultaneously. For example, neostigmine was readily detected allowing a determination
of its dynamics during microinjection (Figure 3.7 C). Neostigmine reached a maximum
within 10 s of injection illustrating the high temporal resolution possible in vivo. The
average response for neostigmine and acetylcholine are overlaid in Figure 3.7 D. The
acetylcholine signal is broader than the drug signal possibly reflecting kinetics of
inhibition (i.e., we detect the free drug only, so some drug may stay bound to enzyme and
continue to inhibit). The broader acetylcholine signal may also reflect the longer distance
these molecules had to diffuse through to the probe before detection. Thus, acetylcholine
neurons farther from the probe than the microinjector are affected by the neostigmine and
the released acetylcholine then diffuses to the probe for detection.

69
An important test of in vivo measurements of neurotransmitters is sensitivity to
TTX. TTX binds to neuronal sodium channels to inhibit action potential propagation;
therefore, decreases of neurotransmitter concentration with TTX treatment support the
conclusion that the signal observed is due to neuronal firing and presumably neuronal
release. Figure 3.8 A shows that acetylcholine decreased when TTX was microinjected,
in agreement with reports wherein TTX was perfused through a microdialysis probe into
the brain86
. The acetylcholine level remained low for at least 20 min after TTX
administration likely due to the persistence of TTX associated with its high affinity for
the sodium channel. For these experiments 200 nM neostigmine was perfused through the
probe to increase dialysate concentration to 50 ± 10 nM (SEM, n = 5). Without this
perfusion, it was difficult to detect a decrease in basal acetylcholine concentration which
was typically near the LOD.
Choline was also monitored in these experiments. As shown in Figure 3.8 C, its
signal roughly corresponds to that of acetylcholine, supporting the idea that it could be
used as a surrogate for acetylcholine under these conditions. These results again illustrate
the versatility of MS “sensing” in that different compounds can be selected for
monitoring.

70
Figure 3.8 Recording of in vivo response to a TTX microinjection. Traces showed
simultaneous detection of (A) acetylcholine; (B) internal standard, d4-acetylcholine; and
(C) choline (Ch) for one experiment. Arrow indicates beginning of microinjection.
Conclusion
Microdialysis coupled with segmented flow ESI-MS provides a powerful in vivo
sensor with good temporal resolution and selectivity. The method should be suitable for a
variety of endogenous and exogenous compounds; however, application will be limited to
chemicals that can be readily ionized from complex mixtures. The availability of a stable
isotope labeled internal standard enhances quantification and helps account for possible
matrix effects. Other sampling probes and online sample pretreatment may further extend
the applicability of this approach.

71
CHAPTER 4.
CAPILLARY UHPLC-MS FOR HIGH THROUGHPUT IN VIVO MONITORING
Introduction
Increasing analysis speed has been an enduring theme of HPLC technology development.
For in vivo monitoring studies where large sample sets are generated in a short period of
time, HPLC method with higher throughput is particularity desirable. The UHPLC-MS
method described in Chapter 2 used maximum instrument flow rate to drive the
separation on a microbore column (1 mm i.d.), separating 17 compounds of broad
polarity range within 8 min. The flow rate limitation of our capillary LC instrument
became a hurdle for development of faster analysis. However, speed of LC methods is
determined by linear flow velocity, not the volumetric flow rate. Increased linear flow
velocity can still be achieved on smaller columns while the volumetric flow rate does not
exceed the volumetric flow rate limit imposed by the LC instrument.
HPLC columns with i.d. less than 0.5 mm are commonly referred as capillary columns.
Columns with i.d. smaller than 0.1 mm typically operate at nL/min flow rate range, thus
are classified as nanoscale columns101
. Several advantages arise from column
miniaturization. Both sample consumption and mobile phase usage drop geometrically as
they are proportional to column volume. This is especially useful for sample limited
analysis and also substantially reduces the cost of purchasing and disposing LC solvents.
Concentration sensitive detectors such as electrochemical detectors, fluorescent detectors

72
and mass spectrometers, if optimized, give comparable or sometimes superior
sensitivity102, 103
. Another important attribute of smaller columns is related to their
thermal property. The heat generated due to frictional heating of the mobile phase as it
travel through the micro channels of HPLC columns is distributed unevenly and the
radial thermal gradient is detrimental for the separation efficiency. This issue is
especially aggravated on long columns or columns packed with small particles. Capillary
columns enjoys proportionally reduced heat generation and much improved heat
dissipation24
. Higher separation efficiency was also observed on nanoscale columns104
.
This improvement was proposed to be caused by the more uniform wall effect across
entire widths of the columns which resulted in a smaller A term.
Capillary LC, especially nanoscale LC, saw most application sample size limited studies.
In proteomics, nanoscale columns coupled to mass spectrometry by sensitive nanospray
technique is routinely used to generate high quality data consuming minute amount of
proteins105, 106
. Miniaturized LC techniques were also employed in high temporal
resolution monitoring studies for small molecules and peptides11, 46, 107
. In one example,
amino acids in samples collected at 10 s interval were detected, although the analysis of
the whole sample set took much longer due to the speed of LC separation11
.
In this chapter, we examined the practical aspect of employing capillary columns packed
with high efficiency particles for high speed LC analysis with the ultimate goal of
applying the method for in vivo monitoring. Three commercially available capillary
columns were evaluated and the best column was further optimized for fast
neurotransmitter separation within 4 minutes. The new LC-MS method represented a 2
fold improvement in throughput compared to the old method in Chapter 2 and was
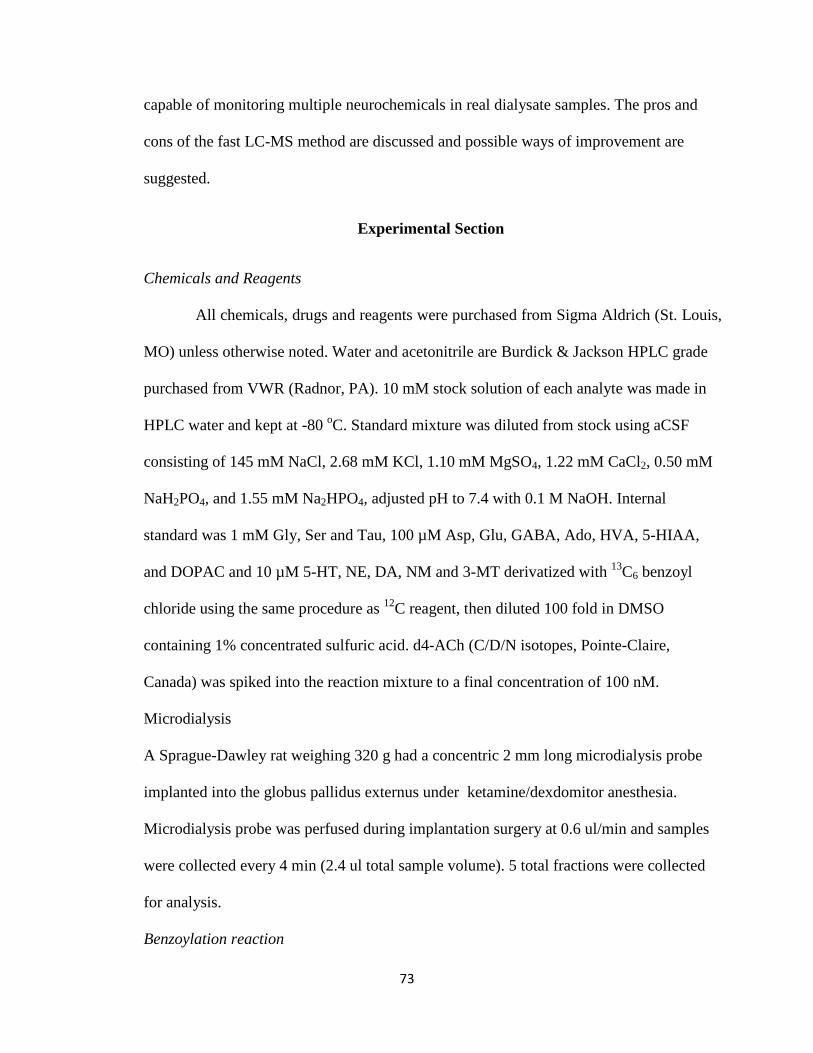
73
capable of monitoring multiple neurochemicals in real dialysate samples. The pros and
cons of the fast LC-MS method are discussed and possible ways of improvement are
suggested.
Experimental Section
Chemicals and Reagents
All chemicals, drugs and reagents were purchased from Sigma Aldrich (St. Louis,
MO) unless otherwise noted. Water and acetonitrile are Burdick & Jackson HPLC grade
purchased from VWR (Radnor, PA). 10 mM stock solution of each analyte was made in
HPLC water and kept at -80 oC. Standard mixture was diluted from stock using aCSF
consisting of 145 mM NaCl, 2.68 mM KCl, 1.10 mM MgSO4, 1.22 mM CaCl2, 0.50 mM
NaH2PO4, and 1.55 mM Na2HPO4, adjusted pH to 7.4 with 0.1 M NaOH. Internal
standard was 1 mM Gly, Ser and Tau, 100 µM Asp, Glu, GABA, Ado, HVA, 5-HIAA,
and DOPAC and 10 µM 5-HT, NE, DA, NM and 3-MT derivatized with 13
C6 benzoyl
chloride using the same procedure as 12
C reagent, then diluted 100 fold in DMSO
containing 1% concentrated sulfuric acid. d4-ACh (C/D/N isotopes, Pointe-Claire,
Canada) was spiked into the reaction mixture to a final concentration of 100 nM.
Microdialysis
A Sprague-Dawley rat weighing 320 g had a concentric 2 mm long microdialysis probe
implanted into the globus pallidus externus under ketamine/dexdomitor anesthesia.
Microdialysis probe was perfused during implantation surgery at 0.6 ul/min and samples
were collected every 4 min (2.4 ul total sample volume). 5 total fractions were collected
for analysis.
Benzoylation reaction

74
Derivatization procedure was similar to that described in chapter 2 with minor
modifications. 2 volume of sample or standard was added with 1 volume of buffer, 1
volume of reagent, and 1 volume of internal standard. Then 5 volume of water was added
into the mixture to reduce sample elution strength.
HPLC-MS analysis
The HPLC system was a Waters (Milford, MA) nanoAcquity HPLC. Columns
used were HSS T3 C18 (1.8 µm particle, 1 mm X 10 cm) from Waters, Waters Atlantis
T3 (3 µm particle, 300 µm X 15 cm) from Waters, Pepmap C18 (2 µm particle, 300 µm X
5cm) from Dionex (Sunnyvale, CA)and Halo™ C18 (2.7 µm fused core particle, 500 µm
X 10 cm) from Eksigent (Foster City, CA). Connecting tubing in the LC system was 50
um i.d. PEEKSil from IDEX (Oak Harbor, WA). Mobile phase A (m.p.A) was 10 mM
ammonium formate, 0.15% (v/v) formic acid in water. Mobile phase B (m.p.B) was
straight acetonitrile. Linear gradient from 5 % to 66% m.p.B was used for all columns.
Flow rate, injection volume and gradient conditions adjusted for 4 columns were
summarized in table 4.1.
Table 4.1 LC conditions for different columns
column i.d. (µm) length (cm)
particle (µm)
tG (min) flow rate (µL/min)
Inj. vol. (µL)
HSS T3 1000 10 1.8 7 100 5.0
Halo™ 500 10 2.7* 7 25 1.3
Pepmap 300 5 2 7 4.5 0.3
dC18 300 15 3 7 13.5 0.7
Halo™ 500 10 2.7* 3.5 50 1.3
* fused core particles
Sample injection was done in partial loop injection mode. Autosampler was kept
at ambient temperature and column was maintained at 27 oC. An Agilent (Santa Clara,
CA) 6410 triple quadrupole mass spectrometer was used for detection. Atmospheric

75
pressure ionization source was operated in positive ESI mode at 4 kV. Drying gas flow
was 11 L/min at 350 oC. Nebulizing gas was set at 15 psi. The original stainless steel ESI
needle (159 µm i.d.) was replaced with a tapered fused silica needle fabricated from a
piece of 50/360 µm fused silica tubing. The original ferrule to adapt stainless steel needle
to the 1/16” fittings was also changed to a fused silica adapter from Valco (Houston, TX).
To make the fused silica ESI needle, A 2 cm clear window was burnt on the fused
silica tubing. Then it was mounted on a laser pipette puller (P-2000, Sutter Instrument,
Novato, CA). The tapered fused silica needle was made using program described in
literature108
. The opening was widened by flattening the tip on a ceramic capillary cutter
(Restec, Bellefonte, PA).
Dynamic multiple reaction monitoring (dMRM) conditions are listed in Table 2.
Chromatograms were constructed from data points exported from Agilent MassHunter
Qualitative Analysis B.04.00.

76
Table 2. dMRM parameters for neurochemicals and their internal standard
Results and Discussion
The main goal of this study is to increase the throughput of UHPLC-MS method for
neurochemicals and reduce sample consumption by the exploring capillary UHPLC
methods. Use of capillary columns was a feasible way of achieving faster separation
without exceeding instrument’s flow rate limit. According to Van Deemter equation and
its derivatives, high velocity inevitability caused loss of separation efficiency due to mass
transfer limit. The key for fast and efficient separation invariably involves minimizing the
C term. The available technologies to achieve this goal were discussed in detail in
Analyte Parent Ion
Daughter Ion
Fragment Voltage
(V)
Collision Energy
(V)
Cell Acc (V)
Ret Time (min)
Ret Window
ACh 146 87 120 15 4 0.7 0.25
Bz-3MT 376 105 120 20 4 3.51 0.2
Bz-5HIAA 313 146 120 15 4 2.89 0.15
Bz-5HT 385 264 140 20 4 3.42 0.15
Bz-Ado 372 136 120 30 4 2.02 0.15
Bz-Asp 238 105 120 10 4 1.54 0.15
Bz-DA 466 105 140 20 4 3.87 0.15
Bz-DOPAC 394 105 140 20 4 3.43 0.15
Bz-GABA 208 105 120 10 4 1.75 0.15
Bz-Glu 252 105 120 20 4 1.61 0.15
Bz-Gly 180 105 120 10 4 1.56 0.15
Bz-Hist 216 105 120 20 4 1.45 0.15
Bz-HVA 304 105 120 15 4 2.99 0.15
Bz-NE 482 105 140 30 4 3.55 0.15
Bz-NM 374 105 140 15 4 3.11 0.15
Bz-Ser 210 105 120 20 4 1.45 0.15
Bz-Tau 230 105 120 10 4 1.38 0.2
C13Bz-3MT 388 111 120 20 4 3.51 0.2
C13Bz-5HIAA 319 146 120 15 4 2.89 0.15
C13Bz-5HT 397 270 140 20 4 3.42 0.15
C13Bz-Ado 378 136 120 30 4 2.02 0.15
C13Bz-Asp 244 111 120 10 4 1.54 0.15
C13Bz-DA 484 111 140 20 4 3.87 0.15
C13Bz-DOPAC 406 111 140 20 4 3.43 0.15
C13Bz-GABA 214 111 120 10 4 1.75 0.15
C13Bz-Glu 258 111 120 20 4 1.61 0.15
C13Bz-Gly 186 111 120 10 4 1.56 0.15
C13Bz-Hist 222 111 120 20 4 1.45 0.15
C13Bz-HVA 310 111 120 15 4 2.99 0.15
C13Bz-NE 500 111 140 30 4 3.55 0.15
C13Bz-NM 386 111 140 15 4 3.11 0.15
C13Bz-Ser 216 111 120 20 4 1.45 0.15
C13Bz-Tau 236 111 120 10 4 1.38 0.2

77
Chapter 1. Here capillary columns packed with small totally porous and fused core
particles were evaluated for high speed separation.
Capillary column size
Capillary LC requires low dispersion sample introduction and low flow pumps. Stable
nL/min to low µL/min flow and efficient mixing are no longer problems on commercial
capillary LC systems (Waters nanoAcquity, Dionex 3000 nano LC, Agilent 1260
capillary LC, Eksigent nanoLC/microLC, Proxeon EASY nLC). However, much remains
to be done on the sample introduction part. The injection volume on to a HPLC column
can be expressed as109
Vinj = θKεπdc2L(k+1)/N
1/2 (Equation 4.1)
Vinj is the injection volume; θ is the fractional loss of separation efficiency, usually 5% is
considered acceptable (θ = 0.05); K is the constant regarding injector’s property, K = 4
for rectangular injection profile; ε is column total porosity, usually around 70% (ε = 0.7);
dc is the column i.d; L is column length; k is the retention factor; N is the plate number.
Since reduced plate height h = H/dp , H is the plate height and dp is the particle size.
N = L/H = L/hdp (Equation 4.2)
Assuming good column efficiency (h = 2)
Vinj ≈ 0.662dc2(k+1)(Ldp)
1/2 (Equation 4.3)
Thus, as Equation 4.3 shows, sample injection volume is determined by analyte retention,
column size and to a lesser degree, particle size. Thus, for a 75 um X 15 cm capillary
column packed with 3 um particles, the acceptable injection volume of a lightly retained
analyte (k = 3) is only10 nL. Reproducible injection of such a small volume without

78
significant dispersion is no easy task and no commercial autosampler today is up to this
challenge. Injection of low nL volume is done using split injection (static or dynamic) or
pressure vessel109
. Although capable of injecting very low sample volumes, these
techniques are not reproducible, difficult to automate and in the cases of split injections,
waste samples. This issue become much easier for analytes with strong retention, such as
hydrophobic peptides on reversed phase LC (RPLC) columns. On column focusing are
often practiced for these compounds108
. Dissolved in large volumes of weak solvent,
these analytes will stack at the column front without elution, benefiting from thousands
fold pre-concentration effect and greatly ease the demand for ultra low volume/dispersion
injection system. For this reason, capillary LC and nanoscale LC see most application in
the field of proteomics where hydrophobic peptides can be pre-concentrated and
efficiently separated. For small hydrophilic bio-molecules, on column focusing is out of
the question due to their weak retention on RPLC. Despite the fact that retention of small
molecule neurotransmitters is already significantly enhanced after benzoylation, it is not
sufficient for all of them if on column focusing is to be used. Care must be taken in
matching the autosampler’s capability and internal volume to the capillary column size.
Considering the minimum aspirated volume by the autosampler is in the hundreds of nL
range, only large capillary columns, i.e., columns with i.d. ≥300 um are considered.
Extra column volume
Besides using smaller columns, miniaturized LC techniques also requires reduction of
extra column volume in proportion to column volume to reduce band broadening at low
flow rate. The original 30 gauge stainless steel ESI needle on the ionization source,
cannot be used without causing too much band broadening at low µL/min. A fused silica

79
needle with narrower i.d was used as replacement. Because Agilent API source grounds
the ESI needle assembly while applies high voltage on the MS inlet, a closed circuit can
still be formed through the stainless steel union that connects the ESI needle to the LC
outlet. The replacement non-conductive fused silica needle was proven to have
comparable sensitivity with the original stainless steel one. All other connecting tubing
was 50 µm i.d. Assuming analyte’s diffusion coefficient to be 1 X 10⁻⁵
cm2/sec and peak
width of 6 sec, the 20 cm of 50 µm post column tubing causes 10% increase in peak
width at 50 µL/min. Most of the pre-column volume was in the sample loop itself, which
was measured to be 6 µL by the instrument. Unfortunately the sample loop volume could
not be freely reduced to the desired value and contributed significantly to the band
broadening of weakly retained analytes as indicated in results discussed later.
Column comparison
Method development using capillary columns was hampered by their commercial
availability. No column with i.d between 300 µm and 500 µm packed with sub 2 µm
particles is commercially available. The closest was packed with 2 µm particles (Dionex
Pepmap 300 µm X 5 cm column). The only other column packed with high performance
particles was the Eksigent column packed with 2.7 µm HALO™ fused core media. As a
comparison, a capillary column packed with conventional 3 µm particles was also
evaluated. All three capillary columns’ performance was pitted against that of the current
microbore (1 mm i.d.) UHPLC column (1.8 µm particle). To make the above mentioned
columns of different sizes comparable, LC parameters need to be adjusted to the same
gradient steepness b. Gradient range ΔΦ, and gradient time tG were also maintained the

80
same. Only flow rate F was adjusted according to various column void volume Vm using
equation 4.4.
b = ΔΦ S Vm/tG F (Equation 4.4)
S is the constant for a given compound at fixed experimental conditions, approximately
equals to 0.25 MW 0.5
Meanwhile, injection volume Vinj was also adjusted according to equation 4.1. Respective
Vinj and F of different columns were listed in Table 4.1.
The chromatograms of these columns (Figure 4.1) showed roughly the same spacing and
exact elution order as expected110
. Due to the peak compression effect, peaks in gradient
LC usually have the same width, unlike that of isocratic LC where later peaks are
broader111
. But the early eluting peaks of some capillary columns were significantly
broader than the late eluters, indicating pre-column band broadening, which affected the
weakly retained analytes more than the strongly retained ones112
. Relatively large sample
loop caused mixing of low or sub µL sample plug to mix with transfer solvent (m.p.A),
resulting in bigger sample injection plug than desired. The fused core particles have less
than half of the surface area compared to fully porous ones26
, therefore retention of the
already weakly retained amino acids would have been even less. Despite the HALO™
column’s bigger size (500 µm i.d.) compared to the Pepmap and Atlantis (both 300 µm
i.d.), the band broadening of early eluting amino acids on the fused core particle column
was still obvious. As the smallest column, the Pepmap column also suffered from
relatively large extra column volumes. The Atlantis dC18 column, which had the largest
stationary phase surface area among all three capillary columns, was not affected by pre-

81
column band broadening as much. Plumbing issue aside, column efficiency at the same
gradient steepness also differed. Surprisingly, the 2 µm particle column failed to be an
improvement over column with 3 µm particles, despite its smaller size corresponded to
smaller C term. The disparity between theory and experimental results might be due to
larger size distribution of the 2 µm particles or the packing heterogeneity. The fused core
particle column was the best among all three capillary columns tested. The later eluting
analytes had slightly broader peak width compared to the 1 mm UHPLC column packed
with sub 2 µm particles. It can be expected that if the pre-column dispersion could be
satisfactorily resolved, the HALO™ capillary column would provide high efficiency
separation approaching the current UHPLC method described in chapter 2 (Figure 4.2),
but consuming only 1/4 of amount of sample and mobile phase. The analytes’ peak
height of each column was different, contrary to the well established knowledge that ESI-
MS is a concentration sensitive technique. The reason for lowered sensitivity on smaller
columns was due to the lack of xyz position adjustment system on the API source (ESI
emitter could not be placed closer to the MS inlet at lower flow rate).

82
Figure 4.1 Parallel comparison of four HPLC columns for gradient separation of 10
neurotransmitters. All columns were operated at the same gradient steepness. Detailed
LC parameters were listed in Table 4.1. All chromatograms are on the same time scale.
Analyte key: 1. Tau; 2. Ser, 3. Asp; 4. Gly; 5. Glu; 6. GABA; 7. HVA; 8. 5-HT; 9. NE;
10. DA.
0.0E+00
5.0E+02
1.0E+03
1.5E+03
2.0E+03
2.5E+03
3.0E+03
Pepmap
0.0E+00
5.0E+02
1.0E+03
1.5E+03
2.0E+03
2.5E+03
3.0E+03
3.5E+03
4.0E+03
4.5E+03dC18
0.0E+00
1.0E+03
2.0E+03
3.0E+03
4.0E+03
5.0E+03
6.0E+03
7.0E+03
8.0E+03
9.0E+03 Halo
0.0E+00
5.0E+03
1.0E+04
1.5E+04
2.0E+04
2.5E+04
3.0E+04
HSS T3
0 2 4 6 8 10
Time (min)
inte
nsity
1
2
3-5
6
7
8 9
10
inte
nsity
inte
nsity
inte
nsity

83
Figure 4.2 Comparison of peak width of early eluting GABA and late eluting DA under
different LC conditions. Blue trace was obtained by running fast gradient separation (tG
3.5 min) on HALO™ column. Red trace was obtained by running regular gradient
separation (tG 7 min) on HSS T3 column. Green trace was obtained by running regular
gradient separation (tG 7 min) on HALO™ column. Note that the y axis was normalized
value. The peaks of the same analyte from different LC runs were aligned to have the
same peak center.
Increased LC speed and limitations
The best capillary column, the HALO™ (500 µm X 10 cm), was selected for further high
speed optimization. The highest flow rate tested on this column was 50 µL/min, which
0
20
40
60
80
100
120
0.58 0.68 0.78 0.88
%
Time (min)
GABA
Halo 3.5 min
HSS 7 min
Halo 7 min
0
20
40
60
80
100
120
0.75 0.85 0.95 1.05
%
Time (min)
DA
Halo 3.5 min
HSS 7 min
Halo 7 min
84
produced maximum backpressure ~ 8000 psi at 27oC. Highest flow rate achievable was
limited by the mechanical strength of the packing material, which could withstand up to
9000 psi, and the pressure capability of the LC instrument (10,000 psi ). The option of
higher temperature to column backpressure was not pursued because it also reduced
retention of amino acids, exacerbated the pre-column band broadening issue. At the
highest flow rate/linear velocity permitted, the gradient time tG was reduced to 3.5 min
while maintaining the same peak spacing. The peak capacity in the shortened LC method
was reduced compared to longer runs, as shown in Figure 4.3. This result indicated the
increasing toll taken by mass transfer resistance. Although peaks did get sharper at higher
flow rate (Figure 4.2), the reduction of peak width was not two fold as gradient time tG
was halved.
Figure 4.3 Chromatograms of 7 min gradient at 25 µL/min (top) and 3.5 min gradient at
50 µL/min (bottom) using HALO™ 500 µm X 10 cm column.
0.0E+00
1.0E+03
2.0E+03
3.0E+03
4.0E+03
5.0E+03
6.0E+03
7.0E+03
8.0E+03
9.0E+03
0 2 4 6 8 10
25 µL/min
0.0E+00
5.0E+03
1.0E+04
1.5E+04
2.0E+04
2.5E+04
3.0E+04
0.4 1.4 2.4 3.4 4.4
50 µL/min
1
2
3,4
5
6
7
8 9 10
Time (min)
inte
nsity
inte
nsity

85
In addition to the loss of peak capacity, approximately 50% loss of concentration
sensitivity was observed running the 3.5 min capillary LC method compared to the 7 min
microbore LC method (Figure 4.4).
Figure 4.4 Loss of concentration sensitivity of the 3.5 min capillary LC method (blue
trace) compared to the 7 min microbore LC method (red trace). Injection volume was
adjusted for column void volume. Detailed parameters were listed in Table 4.1.
The ESI sensitivity at 50 µL/min was verified to be the same as 100 µL/min by post
column flow splitting experiment (data not shown). The comprise in sensitivity by
running the fast capillary LC method can be explained by chromatographic dilution factor
D, the ratio of initial sample concentration C0 and the peak maximum concentration
Cmax101
.
(Equation 4.5)
0.0E+00
1.0E+01
2.0E+01
3.0E+01
4.0E+01
5.0E+01
6.0E+01
7.0E+01
8.0E+01
9.0E+01
1.0E+02
0 1 2 3 4 5 6 7 8 9 10
ACh
0.0E+00
2.0E+03
4.0E+03
6.0E+03
8.0E+03
1.0E+04
1.2E+04
1.4E+04
0 1 2 3 4 5 6 7 8 9 10
GABA
0.0E+00
1.0E+03
2.0E+03
3.0E+03
4.0E+03
5.0E+03
6.0E+03
7.0E+03
0 1 2 3 4 5 6 7 8 9 10
HVA
0.0E+00
2.0E+02
4.0E+02
6.0E+02
8.0E+02
1.0E+03
1.2E+03
1.4E+03
1.6E+03
0 1 2 3 4 5 6 7 8 9 10
DA
Time (min) Time (min)
inte
nsity
inte
nsity
86
ε is the column porosity, r is the column radius, k is the retention factor, L is the column
length, H is peak height and N is the plate number. The injection volume Vinj was already
adjusted for column void volume Vm. Assuming the same retention factor k between the
HALO™ 500 µm X 10 cm column and the HSS T3 1 mm X 10 cm column, the dilution
factors of these two columns were inversely proportional to N1/2
. Plate number N is
proportional to the square of the ratio of retention time tR and peak width W.
(Equation 4.6)
Thus the dilution factors are proportional to W/tR
(Equation 4.7)
The peak widths between the two LC methods were roughly the same (Figure 4.2). But
the retention time of the fast LC method was about half of that of the slower LC method.
So the dilution factor of the fast capillary LC method was two times of that of the slower
microbore LC method. The two fold chromatographic dilution agrees with two fold loss
in concentration sensitivity. However, considering only ¼ sample volume was injected on
the capillary column, the mass sensitivity of the fast capillary LC method was still twice
better than that of the microbore LC method.
Application for in vivo monitoring and practical aspects
Rat dialysate samples was used to evaluate the new method’s suitability for in vivo
monitoring. The whole LC-MS cycle, including column equilibration, sample loading
and injection, was now halved from original 12 min of current method to 6 min.
Although 2.4 µL fraction was collected, only 0.5 µL was consumed for analysis. All
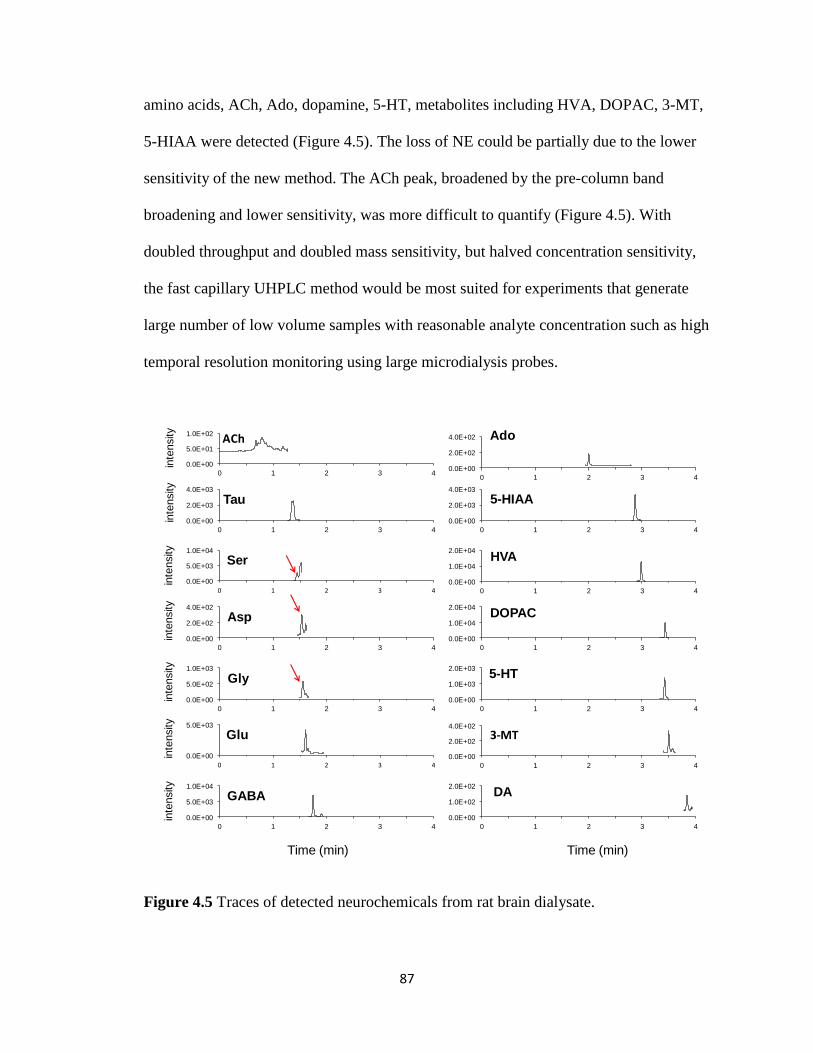
87
amino acids, ACh, Ado, dopamine, 5-HT, metabolites including HVA, DOPAC, 3-MT,
5-HIAA were detected (Figure 4.5). The loss of NE could be partially due to the lower
sensitivity of the new method. The ACh peak, broadened by the pre-column band
broadening and lower sensitivity, was more difficult to quantify (Figure 4.5). With
doubled throughput and doubled mass sensitivity, but halved concentration sensitivity,
the fast capillary UHPLC method would be most suited for experiments that generate
large number of low volume samples with reasonable analyte concentration such as high
temporal resolution monitoring using large microdialysis probes.
Figure 4.5 Traces of detected neurochemicals from rat brain dialysate.
0.0E+00
5.0E+01
1.0E+02
0 1 2 3 4
ACh
0.0E+00
2.0E+03
4.0E+03
0 1 2 3 4
Tau
0.0E+00
5.0E+03
1.0E+04
0 1 2 3 4
Ser
0.0E+00
2.0E+02
4.0E+02
0 1 2 3 4
Asp
0.0E+00
5.0E+02
1.0E+03
0 1 2 3 4
Gly
0.0E+00
5.0E+03
0 1 2 3 4
Glu
0.0E+00
5.0E+03
1.0E+04
0 1 2 3 4
GABA
0.0E+00
2.0E+02
4.0E+02
0 1 2 3 4
Ado
0.0E+00
2.0E+03
4.0E+03
0 1 2 3 4
5-HIAA
0.0E+00
1.0E+04
2.0E+04
0 1 2 3 4
HVA
0.0E+00
1.0E+04
2.0E+04
0 1 2 3 4
DOPAC
0.0E+00
1.0E+03
2.0E+03
0 1 2 3 4
5-HT
0.0E+00
2.0E+02
4.0E+02
0 1 2 3 4
3-MT
0.0E+00
1.0E+02
2.0E+02
0 1 2 3 4
DA
Time (min) Time (min)
inte
nsity
inte
nsity
inte
nsity
inte
nsity
inte
nsity
inte
nsity
inte
nsity

88
Conclusion
In this chapter, we explored the possibility of further improving the throughput of
the LC-MS method described in Chapter 2. Large capillary column packed with high
efficiency fused core particles was proved to be a suitable platform for this purpose.
Operating at very high linear velocity (10 mm/sec), gradient time was reduced to 3.5 min
with acceptable peak capacity. On the other hand, the difficulty of fitting a smaller
sample loop (< 2 µL) caused band broadening of early eluting analytes, reduced their
chromatographic resolution and sensitivity. The smaller C term of fused core particles
still did not fully compensate for the loss of efficiency due to mass transfer resistance.
Several steps need be taken to fully utilize the advantage of fast capillary UHPLC
separation. The internal volume of the capillary UHPLC instrument and connecting
tubings need to kept at minimum to reduce the extra column effect. More efficient
column is still needed to mitigate the loss of separation power due to mass transfer
resistance at high flow velocity. Higher pressure capability of the instrument (> 10,000
psi) will be desirable as both the high efficiency columns and narrow tubings causes
increased backpressure. Fast LC separation also placed stringent requirement on the mass
spectrometer. The internal volume of the ESI needle need to be small enough as not to
cause significant increase in peak width. The mass spectrometer will need to be able to
achieve cycle time less than 100 ms with adequate sensitivity to provide enough data
points for each peak.

89
CHAPTER 5.
FUTURE DIRECTIONS
In this dissertation, we describes two mass spectrometry approaches for in vivo
neurochemical monitoring. Online HPLC coupled to MS allows separation of
interferences, enabling comprehensive determination of all classical neurotransmitters in
one run. State of the art high speed LC technologies were employed to increase the
throughput of sample analysis. Stable isotope labeled internal standard was also used to
improve the accuracy and consistency of the analysis. In the second approach, an
elaborate segmented flow liquid handling setup replaced HPLC to enable high temporal
resolution online MS monitoring of acetylcholine, choline and drugs in brain. Sensitivity
was compromised due to lack of liquid phase separation, but was still sufficient to detect
basal analyte levels and capture fast in vivo chemical changes in the brain at 5 second
temporal resolution. The technologies developed in the above mentioned projects can be
further refined and expanded into other areas with improved analytical performance.
Benzoylation of Neuropeptides
Neuropeptides are the largest class of neurotransmitters. Over 200 different
neuropeptides are involved in signaling in the brain113
. Highly sensitive and specific LC-
MS methods are becoming increasingly popular for detection of neuropeptides in
dialysate12
. Due to peptides’ low pM concentration in dialysate samples, nanoLC-tandem
MS setup with pre-concentration and nanospray are commonly used to boost the

90
sensivity108
. Benzoylation LC-MS described in chapter 2 and chapter 4 focused only on
classical small molecule neurotransmitters. Preliminary data showed that neuropeptides
such as enkaphalins can also be benzoylated at the N terminus, lysine and tyrosine side
chains. Figure 5.1 shows the chromatographic trace of doubly benzoylated leu-enkaphalin
and its MS/MS spectrum. The main advantage of pre-column benzoylation for peptides is
not increase in hydrophobicity, because the peptides are usually hydrophobic enough for
large ratio pre-concentration and excellent ESI response. The major benefit is the ability
of incorporating an isotopic tag to these molecules to obtain stable isotope internal
standard. Custom synthesized stable isotope incorporated peptides are very expensive and
not stable for extended period of time. Not all LC-MS methodologies use these internal
standards peptides routinely, leaving matrix effects and instrument drift unaccounted for.
Another possible advantage of benzoylating peptides after sample collection is the
improved stability. It has been noted that neuropeptides such as the enkaphalins and
angiotensin collected in dialysate degrade rapidly even under refrigerated conditions108,
114. If the cause of degradation is the peptidase in the environment, chemical modification
of the peptides could potentially protect them from decomposing115
. Following the same
derivatization protocol as the small molecules, the LOD of doubly benzoylated leu-
enkaphalin was 0.5 nM on the Quattro Ultima, similar to that of monoamines. With the
new Agilent 6410 QqQ, which was proven to be > 50 fold more sensitive, it is not
unreasonable to expect a LOD of ~ 10 pM for Bz2-leu-enkaphalin. This level of
sensitivity would allow reproducible detection of neuropeptides sampled in vivo, together
with all the classical neurotransmitters. This will be another step forward in monitoring
neurochemicals in vivo. Preliminary results also showed that under conditions optimized

91
for small molecules, the yield of fully benzoylated leu-enkaphalin was not 100%. Both
unlabeled and singly labeled peaks were observed. Use of the succinimidyl ester of
benzoyl chloride (N-benzoylsuccinimide, or 1-benzoyl-pyrrolidine-2,5-dione by Sigma-
Aldrich) is likely to produce more uniform labeling. Reacting at slower rate and lower pH,
succinimidyl esters label peptides with good yield sometimes approaching or exceeding
90% and is a very popular chemistry for amine labeling. Driving reaction towards
completion will further improve the sensitivity of benzoylated neuropeptides.
Figure 5.1 Chromatographic traces of doubly benzoylated leu-enkaphalin (left) and its
MS/MS spectrum (right). 50 nM unlabeled leu-enkaphalin was mixed with borate buffer
and benzoyl chloride solution at 1: 0.5: 0.5 ratio at room temperature. 5 µL of reaction
mixture was injected on 1 mm X 10 cm HSS T3 1.8 µm UHPLC column. Data was
obtained using Waters nanoAcquity UHPLC coupled to Quattro Ultima QqQ.
Acetylcholine MS Sensor with Higher Spatial and Temporal Resolution
As explained in Chapter 3, the temporal performance of ACh MS sensor current
setup is partially limited by the microdialysis. Its internal volume causes mixing of
dialysate prior to segmentation, limiting the temporal resolution to the low seconds
level10
. Low flow push pull perfusion, as an alternative sampling technique, has no such
limitations and was demonstrated to be capable of sub second temporal resolution98
.
0
50
100
150 250 350 450 550 650 750
%
m/z
y2y3
b1
y4b2
b3
b4
0
10000
20000
30000
40000
0 2 4 6 8
Inte
nsit
y
Time (min)
Bz-leu-enk
50 nM

92
Nano or micro electrospray setup which is capable of lower flow rate is needed to
analyze low nL droplets formed by push pull perfusion.
Figure 5.2 System for high temporal resolution sampling. (A) Droplet generation using
push-pull perfusion setup; (B) in vitro experiment demonstrating 0.2 s temporal
resolution98
. Reproduced with permission from ACS.
MS Sensor for Other Neurotransmitters
There is potential for other small molecule neurotransmitters to be detected using
the droplet microdialysis-mass spectrometry setup similar to ACh. Preliminary data
showed that elevated level of adenosine can be detected from the brain in vivo (Figure
5.3). But as it dropped down to basal level, the sensitivity of the same setup no longer
suffice. A more sensitive mass spectrometer or ionization method will allow the MS
sensor detect basal level in vivo adenosine. Amino acid neurotransmitters lacked the
permanent ion group or hydrophobicity of ACh and adenosine. Their ESI-MS sensitivity
and ability to overcome ionization suppression is much inferior. To use the MS sensor
method, they need to be derivatized to enhance ESI response. In addition to enhancing
the ESI-MS delectability of amino acids by increasing the hydrophobicity or charge

93
derivatization, reagent itself should not cause too much suppression when it is used in
excess.
Figure 5.3 Adenosine signal detected by mass spectrometry “sensor” in vivo. Elevated
level of adenosine following microdialysis probe implantation can be detected by same
setup used as ACh MS sensor. But detecting basal adenosine needs more sensitivity.
Quantitative Metabolomics Using C12/C13 Differential Benzoylation
Because of the availability of 13
C6 benzoly chloride, the benzoylation reaction
could be applied to the field of quantitative metabolomics where differential isotope
labeling is a powerful tool. As previously mentioned, matrix effect hampers the
quantitative results of LC-MS analysis. Use of stable isotopes is generally considered to
be the golden standard to overcome such a problem. Compared to purchasing individual
stable isotope incorporated standard for all metabolites of interest, differential isotope
labeling uses light and heavy reagent to tag the same metabolites in different samples.
The chemical labeling step derivatize the same functional group of multiple metabolites,
0
50
100
0 50 100
%
Time (min)
0
50
100
7 8 9
0
50
100
73 74 75
Probe implantation

94
thus presents a more economical and universal approach60, 116, 117
. Compared to
previously reported differential labeling methods, benzoyl chloride labeling has some
unique qualities. First of all, both light and heavy reagents are both commercially
available at relatively cheap price, saving the hassle of in house synthesis. Secondly, it is
a very reactive and universal reagent. Benzoyl chloride not only labels primary,
secondary amines, phenols, but to a less degree, hydroxyl groups, the yield of which can
be improved be performing the reaction in a non aqueous environment. Diverse class of
metabolites, including amines, phenols and steroids can be benzoylated under appropriate
conditions. Third, the product is more stable due to the structural simplicity of benzoyl
group. It does not degrade upon exposure to light, unlike reagents originating from
fluorescent tags. Fourth, the benzoyl tag is of intermediate hydrophobicity. Smaller
isotopic tags such as dimethyl or diethyl labeling do not afford enough hydrophobicity of
polar metabolites for reversed phase LC separation, while retention of some bigger tags
may be excessive and can cause elution problems.
Metabolomics study used high resolution mass spectrometer, some at fullscan
mode after differential isotope labeling60
, others at data dependant MS/MS mode118
. The
former gave high confidence identification of metabolites, but produced very large data
sets. The extraction of chromatographic peaks has to be done using software. Labeled
metabolites, unlabeled metabolites, background ions were all picked up and integrated.
The un- discriminative data processing demanded high computing power and could
potentially result in overlooking the low level analytes of interest. Isobaric labeling and
data dependant MS/MS acquisition allowed simultaneous quantitative analysis of
multiple samples and reduced the data size. But it also overlooked the low abundance

95
ions and placed high demand on the MS acquisition speed, especially when online high
speed LC was used.
Here we propose a method that combines the elements of both high resolution
fullscan and MS/MS acquisition but has unique advantages. Initial sample preparation
was the same as previous methods. Two samples under different treatment are labeled
with light and heavy benzoyl chloride respectively and mixed prior analysis (Figure 5.4).
Figure 5.4 Workflow of metabolomics experiment using differential benzoylation and
parallel MS acquisition.
The MS analysis is of two steps. In the first step, HPLC is coupled to QqQ
operating at parent scan mode for daughter ion 105 (C12 benzoyl group) and 111 (C13
benzoyl group) (Figure 5.5).
Online LC-MS
+
Droplet fraction collection
Offline droplet infusion-High resolution MS
Amine/phenol
metabolites
6C12 BzCl
labeling
6C13 BzCl
labeling
Mix

96
Figure 5.5 Experimental setup (A) and data (B) obtainable from online HPLC with QqQ
in parent ion scan mode. The same metabolite molecules in two samples are labeled with
light and heavy benzoyl groups respectively, which co-elute on the chromatogram but
differentiate on the mass spectrum.
At the same time, a small portion of the LC effluent (1-10 µL/min) will be
diverted to a tee where it is mixed with immiscible oil to form droplets similar to the
fashion described in chapter 3 (Figure 5.6 A). Droplet fraction collection allows complete
preservation of separation resolution. In the second MS step, droplets containing tubing
is connected to a high resolution mass spectrometer and the LC effluent segmented by oil
droplets is directly pumped through the ESI and analyzed by the MS (Figure 5.6 B).
0
50
100
%
m/z
0
50
100
%
Time (min)
m/z 200-1200 m/z 105, 111
MW+n*104+1
A
B
MW+n*110+1
tR

97
Figure 5.6 Two step metabolomics MS experiment coupled by droplet LC fraction
collection. A small fraction of online LC effluent is collected as oil segmented droplets
while the majority is diverted to the QqQ (A). The droplets are then pumped into a high
resolution MS (B). Since segmentation prevented mixing of droplet content, the LC
resolution is preserved. The chromatographic “peak” is made of individual droplet signal.
As the data from the first step MS experiment being processed, labeled
metabolites will be picked up by software such as XCMS, same way as previously done.
The ones that changes will be identified by statistics and a list of candidates is generated.
From the mass difference between the light and heavy species, we will be able to know
the number of functional groups and the nominal molecular weight. Then the high mass
resolution data from the second step fullscan MS experiment will be examined using the
known nominal mass of the candidate metabolites. The high mass resolution and
accuracy will allow further narrowing down candidate metabolites. Once a tentative
identification is made, standard compound can be obtained to compare retention time tR
for further confirmation.
QqQ
oil
9 13 17min
Micro-column
LC
Nominal mass, # of
amine/phenol groups, tR
Reflc. TOF,
FT-ICR,
OrbitrapSyringe pump
3.7 4.7 5.7 6.7
6.1 6.3 6.5
min
Accurate
mass, tR
A
B

98
Since all small molecules produced characteristic benzoyl group fragment ion,
only the benzoylated metabolites will generate signals on the MS. This protocol
eliminates background ions and non-labeled species. Doing so reduces the data size and
complexity, it will easier for the software to pick up from much fewer features contained
in the raw data. The parent ion scan does not discriminate low abundance ions like the
data dependant acquisition. So their chance of being identified should be improved both
from the data acquisition point of view and data processing part. Metabolite identification
also benefits from the use of high mass resolution data. But processing of such data can
be easily done manually because the list of candidates with their nominal mass is already
generated from the low resolution QqQ data. Only a few targeted m/z will be looked at.
Droplet fraction collection has convincingly demonstrated its ability of preserving
chromatographic resolution96
(also Appendix A). This simple arrangement eliminated the
need of setting up another HPLC instrument to the high resolution MS while ensuring
identical chromatographic information (Figure 5.6). It requires no additional LC-MS runs
or sample consumption. One injection will suffice in obtaining all information from one
sample.
99
APPENDICES
Appendix A: Droplet nanoLC Fraction Collection
HPLC effluent fraction collection allows more flexible analysis of separated
analytes. It is commonly done by transferring LC effluent to individual containers. For
nano LC separation, the conventional approach is no longer feasible due to evaporation
and handling problems associated with nL volume fractions. nanoLC fraction collection
in droplet format was reported and showed its ability to couple with slower offline
analysis without losing much chromatographic resolution96
. Here we further expanded
this methodology to demonstrate its compatibility with both slow or fast MS detection.
Negative ion electron capture dissociation (niECD) is a novel MS/MS mode that
is advantageous in analyzing negatively charged bio-molecules with labile functional
group such as phosphorylated peptides. niECD, at its current stage of development, takes
several seconds to obtain one high quality spectrum, which makes it not readily
compatible with high efficiency online HPLC separation. But with droplet fraction
collection and offline infusion, longer MS acquisition was possible without excessive loss
of chromatographic resolution. Each chromatographic peak was segmented into five to
six ~30 nL droplets. When infused at 20 nL/min into the FTICR MS for niECD, each
droplet lasted more than 1 min to allow more acquisition time for niECD.

100
Sample: 5 uM phosphopeptide mixture from Anaspec (Bovine ß-Casein, PKA Regulatory
Subunit II Substrate, UOM9, Phosphorylated PKC Substrate-3, DAM1 [221-241] peptide,
Kinase Domain of Insulin Receptor-singly phosphorylated, Kinase Domain of Insulin
Receptor-triply phosphorylated). PKA Regulatory Subunit II substrate signal low,
sometimes not observed.
LC condition: column 75 um X 10 cm packed with Waters dC18 3um particle, m.p. A: 10
mM ammonium formate, 0.15% formic acid, B: 0.15% formic acid in MeOH, 0% to 70 %
m.p.B in 22 min, flow rate 340 nL/min, injection volume ~ 40 nL.
Droplet generation: LC effluent was mixed with oil by a 1/16” microvolume tee (Valco,
MT1XCPK). Capillary column was adapted to the tee using 1/16” Teflon sleeve. Droplet
was collected in 250 um i.d. 1/16” o.d. tubing (IDEX). LC effluent ~340 nL/min, oil 150
nL/min, droplet size ~30 nL.
Droplet analysis condition on FTICR: initial flow rate 100 nL/min, upon elution of the
first peptide containing droplet, flow rate dropped to 20 nL/min to facilitate niECD.
Spray tip was 20/360 um with 5 um opening from New Objective (FS360-20-5-CE).
Droplet containing tubing was adapted to spray tip by a reducing union (IDEX, P882).
Voltage was applied by attaching wires to the conductive tip front.

101
Figure A.1 niECD performed by peak parking using droplet capillary LC fraction
collection. Phosphopeptide ion trace in droplet format (A) responded to that obtained
from online capillary LC-MS (B). niECD spectrum (C) was obtained from DAM1
contained in a single droplet.
In cases where the mass spectrometer is capable of fast scanning, the LC effluent
in droplet format can be analyzed at high speed with the chromatographic resolution
intact.
Sample: dansylated amino acids, taurine and GABA, each at 50 µM. 20 mg/mL dansyl
chloride was made in acetonitrile. The labeling reaction was carried out by mixing amino
acid standard with 100 mM sodium tetraborate (in water) and dansyl chloride solution at
1:1:1 volume ratio. Reaction mixture was kept at 60oC for 30 min.
LC condition: column 75 um X 10 cm packed with Waters dC18 3um particle, m.p. A: 10
mM ammonium formate, 0.15% formic acid, B: 0.15% formic acid in MeOH, 0% to 70 %
m.p.B in 22 min, flow rate 340 nL/min, injection volume ~ 40 nL
14 16 18 20 2212
70 80 90 100 110
B
A C
A. RIC of phosphopeptides in droplet format analyzed offline
B. online nanoLC-MS of phosphopeptides
C. niECD spectrum of a single droplet containing phosphopeptide DAM1
Time (min)

102
Droplets generation: LC effluent was mixed with oil by a 1/16” microvolume tee (Valco,
MT1XCPK). Capillary column was adapted to the tee using 1/16” Teflon sleeve. Droplet
was collected in 250 um i.d. 1/16” o.d. tubing (IDEX). LC effluent ~340 nL/min, oil 300
nL/min, each peak segmented into ~ 10 droplets.
MS acquisition: online nanoLC-MS performed on LCQ in fullscan mode, positive
nanoESI, droplets infusion on QqQ at 2.4 µL/min. QqQ operated in MRM mode at ~ 19
Hz. Each droplet got ~ 10 data points. nanoESI source was installed on QqQ. Cone gas
150 L/Hr, nebulizing gas 50 L/Hr, source temperature 100 oC. spray tip was fabricated in
house from 75/360 µm fused silica capillary, etch to have an opening of ~ 30 µm.
Voltage was applied at the end of the tip by a 1/16” metal union. Tip was adapted to the
union via a fused silica adapter ferrule (Valco, FS1.3PK-5).
Figure A.2 Fast capillary LC fraction analysis by MS in droplet format.
Chromatographic resolution of online LC (top) was fully preserved by the droplet format
(bottom).
Time (min)
3 5 7 9 11 13
9 11 13 15 17 19
6.1 6.3 6.5
Dns-Tau Dns-GABA
Dns-TauDns-GABA

103
Droplet infusion rate was ~3.75 fold of original combined oil + effluent flow rate
(300 nL/min + 340 nL/min). The separation time of online nanoLC was ~ 3.47 fold of
that of fast offline droplet analysis. The difference between observed value and expected
value is likely due to inaccuracy of nanoLC flow rate measurement .
Appendix B: MALDI-TOF Amino Acids Analysis
Matrix assisted laser desorption (MALDI) is another popular soft ionization method for
mass spectrometry and is widely used in bio-analysis. Compared to continuous ESI,
MALDI is pulsive ionization method and is more tolerant to ionization suppression.
Although in many cases, desalting is still needed for high quality spectrum. One
disadvantage of MALDI is the high background ions associated with the matrix in the
low mass range obscuring small molecule signal. We adapted a charge derivatization
method that shifted m/z of amino acids to above 500 and allowed us to detect multiple
amino acids from rat brain dialysate.
Figure A.3 Mass spectrum of amino acids from rat brain dialysate. 1. Combined signal of
Leu/Ile 2nd isotopic peak + Asn; 2. Combined signal of Asn 2nd isotopic peak + Asp; 3.
Combined signal of Gln/Lys 2nd isotopic peak + Glu.
GABA
Gly
Tau

104
Sample preparation: 1 µL dialysate was mixed with 1 µL 20 mM sodium tetraborate (in
water) and 1 µL 0.12mM TMPP-Ac-OSu (in ACN). After 30 min reaction at room
temperature, mixture was added equal volume of matrix solution (CHCA 10 mg/mL 50%
0.1% TFA in water 50% MeOH), and 1 µL was deposited on MALDI plate.
Mass spectrometry: Micromass MALDI Tofspec-2E, reflectron mode. Operating voltage:
20 kv, positive, suppression 500 AMU, pulse time 39, pulse voltage 2200 V. Sampling
rate 2 G Hz, sensitivity 300 mV, shorts 5, mass range 1000
11 amino acids (Gly, Ala, Ser, Val, Thr, Tau, Leu/Ile, His, Phe, Tyr, Trp) can be
unequivocally detected within 1-2 s from less than 100 nL of rat brain dialysate. No salt
adduct signal was observed due to the permanent charge fixed on the molecule by
derivatization. Due to the limited mass resolution of this instrument, amino acids which
are 1 Da apart in molecular weight such as the group of Gln/Glu and Leu/Asn/Asp could
not be differentiated due to isotopic distribution. Minimum resolution of 36, 000 is
required to tell these amino acids apart from each other. The sensitivity of GABA was not
adequate for routine analysis. Despite these limitations for in vivo neurotransmitter
monitoring, this method with some modifications is suitable for other areas such as
newborn PKU screening to take advantage of its simplicity, high throughput and low
sample consumption. With high resolution tandem MS instrument, Caprioli’s group used
the same reaction for neurotransmitter imaging of rat brain119
.
Appendix C: LC-MS Method of Water Soluble Vitamin Analysis
Column: Waters Atlantis T3 3 µm, 1 mm X 15 cm
Temperature: 27 oC

105
Mobile phase: A. 10 mM ammonium formate, 0.15% formic acid in water; B. 10 mM
ammonium formate, 0.15% formic acid in methanol
Gradient: 0-5 min, 0-50% m.p.B; 5-7min, 50-70% m.p.B
Flow rate: 50 µL/min
Injection volume: 2 µL
Sample preparation: extracted from tear strips using 50 uL of mobile phase A. 30 uL of
extract was placed in autosampler vials for LC-MS analysis.
Table A.1 MS acquisition conditions for water soluble vitamins
Analyte Parent Ion Daughter Ion Dwell Time (ms) Frag (V) CE (V) Cell Acc (V) Polarity
B1 265.1 122.1 50 125 10 7 Positive B6 pyridoxine 170.1 134.1 50 125 15 7 Positive
B6 pyridoxamine 169.2 134.1 50 125 15 7 Positive B6 pyridoxal 168.1 150.1 50 115 10 7 Positive
B3 NA 124.1 80.1 50 135 20 7 Positive B3 123.1 80.1 50 125 10 7 Positive
B12 678.7 147.2 50 155 35 7 Positive B9 442.1 295.1 50 115 10 7 Positive B2 377.1 243 50 115 20 7 Positive B7 245.1 227.2 50 115 10 7 Positive B5 220.1 90.1 50 115 10 7 Positive

106
Figure A.4 Overall chromatogram of 11 waters soluble vitamin standard using finalized
LC-MS method. 1.B6 pyridoxamine; 2. B1; 3. B3 nictonic acid (NA) and B6 pyridoxal; 4.
B6 pyridoxine; 5. B3 nicotinamide (NM); 6. B5; 7. B12; 8. B9; 9. B7; 10. B2.
Appendix D: Common LC-MS Instrument Troubleshooting
Quattro Ultima Mass Spectrometer
Reset communication:
1. Press windows key + R on the keyboard
2. Type in “telnet epc” from the command window that pops up
3. Type in “reboot” in the DOS window to reboot the embedded computer in the mass
spectrometer. 3 beeping sound will be heard.
4. Check re-establishment of communication by press windows key + R and type in
“ping-epc”. Communication is established after the response time is less than 1 ms.
nanoAcquity UHPLC
1
2
34
5
6 78 9
10
107
Calibrating loop and needle volume:
Often when a new sample loop or needle is fitted, the autosampler fails to perform the
required volume calibration. This is primarily due to the un-coordinated movement of the
wash syringes and sample syringes. For 5 µL sample loops, loop and needle volume
calibration can be successfully performed after the following steps
1. Power down the autosampler
2. Open the instrument panel cover
3. Re-connect the bubble detector’s cable
4. Power up the autosampler and redo the volume calibration
Operating at flow rate below 50 µL/min:
Another curious feature of the nanoAcquity is its flow meter feedback mechanism. By
default, ~ 20 cm long 25 µm i.d. PEEKSil tubing is used to connect the two flow meters
(one for each mobile phase) to the mixing tee. However, this narrow tubing causes too
much backpressure (> 1000 psi) when high flow rate (> 50 µL/min) is used and is
replaced by bigger i.d. tubing for running LC method at 100 µL/min. Interestingly, when
bigger tubing is used to connect the flow meter to the mixing tee in solvent line B, B
pump does not deliver the right amount of m.p.B at flow rate below 20 µL/min. Thus for
running gradient LC methods with flow rate ≤ 50 µL/min, the 25 µm i.d. tubing is still to
be used to ensure the correct delivery of gradient.
108
REFRENCES
(1) Aebersold, R., Mann, M. Nature 2003, 422. 198-207.
(2) Dettmer, K., Aronov, P. A., Hammock, B. D. Mass Spectrom. Rev. 2007, 26. 51-78.
(3) Raman, R., Raguram, S., Venkataraman, G., Paulson, J. C., Sasisekharan, R. Nat. Methods 2005,
2. 817-824.
(4) Nadja B. Cech, C. G. E. Mass Spectrom. Rev. 2001, 20. 362-387.
(5) Stroobant, E. d. H. a. V. Mass Spectrometry - Principles and Applications. 3 ed.; John Wiley &
Sons, Ltd: Chichester, UK, 2007.
(6) Mark F. Bear, B. W. C., Michael A. Paradiso Neuroscience Exploring the Brain. 3rd ed.;
Lippincott Williams & Wilkins: Baltimore, MD, 2007.
(7) Schultz, K. N., Kennedy, R. T. Annu. Rev. Anal. Chem. 2008, 1. 627-61.
(8) Venton, B. J., Robinson, T. E., Kennedy, R. T. J. Neurochem. 2006, 96. 236-246.
(9) Lada, M. W., Vickroy, T. W., Kennedy, R. T. Anal. Chem. 1997, 69. 4560-4565.
(10) Wang, M., Slaney, T., Mabrouk, O., Kennedy, R. T. J. Neurosci. Methods 2010, 190. 39-48.
(11) Boyd, B. W., Witowski, S. R., Kennedy, R. T. Anal. Chem. 2000, 72. 865-871.
(12) Perry, M., Li, Q., Kennedy, R. T. Anal. Chim. Acta 2009, 653. 1-22.
(13) Miao, H., Rubakhin, S. S., Sweedler, J. V. Anal. Chem. 2005, 77. 7190-7194.
(14) Shou, M. S., Ferrario, C. R., Schultz, K. N., Robinson, T. E., Kennedy, R. T. Anal. Chem. 2006,
78. 6717-6725.
(15) Wang, M., Roman, G. T., Schultz, K., Jennings, C., Kennedy, R. T. Anal. Chem. 2008, 80. 5607-
5615.
(16) Hows, M. E. P., Lacroix, L., Heidbreder, C., Organ, A. J., Shah, A. J. J. Neurosci. Methods 2004,
138. 123-132.
(17) Zhang, M. Y., Beyer, C. E. J. Pharm. Biomed. Anal. 2006, 40. 492-499.
(18) Zhang, X. Z., Rauch, A., Lee, H., Xiao, H. B., Rainer, G., Logothetis, N. K. Rapid Commun.
Mass Spectrom. 2007, 21. 3621-3628.
(19) Ji, C. J., Li, W. L., Ren, X. D., El-Kattan, A. F., Kozak, R., Fountain, S., Lepsy, C. Anal. Chem.
2008, 80. 9195-9203.
(20) Taylor, P. J. Clin. Biochem. 2005, 38. 328-334.
(21) Garden, R. W., Moroz, L. L., Moroz, T. P., Shippy, S. A., Sweedler, J. V. J. Mass Spectrom.
1996, 31. 1126-1130.
(22) Gerber, S. A., Rush, J., Stemman, O., Kirschner, M. W., Gygi, S. P. Proc. Natl. Acad. Sci. U. S. A.
2003, 100. 6940-6945.
(23) Colin F. Poole, S. A. S. Contemporary practice of chromatography. Elsevier Science Publishers
B.V.: Amsterdam, The Netherlands, 1984.
(24) Jorgenson, J. W., in Annual Review of Analytical Chemistry, Vol 3. 2010, vol. 3, pp 129-150.
(25) DeStefano, J. J., Langlois, T. J., Kirkland, J. J. J. Chromatogr. Sci. 2008, 46. 254-260.
(26) Gritti, F., Guiochon, G. J. Chromatogr., A 2007, 1176. 107-122.
(27) Cunliffe, J. M., Maloney, T. D. J. Sep. Sci. 2007, 30. 3104-3109.
(28) Unger, K. K., Skudas, R., Schulte, M. M. J. Chromatogr., A 2008, 1184. 393-415.

109
(29) Guiochon, G. J. Chromatogr., A 2007, 1168. 101-168.
(30) Cabrera, K. J. Sep. Sci. 2004, 27. 843-852.
(31) Heinisch, S., Rocca, J.-L. J. Chromatogr., A 2009, 1216. 642-658.
(32) McNeff, C. V., Yan, B., Stoll, D. R., Henry, R. A. J. Sep. Sci. 2007, 30. 1672-1685.
(33) Yan, B. W., Zhao, J. H., Brown, J. S., Blackwell, J., Carr, P. W. Anal. Chem. 2000, 72. 1253-
1262.
(34) Xiqin Yang, L. M., Peter W. Carr J. Chromatogr., A 2005, 1079. 213–220.
(35) Tossman, U., Ungerstedt, U. Acta Physiol. Scand. 1986, 128. 9-14.
(36) Robinson, T. E., Justice, J. B. J. Techniques in the behavioral and neural sciences. Elsevier:
Amsterdam, Netherlands, 1991.
(37) Westerink, B. H. C., Cremers, T. I. F. H. Handbook of microdialysis. Elsevier: Amsterdam,
Netherlands, 2007.
(38) Di Chiara, G., Imperato, A. Proc. Natl. Acad. Sci. U. S. A. 1988, 85. 5274-5278.
(39) Cornish, J. L., Kalivas, P. W. J. Neurosci. 2000, 20. RC89.
(40) LaLumiere, R. T., Kalivas, P. W. J. Neurosci. 2008, 28. 3170-3177.
(41) PorkkaHeiskanen, T., Strecker, R. E., Thakkar, M., Bjorkum, A. A., Greene, R. W., McCarley, R.
W. Science 1997, 276. 1265-1268.
(42) During, M. J., Ryder, K. M., Spencer, D. D. Nature 1995, 376. 174-177.
(43) Feuerstein, D., Manning, A., Hashemi, P., Bhatia, R., Fabricius, M., Tolias, C., Pahl, C., Ervine,
M., Strong, A. J., Boutelle, M. G. J. Cereb. Blood Flow Metab. 2010, 30. 1343-1355.
(44) Bullock, R., Zauner, A., Woodward, J., Young, H. F. Stroke 1995, 26. 2187-2189.
(45) Felice, L. J., Felice, J. D., Kissinger, P. T. J. Neurochem. 1978, 31. 1461-1465.
(46) Liu, Y., Zhang, J., Xu, X., Zhao, M. K., Andrews, A. M., Weber, S. G. Anal. Chem. 2010, 82.
9611-9616.
(47) Yoshitake, T., Yoshitake, S., Fujino, K., Nohta, H., Yamaguchi, M., Kehr, J. J. Neurosci.
Methods 2004, 140. 163-168.
(48) Zhou, S. Y., Zuo, H., Stobaugh, J. F., Lunte, C. E., Lunte, S. M. Anal. Chem. 1995, 67. 594-599.
(49) Robert, F., Bert, L., Denoroy, L., Renaud, B. Anal. Chem. 1995, 67. 1838-1844.
(50) Maidment, N. T., Brumbaugh, D. R., Rudolph, V. D., Erdelyi, E., Evans, C. J. Neuroscience 1989,
33. 549-557.
(51) Eckstein, J. A., Ammerman, G. M., Reveles, J. M., Ackermann, B. L. J. Neurosci. Methods 2008,
171. 190-196.
(52) Hong, S., Pedersen, P. L. Microbiol. Mol. Biol. Rev. 2008, 72. 590-641.
(53) Skorka, G., Shuker, P., Gill, D., Zabicky, J., Parola, A. H. Biochemistry 1981, 20. 3103-3109.
(54) You, Z. B., Wang, B., Zitzman, D., Azari, S., Wise, R. A. J. Neurosci. 2007, 27. 10546-10555.
(55) Parsons, L. H., Justice, J. B. J. Neurochem. 1993, 61. 1611-1619.
(56) Westerink, B. H. C., Kwint, H. F., deVries, J. B. J. Neurosci. 1996, 16. 2605-2611.
(57) Redmond, J. W., Tseng, A. J. Chromatogr. 1979, 170. 479-481.
(58) Higa, S., Suzuki, T., Hayashi, A., Tsuge, I., Yamamura, Y. Anal. Biochem. 1977, 77. 18-24.
(59) Miki, K., Sudo, A. Clin. Chem. 1998, 44. 1759-1762.
(60) Guo, K., Li, L. Anal. Chem. 2009, 81. 3919-3932.
(61) Nestler, E. J. Nat. Neurosci. 2005, 8. 1445-1449.
(62) Koob, G. F., Le Moal, M. Neurobiology of addiction. Elsevier: Amsterdam, Netherlands, 2006.
(63) Dobi, A., Margolis, E. B., Wang, H. L., Harvey, B. K., Morales, M. J. Neurosci. 2010, 30. 218-
229.
(64) Johnson, S. W., North, R. A. J. Neurosci. 1992, 12. 483-488.
(65) Szabo, B., Siemes, S., Wallmichrath, I. Eur. J. Neurosci. 2002, 15. 2057-2061.

110
(66) Tan, K. R., Brown, M., Labouebe, G., Yvon, C., Creton, C., Fritschy, J. M., Rudolph, U., Luscher,
C. Nature 2010, 463. 769-U78.
(67) Paxinos, G., Watson, C. The rat brain in stereotaxic coordinates. 6 ed.; Elsevier: Amsterdam,
Netherlands, 2007.
(68) Lipska, B. K., Weinberger, D. R. Neuropsychopharmacology 2000, 23. 223-239.
(69) Parikh, V., Kozak, R., Martinez, V., Sarter, M. Neuron 2007, 56. 141-154.
(70) Hasselmo, M. E., Sarter, M. Neuropsychopharmacology 2010, 36. 52-73.
(71) Wilson, G. S., Gifford, R. Biosens. Bioelectron. 2005, 20. 2388-2403.
(72) Nandi, P., Lunte, S. M. Anal. Chim. Acta 2009, 651. 1-14.
(73) Lindinger, W., Hansel, A., Jordan, A. Int. J. Mass Spectrom. 1998, 173. 191-241.
(74) Cooks, R. G., Ouyang, Z., Takats, Z., Wiseman, J. M. Science 2006, 311. 1566-1570.
(75) Caprioli, R. M., Lin, S. N. Proc. Natl. Acad. Sci. U. S. A. 1990, 87. 240-243.
(76) Wong, P. S. H., Yoshioka, K., Xie, F., Kissinger, P. T. Rapid Commun. Mass Spectrom. 1999, 13.
407-411.
(77) Van der Zee, E. A., Luiten, P. G. M. Prog. Neurobiol. 1999, 58. 409-471.
(78) Dani, J. A., Ji, D. Y., Zhou, F. M. Neuron 2001, 31. 349-352.
(79) Day, J., Damsma, G., Fibiger, H. C. Pharmacol. Biochem. Behav. 1991, 38. 723-729.
(80) White, K. E., Cummings, J. L. Compr. Psychiat. 1996, 37. 188-195.
(81) Felician, O., Sandson, T. A. J. Neuropsychiatr. Clin. Neurosci. 1999, 11. 19-31.
(82) Burmeister, J. J., Pomerleau, F., Huettl, P., Gash, C. R., Wemer, C. E., Bruno, J. P., Gerhardt, G.
A. Biosens. Bioelectron. 2008, 23. 1382-1389.
(83) Mitchell, K. M. Anal. Chem. 2004, 76. 1098-1106.
(84) Zhu, Y. X., Wong, P. S. H., Cregor, M., Gitzen, J. F., Coury, L. A., Kissinger, P. T. Rapid
Commun. Mass Spectrom. 2000, 14. 1695-1700.
(85) Hows, M. E. P., Organ, A. J., Murray, S., Dawson, L. A., Foxton, R., Heidbreder, C., Hughes, Z.
A., Lacroix, L., Shah, A. J. J. Neurosci. Methods 2002, 121. 33-39.
(86) Zhang, M. Y., Hughes, Z. A., Kerns, E. H., Lin, Q., Beyer, C. E. J. Pharm. Biomed. Anal. 2007,
44. 586-593.
(87) Shackman, H. M., Shou, M., Cellar, N. A., Watson, C. J., Kennedy, R. T. J. Neurosci. Methods
2007, 159. 86-92.
(88) Huang, T. H., Yang, L., Gitzen, J., Kissinger, P. T., Vreeke, M., Heller, A. J. Chromatogr. B-
Biomed. Appl. 1995, 670. 323-327.
(89) Persike, M., Zimmermann, M., Klein, J., Karas, M. Anal. Chem. 2010, 82. 922-929.
(90) Church, W. H., Justice, J.B. Anal. Chem. 1987, 59. 712-716.
(91) Song, P., Mabrouk, O. S., Hershey, N. D., Kennedy, R. T. Anal. Chem. 2012, 84. 412-419.
(92) Kelly, R. T., Page, J. S., Marginean, I., Tang, K., Smith, R. D. Angew. Chem. Int. Ed. 2009, 48.
6832-6835.
(93) Zhu, Y., Fang, Q. Anal. Chem. 2010, 82. 8361-8366.
(94) Fidalgo, L. M., Whyte, G., Ruotolo, B. T., Benesch, J. L. P., Stengel, F., Abell, C., Robinson, C.
V., Huck, W. T. S. Angew. Chem. Int. Ed. 2009, 48. 3665-3668.
(95) Baker, C. A., Roper, M. G. Anal. Chem. 2012, 84. 2955-2960.
(96) Li, Q., Pei, J., Song, P., Kennedy, R. T. Anal. Chem. 2010, 82. 5260-5267.
(97) Chen, D., Du, W., Liu, Y., Liu, W., Kuznetsov, A., Mendez, F. E., Philipson, L. H., Ismagilov, R.
F. Proc. Natl. Acad. Sci. U. S. A. 2008, 105. 16843-16848.
(98) Slaney, T. R., Nie, J., Hershey, N. D., Thwar, P. K., Linderman, J., Burns, M. A., Kennedy, R. T.
Anal. Chem. 2011, 83. 5207-5213.
(99) Uutela, P., Reinila, R., Piepponen, P., Ketola, R. A., Kostiainen, R. Rapid Commun. Mass
Spectrom. 2005, 19. 2950-2956.

111
(100) Benveniste, H., Hansen, A. J., Ottosen, N. S. J. Neurochem. 1989, 52. 1741-1750.
(101) Vissers, J. P. C., Claessens, H. A., Cramers, C. A. J. Chromatogr., A 1997, 779. 1-28.
(102) Vissers, J. P. C. J. Chromatogr., A 1999, 856. 117-143.
(103) Edwards, J. L., Edwards, R. L., Reid, K. R., Kennedy, R. T. J. Chromatogr., A 2007, 1172. 127-
134.
(104) Kennedy, R. T., Jorgenson, J. W. Anal. Chem. 1989, 61. 1128-1135.
(105) Gatlin, C. L., Kleemann, G. R., Hays, L. G., Link, A. J., Yates, J. R. Anal. Biochem. 1998, 263.
93-101.
(106) Shi, Y., Xiang, R., Horvath, C., Wilkins, J. A. J. Chromatogr., A 2004, 1053. 27-36.
(107) Emmett, M. R., Andren, P. E., Caprioli, R. M. J. Neurosci. Methods 1995, 62. 141-147.
(108) Li, Q., Zubieta, J. K., Kennedy, R. T. Anal. Chem. 2009, 81. 2242-2250.
(109) Johannes P.C. Vissers*, A. H. d. R., Mario Ursem, Jean-Pierre Chervet J. Chromatogr., A 1996,
746. 1-7.
(110) Lloyd R. Snyder, J. W. D. High-Performance Gradient Elution The Practical Application of the
Linear-Solvent-Strength Model. John Wiley & Sons, Inc: Hoboken, NJ, 2007.
(111) Neue, U. D., Marchand, D. H., Snyder, L. R. J. Chromatogr., A 2006, 1111. 32-39.
(112) Gritti, F., Guiochon, G. J. Chromatogr., A 2012, 1238. 77-90.
(113) Wotjak, C. T., Landgraf, R., Engelmann, M. Pharmacol. Biochem. Behav. 2008, 90. 125-134.
(114) Lanckmans, K., Van Eeckhaut, A., Sarre, S., Smolders, I., Michotte, Y. J. Chromatogr., A 2006,
1131. 166-175.
(115) Dass, C., Mahalakshmi, P. Life Sci. 1996, 58. 1039-1045.
(116) Katja Dettmer, P. A. A., Bruce D. Hammock Mass Spectrom. Rev. 2007, 26. 51–78.
(117) Michael R. Shortreed, S. M. L., Brian L. Frey, Margaret F. Phillips, Madhusudan Patel,, Peter J.
Belshaw, a. L. M. S. Anal. Chem 2006, 78. 6398-6403.
(118) Yuan, W., Anderson, K. W., Li, S., Edwards, J. L. Anal. Chem. 2012, 84. 2892-2899.
(119) Caprioli, L. M. R. M., presented in part at 60th ASMS Vancouver, Canada, Yea.