Embed Size (px)
Citation preview

A&A 377, 868–897 (2001)DOI: 10.1051/0004-6361:20011090c© ESO 2001
Astronomy&
Astrophysics
Mass, linear momentum and kinetic energy of bipolar flowsin protoplanetary nebulae
V. Bujarrabal1, A. Castro-Carrizo1, J. Alcolea1, and C. Sanchez Contreras1,2
1 Observatorio Astronomico Nacional, Apartado 1143, 28800 Alcala de Henares, Spaine-mail: bujarrabal,j.alcolea,[email protected]
2 Jet Propulsion Laboratory, 4800 Oak Grove Drive, Pasadena, CA 91109, USAe-mail: [email protected]
Received 16 February 2001 / Accepted 26 July 2001
Abstract. We have studied the CO emission from protoplanetary nebulae (PPNe). Our sample is composedof 37 objects and includes, we think, all well identified PPNe detected in CO, together with the two yellowhypergiants emitting in CO and one young PN. We present a summary of the existing CO data, includingaccurate new observations of the 12CO and 13CO J = 1–0 and J = 2–1 lines in 16 objects. We identify in thenebulae a slowly expanding shell (represented in the spectra by a central core) and a fast outflow (correspondingto the line wings), that in the well studied PPNe is known to be bipolar. Excluding poor data, we end up with asample of 32 sources (including the 16 observed by us); fast flows are detected in 28 of these nebulae, being absentin only 4. We present a method to estimate from these data the mass, “scalar” momentum and kinetic energyof the different components of the molecular outflows. We argue that the uncertainties of our method can hardlylead to significant overestimates of these parameters, although underestimates may be present in not well studiedobjects. The total nebular mass is often as high as ∼1 M�, and the mass-loss rate, that (presumably duringthe last stages of the AGB phase) originated the nebula, had typical values ∼10−4 M� yr−1. The momentumcorresponding to this mass ejection process in most studied nebulae is accurately coincident with the maximummomentum that radiation pressure, acting through absorption by dust grains, is able to supply (under expectedconditions). We estimate that this high-efficiency process lasts about 1000–10 000 yr, after which the star hasejected a good fraction of its mass and the AGB phase ends. On the other hand, the fast molecular outflows,that have probably been accelerated by shock interaction with axial post-AGB jets, carry a significant fractionof the nebular mass, with a very high momentum (in most cases between 1037 and 1040 g cm s−1) and very highkinetic energy (usually between 1044 and 1047 erg). In general, yellow hypergiants and post-AGB objects withlow initial mass show nebular masses and momenta that are, respectively, higher and lower than these values.We compare the momenta of the fast outflows with those that can be supplied by radiation pressure, taking intoaccount the expected short acceleration times and some effects that can increase the momentum transfer. We findthat in about 80% of PPNe, the fast molecular flows have too high momenta to be powered by radiation pressure.In some cases the momentum of the outflow is ∼1000 larger than that carried by radiation pressure; such highfactors are difficult to explain even under exceptional conditions. Wind interaction is the basic phenomenon in thePN shaping from the former AGB envelopes; we conclude that this interaction systematically takes place alonga dominant direction and that this process is not powered by radiation pressure. Due to the lack of theoreticalstudies, the possible momentum source remains a matter of speculation.
Key words. stars: AGB and post-AGB – stars: circumstellar matter – radio-lines: stars – planetary nebulae
1. Introduction
Recent observations of molecular lines in the protoplan-etary nebulae (PPNe) OH 231.8+4.2 (Sanchez Contreraset al. 1997; Alcolea et al. 2001), M 1–92 (Bujarrabal et al.1998a) and HD 101584 (Olofsson & Nyman 1999) havepointed out the presence of very massive and fast bipolar
Send offprint requests to: V. Bujarrabal,e-mail: [email protected]
outflows. The dynamics of these well studied objects isdominated by a fast flow in the direction of the symmetryaxis of the nebula, with velocities ∼100 km s−1. Values ofthe total nebular mass close to 1 M� are found. A signif-icant fraction of the mass belongs to the fast component,that therefore carries very high kinetic momentum andenergy, ∼3 × 1039 g cm s−1 and 1046 erg, respectively.(A first measurement of the high mass and momentum inOH 231.8+4.2 is due to Knapp 1986, who also compared
Article published by EDP Sciences and available at http://www.aanda.org or http://dx.doi.org/10.1051/0004-6361:20011090

V. Bujarrabal et al.: Mass, linear momentum and kinetic energy of bipolar flows in protoplanetary nebulae 869
the momenta carried by the nebular mass and the stellarlight.) Typically, the gas in these outflows shows a verylow temperature, ∼10–20 K, this is the reason why theyare mainly detected by means of observations of molec-ular lines (hot nebular gas is also detected, from opticaland NIR lines for instance, but its mass is much smaller).It is thought that these axial flows are the result of theacceleration of the previous AGB wind, that is massivebut slow, by shock interaction with the post-AGB ejec-tions, that would be much faster and run along the ax-ial direction. Observations of dust emission and scatteredlight also allow the detection of the massive component ofthe nebula, confirming the mass and density values foundfrom molecular lines, but do not provide information onthe kinematics, see e.g. Bujarrabal et al. (1997, 1998b),Sahai et al. (1999b).
Even if the studied objects in those papers are quiteluminous (typically, L ∼ 104 L�), the linear momentumassociated to the fast molecular flow is too high (by or-ders of magnitude) to be supplied by radiation pressure,given the relatively short times during which the wind-interaction phenomenon probably took place, 100–200 yr.In this case, we will say that the mass outflow is “overlu-minous”. For example, in M 1–92, the momentum carriedby the molecular outflow is ∼3× 1039 g cm s−1; the staremits about 4× 1037 erg s−1, equivalent in momentum to4× 1034 g cm s−1 per year, so the star would need about105 yr to release such a high linear momentum, but thewind interaction lasted just ∼100 yr (with an upper limitof 900 yr, the total post-AGB life of the object; see moredetails in Bujarrabal et al. 1998a).
The measured kinetic energies and momenta are sohigh that it is difficult to find other mechanisms that couldpower these very energetic ejections satisfying the prin-ciples of conservation. (Similar “overluminous” flows arewell known to occur in star-forming regions, for which theaccretion of material from the protostellar cloud is invokedto power the bipolar jets.) If such a property is found to betypical in PPNe, we would have to conclude that, from thepoint of view of the dynamics involved, presently we haveno explanation for the shaping of planetary nebulae fromthe previous AGB envelopes. However, only a few nebulaehave been properly studied at this respect. In this paperwe present a systematic study of the molecular outflows inPPNe. We have cataloged all well identified PPNe showingCO emission and have performed accurate new observa-tions in a sizable number of objects. From the CO data,we have calculated the nebular mass and the linear mo-mentum and kinetic energy of the flows. Our results arecompared with the momentum and kinetic energy thatcan be provided by the stellar radiation pressure.
2. Source sample
The goal of this work is to estimate the mass of the bipolaroutflows in PPNe, as well as the momentum and energycarried by them. We used for that purpose CO emission,since, as far as we know, it is the best tracer of the total
nebular mass. We have chosen a sample of PPNe emit-ting in CO; we think that our sample includes all wellidentified PPNe that have been detected in CO emission(up to December 2000). We also included three relatedobjects (see below). The basic criterion for the classifica-tion of a nebula as protoplanetary is the presence of a cooland thick circumstellar envelope and a bimodal spectralenergy distribution (SED), showing that the envelope iswell detached from the central star and that the stellartemperature is between ∼3000 and ∼30 000 K (in generalcorresponding to intermediate spectral types: WC10-11,B, A, F, G, or K; in many cases, independent studies haveconfirmed the stellar type). Therefore, the selected objectslost large amounts of mass in the past, when the centralstars were probably cooler. These central stars seem to benow evolving toward very hot objects, and will soon illu-minate and ionize the nebula. Objects associated to inter-stellar clouds are rejected. Standard PNe showing strongCO emission, and sometimes wide line wings (as for in-stance M 1–16), were not considered in our study. For fur-ther discussion on these criteria, see e.g. Kwok (1993).
We did not include nebulae of uncertain classifi-cation. Accordingly, we have not studied objects likeAFGL 190 (IRAS 01144+6658), IRAS 19454+2920 andIRAS 19480+2504, that show a heavy envelope (detectedby means IRAS photometry and CO line emission), be-cause the temperature of their central stars is not known(see Volk & Kwok 1989; Likkel et al. 1991; Volk et al. 1993;Groenewegen et al. 1998). However, we have includedin our sample IRAS 23321+6545, IRAS 20028+3910, andIRAS 22574+6609, even if the spectral types of the starsare unknown, because they show a clearly bimodal SED,indicating the emissions of a cool and massive envelopeand probably of a relatively hot stellar component, as wellas a bipolar image in HST high-resolution observations(Ueta et al. 2000). IRAS 22574+6609, moreover, showsFIR dust features usually associated to PPNe (Hrivnak& Kwok 1991). OH231.8+4.2 is assumed to be a PPN,in spite of the late (and peculiar) spectrum of its centralstar, because it presents a massive envelope with well de-veloped shocks, a property characteristic of post-AGB ob-jects and very rare in AGB stars. CRL 2477 is assumed tobe a PPN because of its bimodal SED (Groenewegen et al.1996), but the nature of the central star is controversialand it is possible that two evolved objects are coincidentin the line of sight.
NGC 7027 is not a PPNe but a young PN; it is in-cluded in our list, in spite of its very hot central star, be-cause its envelope has a short kinematical age (∼1000 yr,Graham et al. 1993) and a massive molecular component,similarly to PPNe. Finally, we have included in our listtwo objects that show heavy envelopes and are thoughtto be hypergiants, IRC +10420 and AFGL 2343 (the onlytwo hypergiants surrounded by massive nebulae, see e.g.de Jager 1998 and discussion in 5.1.7). The evolution ofsuch objects is uncertain, but it seems that they werecooler in the past, when they ejected most of the circum-stellar shell, and that they are becoming hotter rapidly.

870 V. Bujarrabal et al.: Mass, linear momentum and kinetic energy of bipolar flows in protoplanetary nebulae
Table 1. Sample of PPNe observed in CO by us.
name observed coordinates Vsys LSR spectral i D L commentsα (2000) δ (2000) (km s−1) type (◦) (kpc) (103 L�)
IRAS 04296+3429 04 32 57.0 34 36 13 −65 6500(F5)1,2 253 5?4,2 72
CRL 618 04 42 53.4 36 06 54 −21 B0s 455 1.76 307
IRAS 04395+3601Frosty Leo 09 39 54.0 11 58 54 −12 K7III8 159 38 2.710
IRAS 09371+1212IRAS 17436+5003 17 44 55.5 50 02 40 −35 F2-5Ib11 ? 47 607
HD 161796He 3–1475 17 45 14.1 −17 56 47 48 Be12,13 6013 513 913
IRAS 17423-175589 Her 17 55 25.1 26 02 59 −8 F2Ibes ISOT.0 0.614 3.314 high-latitude yellow giant
IRAS 17534+2603AFGL 2343 19 13 58.6 00 07 32 98 G5Ia11 ISOT.0 5.6H 58015 yellow hypergiant
IRAS 19114+0002IRC +10420 19 26 48.0 11 21 17 76 F8Ia16 ISOT.0 516 70016 yellow hypergiant
IRAS 19244+1115IRAS 19500-1709 19 52 52.6 −17 01 50 25 F2-611 ? 17 1.57
SAO 163075CRL 2477 19 56 48.4 30 44 00 5 ?17 ? 1.317 417 PPN?
IRAS 19548+3035CRL 2688 21 02 18.8 36 41 38 −35 F5 Iaes 1518,19 1.219 2519,6
Egg Nebula, (21003+3629)NGC 7027 21 07 01.6 42 14 10 26 pec. 3020 121 1021 young PN
(21052+4202)IRAS 22272+5435 22 29 10.4 54 51 07 −28 G5Ia22 304 1.723 8.323
HD 235858IRAS 23304+6147 23 32 45.0 62 03 49 −16 G2Ia22 90?24 1.325 124
IRAS 23321+6545 23 34 22.7 66 01 51 −55 ? ? ? 0.626,1kpc
M 2–56 23 56 36.1 70 48 17 −27 Bes 150 327 1027
IRAS 23541+7031
References: (s) Simbad database; (H) Hipparcos; (0) this paper; (1) Decin et al. (1998); (2) Klochkova et al. (1999); (3) Sahai(1999); (4) Meixner et al. (1997); (5) Neri et al. (1992); Yamamura et al. (1994); (6) Calvet & Cohen (1978); (7) Bujarrabal et al.(1992); (8) Mauron et al. (1989); (9) Roddier et al. (1995); (10) Forveille et al. (1987); (11) Hrivnak et al. (1989); (12) Borkowskiet al. (1997); (13) Riera et al. (1995); (14) Alcolea & Bujarrabal (1995); (15) Reddy & Hrivnak (1999); (16) de Jager (1998),Jones et al. (1993); (17) Groenewegen et al. (1996); (18) Sahai et al. (1998); (19) Skinner et al. (1997); (20) Graham et al. (1993);(21) Jourdain de Muizon et al. (1990), Graham et al. (1993); (22) Hrivnak (1995); (23) Szczerba et al. (1997); (24) Hrivnak &Kwok (1991); (25) Woodsworth et al. (1990); (26) Volk et al. (1993), luminosity for a distance of 1 kpc; (27) Goodrich (1991).
So these hypergiants are very probably following an evo-lutionary path similar to that of PPNe. In general, theseobjects are included in our list to allow a comparison ofthe properties of PPNe and of related objects.
In our sample we include the PPNe with low initialmass in which CO has been certainly detected: 89 Her, theRed Rectangle, M 2–9 and R Sct (see Alcolea & Bujarrabal1991; R Sct is a peculiar RV Tau variable). We note thatPPNe with low initial mass show an anomalously low COemission; in particular, CO is not detected in other RVTau variables and in M 1–91. We recall that the post-red-giant evolution of these low-mass stars may be very slow
and that they will perhaps not become standard PNe, dueto the extreme dilution of the expanding shell.
We have performed high-sensitivity observations(Sect. 3) of some PPNe showing CO line emission, in-cluding in particular a well studied PPN that seems tohave no wings in the CO lines, IRAS 22272+5435. In gen-eral, we selected for observation objects for which useful13CO J = 1–0 data were expected, also trying to samplethe variety of sources described above. For the objects notobserved by us, we have taken data from the literature.The final sample is defined in Tables 1 and 2, respectivelyfor the sources for which the relevant CO data have been

V. Bujarrabal et al.: Mass, linear momentum and kinetic energy of bipolar flows in protoplanetary nebulae 871
Table 2. Sample of PPNe observed in CO in other papers.
name coordinates ref. Vsys LSR spectral i D L commentsα (2000) δ (2000) (km s−1) type (◦) (kpc) (103 L�)
Red Rectangle 06 19 58.2 −10 38 15 H 01 A12,3 154,5 0.38H 16 low-mass starIRAS 06176–1036
IRAS 07134+1005 07 16 10.3 09 59 48 s 727 F58 509,10 37,9,10,11 13.510
HD 56126OH 231.8+4.2 07 42 16.9 −14 42 50 12 3313 M9III13 4013 1.513 1013 well studied
IRAS 07399–1435Hen 3–401 10 19 32.5 −60 13 29 14 −3015 B115,16 15?14 315 3.614
IRAS 10178–5958Roberts 22 10 21 33.8 −58 05 48 17 015 A2Iab18 1517 217 3017
IRAS 10197–5750HD 101584 11 40 58.8 −55 34 26 H 4119 F0Iapes ? 120 320 well studied
IRAS 11385–5517Boomerang Nebula 12 44 45.5 −54 31 12 21 −415 G0III15 ? 1.521 0.321 well studied
IRAS 12419–5414He 2–113 14 59 53.5 −54 18 08 22 −5623 WC1024 ? 1.224 524
IRAS 14562–5406Mz–3 16 17 13.6 −51 59 06 25 −1715 B026 2027 1.815,28 5.725,26
IRAS 16133–5151M 2–9 17 05 37.9 10 08 32 29 8029 Be30 1729 0.6431 0.5531 low-mass star
IRAS 17028–1004CPD –568032 17 09 00.9 −56 54 48 H −6032,23 WC1024 ? 1.524 5.224
IRAS 17047–5650IRAS 17150-3224 17 18 19.7 −32 27 21 33 1434 G2s ? 2.4235 1135,36
AFGL 6815OH 17.7–2.0 18 30 30.7 −14 28 57 37 6138 F039,40 ? 2 38 2.938
IRAS 18276–1431
R Sct 18 47 29.0 −05 42 19 H 5641 G0–K232 ? 0.46 46 low-mass starIRAS 18448–0545
M 1–92 19 36 18.9 29 32 50 43 −143 B0.5IVs 3543 2.543 1043 well studiedIRAS 19343+2926
IRAS 19475+3119 19 49 29.6 31 27 16 s 1844 F3Ia44 ? 645 12.60,45
HD 331319
IRAS 20000+3239 20 01 59.4 32 47 32 40 13.544 G8Ia8 ? ? 0.5546,1kpc
IRAS 20028+3910 20 04 35.9 39 18 45 47 5.944 ? ? 2.511,44,48 6.611,35,44,48
IRAS 21282+5050 21 29 58.5 51 04 01 49 1850 O9.5,WC1151 909 39 5.39
IRAS 22223+4327 22 24 31.0 43 43 09 40 −3048 G0Ia8 ? ? 0.3646,1kpc
IRAS 22574+6609 22 59 18.3 66 25 47 33 −6444 ? ? ? 0.1552,1kpc
References : (s) Simbad database; (H) Hipparcos parallaxes; (0) this paper; (1) Jura et al. (1995); (2) Kelly & Latter (1995);(3) Knapp et al. (1995); (4) Roddier et al. (1995); (5) Lopez et al. (1995); (6) Alcolea & Bujarrabal (1991); (7) Bujarrabal et al.(1992); (8) Hrivnak (1995); (9) Meixner et al (1997); (10) Dayal et al. (1998); (11) Yuasa et al. (1999); (12) Sanchez Contreraset al. (2000); (13) Sanchez Contreras et al. (1997) and Kastner et al. (1992); (14) Sahai et al. (1999a); (15) Bujarrabal & Bachiller(1991); (16) Allen (1978); (17) Sahai et al. (1999b); (18) Allen et al. (1980); (19) Olofsson & Nyman (1999); (20) Trams et al.(1990); (21) Sahai & Nyman (1997); (22) Andrei et al. (1999) and Assafin et al. (1996); (23) Knapp et al. (1990); (24) De Marco& Crowther (1998); (25) Van der Veen et al. (1989); (26) Cohen et al. (1978); (27) Meaburn & Walsh (1985) and Redmanet al. (2000); (28) Quinn et al. (1996); (29) Zweigle et al. (1997); (30) Calvet & Cohen (1978) and Swings & Andrillat (1979);(31) Schwartz et al. (1997); (32) Nyman et al. (1992); (33) Ueta et al. (2000); (34) Hu et al. (1993); (35) Loup et al. (1993);(36) Kwok et al. (1996); (37) Bowers et al. (1983); (38) Heske et al. (1990), van der Veen et al. (1995); (39) Le Bertre et al.(1989); (40) Meixner et al. (1999); (41) Bujarrabal et al. (1990); (42) Shenton et al. (1994); (43) Bujarrabal et al. (1997) and(1998a); (44) Likkel et al. (1991); (45) Likkel et al. (1987); (46) Kwok et al. (1995); (47) Neri et al. (1998); (48) Omont et al.(1993); (49) Meixner et al. (1998); (50) Likkel et al. (1988); (51) Crowther et al. (1998); (52) Hrivnak & Kwok (1991).

872 V. Bujarrabal et al.: Mass, linear momentum and kinetic energy of bipolar flows in protoplanetary nebulae
Fig. 1. CO observations of IRAS 04296+3429.
and have not been obtained in this work. In these tableswe include the most usual source name and the IRAS cat-alog name, the coordinates, the adopted systemic velocity(Vsys), the spectral type of the central star, the inclinationof the nebula axis with respect to the plane of the sky (i),the distance (D) and the total luminosity calculated forthis distance. Relevant references used to calculate theabove parameters are given by the superindexes.
The coordinates given in Table 1 are those observed byus, in Table 2 we show the best coordinates we have foundin the literature. The systemic velocity is deduced fromthe CO profiles. When the profiles are composite, with acentral intense component and wide wings, we chose thecentroid of the central component, since in well studiedobjects it seems to correspond to the part of the enve-lope not affected by the post-AGB wind interaction (e.g.Bujarrabal et al. 1998a, Sect. 8.1). When such a structureis not clear, we take for Vsys the line centroid. The valuesfor i and D are taken from specific studies on each nebula.When the inclination is not known, we will adopt the in-termediate value i = 30◦ (see discussion in Sect. 4). Notethat the distance is sometimes poorly known in PPNe.Some comments on the sources, mostly related to theirevolutionary status, are also given.
Fig. 2. CO observations of CRL 618.
3. New CO observations
We have performed observations of the J = 1–0 andJ = 2–1 transitions of 12CO and 13CO in a sample of16 protoplanetary nebulae (PPNe) and related objects,using the IRAM 30 m radiotelescope, at Pico de Veleta(Granada, Spain). Two observing runs were necessary, inAugust and November 1998. SIS receivers working in the3 and 1 mm bands were used, often simultaneously. Thereceivers were tuned always in SSB mode, with typical sys-tem temperatures of ∼1000 K, at λ = 1.3 mm, and 500 K,at λ = 2.6 mm (in units of Tmb, see below). Spectral res-olutions between 0.3 and 2.6 km s−1 were used.
Weather conditions were good for most observations,with zenith opacities at 230 GHz ranging from about 0.3 to0.8. The pointing of the telescope was verified every abouttwo hours or every time we moved into a new target, byobserving continuum sources close in the sky to it. Thespatial resolution is of 12–13′′ at 1.3 mm and of about 22′′
at 2.6 mm.The data presented here are calibrated in units of Main
Beam Rayleigh-Jeans-equivalent Antenna Temperature,Tmb, using the chopper-wheel method by observing hot(ambient) and cold loads (liquid nitrogen). In addition,observations of well known intense sources were used tocheck the calibration. In particular we took as standardthe AGB star IRC+10216, for which we used the following

V. Bujarrabal et al.: Mass, linear momentum and kinetic energy of bipolar flows in protoplanetary nebulae 873
Fig. 3. CO observations of Frosty Leo.
intensities at the central velocity: Tmb(12CO, J = 1–0) =23 K, Tmb(12CO, J = 2–1) = 63 K, Tmb(13CO, J = 1–0) =1 K, Tmb(13CO, J = 2–1) = 4.3 K. We note that due torecent improvements in the beam shape, the main-beamtemperatures of 1mm lines appear now somewhat higherthan in older observations (by factors 1.3–1.5).
The observed spectra are shown in Figs. 1 to 16. Asbaseline, only straight lines were subtracted.
Usually, PPNe are angularly compact objects, com-pared with the resolution of the telescope, and observa-tions of a single point are enough to measure the totalemission. However, the angular extent of some of the ob-served objects is known to be comparable to the 12–13′′
beam of the 30 m telescope at 230 GHz. We have per-formed small maps of a few objects but, due to their smallsize, the information on the nebula shape is poor and themain result from our maps is simply its image extent athalf maximum; see Sect. 5.
4. Calculation of physical parametersfrom the CO data
4.1. CO emissivity and determination of the emittingmass and its momentum and energy
We will calculate the mass emitting in a spectral rangewithin a CO rotational line from the discussion on the COexcitation and emissivity by Bujarrabal et al. (1997) and
Fig. 4. CO observations of IRAS 17436+5003.
the properties of the CO emission from well studied nebu-lae (Sect. 1). The possible associated errors are discussedin that paper and Sect. 4.2. Note that, when the source issignificantly extended compared with the telescope reso-lution, a correction to the central brightness temperatureproportional to the area of the beam-convolved image isnecessary.
The emissivity is parametrized by the value of a (con-stant) rotational temperature, Trot. In previous papers,see Bujarrabal et al. (1997, 1998a) and Sanchez Contreraset al. (1997), we have shown that the characteristic rota-tional temperature of the CO emission in the best studiednebulae is low, between 10 and 30 K, and remains signif-icantly constant across most of the source. In those ob-jects in which good 12CO and 13CO data exist, we willestimate the values of this parameter from the observedJ = 2–1/J = 1–0 line ratio; this is equivalent to take thevalue of Trot that leads to the same value of the total massfrom the data of both lines (of both 12CO and 13CO), seeSect. 5.1. As we will see, we systematically obtain valuesof Trot compatible with the above range. For objects inwhich such an estimate is not possible, we will assumeTrot ∼ 15 K. The emissivities for a given Trot and so theconversion from Tmb to emitting mass are calculated as-suming optically thin emission. At least for 13CO J = 1–0,the optical depth is found to be lower than one in the well

874 V. Bujarrabal et al.: Mass, linear momentum and kinetic energy of bipolar flows in protoplanetary nebulae
Fig. 5. CO observations of He 3–1475.
studied objects (see also 4.2); for that reason (and thelarger telescope beam), this line will be preferably used.
We will adopt the relative CO abundances X(12CO) =2× 10−4 and X(13CO) = 2× 10⁻⁵. These relatively highvalues are characteristic of AGB envelopes and PPNe withstrong CO emission (Bujarrabal et al. 1997, 1998a, Alcoleaet al. 2001, etc.), and therefore can be safely applied tonot very evolved PPNe, in which photodissociation by thestellar UV is not important yet.
The spectral sampling used in our calculations are de-fined in terms of LSR velocity, VLSR. We will assume thatthe CO emission in the line wings comes from more or lesselongated structures in which the velocity is mainly axial,as found for M1–92, OH231.8+4.2, etc. Then, VLSR canbe converted into actual flow velocity of the emitting gas,V ; provided that we know the inclination of the axis withrespect to the plane of the sky, i, and that we can deducea systemic LSR velocity, Vsys, from the CO profiles. Notethat Vsys is expected to give the movement of the center ofgravity, defining the rest frame for which those parametersare calculated. Then,
V = (VLSR − Vsys)/sin(i). (1)
Once we know the mass emitting in a spectral range, m,and the expansion velocity corresponding to it, V , we cancalculate the total mass, linear “momentum”, P , and ki-netic energy, E, by summing over the whole spectra the
Fig. 6. CO observations of 89 Her.
values of m and of the products m|V | and 12mV
2. So, wecalculate
P =∑
m(VLSR)× |VLSR − Vsys|/sin(i), (2)
and
E =12
∑m(VLSR)× [(VLSR − Vsys)/sin(i)]2. (3)
Note that we are not exactly calculating a linear momen-tum, since the sum is not performed vectorially. When theflow is exactly bipolar, our method gives the sum of themoduli of the momenta in the two opposite directions. Ingeneral, we calculate sums of momentum moduli for differ-ent directions. The calculated parameter (the total “scalarmomentum”) is however relevant for our purposes, sinceit can be compared with the “momentum” carried by ra-diation pressure per unit time, calculated as L/c, whichhas the same meaning.
When the inclination of the nebula axis is not known,we will use i = 30◦, as we have mentioned. This assump-tion is intermediate between the extreme cases, perpen-dicular or parallel to the plane of the sky. Note, more-over, that if we calculate the sum of the momentummoduli from observations of a spherically symmetric en-velope, with constant radial velocity, we find exactly thesame formula as for a bipolar flow with i = 30◦, i.e.:
Pisot = 2∑
m(VLSR)× |VLSR − Vsys| = Pi=30. (4)

V. Bujarrabal et al.: Mass, linear momentum and kinetic energy of bipolar flows in protoplanetary nebulae 875
Fig. 7. CO observations of AFGL 2343.
In this isotropical case,
Eisot = 312
∑m(VLSR)× (VLSR − Vsys)2 =
34Ei=30. (5)
Note that the total mass calculation only depends on thevelocity integrated intensity, it is therefore independent ofthe assumed source geometry.
For all possible density and velocity distributions(keeping the value of Vsys as that of the reference frame),there is a lower limit for the momentum and energy: thosecalculated assuming bipolar ejections with i = 90◦, i.e. inthe line of sight:
Pmin =∑
m(VLSR)× |VLSR − Vsys| =12Pi=30, (6)
Emin =12
∑m(VLSR)× (VLSR − Vsys)2 =
14Ei=30. (7)
The minimum momentum is just one half of that given byour previous isotropic and i = 30◦ approximations.
There are other possible models for the mass and ve-locity distributions, but in general all them give similarresults for the momentum and energy to those presentedhere. We can see more detailed source descriptions and thederived results in e.g. Bujarrabal et al. (1998a) and Alcoleaet al. (2001), based on their high-quality CO maps. Wealso mention the disk model used in Sahai et al. (2000)for the PPN Frosty Leo. In this model the gas flows in a
Fig. 8. CO observations of IRC +10420.
plane perpendicular to the nebula symmetry axis at con-stant velocity; the axis inclination is again the basic geo-metric parameter. The expansion velocity is given in thismodel by the maximum of the relative observed velocity,VLSR – Vsys, divided by cos(i). The resulting momentumand energy expression are slightly more complex than inthe axial-flow case, but the results do not differ from thoseof the other simple models (see Sect. 4.2 and Sahai et al.).
Only when the gas velocity is assumed to be closelyparallel to the plane of the sky (for instance in a bipolarflow with i ∼ 0◦ or in a disk with the axis close to theline of sight), the corrections needed to convert the ob-servational parameters to momentum and energy are veryhigh. In the objects treated here we never assumed valuesof i smaller than 15◦ (Tables 1, 2).
As we have mentioned, PPNe often show different kine-matical components. In several sources, there is clearly acentral low-velocity feature in the CO profiles. In the wellstudied cases (see Sect. 8.1), this central spectral compo-nent is known to come from a spherical slowly expandingenvelope or from a disk/torus perpendicular to the nebulaaxis. In these sources, the line core is thought to representthe part of the AGB envelope that has not been affectedby the wind interaction characteristic of the protoplane-tary evolution. Therefore we must treat separately the linewings and the line core. For the line wings, the most inter-esting spectral feature for us, we will in general assume the

876 V. Bujarrabal et al.: Mass, linear momentum and kinetic energy of bipolar flows in protoplanetary nebulae
Fig. 9. CO observations of IRAS 19500–1709.
Fig. 10. CO observations of CRL 2477.
Fig. 11. CO observations of CRL 2688.
bipolar flow model, as discussed above. Except for somewell studied cases mentioned in Sect. 5, for the line corewe will assume isotropic expansion and spherical symme-try, since these values will be in that way more directlycomparable to those usually found for AGB envelopes.
4.2. Uncertainties in the calculation
The assumptions listed in Sect. 4.1 could lead, if they arenot satisfied, to errors. In a previous work (Bujarrabalet al. 1997), we have already discussed these error sources.In this paper we will adapt this discussion, without repeat-ing all details, to the models used here.
1. We are assuming optically thin emission, at least inthe 13CO J = 1–0 transition. The main reason to believethat this hypothesis is reasonable is that the 13CO linesare in all cases significantly weaker than the 12CO lines, inspite of the similar excitation properties of both moleculesand the similar extents found from both theoretical rea-soning (i.e. from photodissociation theory, Mamon et al.1988) and observational results (see maps by Bujarrabalet al. 1998a; Sanchez Contreras et al. 1997). Under theseconditions, 13CO/12CO line ratios much lower than 1 canonly be explained if at least the 13CO lines are opticallythin. Nevertheless, if these lines were opaque, our calcu-lations of mass, momentum and energy would lead to un-derestimates of the true values (but never overestimates);

V. Bujarrabal et al.: Mass, linear momentum and kinetic energy of bipolar flows in protoplanetary nebulae 877
Fig. 12. CO observations of NGC 7027.
in any case the above discussion strongly suggests thatthe possible underestimate is moderate, mainly in the rel-atively weak line wings and well studied objects.
2. We also assume a relatively low rotational temper-ature (∼15 K), that is used to parametrize the CO lineexcitation. As we have discussed in Sect. 4.1, such low val-ues are found in the PPNe in which the CO line emissionhas been well observed. Note that rotational temperatureslarger than 30 K (if the emission is not resolved by thetelescope and optically thin) would lead to values of thebrightness temperature ratio 13CO J = 2–1/J = 1–0 >∼12, which is certainly not observed. As we have discussedin Bujarrabal et al. (1997), the emissivity in the observedlines for this low Trot is close to the absolute maximum.Only overestimates by less than a factor 2 in the mass,momentum and energy are then expected due to errors inthe excitation treatment. Of course, significant underesti-mates are possible if Trot is in fact very large; the under-estimate for Trot = 40 K is by about a factor 3. We havementioned that the mass of the hot gas is small (Sect. 1);if a massive warm componet exist, we would again under-estimate the total mass and momentum.
Bujarrabal et al. (1997) calculated the effects of depar-tures from thermalization in the CO level population. Forthe high number densities calculated in well observed neb-ulae, >∼104 cm−3 (Bujarrabal et al. 1998a; Alcolea et al.2001), the relevant lines are almost thermalized and only
Fig. 13. CO observations of IRAS 22272+5435.
Fig. 14. CO observations of IRAS 23304+6147.
small corrections to the emissivity are expected. In anycase, even for extreme departures the possible overesti-mates would not exceed a factor 1.5.
The case of the PPN IRAS 22272+5435 illustrates themoderate uncertainties that one can expect in our calcu-lations due to the excitation assumptions. In Sect. 5.1.12and Table 3, we present results of the molecular mass ofthis source, for which some indication exists that the ob-served lines come from an envelope similar to that of anAGB star. We calculate the molecular mass and the dy-namical parameters assuming three models for the CO

878 V. Bujarrabal et al.: Mass, linear momentum and kinetic energy of bipolar flows in protoplanetary nebulae
Fig. 15. CO observations of IRAS 23321+6545.
Fig. 16. CO observations of M 2–56.
excitation: our standard model for spherical-isotropic ex-pansion (with Trot = 15 K), our model for spherical-isotropic expansion and assuming Trot = 25 K (a valuethat, as we will see, may be present in some PPNe), andassuming that the lines come from an envelope similar indensity, abundance and temperature distribution to thoseof AGB stars. As we see in Table 3, the results are com-parable for the different models. (It is well known thatCO data analysis provides robust ways to determine themass in the CO-rich envelopes, due to the low dependence
of the results on the excitation conditions and general as-sumptions, see e.g. Bujarrabal 1999.)
3. We are taking a relatively high value of the 13COrelative abundance, X(13CO) = 2 × 10⁻⁵, as usuallyfound in molecule-rich PPNe and AGB envelopes (Kahaneet al. 1992; Bujarrabal et al. 1994). Such a value ofX(13CO) almost corresponds to the maximum numberof 13CO molecules that can be formed for the expected13C abundance. As discussed by Bujarrabal et al. (1997),some PPNe are known to show relatively low molecu-lar abundances, probably due to photodissociation by theUV photons emitted by the (already) warm central star.Therefore, again we can hardly expect strongly overesti-mated values of the derived parameters from the possi-ble errors in the assumed X(13CO) value. However, if insome source the molecular photodissociation is very effi-cient we would severely underestimate the mass, as well asthe other dynamical parameters. It is difficult to limit suchan effect. We hope that the fact that our sample mostlyincludes intense sources in molecular emission implies thattheir molecular component includes most of the nebularmass; this is known to be case in well studied nebulae likeCRL 2688, CRL 618, M 1–92, OH 231.8+4.2, etc. In anycase, we must keep in mind that the parameters derivedhere always refer to the (cool) molecular component ofPPNe.
4. We have also mentioned in Sect. 4.1 that the un-certainty in the nebula structure and kinematics affectsthe determination of the momentum and energy (not ofthe total mass). When we use a bipolar jet model withinclination i (values listed in Tables 1, 2), the maximumpossible overestimate of the momentum due to errors inthe inclinations is by a factor 1/sin(i). For the discussedsources, for which we always take i ≥ 15◦, this factor doesnot exceed 3.9. The energy measurement is more uncer-tain, it can be overestimated by a factor 1/sin2(i). Whenthe model source is spherical with isotropic flow, the max-imum overestimate of P is by a factor 2 (3 for the energy).For most sources, the inclination of the axis is relativelywell known, so significantly smaller errors are expected.For the others we adopt i = 30◦, the maximum overes-timate of P is then by a factor 2. On the other hand, ifthe true inclination of the mass flow with respect to theplane of the sky is close to 0◦, we may strongly under-estimate P and E. The probability that i is smaller than15◦, assuming a random distribution of the nebula axes, is0.26. Therefore, for∼75% of the sources with uncertain in-clination, the underestimate of the momentum is smallerthan a factor ∼2. It is possible that in some object themomentum underestimate is significantly stronger.
Note that this discussion holds almost exactly if the ve-locity/mass distributions are more complex than assumed.
In Sect. 4.1 we discuss calculations for one object,Frosty Leo, assuming very different geometries, namely:our standard bipolar flow, a spherical-isotropic expansion,and a disk-like distribution (see results in Table 3). We dis-cuss the case of this source because its well known imagein the optical could suggest very different configurations

V. Bujarrabal et al.: Mass, linear momentum and kinetic energy of bipolar flows in protoplanetary nebulae 879
for the CO cloud, see 5.1.3. As we see, the differences be-tween the results for such different geometries are small,provided that the inclination of the flow with respect tothe plane of the sky is not very small.
As we have mentioned, the distance to some sources isquite uncertain. But we note that the parameters derivedfrom the molecular observations (mass, linear momentumand kinetic energy of the flows) depend on D2, in the sameway as the stellar total luminosity and the momentumcarried by it. Therefore, our main result, the comparisonbetween the gas outflow momentum (energy) and the mo-mentum (energy) carried by the stellar radiation, is notdirectly affected by the errors in the distance.
5. Mass, momentum and energy carriedby PPN outflows
5.1. Sources observed by us in CO emission
The mass, linear momentum and kinetic energy of thedifferent nebular components calculated in the objects ob-served by us, following the methods described in Sect. 4,are summarized in Table 3. In this section, we discussthe parameters used for each nebula. The adopted valuesfor the axis inclination i and the distance D are listed inTable 1 (Sect. 2). We will also discuss (mainly for the firstsources) the errors and limits due to the CO data uncer-tainties, as well as to the excitation and source models. InSect. 5.2 we discuss the calculations for sources observedin CO by other authors; the difference of the treatment isdue to the different quality of the data, the results, as wewill see, are very similar for both groups.
5.1.1. IRAS 04296+3429
Our spectra (Fig. 1, Sect. 3) show a central component andweak wings, that are not seen in the 13CO J = 1–0 line.We deduced from inspection of the 12CO J = 2–1 line thatthe slow component is characterized by a systemic veloc-ity Vsys = −65 km s−1 (LSR) and a velocity range equalto −65±11 km s−1. The very compact HST image (2–3′′
wide, Sahai et al. 2000) suggests that the nebula is muchsmaller than the resolution of our telescope, as recentlyconfirmed by unpublished CO maps of this source. TheCO line intensity ratios are compatible with the rangeof low rotational temperatures assumed in our standardmodel (10–20 K). We will accordingly apply our standardprocedure to the calculation of the mass, momentum andkinetic energy in this source, using the 12CO J = 1–0 lineand a bipolar outflow model (with i = 25◦) for the weakline wings, and using the 13CO J = 1–0 line and a spheri-cal model for the line core. We have checked that, at leastfor the line core, both 12CO and 13CO J = 1–0 lines wouldproduce very similar results, which is a consistency proofof the assumed excitation, abundances and low opacities.The results obtained for the fast component are in anycase uncertain, due to its weak emission. The distance to
this source, see Table 1, is poorly known, but this shouldnot affect our main results (Sect. 4.2).
The results of the calculations with this model aregiven in Table 3. Since the fast outflow is assumed to havei = 25◦, the lower limit to its momentum (for an unrealis-tic flow in the direction of the line of sight, see Sect. 4.2)would be 2.4 times smaller than the value in the table.Calculations with a spherical-isotropic model for the fastgas would yield a momentum about 1.2 times smaller thatthe adopted result.
5.1.2. CRL 618
As we see in Fig. 2, the CO lines of CRL 618 show aclearly composite structure, with a central strong coreand wide wings. From existent mapping observations ofthe central component (e.g. Bujarrabal et al. 1988), itis known that this spectral feature comes from a quasi-spherical structure extended about 15 arcsec. The wideline wings, on the other hand, are known to come froma bipolar inner flow (Neri et al. 1992) extended less than5′′. Therefore, the spatial resolution of our CO J = 1–0 single-dish observations, ∼22′′, is wide enough to col-lect all its flux. We deduced from our spectra a systemicvelocity Vsys = −21 km s−1 and an expansion velocityfor the central component equal to 17.5 km s−1. In thiscase it is therefore fully justified to use a spherical modelfor the line core and a bipolar fast flow (with i = 45◦)for the line wings (Sect. 4). The wings are very weak inthe 13CO lines; therefore, we calculated the parametersfor them from the 12CO lines (mainly J = 1–0). For aspherical-isotropic model, the momentum calculated forthe fast outflow would be 1.4 times larger than the valuefor our standard bipolar model; the minimum momentum(if the material flows in the direction of the line of sight)would be 1.4 times smaller.
Some authors (see Bujarrabal et al. 1988 and referencestherein) have proposed somewhat larger rotational tem-peratures in this source than those found in other PPNe.For the line core, the rotational temperature derived fromthe 13CO J = 2–1/J = 1–0 brightness ratio is ∼25 K, thecorrection factor with respect to our standard estimate(for Trot = 15 K) is only ∼1.4. The (12CO) line wingssuggest a low excitation temperature and the correctionfactor is still smaller. Therefore, we will only apply theabove correction to the central spectral component.
5.1.3. Frosty Leo
The CO spectra of Frosty Leo show a central intense fea-ture that will be taken as the slow component, with Vsys =−11 km s−1 and an expansion velocity of 10 km s−1.The line wings in this source are very conspicuous at allwavelengths, but being much weaker in 13CO, which sug-gests optically thin emission at least in the 13CO lines.We performed small maps that show that the sourceis not resolved in CO emission, with an extent <∼5′′.

880 V. Bujarrabal et al.: Mass, linear momentum and kinetic energy of bipolar flows in protoplanetary nebulae
Table 3. Calculations of the mass, momentum and kinetic energy for the sources observed in CO by us.
source mass momentum kinetic energy PL/c comments
M(M�) P (g cm s−1) E(erg) (yr)
IRAS 04296+3429 L/c = 2.8× 1034 g cm s−1 yr−1
slow component 0.13 2.5× 1038 1.3× 1044 9× 10³
fast outflow 3.7× 10⁻³? 3.3× 1037? 7.7 × 1043? 1.2× 10³? from 12CO J = 1–0, uncertain analysisCRL 618 L/c = 1.2× 1035 g cm s−1 yr−1
slow component 0.65 2.1× 1039 1.8× 1045 1.8× 10⁴ assuming Trot = 25 Kfast outflow 0.045 8.4× 1038 5.2× 1045 7× 10³ from 12CO J = 1–0
Frosty Leo L/c = 1.1× 1034 g cm s−1 yr−1
slow component 0.36 8.0× 1038 4.5× 1044 7× 10⁴
fast outflow 0.56 9.0× 1039 4.0× 1046 8× 10⁵ bipolar modelfast outflow 0.60 4.6× 1039 8.1× 1045 4.2× 10⁵ spherical-isotropic modelfast outflow 0.56 6.5× 1039 1.1× 1046 6× 10⁵ disk, constant radial velocity
IRAS 17436+5003 L/c = 2.4× 1035 g cm s−1 yr−1
slow component 0.57 1.2× 1039 6.2× 1044 5× 10³
fast outflow 0.11 6.1× 1038 8.6× 1044 2.5× 10³ weak wingsHe 3–1475 L/c = 3.6× 1034 g cm s−1 yr−1
slow component 0.16 2.5× 1038 1.1× 1044 7× 10³
fast outflow 0.47 1.8× 1039 3.1× 1045 5× 10⁴
89 Her L/c = 1.3× 1034 g cm s−1 yr−1
slow component 3.3× 10⁻³ 2.2× 1036 3.8× 1041 1.7× 10²
fast outflow 1.0× 10⁻³ 2.9× 1036 1.7× 1042 2.2× 10²
AFGL 2343 L/c = 2.3× 1036 g cm s−1 yr−1
unique, fast component 4.8 2.8× 1040 4.4× 1046 1.2× 10⁴ spherical envelopeIRC +10420 L/c = 2.8× 1036 g cm s−1 yr−1
unique,fast component 2.1 1.5× 1040 2.6× 1046 5× 10³ spherical envelope; extendedIRAS 19500-1709 L/c = 6.1× 1033 g cm s−1 yr−1
slow component 0.026 5.0× 1037 2.5× 1043 8× 10³
fast outflow 6.7× 10⁻³ 5.3× 1037 1.4× 1044 9× 10³
CRL 2477 L/c = 1.6× 1034 g cm s−1 yr−1
unique, fast component 0.11 4.4× 1038 6.1× 1044 2.8× 10⁴ bipolar outflow (?)CRL 2688 L/c = 1.0× 1035 g cm s−1 yr−1
slow component 0.69 2.2× 1039 1.7× 1045 2.2× 10⁴
fast outflow 0.062 9.6× 1038 3.9× 1045 1.0× 10⁴ bipolar model; i = 15◦
fast outflow 0.062 5.0× 1038 7.8× 1044 5× 10³ spherical modelNGC 7027 L/c = 4.0× 1034 g cm s−1 yr−1
main component 0.60 1.8× 1039 1.3× 1045 4.5× 10⁴ from 12CO J = 1–0; extendedmain component 0.17 5.2× 1038 4.0× 1044 1.3× 10⁴ from 13CO J = 1–0very fast outflow 0.033 3.7× 1038 8.5× 1044 9× 10³ from 12CO J = 1–0; spherical model
IRAS 22272+5435 L/c = 3.3× 1034 g cm s−1 yr−1
unique, slow component 0.14 2.6× 1038 1.2× 1044 8× 10³ spherical envelope; extendedunique, slow component 0.20 3.6× 1038 1.7× 1044 1.1× 10⁴ spherical envelope; Trot = 25 Kunique, slow component 0.18 2.9× 1038 1.2× 1044 9× 10³ AGB envelope modelno fast outflow detected <6.1× 1037 <1.8× 10³
IRAS 23304+6147 L/c = 4.0× 1033 g cm s−1 yr−1
slow component 5.9× 10⁻³ 9.5× 1036 1.3× 1042 2.4× 10³ from 12CO J = 2–1, underestimate?fast component 8.0× 10⁻⁴ 2.1× 1036 1.4× 1042 5.3× 10² from 12CO J = 2–1, underestimate?
IRAS 23321+6545 L/c = 2.3× 1033 g cm s−1 yr−1
unique, fast component 0.014 6.0× 1037 5.9× 1043 2.6× 10⁴ bipolar (?); i = 30◦, D = 1 kpc (?)M 2–56 L/c = 4.0× 1034 g cm s−1 yr−1
slow component 0.046 1.3× 1038 9.5× 1043 3.3× 10³ from 12CO J = 1–0fast component 0.059 1.3× 1039 8.7× 1045 3.3× 10⁴ from 12CO J = 1–0
The 13CO J = 2–1/J = 1–0 line ratio indicates a rota-tional temperature compatible with our range of low tem-peratures (Sect. 4). The HST image (Sahai et al. 2000)suggests that the compact CO emission comes from thebright equatorial regions of the nebula. Therefore, in thissource it is justified to calculate mass, momentum and
energy for the fast component using the disk model de-scribed in Sect. 4.1 (with i = 15◦), together with thestandard bipolar and spherical models. As we can see inTable 3, the results do not strongly depend on the used ge-ometrical model. Note the particularly high ratio betweenthe gas and radiation momenta.

V. Bujarrabal et al.: Mass, linear momentum and kinetic energy of bipolar flows in protoplanetary nebulae 881
Finally we note that this source is one of those charac-terized by a particularly low 12CO/13CO line ratio. Evenfor the line wings and the J = 1–0 transition, the lineratio is <3. Similar results (e.g. Bujarrabal et al. 1990)have been interpreted as showing the presence of a verylow 12C/13C abundance ratio in some evolved nebulae. SeeSahai et al. (2000) for more details.
5.1.4. IRAS 17436+5003
This source shows line wings that are weak, but can beidentified even in 13CO J = 1–0; in any case we havechecked that the parameters obtained from 12CO and13CO J = 1–0 are quite similar. No extent in the CO lineswas detected by Bujarrabal et al. (1992), using the 30-mtelescope. The 13CO J = 2–1/J = 1–0 line ratio indicatesa rotational temperature compatible with our general as-sumptions. We will accordingly use the 13CO J = 1–0transition with our standard procedure; an expansion ve-locity of 11 km s−1 for the slow component is used. Notethat the inclination is not known, so we take a bipolaroutflow with i = 30◦. The lower limit to the momentumdue to this assumption is just a factor 2 lower than thevalues given in Table 3.
5.1.5. He 3–1475
He 3–1475 shows wide CO profiles, from which we deduceVsys = 50 km s−1 LSR. We have chosen a composite modelwith a slow component, corresponding to the line coreand an expansion velocity ∼7 km s−1, and a fast outflow,that is assumed to be bipolar in view of the spectacu-lar elongated structure of the nebula (Borkowski et al.1997). The identification of the line core in this source isnot straightforward, but we note that variations of its ex-pansion velocity affect only slightly the momentum andenergy calculations of the fast outflow, due to the verylarge velocity and strong CO emission of the later. Thewings are detected in all lines; note some galactic contam-ination in 12CO J = 1–0. We performed small maps thatindicate a negligible CO extent, compared with the tele-scope resolution. The rotational temperature suggested bythe line ratios is compatible with our general assumptions.Therefore, we apply to this source our standard procedure,for both the line core and the wings.
This source shows a very low 12CO/13CO line ratio;even in the relatively weak line wings and the J = 1–0 transition, the line ratio is <∼3, see Sect. 5.1.3. If werecalculate the mass, momentum and energy from the12CO J = 1–0 (assuming an abundance X(12CO) =2 × 10⁻⁴) we find for all three parameters values aboutthree times smaller than those given in Table 3.
5.1.6. 89 Her
The difference between line core and wings in the CO linesfrom 89 Her is not clear. We adopt, somewhat arbitrarily,
a slow component velocity∼3 km s−1 (note that the line isanomalously narrow, as always found in low-mass PPNe,see Sect. 8.2). The systemic velocity is −8 km s−1. Theanalysis is simplified by the fact that no sign of departurefrom spherical symmetry and radial expansion is foundfrom the CO mapping of this source (Alcolea & Bujarrabal1995), so the model would be the same for the line coreand wings. These authors also confirm the small extent ofthe source. The line ratios are consistent with the low ro-tational temperatures adopted in our standard procedure.
5.1.7. AFGL 2343 and IRC +10420
AFGL 2343 and IRC +10420 are yellow hypergiant starssurrounded by a very thick circumstellar envelope (seede Jager 1998 and Sect. 2). We have included these twostars in our sample because its evolution may be similarto that of PPNe (Sect. 2), but we must keep in mind thatthey are relatively different objects than the rest of thesample.
Both stars show probably spherical envelopes withradial expansion. This is deduced for IRC +10420 fromobservations in OH maser and CO and SiO thermalemissions (Nedoluha & Bowers 1992; Neri et al. 1998;Castro-Carrizo et al. 2001). For AFGL 2343, there arehigh-resolution CO data (Neri et al., in preparation)and accurate NIR mapping (Hawkins et al. 1995). OurCO spectra are consistent with this interpretation, theyshow very wide profiles with no clear core+wing struc-ture; the total widths suggest high expansion velocitiesof 33 km s−1 and 35 km s−1 respectively for AFGL 2343and IRC +10420. We adopted Vsys = 100 km s−1, forAFGL 2343, and Vsys = 78 km s−1, for IRC +10420. Notethe variations in the profile from line to line, suggestingopacity effects in, certainly, the 12CO J = 2–1 transitionand also, probably, in the J = 1–0 one. Data from Neriet al. suggest a CO source size much smaller than ourJ = 1–0 beam; only for IRC +10420 the convolved sizecould be slightly larger than the telescope beam, for thissource we introduced a correction of a factor 1.3 to thededuced values to take into account the extent. The lineratios are consistent with the low Trot adopted here.
We accordingly apply our standard procedure toAFGL 2343 and IRC +10420, assuming spherical symme-try and radial expansion for the whole CO emission. Notethe very high mass of these envelopes, already suggestedfrom previous data.
For AFGL 2343 we adopted the distance deduced fromthe Hipparcos paralax, which is uncertain but compatiblewith the high luminosity of hypergiants. Recently, Josselin& Lebre (2001) have argued that this object could be a“normal” PPN, at a much shorter distance and with amuch lower luminosity. If this is the case, the values ofthe mass and momentum we derive will be also smaller(proportionally to D2), but the ratio between the gas andluminosity momenta will remain the same as that given inTable 3, indeed comparable to those found in most PPNe.

882 V. Bujarrabal et al.: Mass, linear momentum and kinetic energy of bipolar flows in protoplanetary nebulae
5.1.8. IRAS 19500–1709
This source shows a clear separation between slow and fastoutflow components. The small CO extent (Bujarrabalet al. 1992) and the line intensity ratios confirm the as-sumptions in our standard model. The systemic velocityis deduced from the spectra to be 25 km s−1, and theexpansion velocity of the slow component is taken to be10 km s−1. Since the inclination is not known, we will usei = 30◦, so the lower limit to the momentum (energy) is2 (4) times smaller than the value in the table. We havechecked that the 12CO line gives similar values for thedynamical parameters.
5.1.9. CRL 2477
We recall the uncertain post-AGB nature of this source(Sect. 2). We also note the galactic contamination close toVLSR = 0 km s−1, we have restored the profiles by interpo-lating adjacent channels. Due to this contamination andto the unknown inclination of the source, we have assumeda unique bipolar component with i = 30◦; remember thatin this case the lower limit to the momentum is 2 timessmaller than the calculated value. The adopted systemicvelocity is 4 km s−1. Neri et al. (1998) deduced a verysmall size for the CO cloud and the very low J = 2–1/J = 1–0 intensity ratio confirms the usually assumedlow Trot.
5.1.10. CRL 2688
This well studied source shows profiles clearly composedof a core plus wide wings. The extent of the line core COemission (at half maximum) is ∼10′′ (Yamamura et al.1996; Cox et al. 2000), which is taken into account in ourcalculations. Multiple jets are found in this nebula, butthe overall inclination is relatively well known, see Sahaiet al. (1998). From the maps by Cox et al., it can be seenthat most of the line-wing emission comes from an axialflow. Some high-velocity CO emission also comes from apeculiar extension in the equatorial plane. We estimatefrom those maps that the bipolar approximation may bewrong for just ∼1/4 of the wing integrated intensity; thepossible correction is in any case small, compared to un-certainties due to other reasons. We also note that, giventhe small inclination angle, the effects on the calculatedvalues of the geometry are particularly important in thissource. In order to get an idea of the uncertainties due tothe complex geometry, we are also giving in Table 3 cal-culations following the spherical-isotropic approximationfor the fast outflow, although our discussion will be basedon the results obtained following our bipolar model.
We have adopted, from the shape of the line core,Vsys = −35 km s−1 and an expansion velocity for the slowcomponent equal to 15 km s−1. We have checked that the13CO line ratio is compatible with the assumed low tem-peratures and that both 12CO and 13CO J = 1–0 lines givesimilar results (within a factor 2, being the mass from the
12CO data somewhat smaller, as expected if some opacityeffect is present).
5.1.11. NGC 7027
NGC 7027 is a young PN, with a hot central star thatshows particularly intense and well studied CO emission(contrarily to other PNe). The analysis of our data onNGC 7027 is particularly difficult because of the extent ofthe CO emission, that is known to arise from a structureabout 20–25′′ wide (Bieging et al. 1991; Graham et al.1993). Our maps are not good enough as to allow an ac-curate spatial integration of the brightness, so we mustassume an intrinsic source size and multiply by the bright-ness observed in the central position. We deduce that thearea of the convolved profile is twice that of our J = 1–0beam. Due to the uncertainty of this correction, it is diffi-cult to check that the line ratios are compatible with theassumed rotational temperatures. We will use Trot = 15 K,but we mention that if we instead take 30 K, as proposedby Jaminet et al. (1991) from multiline CO observations,the correction to our values of the mass, momentum andenergy would just be of a factor 1.6.
The accurate mapping by Bieging et al. and Grahamet al. suggests that the CO emission mainly comes from aradially expanding shell. We therefore apply a spherical-isotropic model, considering separately an inner spectralregion defined by the velocity range 5–51 km s−1 (we haveassumed Vsys = 26 km s−1) and the rest of the profile: theweak and very wide wings, see Fig. 12. These remarkablevery wide wings have been detected for the first and itsorigin is unknown, the asymmetry in the profiles may bedue to observational effects.
The 12CO/13CO line intensity ratio in NGC 7027shows the opposite phenomenon than for other PPNementioned above. The line ratio is very high, comparedwith the usual observations in evolved objects. This resultmay be due to the presence of selective photodissociationby UV photons from the inner hot star (see Fong et al.2001, where it is discussed the case of this and other PNethat have developed a massive PDR and also show veryfaint 13CO lines). Under this interpretation, 12CO wouldsurvive in a relatively thick layer, much thicker than thatin which 13CO is abundant. In view of this phenomenon,we think that it is more meaningful to use for our pur-poses the 12CO J = 1–0 observations. Therefore, the val-ues of the calculated parameters may be underestimatedfor this source due to opacity effects, but this underesti-mate is probably minor for the high-velocity component,in view of their very low brightness and the large extent ofthe source. For the sake of comparison, we also show themass, momentum and energy derived from 13CO J = 1–0for the inner intense spectral feature (assuming our stan-dard 13CO abundance). These figures then represent thedynamical parameters for the layer that is rich in 13CO,probably much thinner than the 12CO-rich shell.

V. Bujarrabal et al.: Mass, linear momentum and kinetic energy of bipolar flows in protoplanetary nebulae 883
5.1.12. IRAS 22272+5435
IRAS 22272+5435 is one of the few PPNe emitting inCO that show no sign of high-velocity line-wings downto a good limit, compared to the intensity of the maincomponent, that appears very similar to the profiles ob-served from shells around AGB envelopes. We use Vsys =−28 km s−1. The image in 12CO J = 1–0 is practically cir-cular and extending 21′′ (Neri et al. 1998), i.e. comparableto our beam. Assuming that the brightness distribution isthe same for 12CO and 13CO J = 1–0, we derive that acorrection of a factor 1.9 must be applied in our analysisto account for the extent. The 13CO line ratio suggests alow rotational temperature. So, our standard method isapplied to a unique spherical component.
Since the CO emission is very similar to that of AGBenvelopes, we apply the usual methods to calculate massloss rates and circumstellar molecular mass in such ob-jects. We will follow the method described by Loup et al.(1993), that takes into account the CO excitation andopacity (from model grids) and the theoretical photodisso-ciation radius. We use an expansion velocity of 8 km s−1,a fractional 12CO abundance X(12CO) = 6× 10⁻⁴ (typi-cal of C-rich AGB envelopes), and D = 1.7 kpc (Table 1).(Note that in this source the 12CO/13CO J = 1–0 lineratio is larger than 20, in spite of the signs of opac-ity effects in 12CO J = 1–0, suggesting that in thissource X(12CO)/X(13CO) must be larger than the val-ues we have adopted up to now.) The results are M =1.1×10⁻⁵ M� yr−1 and a photodissociation radius RCO =4×1017 cm, with an envelope formation time ∼1.6×10⁴ yr.For the used expansion velocity, these figures give a to-tal mass in the CO-rich envelope ∼0.18 M�, very similarto that deduced from 13CO J = 1–0 and our standardmethod (0.14 M�). Both results as well as the deducedvalues for the other parameters are given in Table 3.
Following the method depicted in Sect. 5.2, we have(crudely) estimated an upper limit for the momentumcarried by the bipolar outflow (if it exists). We used our13CO J = 1–0 spectrum, assuming that the wings are notdetected down to a level ∼5% of the peak intensity andadopting that the typical width for the detected line is20 km s−1. See results in Table 3.
5.1.13. IRAS 23304+6147 and IRAS 23321+6545
The existing information on these two sources is poor.They have been observed in the optical by Hrivnak et al.(1999) and Ueta et al. (2000), showing a subarcsec image.IRAS 23321+6545 has been mapped in CO by Neri et al.,its image being also very small. We have only observedthem in 12CO J = 2–1 and 13CO J = 1–0 being the 13COemission very weak, undetected in IRAS 23304+6147. Inview of the lack of data on them, we will apply our stan-dard procedure.
For IRAS 23304+6147 we will use the 12CO line, so wemust keep in mind that opacity effects may be present (seediscussion in Sect. 5.2). However, the intensity contrastbetween the 12CO J = 2–1 and the 13CO J = 1–0 is verystrong, larger than ∼80 (the theoretical intensity ratio de-rived for optically thin emission and the other assumptionsused here). Therefore, we believe that such opacity effectsare not very important in this source and that the derivedvalues from 12CO J = 2–1 are not strong underestimates.The systemic velocity is −16 km s−1. For the central partof the line we use a spherical-isotropic model with expan-sion velocity equal to 9 km s−1. For the line wings, we useour bipolar model with i = 90◦, so the momentum andenergy results are directly the minimum values (if onlygeometry effects are considered).
For IRAS 23321+6545 we will use the 13CO J = 1–0line, with the systemic velocity and velocity range deducedfrom the 12CO line, respectively Vsys = −55 km s−1 andVsys ± 20 km s−1. Note the galactic contamination, thatdoes not affect the 13CO nebular line. We suppose a uniquecomponent in the bipolar approximation with i= 30◦. Thebipolarity of the outflow is in this case also suggested bythe HST images (Ueta et al. 2000). For this source thedistance is not known, we will adopt D = 1 kpc; this valuecould be a lower limit in view of the low values found forthe distance-dependent parameters (M , P , L, etc.), whichcould be underestimated (but not the comparison of M ,P and E with the stellar luminosity).
5.1.14. M 2–56
This source has been recently mapped with the Plateaude Bure interferometer (paper in preparation), confirmingthe presence of a high-velocity outflow and an hourglass-like structure. Model fitting of the maps per velocity in-dicates an inclination with respect to the plane of the skyi ∼ 15◦. Only a small fraction of the source (a couple ofextreme axial knots) is found to be placed in the limit ofthe J = 1–0 beam of the 30 m telescope. In order to esti-mate the effect of the source extent, we performed a smallmap, the resulting correction for the wing emission shownin Fig. 16 is not very large, ∼40%. The low value of isuggests that the dynamical parameters in this source canbe overestimated in the central hourglass-like region, sincethe projection correction may be too large if a componentof the expansion is perpendicular to the axis. We recallthat the overestimate of the momentum from our modelwith respect to an isotropical expansion is of a factor 2.
The wings are very weak in 13CO J = 1–0, so weused in our calculations the 12CO J = 1–0 line. Wehave checked that the calculated mass values for the linecore are not smaller when using the 12CO line instead ofthe 13CO line, so opacity effects are negligible even forthe central velocities. We assumed a systemic velocity of−27 km s−1 (LSR) and an expansion velocity for the slowcomponent equal to 14 km s−1.

884 V. Bujarrabal et al.: Mass, linear momentum and kinetic energy of bipolar flows in protoplanetary nebulae
5.2. Other sources detected in CO emission
For the PPNe detected in CO by other authors, we havechosen the best published spectra, i.e. those with the high-est S/N ratio, preferably 13CO and J = 1–0 lines, andwith information as complete as possible on the observa-tion conditions. The lines are analyzed as explained before,taking into account the effects due to the different beamsizes and efficiencies. When possible, i.e. for a few wellstudied nebulae, we will directly use the published resultson mass and kinematics. See parameters of these nebulaein Table 2 and the results of our calculations in Table 4.
Note that our results for this group of sources, includ-ing the absence of line wings, are often very uncertainbecause of the scarce data on CO and on other needed pa-rameters. The 12CO J = 2–1 line, used when it is the onlyavailable spectrum with high S/N ratio, probably leads toan important underestimate of the derived mass, momen-tum and energy, because of probable high opacity and pos-sible resolution of the spatial source extent. See the case ofRoberts 22 in Sect. 5.2.5. When other lines are used, ourmethod gives mass values comparable to other estimates,see general discussion in Sects. 4 and 5.1.12, 5.2.3, 5.2.15.
For these CO lines taken from the literature, we willmainly analyze the line wings and the associated fast out-flows. Often the quality of the observations is not goodenough to allow a study of the slow component, sincethe definition of the different spectral features needs high-quality profiles and since the opacity effects for the linecore are expected to be particularly important.
We also tried to estimate limits in the cases in whichthe line wings are not detected. The treatment of limitsin our case is very difficult, since when the line wings arenot detected we lack also for information on the veloc-ity. All we can do, under these conditions, is to performcrude estimates, based on the “reasonable” assumptionthat the extent of each line wing should be comparable tothe width of the detected profile. The typical LSR velocityof the wing would then be equal to the systemic velocity±this width. Given the uncertainties of the analysis, we willonly estimate limits to the scalar momentum. We did notconsider the nondetections when only the 12CO J = 2–1line is available, since then the accumulation of uncertain-ties yields useless data. These limits are given in Table 4for the four sources for which the method can be applied.
Now we discuss the details of the analysis source persource.
5.2.1. Red rectangle
This source shows narrow lines with wings, that will beanalyzed as coming from a bipolar outflow. But we mustkeep in mind that the kinematics of the Red Rectanglemay be different from that usual in PPNe (Jura et al.1995). We will use the 12CO J = 2–1 line by Jura et al.,the best CO spectrum published for this source. We deriveVsys = 0 km s−1, and that the line wings extend between−7.4 and −2 km s−1 and between 2 and 7.3 km s−1 LSR.
The source is assumed to be small compared to the beamof the telescope (IRAM 30 m), since mapping with thisinstrument scarcely detected any extent (unpublished ob-servations). Other parameters used are in Table 2.
5.2.2. IRAS 07134+1005
This source shows no wings in the CO lines (Bujarrabalet al. 1992; Knapp et al. 1998), down to a limit of about1/10 of the peak for the 12CO lines. We estimated alimit to the momentum using the 12CO J = 1–0 lineby Bujarrabal et al., and the prescriptions explained inSect. 5.2; we adopted a typical width for the detectedspectrum ∼20 km s−1. The CO source is not significantlyextended, so no correction for this is done. The rest of theparameters used in the analysis (Table 2) are relativelywell known for this source.
5.2.3. OH 231.8+4.2
This nebula has been studied by Sanchez Contreras et al.(1997) using a method almost identical to ours andaccurate mapping. We will adopt the results given inthat paper without any change. As discussed by SanchezContreras et al. (1997) and Alcolea et al. (2001), the nebu-lar mass obtained in this way is compatible with the valuesgot from other molecular lines and FIR data.
5.2.4. Hen 3–401
The CO spectra published by Bujarrabal & Bachiller(1991) show a profile about 30–40 km s−1 wide with someindication of fast outflow emission. The analysis of thesedata is very uncertain due to the poor profiles. In particu-lar, only the 12CO J = 2–1 line shows some indication ofits shape, so an underestimate of the derived parametersis expected (see Sect. 5.2). We will assume, perhaps arbi-trarily, that the line core extends about 22 km s−1 aroundthe systemic velocity, Vsys ∼ −30 km s−1 LSR. FollowingBujarrabal and Bachiller, we will assume that the extentof the source is significantly smaller than the telescoperesolution.
5.2.5. Roberts 22
Observations of 12CO J = 2–1 by Bujarrabal & Bachiller(1991) show a very broad profile, about 100 km s−1
wide. As for other sources with similar characteristics(Sect. 5.1), we take the whole spectra in our analysis, andnote that very similar results are obtained if a slow com-ponent with expansion velocities of about 10 km s−1 isconsidered. Bujarrabal and Bachiller note that the sourcedoes not seem to be extended. The values obtained forthe total mass (Table 4) are lower by about a factor 10than the results by Bujarrabal and Bachiller, from fittingof the CO line by a model of AGB envelope emission, andby Sahai et al. (1999b), from analysis of the circumstellar

V. Bujarrabal et al.: Mass, linear momentum and kinetic energy of bipolar flows in protoplanetary nebulae 885
Table 4. Calculations of the mass, momentum and kinetic energy for the sources observed in CO by other authors.
source mass momentum kinetic energy PL/c
comments
M(M�) P (g cm s−1) E(erg) (yr)
Red Rectangle L/c = 4.0× 1033 g cm s−1 yr−1
fast outflow 5.2 × 10⁻⁵ 1.5× 1035 1.2× 1041 38 peculiar dynamics, underestimate?IRAS 07134+1005 L/c = 5.4× 1034 g cm s−1 yr−1
no fast outflow detected <1.9× 1038 <3.5× 10³
OH 231.8+4.2 L/c = 4.0× 1034 g cm s−1 yr−1
fast outflow 0.22 3.9× 1039 2.2× 1046 105 well studied, conspicuous bipolar flowHen 3–401 L/c = 1.5× 1034 g cm s−1 yr−1
fast outflow? >0.01? >9× 1037 ? >3× 1044? >6× 10³? poor data, uncertain analysisRoberts 22 L/c = 1.2× 1035 g cm s−1 yr−1
fast outflow >0.018 >2.2× 1038 >9.2× 1044 >1.8× 10³ probable underestimate, unique componentHD 101584 L/c = 1.2× 1034 g cm s−1 yr−1
fast outflow 0.1 1.5× 1039 1046 1.3× 10⁵ well studied, conspicuous bipolar flowBoomerang Nebula L/c = 1.2× 1033 g cm s−1 yr−1
fast outflow 1.9 6.2× 1040 5.1× 1047 5× 10⁷ outer shell, spherical?fast outflow >∼0.07 >∼5× 1038 >∼9× 1044 >∼4× 10⁵ inner shell, spherical?
He 2–113 L/c = 2.0× 1034 g cm s−1 yr−1
fast outflow >5.5× 10⁻³ >4.1× 1037 >8.7× 1043 >2× 10³ probable underestimate, uncertain analysisMz–3 L/c = 2.3× 1034 g cm s−1 yr−1
no fast outflow detected poor limit, only 12CO J = 2–1M 2–9 L/c = 2.2× 1033 g cm s−1 yr−1
no fast outflow detected <1.2× 1036 <5.5× 10²
CPD –568032 L/c = 2.1× 1034 g cm s−1 yr−1
fast outflow 0.043 6.1× 1038 2.7× 1045 2.9× 10⁴
IRAS 17150–3224 L/c = 4.4× 1034 g cm s−1 yr−1
no fast outflow detected poor limit, only 12CO J = 2–1OH 17.7–2.0 L/c = 1.2× 1034 g cm s−1 yr−1
no fast outflow detected poor limit, only 12CO J = 2–1R Sct L/c = 1.6× 1034 g cm s−1 yr−1
no fast outflow detected <6.6× 1035 <41M 1–92 L/c = 4.0× 1034 g cm s−1 yr−1
fast outflow 0.7 3× 1039 7× 1045 8× 10⁴ well studied, conspicuous bipolar flowIRAS 19475+3119 L/c = 5.1× 1034 g cm s−1 yr−1
fast outflow >0.026 >1.6× 1038 >2.8× 1044 >3.1× 10³ probable underestimateIRAS 20000+3239 L/c = 2.2× 1033 g cm s−1 yr−1
no fast outflow detected poor limit, only 12CO J = 2–1IRAS 20028+3910 L/c = 2.7× 1034 g cm s−1 yr−1
fast outflow >4.1× 10⁻³ >2.6× 1037 >4.3× 1043 >103 probable underestimateIRAS 21282+5050 L/c = 2.1× 1034 g cm s−1 yr−1
fast outflow 0.2 5.8× 1038 4.2× 1044 2.8× 10⁴
IRAS 22223+4327 L/c = 1.5× 1033 g cm s−1 yr−1
fast outflow >4× 10⁻⁴ >2.3× 1036 >3.5× 1042 >1.5× 10³ probable underestimate, uncertain analysisIRAS 22574+6609 L/c = 6.1× 1032 g cm s−1 yr−1
no fast outflow detected <1.5× 1037 <2.4× 10⁴ poor limit
dust scattering. Probably the use of the usually opaque12CO J = 2–1 line in our analysis, that assumes opticallythin emission, has led to a severe underestimate of themolecular mass and, therefore, of the outflow momentumand energy.
5.2.6. HD 101584
We will use the accurate observations by Olofsson &Nyman (1999). These authors calculate mass and scalarmomentum from their 13CO and 12CO spectra. We willadopt their values, correcting for an inclination i = 30◦,
as used here when the inclination is uncertain, and a13CO relative abundance equal to 2 × 10⁻⁵, in order tobe coherent with the rest of our paper. We also calculatethe kinetic energy from their spectrum, using the aboveprescriptions.
5.2.7. Boomerang Nebula
The Boomerang Nebula was observed in 12CO J = 1–0and J = 2–1 and 13CO J = 1–0 by Sahai & Nyman (1997).These authors found complex, very wide spectra that wereinterpreted as due to an outer very cold shell plus an

886 V. Bujarrabal et al.: Mass, linear momentum and kinetic energy of bipolar flows in protoplanetary nebulae
inner less cold envelope. They fitted the data using de-tailed model calculations and assuming spherical shellswith radial expansion at constant velocity. Even if thismodel is not similar to the bipolar outflows found in otherPPNe, we will take the mass of both components fromthat paper and calculate momentum and energy from themasses and velocities given there (Table 4). We note that,as we have discussed several times in this paper, the cal-culation of mass and momentum from the results by Sahaiand Nyman probably depends only slightly on the as-sumed geometry and would be approximate in the casethat one or both components are bipolar. Note that forthe inner shell Sahai and Nyman only give a lower limitfor the mass.
5.2.8. He 2–113
We have used the 12CO J = 2–1 profile published byKnapp et al. (1990), which shows wide line wings, al-though the profile structure is poorly defined. From dis-cussion in Knapp et al. (1989), we infer that the units inKnapp et al. (1990) are equivalent to Tmb. The CO extentis unknown, but optical and radiocontinuum images arevery small, 1–2′′, see de Marco et al. (1997) and Bedding &Zijlstra (1994), so we will assume that the CO shell is alsomuch smaller than the telescope resolution in those obser-vations (32′′). Since the inclination of the (putative) bipo-lar outflow is unknown, we will use i = 30◦. Other param-eters used in our analysis are Vsys = −56 km s−1 (LSR)and CO line wings extending from −90 to −67 km s−1
and from −48 to −30 km s−1. In general, this object hasnot been well studied (not only in CO), so the derivedparameters remain quite uncertain.
5.2.9. Mz–3
The 12CO J = 2–1 observations by Bujarrabal & Bachiller(1991) show a relatively narrow profile (∼20 km s−1 wide)with no sign of wings. However the observational data arepoor and the limit to the wing emission is just about 1/3of the line peak. No attempt to estimate limits is done forthis source (see discussion in Sect. 5.2).
5.2.10. M 2–9
M 2–9 has been observed in 12CO J = 1–0 and J = 2–1 by Bachiller et al. (1988, 1990), with the 30 m IRAMtelescope, and by Zweigle et al. (1997), who performedhigh-resolution mapping in 12CO J = 1–0. Zweigle et al.found a small extent for the CO cloud, <∼10′′, as well as theabsence of line wings down to a level of about 1/10 of thepeak, i.e. Tmb(12CO J = 1–0) <∼ 0.015 K (30 m-telescopescale; see also Bachiller et al. 1988). The velocity width ofthe lines in this source is very low, indicating an expansionvelocity ∼7 km s−1. We will use these figures to crudelyestimate a limit for the momentum in the fast outflow, if
it exists, following the method in Sect. 5.2; no correctionfor the spatial extent was done.
Exceptionally, we will estimate the mass in the slowenvelope in this source, since it is well mapped in CO andthis value will be useful later (Sect. 8). Using our standardmethod and the above values, we get that the molecularmass in M 2–9 is >∼6.1×10⁻⁴ M�; the upper limit is takenfollowing the discussion by Zweigle et al., who argue thatthe CO abundance in this source may be 10 times lowerthan the one adopted here. Indeed, the mass deduced fromthe fitting of the IR emission by Alcolea & Bujarrabal(1991) is higher than 0.1 M�, and the extent of the beau-tiful nebula imaged in the optical is much larger than theCO ring; probably, CO has been strongly photodissoci-ated in this source and its emission just probes a smallfraction of the nebular material. Note that, corrected theabundance difference, the molecular mass value obtainedhere is in good agreement with that given by Zweigle et al.
5.2.11. CPD –568032
The most useful CO data for this source is the 12COJ = 1–0 spectrum by Nyman et al. (1992), see also Knappet al. (1990). The profiles are clearly composite, with welldefined line wings probably associated to a bipolar out-flow. The CO extent is unknown but the optical image isvery small, 1–2′′ (de Marco et al. 1997), so no correctionfor spatial extent is applied. The inclination of the sourceaxis is unknown, therefore we take i = 30◦. The derivedvelocities from the spectrum are Vsys = −60 km s−1 LSRand wings spanning from −130 to −73 km s−1 and from−42 to 20 km s−1.
5.2.12. IRAS 17150–3234
The best CO data are from Hu et al. (1993), who publisheda 12CO J = 2–1 spectrum. The line is not well measured,showing a narrow profile (about 20 km s−1) and no signof wings up to a limit of 1/5 of the peak. No attemptto estimate limits to the outflow mass and momentum isdone (see Sect. 5.2).
5.2.13. OH 17.7–2.0
This source is difficult to observe in CO due to stronggalactic contamination. The best published spectrum isthat of 12CO J = 2–1 by Heske et al. (1990), in which noline wing is detected, but to a poor limit (partially dueto the galactic contamination). No attempt to estimatelimits is done for this source (see discussion in Sect. 5.2).
5.2.14. R Sct
R Sct is a (peculiar) RV Tauri variable, then probably apost-red-giant object with low initial mass (e.g. Alcolea &Bujarrabal 1991). R Sct is the only RV Tau star showingwell detected CO emission. 12CO J = 2–1 and J = 1–0

V. Bujarrabal et al.: Mass, linear momentum and kinetic energy of bipolar flows in protoplanetary nebulae 887
and 13CO J = 2–1 spectra of R Sct were published byAlcolea & Bujarrabal (1991) and Bujarrabal et al. (1990).The lines are narrow (∼10 km s−1) with no wings down toa limit of about 1/10 of the peak. We used their 12CO J =1–0 line to estimate a limit to the fast outflow momentum(Sect. 5.2); note the low value obtained (Table 4).
Also in this case, we will estimate the mass of the slowcomponent from the 12CO J = 1–0 data in Bujarrabalet al. (1990) and using our standard formulae. We ob-tain for the unique detected component a mass of about8.3×10−4 M�. This value is in good agreement with thatderived by Alcolea & Bujarrabal (1991) by fitting the pho-tometric data on the SED of this source.
5.2.15. M 1–92
M 1–92, Minkowski’s Footprint, is probably the best stud-ied PPN in CO emission. We published accurate 13COJ = 2–1 maps (Bujarrabal 1998a), that were modeled us-ing parameters (distance, inclination, 13CO abundance,etc.) compatible with those given here. We therefore re-produce in Table 4 the results obtained in that paper forthe well defined and studied bipolar outflow. We can seein Bujarrabal et al. (1998a,b) that the mass distributionobtained from this method is compatible with the data ofthe different CO lines and the results from observations ofdust emission and scattering.
5.2.16. IRAS 19475+3119
We take the 12CO J = 2–1 spectrum by Likkel et al.(1991), since their J = 1–0 data are poor. For these olddata from the 30 m IRAM telescope, we will assume thatthe beam resolution is ∼14′′. We take i = 30◦, in view ofthe absence of information on this parameter. We derivefrom the spectrum Vsys = 18 km s−1 LSR and the presenceof wings from −10 to 8 and from 27 to 47 km s−1. Theluminosity given in Table 2 was calculated by us, for thedistance by Likkel et al. (1987), after integrating the IRASfluxes, NIR fluxes from Hrivnak et al. (1994), and V andB magnitudes from the Simbad database.
5.2.17. IRAS 20000+3239
12CO J = 2–1 and J = 1–0 were observed by Likkel et al.(1991), the J = 1–0 line being only tentatively detected.Line widths ∼20–30 km s−1 were found. The profiles areapparently complex but do not show wings, with a limitto their intensity of about 1/5 of the line peak. We couldnot find any indication on the distance to this source, sowe assumed it to be 1 kpc (probably an underestimate,see Sect. 5.1.13). No attempt to estimate limits is donefor this source (see discussion in Sect. 5.2).
5.2.18. IRAS 20028+3910
The 12CO J = 2–1 profile by Likkel et al. (1991) shows ahint of line wings. We take Vsys = 6 km s−1 and wings be-tween −17 and −5 km s−1 and between 17 and 32 km s−1
(LSR). As in Sect. 5.2.16, we assume that the resolutionof the 30 m IRAM’s telescope in these observations was∼14′′. The CO extent was tentatively detected by Neriet al. (1998), who give an ucertain value of the extentof ∼11′′ for 12CO J = 1–0. HST images in the opticalare about 2′′ wide (Hrivnak et al. 1999), and in the IRthe source extent is about 1′′ (Meixner et al. 1999). Weaccordingly do not correct for the source extent in our cal-culations. The axis inclination is not known, so we takei = 30◦.
5.2.19. IRAS 21282+5050
This source has been relatively well studied in CO emis-sion. Meixner et al. (1998) performed interferometric mapsand found that CO is abundant in a (hollow) shell about10′′ wide. However, line wings are detected only in thesingle-dish 12CO data by Likkel et al. (1988). We will usetheir J = 1–0 profile; no correction for the source extentis done here. We take Vsys = 18 km s−1 LSR and wings inthe ranges −4 → 8 km s−1 and 30→ 40 km s−1.
5.2.20. IRAS 22223+4327
The best CO measurement in this source is the 12CO J =2–1 spectrum by Omont et al. (1993), see also Likkel et al.(1991). We assume in this case that the telescope beam is14′′ wide at half maximum (Sect. 5.2.16). The CO extent isunknown in this source, but its IR image is very compact(1–2′′, Meixner et al. 1999), and we assume the CO sourceto be much smaller than the beam. We find from Omontet al’s data, Vsys = −30 km s−1 and wings between −52and −41 km s−1and between −18 and −8 km s−1. Due tothe lack of data on this source, we assume i = 30◦ andD = 1 kpc (this value probably being a lower limit, seeSect. 5.1.13).
5.2.21. IRAS 22574+6609
The best CO profiles of this source (12CO J = 2–1 andJ = 1–0, by Likkel et al. 1991) are ∼40 km s−1 wide andshow no clear wings. The S/N ratio and the profile shapein these observations are not good enough to allow a limitfor the line wing emission better than about 1/10 of thepeak. In the J = 1–0 line one tentatively sees wings thatare not confirmed in the J = 2–1 profile. In any case, weused the J = 1–0 line by Likkel et al. to crudely estimatea momentum limit for the fast outflow, with the methodand limitations explained in Sect. 5.2. We assumed a typ-ical width ∼20 km s−1 for the line core. Note that in thissource the limit to the momentum is moreover uncertaindue to the unknown distance, but that this does not affectthe value of P
L/c , also quoted in Table 4.

888 V. Bujarrabal et al.: Mass, linear momentum and kinetic energy of bipolar flows in protoplanetary nebulae
6. Characteristic duration of the strong massacceleration
As we will see in the next sections, we are interested inestimating, from the existing data, the time spent by thesources studied here as post-AGB stars (tppn) and the timeduring which the high-velocity CO outflows were acceler-ated (tacc).
An approximate upper limit to the value of tppn in in-dividual sources is given by the typical value of the totalpost-AGB lifetime, ∼1000 yr. Such a value of the “transit”time from the AGB to the PN phase can be derived follow-ing several methods and agrees with theoretical estimates(see e.g. Bujarrabal et al. 1988).
When possible, tppn is calculated for individual sourcesfrom data on the CO outflow, i.e. dividing the charac-teristic length by the velocity, taking into account theinclination of the jets with respect to the plane of thesky (Table 1). When accurate CO data are not available,but the circumstellar shell is known to be detached andthere are measurements of its inner radius (rid), we as-sume that tppn ∼ rid/Vagb, where Vagb is the expansionvelocity of the AGB wind measured as the half-width ofthe CO line-core (see Sects. 4.1 and 8.1). A relativelyuncertain estimate of rid can be made from fitting thesource’s SED (spectral energy distribution) by means ofdust absorption-emission models. In some cases, this esti-mate of rid is compatible with IR mapping (Meixner et al.1997), but in general the results from pure SED fitting areuncertain (compare the measured values of rid in Table 5for AFGL 2343, IRAS 22272+5435 and IRAS 07134+1005with those estimated from the SED by Kwok et al. 1989;Hrivnak et al. 1989) and must be used with caution. InIRAS 21282+5050 the inner radii determined from COand IR mapping are significantly different; we suggest thatthis can be due to CO photodissociation by the stellar UVradiation, since this source is known to present a well de-veloped central PDR with a mass ∼0.1 M� (Fong et al.2001). We will accordingly prefer the IR data in this case,but keeping in mind the uncertainty of the result. We willnot use in our estimates the values of shell radii and veloc-ities obtained from the HH-like objects emitting in atomiclines (like those observed in He 3–1475, Riera et al. 1995),since the interpretation in terms of tppn of the kinemat-ics of this gas (probably ejected in the post-AGB phaseand excited by counter-shocks) is not obvious. However,we will use the radii of the (empty) shells found by deMarco et al. (1997) from high-resolution mapping of Hβemission, since those structures, when detected, are oftencomparable in size to the inner layers of the dense shells.The values we obtain for tppn are given in Table 5. Seevelocities from the CO profiles in Sect. 5; some referenceson bipolar jets’ structure are detailed in this section andthose on the detached shell size are also given in Table 5.Other parameters needed in the calculation, like the dis-tance and inclination, are taken from Table 1.
A first estimate of the typical value of the time neededto form the high-velocity flows (the acceleration time,
tacc) is given by statistical studies (Bujarrabal et al. 1992;Trammell et al. 1994), that show that bipolar ejections ap-pear and are already massive in PPNe that are thought tobe relatively young. Therefore, the strong gas accelerationtook place at the beginning of its evolution and was veryshort, much shorter than the characteristic PPN lifetime.So, tacc < tppn, for individual sources, tacc � 1000 yr, ingeneral.
A better estimate of tacc can be reached in some cases,in which a clearly linear dependence of the velocity of thefast molecular gas on the distance to the central star hasbeen found; such a result is sometimes called the “Hubblelaw” of the PPN kinematics. It has been argued (e.g.Alcolea et al. 2001 and references therein) that this lawstrongly suggests that the acceleration of the massive neb-ular flow was produced in a very short time, compared tothe total lifetime of the nebula, since free movement isthe easiest explanation of the Hubble law. The durationof such a process can readily be estimated from the dis-persion of the empirical dependence of the velocity withthe distance. The characteristic acceleration time (tacc)should be given by the characteristic PPN time (that canbe derived with the same result for all points in whichthe law is satisfied), multiplied by a factor equal to therelative dispersion of the observational points in the ve-locity vs. distance diagram (∆(r)/r). We must keep inmind that, since some part of this dispersion can be dueto inhomogeneities in the density distribution or obser-vational noise, the values so obtained could be overesti-mates of the actual tacc. So, for these sources we will adopttacc
<∼ tppn ×∆(r)/r.
The typical acceleration times so calculated are aston-ishingly short. Mainly for the well studied cases, for whichthe above overestimate is not important. In OH231.8+4.2(Alcolea et al. 2001), the “Hubble law” applies along avery elongated structure with a dispersion, ∆(r)/r ∼ 1/5;the kinematical PPN age of this nebula is tppn ∼ 800 yr,so the acceleration time, tacc, is <∼160 yr. For M 1–92 thevelocity as a function of the distance was modelized byBujarrabal et al. (1998a). From the comparison of themodel predictions with the observations, we estimate thatin this source ∆(r)/r ∼ 1/8–1/10; the PPN time ∼ 900 yr,so tacc
<∼ 100 yr. The molecular outflow in HD 101584 alsoshows a clear distance dependence (Olofsson & Nyman1999), with a dispersion ∆(r)/r ∼ 1/5 and tppn ∼ 150 yr;so, for HD 101584 we obtain tacc
<∼ 30 yr. Note that weassumed in this calculation a standard value of the incli-nation of the flow axis with respect to the plane of thesky (i = 30◦ see Sect. 5.2.6), Olofsson and Nyman fa-vor smaller values of this parameter, which would leadto even smaller acceleration times. Recent, unpublishedCO observations of M 2–56 have also shown a linear dis-tance dependence of the outflow velocity, with ∆(r)/r ∼1/5, and tppn ∼ 1500 yr. These maps also show the pres-ence of a central ring with an inner radius of about 1–2′′, equivalent to 7 × 1016 cm; for an expansion veloc-ity of the slow component of 14 km s−1, the obtained

V. Bujarrabal et al.: Mass, linear momentum and kinetic energy of bipolar flows in protoplanetary nebulae 889
Table 5. Characteristic time spent by the studied sources as PPNe, tppn, and time needed to accelerate the observed molecularoutflows, tacc. rid is the inner radius of the detached shell, when it can be estimated.
name rid tppn tacc refs. comments(cm) (yr) (yr)
IRAS 04296+3429 1016 370 <370 1, 2
CRL 618 110 ≤110 0, 3 complex law for V (r), well studiedFrosty Leo 300–900 �500 0, 4
IRAS 17436+5003 ∼1.1× 10¹⁷ ∼2400 5 uncertain rid
He 3–1475 ? ?89 Her ? ?AFGL 2343 1.1× 10¹⁷ 1100 ≤1100 ? 6 yellow hypergiantIRC +10420 1017 900 ≤900 ? 7 yellow hypergiantIRAS 19500-1709 4× 10¹⁵ 120 <120 5, 2
CRL 2477 ? ?CRL 2688 200 ≤200 0, 8 complex law for V (r), well studiedNGC 7027 8× 10¹⁶ 1300 <1300 9 young PN, very fast outflow not consideredIRAS 22272+5435 1.5× 10¹⁶ 480 1, 2 no fast outflow detectedIRAS 23304+6147 ∼2.9× 10¹⁵ ∼100 1 uncertain rid
IRAS 23321+6545 ? ?M 2–56 7× 10¹⁶ 1500 <∼300 0 well studied
Red Rectangle ∼1.5× 10¹⁵ ∼120 10 uncertain rid
IRAS 07134+1005 4× 10¹⁶ 1300 2, 5 no fast outflow detectedOH 231.8+4.2 800 <∼160 0, 11 well studiedRoberts 22 ? <∼440 <440 12 combining CO spectra and optical imagingHD 101584 150 <∼30 0, 13 well studiedHe 2–113 4.5× 10¹⁵ 140 <140 14
M 2–9 1.8× 10¹⁶ 830 15 no fast outflow detectedCPD –568032 6.8× 10¹⁵ 140 <140 14
OH 17.7–2.0 ∼3× 10¹⁵ ∼80 16 uncertain rid, no fast outflow detectedR Sct ∼3× 10¹⁶ ∼1900 10 uncertain rid, no fast outflow detectedM 1–92 900 <∼100 0, 17 well studiedIRAS 21282+5050 5–10 × 1016 1400 ? ≤1400 ? 18
References: (0): see text; (1): Kwok et al. (1989); (2): Meixner et al. (1997); (3): Neri et al. (1992); (4): Sahai et al. (2000);(5): Hrivnak et al. (1989); (6): Hawkins et al. (1995) (7): Castro-Carrizo et al. (2001); (8): Cox et al. (2000); (9): Grahamet al. (1993); (10): Alcolea & Bujarrabal (1991); (11): Alcolea et al. (2001); (12): Sahai et al. (1999c); (13): Olofsson & Nyman(1999); (14): de Marco et al. (1997); (15): Zweigle et al. (1997); (16): van der Veen et al. (1995); (17): Bujarrabal et al. (1998);(18): Meixner et al. (1998).
kinematical post-AGB time is again ∼1500 yr. Therefore,for M 2–56 we find tacc <∼ 300 yr.
In other less well studied cases, we only can assumethat tacc ≤ tppn. Sometimes, the absence of shocks atpresent is complete, with no trace of even weak shocks,strongly suggesting that the interaction took place in atime much shorter than tppn. This is the case of Frosty Leo(Sahai et al. 2000), in which the extent of the CO emit-ting region is ∼5′′ and the velocity dispersion observedis ∼80 km s−1. The kinematical age tppn ranges between∼900 yr, calculated assuming isotropic expansion in thecentral region, and 300 yr assuming bipolar ejections withan inclination with respect to the plane of the sky i = 15◦
(Sect. 5.1.3). A different case is that of the fast outflow ofCRL 618, which is small in the sky plane (∼2′′, see Neriet al. 1992) and show velocities projected in the line ofsight ∼70–80 km s−1. In this source, the velocity/distancerelation seems more complex than the linear dependenceabove discussed, and it is possible that some significant
acceleration of the outflow is still taking place. For theinclination and distance values in Table 1, we calculatean age for the nebulae tppn ∼ 110 yr. So the high mo-mentum carried by the flow was adquired in a time tacc
comparable or smaller than this value. A similar calcu-lation can be done for CRL 2688, from the maps by Coxet al. (2000), in which no “Hubble law” is found. Cox et al.calculated, using similar parameters than in our work andfrom the movements of the axial flow, values of tppn rang-ing between 250 and 125 yr, for all clumps except for theoutermost northern component, for which tppn ∼ 1200 yr.Since this outer clump just represents a very small partof the nebula, possibly decelerated by interaction with theslow wind, we can conclude that for CRL 2688 tacc ≤ tppn
∼ 200 yr.
For the other sources of our sample, the poor maps orthe lack of further information on the acceleration timelead to less meaningful limits, usually tacc < 1000 yr.

890 V. Bujarrabal et al.: Mass, linear momentum and kinetic energy of bipolar flows in protoplanetary nebulae
Our best estimates (often limits) to the typical accel-eration times of the fast outflows (tacc) in individual ob-jects are given in Table 5, together with our estimates oftppn and some comments on how they are determined. Aswe see, the typical values for tacc in protoplanetary nebu-lae are very low, particularly for the well studied sources.Although these estimates are crude, the results for thedifferent sources are quite compatible, so they probablyhave, at least, a statistical meaning and can be used toderive a typical value tacc = 100–200 yr for PPNe.
For the studied hypergiants, AFGL 2343 andIRC +10420, tppn ∼ 1000 yr; these objects show clearlydetached shells and tppn in them can be understood asthe time elapsed since the end of the copious mass-lossprocess. tppn may be an upper limit to the accelerationtime also in hypergiants, if in these objects the high-massshell was significantly accelerated after its ejection (as weare assuming for standard post-AGB objects). But theevolution of yellow hypergiants and the dynamics of theircircumstellar shells are poorly known and we are notsure on the meaning of tacc in this case (see discussion inSect. 5.1.7, particularly for AFGL 2343).
7. Gas acceleration due to radiation pressurein late AGB stars and PPNe
It is well known that the radiation pressure of the stel-lar light, acting primarily onto dust grains, can acceleratethe circumstellar envelopes around AGB stars, explainingits expansion velocity (Vagb) and, in fact, its formation(e.g. Kwok 1975; Ivezic & Elitzur 1995). In a first approx-imation, there is a limit for the momentum won by theoutflow:
M × Vagb < L/c. (8)
However, this is not exactly the momentum conservationlaw (that must be satisfied in any case), since we are deal-ing with “scalar momenta”, i.e. with the momentum mod-uli integrated over a shell. When the dust opacity is veryhigh, we must take into account the so called “multiplescattering”: the fact that a stellar photon can be scattered,or absorbed and reemitted, several times before leavingthe envelope. Under such a situation, the conservation lawimposes (e.g. Knapp 1986; Ivezic & Elitzur 1995):
M × Vagb < τeff × L/c. (9)
Where τeff is the efficient opacity governing the multiplephoton absorption. When the nebula is very opaque, whichis our case, τeff is the opacity at the wavelength at whichthe maximum emission of the nebula takes place, 5–20 µm,characteristic of the relatively cold dust grains. This isdue to that once a photon is absorbed by the dust it isreemitted as radiation at the characteristic dust emissionwavelengths, and continues being absorbed and emittedat these long waves.
The studies of the dust emission and absorption inAGB envelopes reveal that the most opaque shells (like
that of IRC +10216, with M ∼ 2 × 10⁻⁵ M� yr−1) haveopacities in the optical and UV of about 10–20 (e.g.Rowan-Robinson & Harris 1983; Rowan-Robinson 1980).We can assume, lacking for a better information, thatwhen the late AGB star ejects its heavy envelope, withM ∼1–2×10⁻⁴ M� yr−1 (see Sect. 8.1), this dust opacityscales with the mass loss rate, reaching values ∼100. Inthe IR, where τeff must be evaluated, we expect an opac-ity about 10 times smaller (for the usual dust extinctionlaws, see the above references), so for PPNe we can ex-pect typical values τeff ∼ 10. Therefore, the ejection ofthis superwind must satisfy
M × Vagb<∼ 10× L/c. (10)
Note that this formula gives a maximum momentum underthe expected conditions, not an absolute maximum, sinceτeff is just a characteristic opacity.
7.1. Efficiency of momentum transfer to the fastbipolar flows in PPNe
Let us first introduce a general factor, Fppn, for estimatingthe maximum momentum won in this post-AGB acceler-ation during a characteristic time tacc:
P <∼ Fppn × L/c× tacc. (11)
If we try to explain by radiation pressure the axial accel-eration of the molecular nebula during the PPN phase,we must take into account that only about one half of theradiation momentum can be used to produce expansionalong an axis. So, we conclude from the above discussionthat Fppn is typically ∼5–10, when radiation pressure di-rectly acts onto grains in the molecular flow. Of course, ifwe try to apply such a limit to the momenta obtained inSect. 5, we must conclude that this process cannot explainat all the acceleration of the observed bipolar outflows.
Another argument against this simple mechanism hasbeen found by Alcolea et al. (2001), based on that thevery high drift velocity between the dust grains and thegas. Alcolea et al. argue that, if the outflow in the wellstudied PPN OH 231.8+4.2 is powered by radiation pres-sure acting primarily onto grains, one expects that thedust must flow at a velocity higher than that of the gasby ∼100 km s−1. This would produce structures in theimages of dust scattered light and gas emission separatedby a distance comparable to the size of the nebula itself.However, the observations indicate that both gas and dustfeatures are exactly coincident, within the observationaluncertainties: better than typically 5% of the distance tothe center.
On the other hand, we have mentioned in Sect. 1 thatthere are good reasons to think that the momentum ofthe dense bipolar outflows is transferred to them fromvery fast and collimated post-AGB jets by shocks. Suchjets (often observed to be expelled by the post-AGB stars,e.g. Kwok 2000) will be assumed to be completely different

V. Bujarrabal et al.: Mass, linear momentum and kinetic energy of bipolar flows in protoplanetary nebulae 891
from the molecular flows (probed by CO lines), whose ma-terial was probably ejected by the AGB star. So the prob-lem of the momentum in the PPN bipolar flows would beto explain the momentum of the post-AGB jets, particu-larly if we assume that they are powered by radiation pres-sure. But in this case we must recalculate the correctionfactor in Eq. (11). When the radiation pressure is trans-ferred to the nebula by the intermediate of a shock front,a fraction of the energy of the impinging jet can be con-verted into scalar momentum. This holds when the shockis “energy driven”, i.e. when the shock is adiabatic and theradiated energy is negligible. In this case, the temperatureincreases by a large factor in the shocked region where akind of explosion is produced (in all directions). Since theratio between the energy and momentum of the fast post-AGB jets (i.e. its velocity) is much higher than for thedense molecular outflow, this conversion can significantlyincrease the “scalar momentum” won by the latter. Thissituation would not happen in the opposite case, whenthe shock is radiative (isothermal or momentum-drivenshock), in which no significant correction factor appears.
The idea of that the shocks that accelerated the bipo-lar molecular outflow (observed in CO emission) couldbe strongly adiabatic is surprising. In many well stud-ied cases, the properties of the accelerated material sug-gest the opposite. For instance, the temperatures of thisaccelerated gas are systematically found to be very low(10–20 K, see Sect. 4), indicating a very fast cooling afterthe passage of such an energetic shock. The very colli-mated molecular outflow found in OH 231.8+4.2 suggeststhe presence of a “snow-plug” effect in the shock, whichis characteristic of momentum-driven shocks and very dif-ferent from the roughly isotropic inflation expected in adi-abatic shocks. Sanchez Contreras et al. (2000) argue that,in view of the high densities calculated for this nebula(as for others), theoretical cooling models predict isother-mal shocks in the inner parts of the nebulae, where theacceleration took place, and that adiabatic shocks wouldonly appear in the very outer regions. The narrow walls ofthe fast-flowing cavities observed in several PPNe (M 1–92, Bujarrabal et al. 1998; Roberts 22, Sahai et al. 1999c;Frosty Leo, Sahai et al. 2000; etc.) also suggest a strongcompression of the accelerated material, as expected inisothermal shocks. The case of Hen 3–401 is similar (Sahaiet al. 1999b), in this nebula the very extended lobes showstraight and narrow walls that had been predicted formomentum-driven shocks. However, the PPN Mz–3 andsome PNe (e.g. Balick 2000), show inflated lobes thatcould be explained as the result of an adiabatic shock.Therefore, we cannot exclude the presence of adiabaticshocks in the early evolution of PPNe, but they are prob-ably not a systematic phenomenon.
The increase of the momentum transferred to the denseshell due to the presence of adiabatic shocks is approxi-mately limited by the ratio between the velocity of the fastpost-AGB jets and the resulting velocity for the acceler-ated dense shell (neglecting the increase in internal en-ergy). The velocity of the fast post-AGB jets responsible
for the acceleration of the molecular flows is not known;hot, ionized gas is observed in PNe and PPNe with ve-locities as high as 1000–2000 km s−1 (e.g. Kwok 2000).Since the velocities of the molecular outflow usually rangebetween 50 and 100 km s−1, we can give an estimate forthe velocity ratio of approximately a factor 20. This factordoes not give the increase of the momentum in the axialdirection due to adiabatic shocks, since in first approxi-mation only the outwards axial movements would becomethe observed molecular outflows, a factor 1/4 must thenapply. Even if the collimation process is very efficient, it isdifficult to accept that expansion in all direction becomesan outward, axial flow. Since we are looking for upper lim-its to the momentum transfer factor, we will assume thatthe resulting correction Fppn, to be included in Eq. (11),is then of about 10–20. We are aware that this estimateis uncertain, but our present knowledge does not allow usto think that Fppn can be larger than this factor.
Note that if momentum is transferred to the fastmolecular outflow by means of post-AGB jets, which arethemselves accelerated by radiation pressure acting ontograins, we cannot assume that multiple scattering is signif-icant. The reason is the very high velocity of the post-AGBjets, since the opacity in a flow varies inversely with thevelocity for a given mass loss rate.
In summary, if radiation pressure acting onto grainsis the final source of the momentum, we find that themaximum momentum won by the bipolar flows in PPNemust satisfy:
P <∼ Fppn × L/c× tacc.
If radiation pressure acts directly on the shell that will beaccelerated, Fppn ∼ 5–10. If radiation pressure acts by theintermediate of some very fast (and collimated) post-AGBwind, we get Fppn ∼ 10–20. Since typically tacc ∼ 100–200 yr (Sect. 6), the limit to P is:
P <∼ L/c (g cm s−1yr−1)× 2000 (yr). (12)
The above limit is of course only approximate. We notethat it has been derived assuming that the accelerationand properties of the late-AGB and post-AGB jets aresimilar to those presently observed in AGB stars. In par-ticular, we have assumed that radiation pressure actsfirstly onto grains. This is to be expected, since we havefound that the acceleration is produced in the very firstpost-AGB phases, in which the star is still cool; see dis-cussion on other scenarios in Sect. 9.
8. Mass and dynamics of PPNe: Statistical results
8.1. The late AGB wind
We will assume that the slow component often observedin PPNe is the fraction of the fossil AGB envelope thathas not been accelerated by the post-AGB wind inter-action (see also Sect. 4.1). Firstly, its velocity is com-parable to that commonly observed in AGB envelopes.Moreover, in several well mapped sources, the shape of

892 V. Bujarrabal et al.: Mass, linear momentum and kinetic energy of bipolar flows in protoplanetary nebulae
this component is spherical and extended, as for AGB en-velopes, suggesting that in them the axial disruption bywind interaction characteristic of PPNe has not reachedthe full extent of the AGB envelope. This is the case ofCRL 618 (Yamamura et al. 1994), CRL 2688 (Yamamuraet al. 1996) and IRAS 21282+5050 (Meixner et al. 1998).In the other well studied cases, this component is toroidaland perpendicular to the nebular symmetry axis, as ex-pected if it is the residual of an extended axial accelera-tion; these are M 2–56, OH 231.8+4.2 (Alcolea et al. 2001),M 2–9 (Zweigle et al. 1997) and M 1–92 (Bujarrabal et al.1998).
In order to estimate the mass loss rate responsible forthe observed nebulae (that supposedly took place duringthe last phases of the AGB, and that was the responsiblefor its end), we have first estimated the outer radius ofthis slow remnant, ros. We recall that, in the well stud-ied cases mentioned above, the extent of this CO shellis much smaller than that expected from photodissocia-tion due to the interstellar UV field (see calculations byMamon et al. 1988). So, the slow component is spatiallybounded mainly by a sudden density decrease and not bymolecule dissociation, and, therefore, its measured extentprobably corresponds to the actual size of the shell formedunder this regime of high mass ejection.
From ros and the slow component velocities, Vagb (seeSects. 5, 6), we can calculate the time needed to ejectthe whole nebula by the former AGB star, ts. In thiscalculation, the inner radius rid is assumed to be verysmall, except for the hypergiant AFGL 2343, the youngPN NGC 7027, M 2–56, M 2–9 and R Sct, for which wetook values from Table 5 (Sect. 6). See values of ros andts in Table 6.
We can also estimate the total mass of the nebula,Mtot, from the masses of both (slow and fast) componentsdetected in CO, see values in Table 6. From ts and Mtot,we estimate average mass loss rates during the late AGBphases. Only average rates are obtained, but since thesevalues are probably the maximum allowed mass-loss rates(see below) it is possible that they were kept more or lessconstant during the relevant phase. The obtained valuesare listed in Table 6 (< M lagb >), for the objects in whichthe existing data allow a reasonable estimate.
As we see in Table 6, the yellow hypergiants(AFGL 2343 and IRC +10420, see Sect. 2) show very mas-sive molecular envelopes and very high mass-loss rates,between 5 × 10⁻⁴ and 5 × 10⁻³ M� yr−1. On the otherhand, the PPNe with low initial mass (89 Her, M 2–9 andR Sct; no estimate was done for the Red Rectangle) showvery low-mass molecular nebulae, as it was already known(e.g. Alcolea & Bujarrabal 1991). Our analysis also givesa very high mass-loss rate (during its past AGB phase) forthe young PN NGC 7027. This value is probably an upperlimit, since the high velocity and the thin shell found inthis source suggest that the bulk of the gas has been al-ready compressed and accelerated by the passage of shocksand, therefore, our value ts is probably an underestimate.The other, “normal” PPNe have total masses ranging in
general between 0.1 and 1 M�. The only exceptions areIRAS 19500-1709 and IRAS 23304+6147; these also havevery low luminosity, both low nebular mass and luminositycould be due either to that they are low-mass objects or(more probably) to an underestimate of the distance. The(late AGB) mass-loss rates that gave rise to these heavyenvelopes range between 2× 10⁻⁵ and 3× 10⁻⁴ M� yr−1
for PPNe, with an average around 10−4 M� yr−1. We notethat such large ejection rates are not observed in stars thatare presently in the AGB, in which we hardly find rateslarger than 2×10⁻⁵ M�, the mass-loss rate of the famous,dense envelope of IRC +10216 (see e.g. Loup et al. 1993;Bujarrabal 1999; note that the total mass in the envelopearound IRC +10216 is ∼0.2 M�).
Finally, we calculate the “scalar” momentum carriedby this component per unit time when it was ejected, i.e.before the post-AGB wind interaction, M lagb×Vagb. (Werecall that the scalar momentum is calculated by inte-grating the moduli of the momentum to the whole source,disregarding the vectorial nature of this parameter.) Itsvalues are compared with the momentum carried by thestellar radiation, L/c. The resulting ratios are listed inTable 6; note that this parameter is distance indepen-dent. We find a very high momentum in the young PNNGC 7027; as we mentioned above, the whole nebula hasprobably won significant amounts of momentum in thepost-AGB phase. The low-mass objects give relatively lowvalues of the momentum. The rest of the nebulae, the stan-dard PPNe and the hypergiants, give values of the ratioM lagbVagb
L/c between 1 and 22, with most objects present-ing a value ∼5–10. These figures are coincident with theexpected maximum efficiency of momentum transfer forthe stellar radiation pressure to gaseous shells, via photonabsorption by dust grains (see Sect. 7).
The values of the mass-loss rate and the ejected massduring the last AGB phases are so large, compared tothose commonly found in AGB stars, that the ejectionof the planetary nebula and the end of the AGB phaseshould be interpreted as due to a discrete, quasi-explosivephenomenon of mass ejection, rather than to a smoothprocess lasting the whole AGB phase.
8.2. Dynamics of the fast bipolar flows
Only 4 sources in our sample (IRAS 22272+5435,IRAS 07134+1005, M 2–9 and R Sct), out of 32 for whichreasonably good CO data exist, show no line wings downto a low level, i.e. less that 1/10 of the peak. Of thesesources, IRAS 22272+5435 was accurately observed by usand shows no wings to less that 1/50 of the peak in12CO J = 2–1. Five sources show no line wings, but the ex-isting information is poor and the limits are not significant(Mz 3, IRAS 17150-3224, OH 17.7–2.0, IRAS 20000+3239and IRAS 22574+6609).
As we have mentioned, the mass and momentum car-ried by the fast molecular flows in PPNe is very high.At least 9 PPNe in our sample have fast outflows with

V. Bujarrabal et al.: Mass, linear momentum and kinetic energy of bipolar flows in protoplanetary nebulae 893
Table 6. Characteristic radius and formation time of the slow outflows in the PPNe that have been well observed in CO. Wealso quote the total nebular mass and the average mass rate at which the nebula was ejected during the late AGB phases.
name ros ts Mtot < M lagb > refs.M lagbVagb
L/ccomments
(cm) (yr) (M�) (M� yr−1)
IRAS 04296+3429 ∼9× 10¹⁶ ∼3000 0.13 ∼4× 10⁻⁵ 0, 1 3.1 size from optical imageCRL 618 1.5× 10¹⁷ 2700 0.7 2.6× 10⁻⁴ 0, 2 7.6 size from CO mapsFrosty Leo ∼2.3× 10¹⁷ 7300 0.9 ∼1.2× 10⁻⁴ 0, 3 22. size from optical and CO imagesIRAS 17436+5003 <2× 10¹⁷ <5000 0.7 >1.4× 10⁻⁴ 0 >1 assumed radius: <3′′, from CO dataHe 3–1475 ∼1.5× 10¹⁷ ∼7000 0.63 ∼9× 10⁻⁵ 0, 4 ∼3.5 size from optical image89 Her 1016 1000 3.3× 10⁻³ 4× 10⁻⁶ 0, 5 0.19 size from CO mappingAFGL 2343 2.1× 10¹⁷ 1000 4.8 4.8× 10⁻³ 0, 6 14. CO+IR size, unique velocity componentIRC +10420 4.5× 10¹⁷ 4000 2.1 5.4× 10⁻⁴ 0, 7 1.4 CO size, unique velocity componentIRAS 19500-1709 <5× 10¹⁶ <1600 0.033 >2× 10⁻⁵ 0 >6.6 assumed radius: <3′′, from CO dataCRL 2477 5.9× 10¹⁶ ? ? ? 0, 7 ? size from CO, unidentified slow flowCRL 2688 1.8× 10¹⁷ 3800 0.75 2× 10⁻⁴ 0, 8 6. size from CO mappingNGC 7027 1.8× 10¹⁷ >1500 0.6 <4× 10⁻⁴ 0, 9 <43 size from CO mappingIRAS 22272+5435 2.6× 10¹⁷ 10000 0.2 2× 10⁻⁵ 0, 7 1. size from CO mappingIRAS 23304+6147 6× 10¹⁵? 210? 7× 10⁻³ 3× 10⁻⁵? 0, 10 14? poor information on extentIRAS 23321+6545 4× 10¹⁶ ? ? ? 0, 7 ? size from CO, unidentified slow flowM 2–56 2.7× 10¹⁷ 4500 0.11 2.3× 10⁻⁵ 0 1.6 size from CO mapping
OH 231.8+4.2 1017 4000 0.9 2.3× 10⁻⁴ 11 9. size from optical and CO imagesM 2–9 3.9× 10¹⁶ 960 >∼6.1× 10⁻⁴ >∼ 6.4 10−7 0, 12 >∼0.41 from CO mappingR Sct 7× 10¹⁶ 2500 8.3× 10⁻⁴ 3.3× 10⁻⁷ 0, 13 0.02 from CO mappingM 1–92 1017 4000 0.9 2.2× 10⁻⁴ 14 9. from CO mapping
References: (0): this paper; (1): Sahai et al. (1999a); (2): Yamamura et al. (1994), Meixner et al. (1998); (3): Sahai et al. (2000);(4): Borkowski et al. (1997); (5): Alcolea & Bujarrabal (1995); (6): Hawkins et al. (1995), Neri et al., in preparation; (7): Neriet al. (1998); (8): Yamamura et al. (1996); (9): Graham et al. (1993); (10): Hrivnak et al. (1999); (11): Alcolea et al. (2001);(12): Zweigle et al. (1997); (13): Bujarrabal et al. (1990); (14): Bujarrabal et al. (1998).
mass >∼0.1 M�. As we argue in Sect. 7.1, the flow mo-mentum (P ) cannot in principle be explained by radiationpressure when P
L/c is larger than about 2000 yr. See valuesof P and P
L/c in Tables 3, 4. For our statistical study of theoutflow momenta, we will not take into account the fiveobjects in which the upper limits to the line-wing emissionare not significant, one object in which the lower limit istoo low to be useful (IRAS 20028+3910, P
L/c > 1000 yr),two objects in which the comparison with radiation pres-sure momentum is not conclusive (IRAS 04296+3429: un-certain ratio P
L/c ∼ 1200 yr; IRAS 07134+1005: PL/c <
3500 yr), as well as the hypergiants (for which the typi-cal times of the wind interaction are not well known). Weare left with 27 objects that show reasonably useful COdata. Of them, only 6 nebulae (namely IRAS 22272+5435,IRAS 23304+6147, 89 Her, the Red Rectangle, M 2–9 andR Sct), i.e. 22%, show values of P
L/c smaller than 2000 yr.Four of them are the four low-mass objects in our list (seefurther discussion below). For this 22% of the nebulae,the usual assumption that the stellar radiation pressurepowers the bipolar protoplanetary flows is not incompati-ble with the observations. For the rest of the objects (21,78%), the momentum carried by the bipolar flows is toolarge to be explained, under standard conditions, by ra-diation pressure. Such a percentage is in any case a lowerlimit, since our calculation procedure can lead to under-estimates of the mass and momentum in not well studied
objects (Sect. 4.2), due to errors in the geometrical andCO emission models (significant overestimates are not ex-pected). In particular, CO photodissociation by interstel-lar or stellar UV radiation could yield very low CO emis-sion, despite a high actual mass of the envelope.
We could imagine that the correction factor Fppn ap-plied in Eq. (11) (Sect. 7) can be increased by some extrafactor (of unknown origin). But there are PPNe in oursample with P
L/c>∼ 105 yr. These objects include precisely
some of the best studied nebulae, for which the possibleunderestimate of the molecular masses inherent to our cal-culation method (Sect. 4.2) is expected to be less impor-tant: Frosty Leo, He 3–1475, OH 231.8+4.2, HD 101584,the Boomerang Nebula and M 1–92. A correction factor(Eq. (11)) Fppn
>∼ 500–1000 would be necessary. An in-spection of the arguments in Sects. 7 and 9.1 shows thatsuch high values of Fppn seems difficult to justify.
The case of the objects with low initial mass is re-markable: we have seen that the four studied nebulae(89 Her, the Red Rectangle, M 2–9 and R Sct; see Alcolea& Bujarrabal 1991) are among the six sources showingcomparatively low flow momentum. Only in the first twoones a relatively fast CO component is detected and with amass not higher than 10−3 M�. It was known that thesePPNe with low initial mass often show very weak andnarrow CO lines. This may be due to a small CO abun-dance and/or extent in the nebula, probably because of
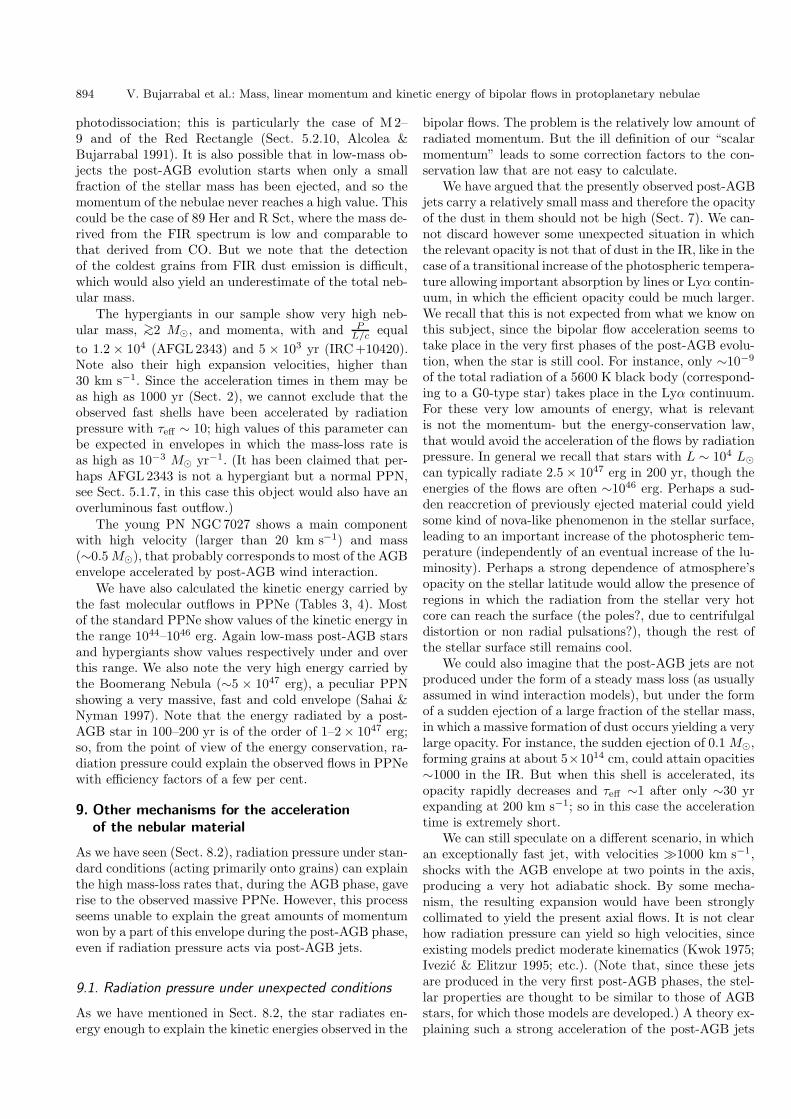
894 V. Bujarrabal et al.: Mass, linear momentum and kinetic energy of bipolar flows in protoplanetary nebulae
photodissociation; this is particularly the case of M 2–9 and of the Red Rectangle (Sect. 5.2.10, Alcolea &Bujarrabal 1991). It is also possible that in low-mass ob-jects the post-AGB evolution starts when only a smallfraction of the stellar mass has been ejected, and so themomentum of the nebulae never reaches a high value. Thiscould be the case of 89 Her and R Sct, where the mass de-rived from the FIR spectrum is low and comparable tothat derived from CO. But we note that the detectionof the coldest grains from FIR dust emission is difficult,which would also yield an underestimate of the total neb-ular mass.
The hypergiants in our sample show very high neb-ular mass, >∼2 M�, and momenta, with and P
L/c equalto 1.2 × 10⁴ (AFGL 2343) and 5 × 10³ yr (IRC +10420).Note also their high expansion velocities, higher than30 km s−1. Since the acceleration times in them may beas high as 1000 yr (Sect. 2), we cannot exclude that theobserved fast shells have been accelerated by radiationpressure with τeff ∼ 10; high values of this parameter canbe expected in envelopes in which the mass-loss rate isas high as 10−3 M� yr−1. (It has been claimed that per-haps AFGL 2343 is not a hypergiant but a normal PPN,see Sect. 5.1.7, in this case this object would also have anoverluminous fast outflow.)
The young PN NGC 7027 shows a main componentwith high velocity (larger than 20 km s−1) and mass(∼0.5M�), that probably corresponds to most of the AGBenvelope accelerated by post-AGB wind interaction.
We have also calculated the kinetic energy carried bythe fast molecular outflows in PPNe (Tables 3, 4). Mostof the standard PPNe show values of the kinetic energy inthe range 1044–1046 erg. Again low-mass post-AGB starsand hypergiants show values respectively under and overthis range. We also note the very high energy carried bythe Boomerang Nebula (∼5 × 1047 erg), a peculiar PPNshowing a very massive, fast and cold envelope (Sahai &Nyman 1997). Note that the energy radiated by a post-AGB star in 100–200 yr is of the order of 1–2× 1047 erg;so, from the point of view of the energy conservation, ra-diation pressure could explain the observed flows in PPNewith efficiency factors of a few per cent.
9. Other mechanisms for the accelerationof the nebular material
As we have seen (Sect. 8.2), radiation pressure under stan-dard conditions (acting primarily onto grains) can explainthe high mass-loss rates that, during the AGB phase, gaverise to the observed massive PPNe. However, this processseems unable to explain the great amounts of momentumwon by a part of this envelope during the post-AGB phase,even if radiation pressure acts via post-AGB jets.
9.1. Radiation pressure under unexpected conditions
As we have mentioned in Sect. 8.2, the star radiates en-ergy enough to explain the kinetic energies observed in the
bipolar flows. The problem is the relatively low amount ofradiated momentum. But the ill definition of our “scalarmomentum” leads to some correction factors to the con-servation law that are not easy to calculate.
We have argued that the presently observed post-AGBjets carry a relatively small mass and therefore the opacityof the dust in them should not be high (Sect. 7). We can-not discard however some unexpected situation in whichthe relevant opacity is not that of dust in the IR, like in thecase of a transitional increase of the photospheric tempera-ture allowing important absorption by lines or Lyα contin-uum, in which the efficient opacity could be much larger.We recall that this is not expected from what we know onthis subject, since the bipolar flow acceleration seems totake place in the very first phases of the post-AGB evolu-tion, when the star is still cool. For instance, only ∼10−9
of the total radiation of a 5600 K black body (correspond-ing to a G0-type star) takes place in the Lyα continuum.For these very low amounts of energy, what is relevantis not the momentum- but the energy-conservation law,that would avoid the acceleration of the flows by radiationpressure. In general we recall that stars with L ∼ 104 L�can typically radiate 2.5× 1047 erg in 200 yr, though theenergies of the flows are often ∼1046 erg. Perhaps a sud-den reaccretion of previously ejected material could yieldsome kind of nova-like phenomenon in the stellar surface,leading to an important increase of the photospheric tem-perature (independently of an eventual increase of the lu-minosity). Perhaps a strong dependence of atmosphere’sopacity on the stellar latitude would allow the presence ofregions in which the radiation from the stellar very hotcore can reach the surface (the poles?, due to centrifulgaldistortion or non radial pulsations?), though the rest ofthe stellar surface still remains cool.
We could also imagine that the post-AGB jets are notproduced under the form of a steady mass loss (as usuallyassumed in wind interaction models), but under the formof a sudden ejection of a large fraction of the stellar mass,in which a massive formation of dust occurs yielding a verylarge opacity. For instance, the sudden ejection of 0.1 M�,forming grains at about 5×1014 cm, could attain opacities∼1000 in the IR. But when this shell is accelerated, itsopacity rapidly decreases and τeff ∼1 after only ∼30 yrexpanding at 200 km s−1; so in this case the accelerationtime is extremely short.
We can still speculate on a different scenario, in whichan exceptionally fast jet, with velocities �1000 km s−1,shocks with the AGB envelope at two points in the axis,producing a very hot adiabatic shock. By some mecha-nism, the resulting expansion would have been stronglycollimated to yield the present axial flows. It is not clearhow radiation pressure can yield so high velocities, sinceexisting models predict moderate kinematics (Kwok 1975;Ivezic & Elitzur 1995; etc.). (Note that, since these jetsare produced in the very first post-AGB phases, the stel-lar properties are thought to be similar to those of AGBstars, for which those models are developed.) A theory ex-plaining such a strong acceleration of the post-AGB jets

V. Bujarrabal et al.: Mass, linear momentum and kinetic energy of bipolar flows in protoplanetary nebulae 895
by radiation pressure and the subsequent very energeticshocks, in particular why the dense accelerated gas doesnot radiate the internal energy (Sect. 7.1), is obviouslymissing.
9.2. Other sources of energy
When trying to find other sources of energy that couldexplain the observed outflows, the conservation of energybecomes the relevant constraint.
We can imagine that the energy needed could comefrom the ejection of the pulsating stellar layers after anultimate pulse. However, the kinetic energy of 0.2 M�pulsating at 20 km s−1 (a typical pulsation velocity) isjust ∼8 × 1044 erg. Also we note that we do not expectthis pulsation to occur in only one direction.
Accretion onto the stellar surface may provide the en-ergy required: 0.2 M� falling in a star with a mass equalto 1 M� and a radius equal to 1013 cm releases a gravita-tional energy ∼5×1045 erg, compatible with the observedones in most cases. This energy could be converted intokinetic energy in the axial direction by a process similar tothat at work in forming stars and in active galactic nuclei,that involves the presence of magnetic fields and also ex-plains the collimation of the axial jets. Theoretical studiesfor the specific case of PPNe would also be needed. Therelease of gravitational energy could be due to the approx-imation of a stellar companion, but then both stars wouldpractically get in contact (with other cataclysmic conse-quences not observed). Moreover, it is difficult to under-stand why this approximation takes place, for almost allpossible star pairs, exactly at the end of the AGB phase ofthe primary. Finally we note that the presence of a stellarcompanyon should help to produce accretion of circum-stellar material. However, we still lack for a study quan-titatively comparing the apparent ubiquity of the overlu-minous outflows in PPNe with the expected number ofpost-AGB stars belonging to the appropiate multiple sys-tems; it should be also understood why, under the binarystar assumption, such jets only appear in the AGB phasefor a few well known symbiotic stars.
10. Conclusions
1: We present and analyze CO data on 37 objects, mostof them protoplanetary nebulae (PPNe), including alsothe two hypergiants surrounded by heavy circumstellarenvelopes, AFGL 2343 and IRC +10420 (that are proba-bly following an evolution similar to that of PPNe), andthe young planetary nebula NGC 7027 (that shows a somenebular properties similar to those of PPNe). We thinkthat our sample includes all well identified PPNe thathave been detected in CO. We have performed new verysensitive observations in 16 of these sources of 12CO and13CO lines (both J = 1–0 and J = 2–1 transitions in mostsources). For the others, we take CO data from the litera-ture; in some of these sources, the published observationsare found to be of poor quality for our purposes.
2: In the CO spectra, it is often possible to identifythe different components characteristic of the CO emis-sion from PPNe, namely the central core, correspondingto slow ejections (probably a remnant of the previous AGBwind), and the line wings, corresponding to bipolar fastflows (probably the result of the acceleration of a part ofthe AGB envelope by interaction with post-AGB fast, ax-ial jets). The main goal of our study is the calculation ofthe mass, the linear momentum and the kinetic energy ofthese components from the CO spectra.
3: The method followed to calculate those parametersand the meaning and uncertainties of the derived resultsare discussed in detail. It is concluded that the errors aresmall (less than about a factor 2 in the developed ex-amples), and that only significant underestimates of themass and dynamical parameters can be expected. Errorsare particularly small in well studied objects, in which theshell extent and the CO excitation and opacity can bedetermined.
4: The mass of the whole nebula is calculated, togetherwith the associated mass-loss rates at which the totalenvelope was expelled during the late AGB phases (seeSect. 8.1, Table 6). The mass of most PPNe is larger than0.1 M�, being often ∼1 M�. The corresponding mass-lossrates range between 2×10⁻⁵ and 3×10⁻⁴ M� yr−1, withtypical values ∼10−4 M� yr−1. The exceptions are the ob-jects with low initial mass (89 Her, M 2–9 and R Sct) andthe yellow hypergiants (AFGL 2343 and IRC +10420), forwhich the the calculated masses and mass-loss rates aresignificantly lower and higher, respectively.
5: We also estimated the values of the “scalar” momen-tum (integration to the whole nebula of the momentummodulus) that was carried by this late AGB wind. Aftertaking into account the effects of multiple scattering, wefind the momentum of such a wind to be very close to themaximum momentum that can be supplied by radiationpressure. The duration of this high efficiency process isof a few thousand years, after which the star has lost agood fraction of its mass, its surface temperature startsincreasing and the AGB phase ends.
6: We have studied the properties of the high-velocity molecular outflows by means of the line wings(often) detected in CO spectra. Only four objects(IRAS 22272+5435, IRAS 07134+1005, M 2–9 and R Sct)out of the 37 nebulae in our sample show no line wingsto a low level (weaker than ∼1/10 of the line maximum).Five others show no wings, but the existing observationsare poor and do not allow meaningful conclusions.
7: Calculations of the momentum carried by the fastCO outflows yield very high values, between 1038 and5 × 1039 g cm s−1 in most PPNe. Their kinetic energyis also very high, often between 1045 and 1047 erg. Theformation of these flows is the dominant phenomenon inthe post-AGB dynamics. These values are compared withthe momentum that can be provided by the stellar lu-minosity. We have taken into account the expected ac-celeration times, estimated for some sources, as well ascorrection factors due to eventual multiple scattering and

896 V. Bujarrabal et al.: Mass, linear momentum and kinetic energy of bipolar flows in protoplanetary nebulae
conversion of energy into scalar momentum in adiabaticshocks (under the expected conditions). Of the 27 objectsin which the observational data are good enough, only in6 of them (IRAS 22272+5435, IRAS 23304+6147, 89 Her,the Red Rectangle, M 2–9 and R Sct), 22% of our sample,the measured momentum could be explained by radiationpressure. In the rest of the nebulae (21 objects, 78%),the stellar radiation is unable to explain the accelerationof the observed fast molecular flows. This percentage isprobably a lower limit because, as we have mentioned, thecalculated masses and momenta could be underestimatesin not well studied sources.
8: In some cases, including most of the well studiedobjects, we find a ratio between the outflow momentumand the radiation momentum >∼500–1000. The correctionfactor, due to the effects mentioned above, can just reacha value ∼10–20; values >∼500–1000 are completely unex-pected for the standard conditions under which radiationpressure acts.
9: Among the six objects showing relatively low out-flow momenta, we can find the four PPNe with low initialmass included in our sample (89 Her, the Red Rectangle,M 2–9 and R Sct). The weak CO emission from this kindof sources was already noticed. We discuss on the origin ofthis anomaly, that could be due to a low CO abundanceor extent.
10: Excluding the four low-mass objects, in more than90% of PPNe (21/23) the fast bipolar flows would notbe explained by radiation pressure. We conclude that themechanism that powers the very energetic bipolar flows,and is finally reponsible for the PN shaping, is unknown,deserving theoretical developments.
11: We discuss different processes that could substi-tute the standard effect of radiation pressure. The mostpromising could be radiation pressure if unexpected opac-ity effects are present and conversion into bipolar jet mo-mentum of gravitational energy of reaccreted material.Due to the lack of theoretical developments, this topicremains a matter of speculation.
Note added in proof: A very recent work, Zijlstra et al.(2001, MNRAS, 322, 280), has confirmed from OH maserdata on several PPNe the general structure and veloc-ity field used here, including the Hubble-like velocity law,which were deduced by us from CO observations.
Acknowledgements. This work has been financially supportedby the Spanish DGES, under project PB96-0104. We are grate-ful to Noam Soker for fruitful discussions on the ejection mech-anisms. We made use of the Simbad database, operated atCDS, Strasbourg, France.
References
Alcolea, J., & Bujarrabal, V. 1991, A&A, 245, 499
Alcolea, J., & Bujarrabal, V. 1995, A&A, 303, L21
Alcolea, J., Bujarrabal, V., Sanchez Contreras, C., Neri, R., &Zweigle, J. 2001, A&A, 373, 932
Allen, D. A. 1978, MNRAS, 184, 601
Allen, D. A., Hyland, A. R., & Caswell, J. L. 1980, MNRAS,192, 505
Andrei, A. H., Assafin, M., Puliaev, S. P., et al. 1999, AJ, 117,483
Assafin, M., Andrei, A. H., Puliaev, S. P., et al. 1996, A&AS,117, 335
Bachiller, R., Gomez-Gonzalez, J., Bujarrabal, V., & Martın-Pintado, J. 1988, A&A, 196, L5
Bachiller, R., Martın-Pintado, J., & Bujarrabal, V. 1999, A&A,227, 188
Balick, B. 2000, in Asymmetrical Planetary Nebulae II: FromOrigins to Microestructures, ed. J. H. Kastner, N. Soker,& S. A. Rappaport, ASP Conf. Ser., 199, 41
Bedding, T. R., & Zijlstra, A. A. 1994, A&A, 283, 955Bieging, J. H., Wilner, D., & Thronson, H. A. Jr. 1991, ApJ,
379, 271Borkowski, K. J., Blondin, J. M., & Harrington, J. P. 1997,
ApJ, 482, L97Bowers, P. F., Johnston, K. J., & Spencer, J. H. 1983, ApJ,
274, 733Bujarrabal, V., Gomez-Gonzalez, J., Bachiller, R., & Martın-
Pintado, J. 1988, A&A, 204, 242Bujarrabal, V., Alcolea, J., & Bachiller, R. 1990, A&A, 234,
355Bujarrabal, V., & Bachiller, R. 1991, A&A, 242, 247Bujarrabal, V., Alcolea, J., & Planesas, P. 1992, A&A, 257,
701Bujarrabal, V., Fuente, A., & Omont, A. 1994, A&A, 285, 247Bujarrabal, V., Alcolea, J., Neri, R., & Grewing, M. 1997,
A&A, 320, 540Bujarrabal, V., Alcolea, J., & Neri, R. 1998a, ApJ, 504, 915Bujarrabal, V., Alcolea, J., Sahai, R., Zamorano, J., & Zijlstra,
A. A. 1998b, A&A, 331, 361Bujarrabal, V. 1999, in Asymptotic Giant Branch Starts, IAU
Symp. 191, ed. T. Le Bertre, A. Lebre, & C. Waelkens,ASP, 363
Calvet, N., & Cohen, M. 1978, MNRAS, 182, 687Castro-Carrizo, A., Lucas, R., Bujarrabal, V., Colomer, F., &
Alcolea, J. 2001, A&A, 368, L34Cohen, M., Kunkel, W., Lasker, B. M., Osmer, P. S., &
Fitzgerald, M. P. 1978, ApJ, 221, 151Cox, P., Lucas, R., Huggins, P. J., et al. 2000, A&A, 353, L25Crowther, P. A., de Marco, O., & Barlow, M. J. 1998, MNRAS,
296, 367Dayal, A., Hoffman, W. F., Bieging, J. H., et al. 1998, ApJ,
492, 603Decin, L., van Winckel, H., Waelkens, C., & Bakker, E. J. 1998,
A&A, 332, 928de Jager, C. 1998, A&AR, 8, 145de Marco, O., Barlow, M. J., & Storey, P. J. 1997, MNRAS,
292, 86de Marco, O., & Crowther, P. A. 1998, MNRAS, 296, 419Fong, D., Meixner, M., Castro-Carrizo, A., et al. 2001, A&A,
367, 652Forveille, T., Morris, M., Omont, A., & Likkel, L. 1987, A&A,
176, L13Goodrich, R. W. 1991, ApJ, 376, 654Graham, J. R., Serabyn, E., Herbst, T. M., et al. 1993, AJ,
105, 250Groenewegen, M. A. T., Oudmaijer, R. D., Goudfrooij, P.,
van den Hoek, L. B., & van Kerkwijk, M. H. 1996, A&A,305, 475
Groenewegen, M. A. T., Whitelock, P. A., Smith, C. H., &Kerschbaum, F. 1998, MNRAS, 293, 18

V. Bujarrabal et al.: Mass, linear momentum and kinetic energy of bipolar flows in protoplanetary nebulae 897
Hawkins, G. W., Skinner, C. J., Meixner, M., et al. 1995, ApJ,452, 314
Heske, A., Habing, H. J., Forveille, T., Omont, A., &van der Veen, W. E. C. J. 1990, A&A, 239, 173
Hrivnak, B. J., Kwok, S., & Volk, K. M. 1989, ApJ, 346, 265Hrivnak, B. J., & Kwok, S. 1991, ApJ, 368, 564Hrivnak, B. J., Kwok, S., & Geballe, T. R. 1994, ApJ, 420, 786Hrivnak, B. J. 1995, ApJ, 438, 341Hrivnak, B. J., Langill, P. P., Su, K. Y. L., & Kwok, S. 1999,
ApJ, 513, 421Hu, J. Y., Slijkhuis, S., Nguyen-Q-Rieu, & de Jong, T. 1993,
A&A, 273, 185Ivezic, Z., & Elitzur, M. 1995, ApJ, 445, 415Jaminet, P. A., Danchi, W. C., Sutton, E. C., et al. 1991, ApJ,
380, 461Jones, T. J., Humphreys, R. M., Gehrz, R. D., et al. 1993, ApJ,
411, 323Josselin, E., & Lebre, A. 2001, A&A, 367, 826Jourdain de Muizon, M., Cox, P., & Lequeux, J. 1990, A&AS,
83, 337Jura, M., Balm, S. P., & Kahane, C. 1995, ApJ, 453, 721Kahane, C., Cernicharo, J., Gomez-Gonzalez, J., & Guelin, M.
1992, A&A, 256, 235Kastner, J. H., Weintraub, D. A., Zuckerman, B., et al. 1992,
ApJ, 398, 552Kelly, D. M., & Latter, W. B. 1995, AJ, 109, 1320Klochkova, V. G., Szczerba, R., Panchuk, V. E., & Volk, K.
1999, A&A, 345, 905Knapp, G. R. 1986, ApJ, 311, 731Knapp, G. R., Sutin, B. M., Phillips, T. G., et al. 1989, ApJ,
336, 822Knapp, G. R., Young, K., Lee, E., & Jorissen, A. 1998, ApJS,
117, 209Knapp, G. R., Gammie, C. F., Young, K., & Phillips, T. G.
1990, in Submillimeter Astronomy, ed. G. Watt, & A.Webster (Kluwer, Dordrecht), 33
Knapp, G. R., Bowers, P. F., Young, K., & Phillips, T. G. 1995,ApJ, 455, 293
Kwok, S. 1975, ApJ, 198, 583Kwok, S., Volk, K., & Hrivnak, B. J. 1989, ApJ, 345, L51Kwok, S. 1993, ARA&A, 31, 63Kwok, S., Hrivnak, B. J., & Geballe, T. R. 1995, ApJ, 454, 394Kwok, S., Hrivnak, B. J., Zhang, C. Y., & Langill, P. L. 1996,
ApJ, 472, 287Kwok, S. 2000, The Origin and Evolution of Planetary Nebulae
(Cambridge Univ. Press, Cambridge)Le Bertre, T., Heydari-Malayeri, M., Epchtein, N., Gouiffes,
C., & Perrier, C. 1989, A&A, 225, 417Likkel, L., Morris, M., Omont, A., & Forveille, T. 1987, A&A,
173, L11Likkel, L., Morris, M., Forveille, T., & Omont, A. 1988, A&A,
198, L1Likkel, L., Forveille, T., Omont, A., & Morris, M. 1991, A&A,
246, 153Lopez, B., Mekarnia, D., & Lefevre, J. 1995, A&A, 296, 752Loup, C., Forveille, T., Omont, A., & Paul, J. F. 1993, A&AS,
99, 291Mamon, G. A., Glassgold, A. E., & Huggins, P. J. 1988, ApJ,
328, 797Mauron, N., Le Borgne, J.-F., & Picquette, M. 1989, A&A,
218, 213Meaburn, J., & Walsh, J. R. 1985, MNRAS, 215, 761Meixner, M., Skinner, C. J., Graham, J. R., et al. 1997, ApJ,
482, 897
Meixner, M., Campbell, M. T., Welch, W. J., & Likkel, L. 1998,ApJ, 509, 392
Meixner, M., Ueta, T., Dayal, A., et al. 1999, ApJS, 122, 221Nedoluha, G. E., & Bowers, P. F. 1992, ApJ, 392, 249Neri, R., Garcıa-Burillo, S., Guelin, M., et al. 1992, A&A, 262,
544Neri, R., Kahane, C., Lucas, R., Bujarrabal, V., & Loup, C.
1998, A&AS, 130, 1Nyman, L.-A., Booth, R. S., Carlstrom, U., et al. 1992, A&AS,
93, 121Olofsson, H., & Nyman, L.-A. 1999, A&A, 347, 194Omont, A., Loup, C., Forveille, T., et al. 1993, A&A, 267, 515Quinn, D. E., Moore, T. J. T., Smith, R. G., Smith, C. H., &
Fujiyoshi, T. 1996, MNRAS, 283, 1379Reddy, B. E., & Hrivnak, B. J. 1999, AJ, 117, 1834Redman, M. P., O’Connor, J. A., Holloway, A. J., Bryce, M.,
& Meaburn, J. 2000, MNRAS, 312, L23Riera, A., Garcıa-Lario, P., Manchado, A., Pottasch, S. R., &
Raga, A. C. 1995, A&A, 302, 137Roddier, F., Roddier, C., Graves, J. E., & Northcott, M. J.
1995, ApJ, 443, 249Rowan-Robinson, M. 1980, ApJS, 44, 403Rowan-Robinson, M., & Harris, S. 1983, MNRAS, 202, 797Sahai, R., & Nyman, L.-A. 1997, ApJ, 487, L155Sahai, R., Trauger, J. T., Watson, A. M., et al. 1998, ApJ, 493,
301Sahai, R. 1999, ApJ, 524, L125Sahai, R., Bujarrabal, V., Castro-Carrizo, A., & Zijlstra, A. A.
2000, A&A, 360, L9Sahai, R., Bujarrabal, V., & Zijlstra, A. 1999a, ApJ, 518, L115Sahai, R., Zijlstra, A., Bujarrabal, V., & te Lintel Hekkert, P.
1999b, AJ, 117, 1408Sanchez Contreras, C., Bujarrabal, V., & Alcolea, J. 1997,
A&A, 327, 689Sanchez Contreras, C., Bujarrabal, V., Neri, R., & Alcolea, J.
2000, A&A, 357, 651Schwartz, H. E., Aspin, C., Corradi, R. L. M., & Reipurth, B.
1997, A&A, 319, 267Shenton, M., Monier, R., Evans, A., et al. 1994, A&A, 287, 866Skinner, C. J., Meixner, M., Barlow, M. J., et al. 1997, A&A,
328, 290Szczerba, R., Omont, A., Volk, K., Cox, P., & Kwok, S. 1997,
A&A, 317, 859Swings, J. P., & Andrillat, Y. 1979, A&A, 74, 85Trammell, S. R., Dinnerstein, H. L., & Goodrich, R. W. 1994,
AJ, 108, 984Trams, N. R., Lamers, H. J. G. L. M., van der Veen, W. E. C. J.,
Waelkens, C., & Waters, L. B. F. M. 1990, A&A, 233, 153Ueta, T., Meixner, M., & Bobrowsky, M. 2000, ApJ, 528, 861van der Veen, W. E. C. J., Habing, H.J., & Geballe, T. R. 1989,
A&A, 226, 108van der Veen, W. E. C. J., Omont, A., Habing, H. J., &
Matthews, H. E. 1995, A&A, 295, 445Volk, K., & Kwok, S. 1989, ApJ, 342, 345Volk, K., Kwok, S., & Woodsworth, A. W. 1993, ApJ, 402, 292Woodsworth, A. W., Kwok, S., & Chan, S. J. 1990, A&A, 228,
503Yamamura, I., Shibata, K. M., Kasuga, T., & Deguchi, S. 1994,
ApJ, 427, 406Yamamura, I., Onaka, T., Kamijo, F., Deguchi, S., & Ukita,
N. 1996, ApJ, 465, 926Yuasa, M., Unno, W., & Magono, S. 1999, PASJ, 51, 197Zweigle, J., Neri, R., Bachiller, R., Bujarrabal, V., & Grewing,
M. 1997, A&A, 324, 624