Embed Size (px)
Citation preview

LEA: 19
Maryland Report Card
Somerset County 2015 Progress Report

Somerset County
% of classes NOT taught by highly qualified teachers
Teacher Qualifications
All Quartiles 7.1 5.0 8.4 7.6Elementary Low Poverty * * 2.9 3.0Elementary High Poverty 1.1 0.0 10.5 11.4Secondary Low Poverty * * 6.7 6.0Secondary High Poverty 12.7 9.5 17.7 15.7
Standard Professional 44.2 41.5 27.4 27.2Advanced Professional 53.9 49.1 65.2 65.5Resident Teacher 0.0 0.0 1.1 0.7Conditional Teacher 0.6 0.6 1.5 1.0
2015 2014 2015 2014% of certificates:
Cohort Graduation Rate%
Attendance Rate %
Class of 2014 (4-Year Rate) 85.57 86.39Class of 2014 (5-Year Rate) 86.46 88.70
Elementary 94.8 ≥ 95.0 95.4 95.7Middle 93.7 94.2 95.0 95.4High 92.3 92.9 92.4 92.7
2015 201420152014
“*” indicates no students or fewer than 10 students in category.
County County State StateCounty County State State
Attendance RateAttendance Rate is the percentage of students in school for at least half of the average school day during the school year. Attendance is a school accountability measure for elementary and middle schools. Yearly targets were set for attendance so that by the end of school year 2013-14, the State, schools, and school systems would achieve and maintain an attendance rate of at least 94 percent.
Teacher QualificationsThe percentage of teachers in each category is based on the number of teachers who have credentials and are teaching core academic subjects as defined by the federal government under the No Child Left Behind Act. The core academic subjects are English, reading or language arts, mathematics, science, foreign languages, civics and government, economics, arts, history, and geography. Teachers who are teaching other subjects are not included in the totals.Standard Professional Certificate: A Standard Professional Certificate indicates the teacher meets all certification requirements.Advanced Professional Certificate: The Advanced Professional Certificate requires three years of satisfactory professional school-related experience, and a master’s degree or a minimum of 36 semester hours of post baccalaureate course work.Resident Teacher Certificate: The Resident Teacher Certificate is issued to a teacher in an approved alternative preparation program at the request of a local school system superintendent.Conditional Teacher Certificate: The Conditional Certificate is issued only at the request of a local school system superintendent to an applicant who has a bachelor’s degree but does not meet all certification requirements.Highly Qualified Teachers: “Highly qualified” is specifically defined by federal law. Teachers must meet minimum requirements both in content knowledge and teaching skills. Teachers must have a bachelor’s degree, full State certification, and demonstrate content knowledge in the subjects they teach.
Cohort Graduation RateThe U.S. Department of Education now requires each state to use an adjusted cohort graduation rate for school accountability. The adjusted cohort graduation rate ensures that all students who entered 9th grade together are counted in the graduation rate at the end of 4 years and at the end of 5 years.
The cohort graduation rate data for 2014 is the 4-year rate for the student cohort entering grade nine for the first time in fall 2010 and graduating no later than 2014. The 2014 5-year rate is the same cohort graduating no later than 2015.
Visit Reportcard.msde.maryland.gov for up-to-date and disaggregated information. For definitions, see school system report pages.

MSA Proficiency Levels
Science:Students show they need more work to attain proficiency. They use minimal supporting evidence, and responses provide little or no synthesis of information.
Biology:Students demonstrate a minimal understanding of biology concepts, principles, and/or skills. Student responses indicate limited synthesis of information and understanding of scientific terminology.Ba
sic %
Students use supporting evidence that is generally complete with some integration of scientific concepts, principles, and/or skills.
Students demonstrate a realistic and rigorous level of achievement by providing evidence of an understanding of biology concepts and the ability to use scientific evidence to generally integrate scientific concepts, principles, and/or skills. Student responses indicate some synthesis of information and understanding of scientific terminology.
Prof
icien
t %
Students use scientific evidence to demonstrate a full integration of scientific concepts, principles, and/or skills.
Students demonstrate an exemplary level of achievement by providing evidence of a complete understanding of biology concepts and the ability to use scientific evidence to fully integrate scientific concepts, principles, and/or skills. Student responses indicate a complete synthesis of information and understanding of scientific terminology.
Adva
nced
%
Maryland School Assessment (MSA)The MSA measures what students in grades 5 and 8 know about Science. High school performance is measured by the Biology High School Assessment (HSA). Performance is reported as the percent of students in each grade who achieved the Basic, Proficient, or Advanced standard. All students should be achieving at the Proficient or Advanced standard.
Somerset County
Scie
nce
Description of Proficiency Levels
STATE %COUNTY % Basic % Proficient % Advanced %
• B: Biology
Grade
5 2015
2014
8 2015
2014
*B 2015
2014
Grade
5 2015
2014
8 2015
2014
*B 2015
2014
Visit Reportcard.msde.maryland.gov for up-to-date and disaggregated information. For definitions, see school system report pages.

Alt-MSA Proficiency Levels
Alternate Maryland School Assessment (Alt-MSA)The Alternate Maryland School Assessment (Alt-MSA) is taken by students with disabilities who cannot take the MSA in Science or PARCC in ELA or Mathematics even with the special accommodations they receive as part of their regular classroom instruction. The test measures the student’s mastery of reading and mathematics content standards or appropriate access skills. Eligible students take the test in grades 3-8 and once during the high school grade band. Performance is reported as the percent of students in each grade who achieved the Basic, Proficient, or Advanced standard.
Somerset County
Read
ing
Mat
hem
atics
Scie
nce
STATE %COUNTY % Basic % Proficient % Advanced %
E: English; A: Algebra/Data Analysis; B: Biology
Grade
3 2015
2014
4 2015
2014
5 2015
2014
6 2015
2014
7 2015
2014
8 2015
2014
E 2015
2014
3 2015
2014
4 2015
2014
5 2015
2014
6 2015
2014
7 2015
2014
8 2015
2014
A 2015
2014
5 2015
2014
8 2015
2014
B 2015
2014
Grade
3 2015
2014
4 2015
2014
5 2015
2014
6 2015
2014
7 2015
2014
8 2015
2014
E 2015
2014
3 2015
2014
4 2015
2014
5 2015
2014
6 2015
2014
7 2015
2014
8 2015
2014
A 2015
2014
5 2015
2014
8 2015
2014
B 2015
2014
Basic
%Ad
vanc
ed %
Prof
icien
t %
Students demonstrate a realistic and rigorous level of achievement by providing evidence of an understanding of biology concepts and the ability to use scientific evidence to generally integrate scientific concepts, principles, and/or skills. Student responses indicate some synthesis of information and understanding of scientific terminology.
Students use supporting evidence that is generally complete with some integration of scientific concepts, principles, and/or skills.
Students show they have an understanding of fundamental algebra / data analysis skills and concepts and can generally solve entry-level problems in algebra/data analysis.
Students show they have an understanding of fundamental grade level skills and concepts and can generally solve entry-level problems in mathematics.
Students use scientific evidence to demonstrate a full integration of scientific concepts, principles, and/or skills.
Students can regularly solve complex algebra/data analysis problems and demonstrate superior ability to reason mathematically.
Students show they can regularly solve complex problems in mathematics and demonstrate superior ability to reason mathematically.
Students can regularly comprehend and interpret complex literature and consistently apply appropriate language choices to write effectively.
Biology:Students demonstrate a minimal understanding of biology concepts, principles, and/or skills. Student responses indicate limited synthesis of information and understanding of scientific terminology.
Science:Students show they need more work to attain proficiency. They use minimal supporting evidence, and responses provide little or no synthesis of information.
*Mathematics:Students show they have only partially mastered the skills and concepts that Maryland expects students to know and be able to do at this grade level.
*English:Students have difficulty comprehending grade appropriate literature and applying language choices when writing.
*Algebra/Data AnalysisStudents show they have only partially mastered the skills and concepts defined in the Maryland Algebra/Data Analysis Core Learning Goals.
Students can read text written for students in their grade, and they can demonstrate the ability to understand literature and passages of information.
Students demonstrate an exemplary level of achievement by providing evidence of a complete understanding of biology concepts and the ability to use scientific evidence to fully integrate scientific concepts, principles, and/or skills. Student responses indicate a complete synthesis of information and understanding of scientific terminology.
*Reading:Students are unable to read and understand literature and passages of information that are written for students in their grade.
Students can read text written for students in their grade, and they can demonstrate the ability to understand literature and passages of information.
Students can regularly read text that is above their grade level, and they can demonstrate the ability to understand complex literature and passages of information.*Applies to Alt MSA only
Visit Reportcard.msde.maryland.gov for up-to-date and disaggregated information. For definitions, see school system report pages.

Performance LevelLevel 1 Level 2 Level 3 Level 4 Level 5
Did not yet meet expectations
Did not yet meet expectations
Approached expectations Met expecations Exceeded expectations
TESTED Count % Count % Count % Count % Count %
County State County State County State County State County State County State County State County State County State County State County State
English/Language Arts 3 222 65088 69 13108 31.1 20.1 59 12816 26.6 19.7 60 14322 27.0 22.0 33 21951 14.9 33.7 * 2891 ≥5.0 59
English/Language Arts 4 206 63792 25 8012 12.1 12.6 59 12855 28.6 20.2 76 17329 36.9 27.2 41 20718 19.9 32.5 * 4878 ≥5.0 59
English/Language Arts 5 218 63331 37 7528 17.0 11.9 56 13204 25.7 20.8 78 17245 35.8 27.2 46 23353 21.1 36.9 * 2001 ≥5.0 56
English/Language Arts 6 209 62055 17 7353 8.1 11.8 62 13429 29.7 21.6 78 18848 37.3 30.4 48 19893 23.0 32.1 * 2532 ≥5.0 62
English/Language Arts 7 178 61200 26 10536 14.6 17.2 48 11686 27.0 19.1 60 15297 33.7 25.0 34 17718 19.1 29.0 10 5963 5.6 48
English/Language Arts 8 205 59335 40 10111 19.5 17.0 51 10969 24.9 18.5 56 14240 27.3 24.0 52 19839 25.4 33.4 * 4176 ≥5.0 51
English/Language Arts 10 178 55651 44 11886 24.7 21.4 40 10044 22.5 18.0 44 11628 24.7 20.9 41 15650 23.0 28.1 9 6443 5.1 40
Mathematics 3 221 65594 24 9748 10.9 14.9 87 14771 39.4 22.5 81 17224 36.7 26.3 26 19600 11.8 29.9 * 4251 ≥5.0 87
Mathematics 4 206 64290 32 8870 15.5 13.8 91 18133 44.2 28.2 51 17579 24.8 27.3 32 17957 15.5 27.9 * 1751 ≥5.0 91
Mathematics 5 220 63828 24 8337 10.9 13.1 93 18491 42.3 29.0 72 17946 32.7 28.1 30 16441 13.6 25.8 * 2613 ≥5.0 93
Mathematics 6 209 62194 * 8473 ≥5.0 13.6 72 17837 34.4 28.7 90 17552 43.1 28.2 36 16345 17.2 26.3 * 1987 ≥5.0 72
Mathematics 7 178 55010 14 7181 7.9 13.1 59 17630 33.1 32.0 75 18528 42.1 33.7 29 11036 16.3 20.1 * 635 ≥5.0 59
Mathematics 8 205 41166 40 11971 19.5 29.1 53 11126 25.9 27.0 64 8530 31.2 20.7 48 8056 23.4 19.6 * 1483 ≥5.0 53
Algebra I 120 61842 22 8047 18.3 13.0 54 17712 45.0 28.6 42 16757 35.0 27.1 * 18194 ≥5.0 29.4 * 1132 ≥5.0 54
Algebra II 114 40580 32 13057 28.1 32.2 48 10917 42.1 26.9 28 8430 24.6 20.8 6 7820 5.3 19.3 * 356 ≥5.0 48
Somerset County PARCC Assessment Performance Results Summary - 2015
Partnership for Assessment of Readiness for College and Careers (PARCC)In 2015 Maryland implemented the new Partnership for Assessment of Readiness for College and Careers (PARCC) state assessments in reading and mathematics. The new assessments replace the Maryland School Assessments in English and Mathematics in grades 3-8, and replace the High School Assessments in Algebra and English 10 for all students not graduating in 2015.
PARCC Performance Level Descriptors (PLD)Performance level descriptors for English language arts/literacy and Mathematics describe what a typical student at each level should be able to demonstrate based on his/her command of grade-level standards.
Level 1: Did not yet meet expectationsLevel 2: Partially met expectationsLevel 3: Approached expectationsLevel 4: Met expectationsLevel 5: Exceeded expectations
Visit Reportcard.msde.maryland.gov for up-to-date and disaggregated information. For definitions, see school system report pages.

Carter G Woodson Elementary
GRADE SCHOOL %5 2015 * * *
2014 * * *
8 2015 * * *
2014 * * *
B 2015 * * *
2014 * * *
3 2015 * * *
2014 * * *
4 2015 * * *
2014 * * *
5 2015 * * *
2014 * * *
6 2015 * * *
2014 * * *
7 2015 * * *
2014 * * *
8 2015 * * *
2014 * * *
A 2015 * * *
2014 * * *
3 2015 * * *
2014 * * *
4 2015 * * *
2014 * * *
5 2015 * * *
2014 * * *
6 2015 * * *
2014 * * *
7 2015 * * *
2014 * * *
8 2015 * * *
2014 * * *
E 2015 * * *
2014 * * *
STATE %24.3 40.8 34.9
19.6 42.5 37.9
24.0 37.6 38.4
19.8 41.0 39.2
31.8 37.5 30.6
28.7 37.3 34.0
19.3 38.4 42.3
12.5 35.9 51.6
20.4 33.5 46.1
14.7 33.9 51.4
23.8 35.7 40.5
18.9 40.3 40.8
22.8 32.2 45.0
16.0 37.0 47.0
14.1 31.3 54.5
13.3 31.9 54.9
16.9 39.0 44.0
17.8 35.7 46.5
22.9 32.8 44.3
22.2 34.3 43.5
16.5 28.9 54.6
10.3 26.5 63.2
17.4 28.1 54.5
11.9 24.3 63.8
16.4 29.9 53.7
11.4 25.0 63.6
16.8 24.6 58.6
13.3 23.5 63.2
10.9 22.8 66.3
12.2 21.0 66.9
13.2 28.8 58.0
12.6 24.6 62.8
19.0 27.7 53.3
18.8 26.6 54.5‡Data from 2013
COUNTY %* * *
* * *
* * *
* * *
* * *
* * *
* * *
* * *
* * *
* * *
* * *
* * *
* * *
* * *
* * *
* * *
* * *
* * *
* * *
* * *
* * *
* * *
* * *
* * *
* * *
* * *
* * *
* * *
* * *
* * *
* * *
* * *
* * *
* * *
GRADE SCHOOL %5 2015 36.8 57.5 5.7
2014 24.4 70.5 5.1
8 2015 * * *
2014 * * *
*B 2015 * * *
2014 * * *
STATE %36.7 53.9 9.5
35.8 54.9 9.3
31.9 61.7 6.4
30.6 62.8 6.6
15.4 61.2 23.4
15.4 61.7 22.9
COUNTY %43.2 50.5 6.4
26.1 67.1 6.8
26.0 69.2 ≥5.0
26.8 70.6 ≥5.0
21.9 67.5 10.6
20.5 71.3 8.2
MSA Proficiency Levels Alt-MSA Proficiency LevelsBasic % Proficient % Advanced %
“na” indicates too few students for School Progress rules. “*” indicates no students or fewer than 10 students in category. • B: Biology E: English A: Algebra/Data Analysis
Scie
nce
Mat
hem
atics
Read
ing
0705
Elementary 94.9 ≥ 95.0 94.8 ≥ 95.0 95.4 95.7Middle * * 93.7 94.2 95.0 95.4High * * 92.3 92.9 92.4 92.7
% of certificates:
% of classes NOT taught by highly qualified teachersCohort Graduation Rate
Standard Professional 44.8 36.7 44.2 41.5 27.4 27.2Advanced Professional 55.2 60.0 53.9 49.1 65.2 65.5Resident Teacher 0.0 0.0 0.0 0.0 1.1 0.7Conditional Teacher 0.0 0.0 0.6 0.6 1.5 1.0
All Quartiles 0.0 0.0 7.1 5.0 8.4 7.6Elementary Low Poverty * * * * 2.9 3.0Elementary High Poverty * * 1.1 0.0 10.5 11.4Secondary Low Poverty * * * * 6.7 6.0Secondary High Poverty * * 12.7 9.5 17.7 15.7
Class of 2014 (4-Year Rate) * 85.57 86.39Class of 2014 (5-Year Rate) * 86.46 88.70
Attendance Rate %State
2015 2014County
2015 20142015 2014School
Teacher Qualifications 201420152015 20142015 2014School StateCounty
Visit Reportcard.msde.maryland.gov for up-to-date and disaggregated information. For definitions, see school system report pages.

Performance LevelLevel 1 Level 2 Level 3 Level 4 Level 5
Did not yet meet expectations
Partially met expectations
Approached expectations
Met expecations Exceeded expectations
TESTED Count % Count % Count % Count % Count %
English/Language Arts 3 80 21 26.3 25 31.3 17 21.3 17 21.3 * ≥5.0
English/Language Arts 4 78 9 11.5 25 32.1 33 42.3 11 14.1 * ≥5.0
English/Language Arts 5 87 14 16.1 15 17.2 36 41.4 22 25.3 * ≥5.0
Mathematics 3 79 6 7.6 32 40.5 31 39.2 9 11.4 * ≥5.0
Mathematics 4 78 13 16.7 40 51.3 14 17.9 11 14.1 * ≥5.0
Mathematics 5 87 7 8.0 34 39.1 30 34.5 15 17.2 * ≥5.0
Partnership for Assessment of Readiness for College and Careers (PARCC)In 2015 Maryland implemented the new Partnership for Assessment of Readiness for College and Careers (PARCC) state assessments in reading and mathematics. The new assessments replace the Maryland School Assessments in English and Mathematics in grades 3-8, and replace the High School Assessments in Algebra and English 10 for all students not graduating in 2015.
PARCC Performance Level Descriptors (PLD)Performance level descriptors for English language arts/literacy and Mathematics describe what a typical student at each level should be able to demonstrate based on his/her command of grade-level standards.
Level 1: Did not yet meet expectationsLevel 2: Partially met expectationsLevel 3: Approached expectationsLevel 4: Met expectationsLevel 5: Exceeded expectations
PARCC Assessment Performance Results Summary - 2015Carter G Woodson Elementary
Visit Reportcard.msde.maryland.gov for up-to-date and disaggregated information. For definitions, see school system report pages.

Crisfield Academy and High School
GRADE SCHOOL %5 2015 * * *
2014 * * *
8 2015 * * *
2014 * * *
B 2015 * * *
2014 * * *
3 2015 * * *
2014 * * *
4 2015 * * *
2014 * * *
5 2015 * * *
2014 * * *
6 2015 * * *
2014 * * *
7 2015 * * *
2014 * * *
8 2015 * * *
2014 * * *
A 2015 * * *
2014 * * *
3 2015 * * *
2014 * * *
4 2015 * * *
2014 * * *
5 2015 * * *
2014 * * *
6 2015 * * *
2014 * * *
7 2015 * * *
2014 * * *
8 2015 * * *
2014 * * *
E 2015 * * *
2014 * * *
STATE %24.3 40.8 34.9
19.6 42.5 37.9
24.0 37.6 38.4
19.8 41.0 39.2
31.8 37.5 30.6
28.7 37.3 34.0
19.3 38.4 42.3
12.5 35.9 51.6
20.4 33.5 46.1
14.7 33.9 51.4
23.8 35.7 40.5
18.9 40.3 40.8
22.8 32.2 45.0
16.0 37.0 47.0
14.1 31.3 54.5
13.3 31.9 54.9
16.9 39.0 44.0
17.8 35.7 46.5
22.9 32.8 44.3
22.2 34.3 43.5
16.5 28.9 54.6
10.3 26.5 63.2
17.4 28.1 54.5
11.9 24.3 63.8
16.4 29.9 53.7
11.4 25.0 63.6
16.8 24.6 58.6
13.3 23.5 63.2
10.9 22.8 66.3
12.2 21.0 66.9
13.2 28.8 58.0
12.6 24.6 62.8
19.0 27.7 53.3
18.8 26.6 54.5‡Data from 2013
COUNTY %* * *
* * *
* * *
* * *
* * *
* * *
* * *
* * *
* * *
* * *
* * *
* * *
* * *
* * *
* * *
* * *
* * *
* * *
* * *
* * *
* * *
* * *
* * *
* * *
* * *
* * *
* * *
* * *
* * *
* * *
* * *
* * *
* * *
* * *
GRADE SCHOOL %5 2015 * * *
2014 * * *
8 2015 13.2 80.3 6.6
2014 25.0 71.9 ≥5.0
*B 2015 20.3 66.1 13.6
2014 13.8 75.4 10.8
STATE %36.7 53.9 9.5
35.8 54.9 9.3
31.9 61.7 6.4
30.6 62.8 6.6
15.4 61.2 23.4
15.4 61.7 22.9
COUNTY %43.2 50.5 6.4
26.1 67.1 6.8
26.0 69.2 ≥5.0
26.8 70.6 ≥5.0
21.9 67.5 10.6
20.5 71.3 8.2
MSA Proficiency Levels Alt-MSA Proficiency LevelsBasic % Proficient % Advanced %
“na” indicates too few students for School Progress rules. “*” indicates no students or fewer than 10 students in category. • B: Biology E: English A: Algebra/Data Analysis
Scie
nce
Mat
hem
atics
Read
ing
0702
Elementary * * 94.8 ≥ 95.0 95.4 95.7Middle 91.7 92.6 93.7 94.2 95.0 95.4High 91.7 93.4 92.3 92.9 92.4 92.7
% of certificates:
% of classes NOT taught by highly qualified teachersCohort Graduation Rate
Standard Professional 40.0 40.0 44.2 41.5 27.4 27.2Advanced Professional 56.0 52.0 53.9 49.1 65.2 65.5Resident Teacher 0.0 0.0 0.0 0.0 1.1 0.7Conditional Teacher 4.0 4.0 0.6 0.6 1.5 1.0
All Quartiles 15.9 10.5 7.1 5.0 8.4 7.6Elementary Low Poverty * * * * 2.9 3.0Elementary High Poverty * * 1.1 0.0 10.5 11.4Secondary Low Poverty * * * * 6.7 6.0Secondary High Poverty * * 12.7 9.5 17.7 15.7
Class of 2014 (4-Year Rate) 86.67 85.57 86.39Class of 2014 (5-Year Rate) 86.67 86.46 88.70
Attendance Rate %State
2015 2014County
2015 20142015 2014School
Teacher Qualifications 201420152015 20142015 2014School StateCounty
Visit Reportcard.msde.maryland.gov for up-to-date and disaggregated information. For definitions, see school system report pages.

Performance LevelLevel 1 Level 2 Level 3 Level 4 Level 5
Did not yet meet expectations
Partially met expectations
Approached expectations
Met expecations Exceeded expectations
TESTED Count % Count % Count % Count % Count %
English/Language Arts 8 75 8 10.7 13 17.3 22 29.3 28 37.3 4 5.3
English/Language Arts 10 75 21 28.0 14 18.7 15 20.0 21 28.0 4 5.3
Mathematics 8 75 11 14.7 11 14.7 30 40.0 23 30.7 * ≥5.0
Algebra I 43 * ≥5.0 20 46.5 19 44.2 * ≥5.0 * ≥5.0
Algebra II 45 11 24.4 21 46.7 9 20.0 4 8.9 * ≥5.0
Partnership for Assessment of Readiness for College and Careers (PARCC)In 2015 Maryland implemented the new Partnership for Assessment of Readiness for College and Careers (PARCC) state assessments in reading and mathematics. The new assessments replace the Maryland School Assessments in English and Mathematics in grades 3-8, and replace the High School Assessments in Algebra and English 10 for all students not graduating in 2015.
PARCC Performance Level Descriptors (PLD)Performance level descriptors for English language arts/literacy and Mathematics describe what a typical student at each level should be able to demonstrate based on his/her command of grade-level standards.
Level 1: Did not yet meet expectationsLevel 2: Partially met expectationsLevel 3: Approached expectationsLevel 4: Met expectationsLevel 5: Exceeded expectations
PARCC Assessment Performance Results Summary - 2015Crisfield Academy and High School
Visit Reportcard.msde.maryland.gov for up-to-date and disaggregated information. For definitions, see school system report pages.

Deal Island School
GRADE SCHOOL %5 2015 * * *
2014 * * *
8 2015 * * *
2014 * * *
B 2015 * * *
2014 * * *
3 2015 * * *
2014 * * *
4 2015 * * *
2014 * * *
5 2015 * * *
2014 * * *
6 2015 * * *
2014 * * *
7 2015 * * *
2014 * * *
8 2015 * * *
2014 * * *
A 2015 * * *
2014 * * *
3 2015 * * *
2014 * * *
4 2015 * * *
2014 * * *
5 2015 * * *
2014 * * *
6 2015 * * *
2014 * * *
7 2015 * * *
2014 * * *
8 2015 * * *
2014 * * *
E 2015 * * *
2014 * * *
STATE %24.3 40.8 34.9
19.6 42.5 37.9
24.0 37.6 38.4
19.8 41.0 39.2
31.8 37.5 30.6
28.7 37.3 34.0
19.3 38.4 42.3
12.5 35.9 51.6
20.4 33.5 46.1
14.7 33.9 51.4
23.8 35.7 40.5
18.9 40.3 40.8
22.8 32.2 45.0
16.0 37.0 47.0
14.1 31.3 54.5
13.3 31.9 54.9
16.9 39.0 44.0
17.8 35.7 46.5
22.9 32.8 44.3
22.2 34.3 43.5
16.5 28.9 54.6
10.3 26.5 63.2
17.4 28.1 54.5
11.9 24.3 63.8
16.4 29.9 53.7
11.4 25.0 63.6
16.8 24.6 58.6
13.3 23.5 63.2
10.9 22.8 66.3
12.2 21.0 66.9
13.2 28.8 58.0
12.6 24.6 62.8
19.0 27.7 53.3
18.8 26.6 54.5‡Data from 2013
COUNTY %* * *
* * *
* * *
* * *
* * *
* * *
* * *
* * *
* * *
* * *
* * *
* * *
* * *
* * *
* * *
* * *
* * *
* * *
* * *
* * *
* * *
* * *
* * *
* * *
* * *
* * *
* * *
* * *
* * *
* * *
* * *
* * *
* * *
* * *
GRADE SCHOOL %5 2015 22.2 61.1 16.7
2014 5.6 77.8 16.7
8 2015 * * *
2014 * * *
*B 2015 * * *
2014 * * *
STATE %36.7 53.9 9.5
35.8 54.9 9.3
31.9 61.7 6.4
30.6 62.8 6.6
15.4 61.2 23.4
15.4 61.7 22.9
COUNTY %43.2 50.5 6.4
26.1 67.1 6.8
26.0 69.2 ≥5.0
26.8 70.6 ≥5.0
21.9 67.5 10.6
20.5 71.3 8.2
MSA Proficiency Levels Alt-MSA Proficiency LevelsBasic % Proficient % Advanced %
“na” indicates too few students for School Progress rules. “*” indicates no students or fewer than 10 students in category. • B: Biology E: English A: Algebra/Data Analysis
Scie
nce
Mat
hem
atics
Read
ing
1401
Elementary 94.3 94.7 94.8 ≥ 95.0 95.4 95.7Middle * * 93.7 94.2 95.0 95.4High * * 92.3 92.9 92.4 92.7
% of certificates:
% of classes NOT taught by highly qualified teachersCohort Graduation Rate
Standard Professional 50.0 37.5 44.2 41.5 27.4 27.2Advanced Professional 50.0 50.0 53.9 49.1 65.2 65.5Resident Teacher 0.0 0.0 0.0 0.0 1.1 0.7Conditional Teacher 0.0 0.0 0.6 0.6 1.5 1.0
All Quartiles 0.0 0.0 7.1 5.0 8.4 7.6Elementary Low Poverty * * * * 2.9 3.0Elementary High Poverty * * 1.1 0.0 10.5 11.4Secondary Low Poverty * * * * 6.7 6.0Secondary High Poverty * * 12.7 9.5 17.7 15.7
Class of 2014 (4-Year Rate) * 85.57 86.39Class of 2014 (5-Year Rate) * 86.46 88.70
Attendance Rate %State
2015 2014County
2015 20142015 2014School
Teacher Qualifications 201420152015 20142015 2014School StateCounty
Visit Reportcard.msde.maryland.gov for up-to-date and disaggregated information. For definitions, see school system report pages.

Performance LevelLevel 1 Level 2 Level 3 Level 4 Level 5
Did not yet meet expectations
Partially met expectations
Approached expectations
Met expecations Exceeded expectations
TESTED Count % Count % Count % Count % Count %
English/Language Arts 3 13 5 38.5 3 23.1 3 23.1 2 15.4 * ≥5.0
English/Language Arts 4 19 3 15.8 3 15.8 6 31.6 7 36.8 * ≥5.0
English/Language Arts 5 18 1 5.6 5 27.8 6 33.3 6 33.3 * ≥5.0
Mathematics 3 13 2 15.4 3 23.1 6 46.2 2 15.4 * ≥5.0
Mathematics 4 19 3 15.8 6 31.6 6 31.6 4 21.1 * ≥5.0
Mathematics 5 18 2 11.1 8 44.4 3 16.7 5 27.8 * ≥5.0
Partnership for Assessment of Readiness for College and Careers (PARCC)In 2015 Maryland implemented the new Partnership for Assessment of Readiness for College and Careers (PARCC) state assessments in reading and mathematics. The new assessments replace the Maryland School Assessments in English and Mathematics in grades 3-8, and replace the High School Assessments in Algebra and English 10 for all students not graduating in 2015.
PARCC Performance Level Descriptors (PLD)Performance level descriptors for English language arts/literacy and Mathematics describe what a typical student at each level should be able to demonstrate based on his/her command of grade-level standards.
Level 1: Did not yet meet expectationsLevel 2: Partially met expectationsLevel 3: Approached expectationsLevel 4: Met expectationsLevel 5: Exceeded expectations
PARCC Assessment Performance Results Summary - 2015Deal Island School
Visit Reportcard.msde.maryland.gov for up-to-date and disaggregated information. For definitions, see school system report pages.

Ewell School
GRADE SCHOOL %5 2015 * * *
2014 * * *
8 2015 * * *
2014 * * *
B 2015 * * *
2014 * * *
3 2015 * * *
2014 * * *
4 2015 * * *
2014 * * *
5 2015 * * *
2014 * * *
6 2015 * * *
2014 * * *
7 2015 * * *
2014 * * *
8 2015 * * *
2014 * * *
A 2015 * * *
2014 * * *
3 2015 * * *
2014 * * *
4 2015 * * *
2014 * * *
5 2015 * * *
2014 * * *
6 2015 * * *
2014 * * *
7 2015 * * *
2014 * * *
8 2015 * * *
2014 * * *
E 2015 * * *
2014 * * *
STATE %24.3 40.8 34.9
19.6 42.5 37.9
24.0 37.6 38.4
19.8 41.0 39.2
31.8 37.5 30.6
28.7 37.3 34.0
19.3 38.4 42.3
12.5 35.9 51.6
20.4 33.5 46.1
14.7 33.9 51.4
23.8 35.7 40.5
18.9 40.3 40.8
22.8 32.2 45.0
16.0 37.0 47.0
14.1 31.3 54.5
13.3 31.9 54.9
16.9 39.0 44.0
17.8 35.7 46.5
22.9 32.8 44.3
22.2 34.3 43.5
16.5 28.9 54.6
10.3 26.5 63.2
17.4 28.1 54.5
11.9 24.3 63.8
16.4 29.9 53.7
11.4 25.0 63.6
16.8 24.6 58.6
13.3 23.5 63.2
10.9 22.8 66.3
12.2 21.0 66.9
13.2 28.8 58.0
12.6 24.6 62.8
19.0 27.7 53.3
18.8 26.6 54.5‡Data from 2013
COUNTY %* * *
* * *
* * *
* * *
* * *
* * *
* * *
* * *
* * *
* * *
* * *
* * *
* * *
* * *
* * *
* * *
* * *
* * *
* * *
* * *
* * *
* * *
* * *
* * *
* * *
* * *
* * *
* * *
* * *
* * *
* * *
* * *
* * *
* * *
GRADE SCHOOL %5 2015 * * *
2014 * * *
8 2015 * * *
2014 * * *
*B 2015 * * *
2014 * * *
STATE %36.7 53.9 9.5
35.8 54.9 9.3
31.9 61.7 6.4
30.6 62.8 6.6
15.4 61.2 23.4
15.4 61.7 22.9
COUNTY %43.2 50.5 6.4
26.1 67.1 6.8
26.0 69.2 ≥5.0
26.8 70.6 ≥5.0
21.9 67.5 10.6
20.5 71.3 8.2
MSA Proficiency Levels Alt-MSA Proficiency LevelsBasic % Proficient % Advanced %
“na” indicates too few students for School Progress rules. “*” indicates no students or fewer than 10 students in category. • B: Biology E: English A: Algebra/Data Analysis
Scie
nce
Mat
hem
atics
Read
ing
1003
Elementary * * 94.8 ≥ 95.0 95.4 95.7Middle * * 93.7 94.2 95.0 95.4High * * 92.3 92.9 92.4 92.7
% of certificates:
% of classes NOT taught by highly qualified teachersCohort Graduation Rate
Standard Professional 0.0 0.0 44.2 41.5 27.4 27.2Advanced Professional 100.0 100.0 53.9 49.1 65.2 65.5Resident Teacher 0.0 0.0 0.0 0.0 1.1 0.7Conditional Teacher 0.0 0.0 0.6 0.6 1.5 1.0
All Quartiles 0.0 0.0 7.1 5.0 8.4 7.6Elementary Low Poverty * * * * 2.9 3.0Elementary High Poverty * * 1.1 0.0 10.5 11.4Secondary Low Poverty * * * * 6.7 6.0Secondary High Poverty * * 12.7 9.5 17.7 15.7
Class of 2014 (4-Year Rate) * 85.57 86.39Class of 2014 (5-Year Rate) * 86.46 88.70
Attendance Rate %State
2015 2014County
2015 20142015 2014School
Teacher Qualifications 201420152015 20142015 2014School StateCounty
Visit Reportcard.msde.maryland.gov for up-to-date and disaggregated information. For definitions, see school system report pages.

Performance LevelLevel 1 Level 2 Level 3 Level 4 Level 5
Did not yet meet expectations
Partially met expectations
Approached expectations
Met expecations Exceeded expectations
TESTED Count % Count % Count % Count % Count %
English/Language Arts 4 * * * * * * * * * * *
English/Language Arts 5 * * * * * * * * * * *
English/Language Arts 6 * * * * * * * * * * *
Mathematics 4 * * * * * * * * * * *
Mathematics 5 * * * * * * * * * * *
Mathematics 6 * * * * * * * * * * *
Partnership for Assessment of Readiness for College and Careers (PARCC)In 2015 Maryland implemented the new Partnership for Assessment of Readiness for College and Careers (PARCC) state assessments in reading and mathematics. The new assessments replace the Maryland School Assessments in English and Mathematics in grades 3-8, and replace the High School Assessments in Algebra and English 10 for all students not graduating in 2015.
PARCC Performance Level Descriptors (PLD)Performance level descriptors for English language arts/literacy and Mathematics describe what a typical student at each level should be able to demonstrate based on his/her command of grade-level standards.
Level 1: Did not yet meet expectationsLevel 2: Partially met expectationsLevel 3: Approached expectationsLevel 4: Met expectationsLevel 5: Exceeded expectations
PARCC Assessment Performance Results Summary - 2015Ewell School
Visit Reportcard.msde.maryland.gov for up-to-date and disaggregated information. For definitions, see school system report pages.

Greenwood Elementary School
GRADE SCHOOL %5 2015 * * *
2014 * * *
8 2015 * * *
2014 * * *
B 2015 * * *
2014 * * *
3 2015 * * *
2014 * * *
4 2015 * * *
2014 * * *
5 2015 * * *
2014 * * *
6 2015 * * *
2014 * * *
7 2015 * * *
2014 * * *
8 2015 * * *
2014 * * *
A 2015 * * *
2014 * * *
3 2015 * * *
2014 * * *
4 2015 * * *
2014 * * *
5 2015 * * *
2014 * * *
6 2015 * * *
2014 * * *
7 2015 * * *
2014 * * *
8 2015 * * *
2014 * * *
E 2015 * * *
2014 * * *
STATE %24.3 40.8 34.9
19.6 42.5 37.9
24.0 37.6 38.4
19.8 41.0 39.2
31.8 37.5 30.6
28.7 37.3 34.0
19.3 38.4 42.3
12.5 35.9 51.6
20.4 33.5 46.1
14.7 33.9 51.4
23.8 35.7 40.5
18.9 40.3 40.8
22.8 32.2 45.0
16.0 37.0 47.0
14.1 31.3 54.5
13.3 31.9 54.9
16.9 39.0 44.0
17.8 35.7 46.5
22.9 32.8 44.3
22.2 34.3 43.5
16.5 28.9 54.6
10.3 26.5 63.2
17.4 28.1 54.5
11.9 24.3 63.8
16.4 29.9 53.7
11.4 25.0 63.6
16.8 24.6 58.6
13.3 23.5 63.2
10.9 22.8 66.3
12.2 21.0 66.9
13.2 28.8 58.0
12.6 24.6 62.8
19.0 27.7 53.3
18.8 26.6 54.5‡Data from 2013
COUNTY %* * *
* * *
* * *
* * *
* * *
* * *
* * *
* * *
* * *
* * *
* * *
* * *
* * *
* * *
* * *
* * *
* * *
* * *
* * *
* * *
* * *
* * *
* * *
* * *
* * *
* * *
* * *
* * *
* * *
* * *
* * *
* * *
* * *
* * *
GRADE SCHOOL %5 2015 61.7 35.0 ≥5.0
2014 40.0 53.3 6.7
8 2015 * * *
2014 * * *
*B 2015 * * *
2014 * * *
STATE %36.7 53.9 9.5
35.8 54.9 9.3
31.9 61.7 6.4
30.6 62.8 6.6
15.4 61.2 23.4
15.4 61.7 22.9
COUNTY %43.2 50.5 6.4
26.1 67.1 6.8
26.0 69.2 ≥5.0
26.8 70.6 ≥5.0
21.9 67.5 10.6
20.5 71.3 8.2
MSA Proficiency Levels Alt-MSA Proficiency LevelsBasic % Proficient % Advanced %
“na” indicates too few students for School Progress rules. “*” indicates no students or fewer than 10 students in category. • B: Biology E: English A: Algebra/Data Analysis
Scie
nce
Mat
hem
atics
Read
ing
0105
Elementary 94.6 ≥ 95.0 94.8 ≥ 95.0 95.4 95.7Middle * * 93.7 94.2 95.0 95.4High * * 92.3 92.9 92.4 92.7
% of certificates:
% of classes NOT taught by highly qualified teachersCohort Graduation Rate
Standard Professional 52.0 39.1 44.2 41.5 27.4 27.2Advanced Professional 44.0 47.8 53.9 49.1 65.2 65.5Resident Teacher 0.0 0.0 0.0 0.0 1.1 0.7Conditional Teacher 0.0 0.0 0.6 0.6 1.5 1.0
All Quartiles 0.0 0.0 7.1 5.0 8.4 7.6Elementary Low Poverty * * * * 2.9 3.0Elementary High Poverty * * 1.1 0.0 10.5 11.4Secondary Low Poverty * * * * 6.7 6.0Secondary High Poverty * * 12.7 9.5 17.7 15.7
Class of 2014 (4-Year Rate) * 85.57 86.39Class of 2014 (5-Year Rate) * 86.46 88.70
Attendance Rate %State
2015 2014County
2015 20142015 2014School
Teacher Qualifications 201420152015 20142015 2014School StateCounty
Visit Reportcard.msde.maryland.gov for up-to-date and disaggregated information. For definitions, see school system report pages.

Performance LevelLevel 1 Level 2 Level 3 Level 4 Level 5
Did not yet meet expectations
Partially met expectations
Approached expectations
Met expecations Exceeded expectations
TESTED Count % Count % Count % Count % Count %
English/Language Arts 3 75 28 37.3 18 24.0 17 22.7 11 14.7 * ≥5.0
English/Language Arts 4 57 6 10.5 18 31.6 20 35.1 12 21.1 * ≥5.0
English/Language Arts 5 59 13 22.0 19 32.2 16 27.1 11 18.6 * ≥5.0
Mathematics 3 76 12 15.8 31 40.8 22 28.9 9 11.8 * ≥5.0
Mathematics 4 57 9 15.8 28 49.1 17 29.8 3 5.3 * ≥5.0
Mathematics 5 60 7 11.7 26 43.3 21 35.0 6 10.0 * ≥5.0
Partnership for Assessment of Readiness for College and Careers (PARCC)In 2015 Maryland implemented the new Partnership for Assessment of Readiness for College and Careers (PARCC) state assessments in reading and mathematics. The new assessments replace the Maryland School Assessments in English and Mathematics in grades 3-8, and replace the High School Assessments in Algebra and English 10 for all students not graduating in 2015.
PARCC Performance Level Descriptors (PLD)Performance level descriptors for English language arts/literacy and Mathematics describe what a typical student at each level should be able to demonstrate based on his/her command of grade-level standards.
Level 1: Did not yet meet expectationsLevel 2: Partially met expectationsLevel 3: Approached expectationsLevel 4: Met expectationsLevel 5: Exceeded expectations
PARCC Assessment Performance Results Summary - 2015Greenwood Elementary School
Visit Reportcard.msde.maryland.gov for up-to-date and disaggregated information. For definitions, see school system report pages.

J. M. Tawes Vocational Center
GRADE SCHOOL %5 2015 * * *
2014 * * *
8 2015 * * *
2014 * * *
B 2015 * * *
2014 * * *
3 2015 * * *
2014 * * *
4 2015 * * *
2014 * * *
5 2015 * * *
2014 * * *
6 2015 * * *
2014 * * *
7 2015 * * *
2014 * * *
8 2015 * * *
2014 * * *
A 2015 * * *
2014 * * *
3 2015 * * *
2014 * * *
4 2015 * * *
2014 * * *
5 2015 * * *
2014 * * *
6 2015 * * *
2014 * * *
7 2015 * * *
2014 * * *
8 2015 * * *
2014 * * *
E 2015 * * *
2014 * * *
STATE %24.3 40.8 34.9
19.6 42.5 37.9
24.0 37.6 38.4
19.8 41.0 39.2
31.8 37.5 30.6
28.7 37.3 34.0
19.3 38.4 42.3
12.5 35.9 51.6
20.4 33.5 46.1
14.7 33.9 51.4
23.8 35.7 40.5
18.9 40.3 40.8
22.8 32.2 45.0
16.0 37.0 47.0
14.1 31.3 54.5
13.3 31.9 54.9
16.9 39.0 44.0
17.8 35.7 46.5
22.9 32.8 44.3
22.2 34.3 43.5
16.5 28.9 54.6
10.3 26.5 63.2
17.4 28.1 54.5
11.9 24.3 63.8
16.4 29.9 53.7
11.4 25.0 63.6
16.8 24.6 58.6
13.3 23.5 63.2
10.9 22.8 66.3
12.2 21.0 66.9
13.2 28.8 58.0
12.6 24.6 62.8
19.0 27.7 53.3
18.8 26.6 54.5‡Data from 2013
COUNTY %* * *
* * *
* * *
* * *
* * *
* * *
* * *
* * *
* * *
* * *
* * *
* * *
* * *
* * *
* * *
* * *
* * *
* * *
* * *
* * *
* * *
* * *
* * *
* * *
* * *
* * *
* * *
* * *
* * *
* * *
* * *
* * *
* * *
* * *
GRADE SCHOOL %5 2015 * * *
2014 * * *
8 2015 * * *
2014 * * *
*B 2015 * * *
2014 * * *
STATE %36.7 53.9 9.5
35.8 54.9 9.3
31.9 61.7 6.4
30.6 62.8 6.6
15.4 61.2 23.4
15.4 61.7 22.9
COUNTY %43.2 50.5 6.4
26.1 67.1 6.8
26.0 69.2 ≥5.0
26.8 70.6 ≥5.0
21.9 67.5 10.6
20.5 71.3 8.2
MSA Proficiency Levels Alt-MSA Proficiency LevelsBasic % Proficient % Advanced %
“na” indicates too few students for School Progress rules. “*” indicates no students or fewer than 10 students in category. • B: Biology E: English A: Algebra/Data Analysis
Scie
nce
Mat
hem
atics
Read
ing
1302
Elementary * * 94.8 ≥ 95.0 95.4 95.7Middle * * 93.7 94.2 95.0 95.4High * * 92.3 92.9 92.4 92.7
% of certificates:
% of classes NOT taught by highly qualified teachersCohort Graduation Rate
Standard Professional * * 44.2 41.5 27.4 27.2Advanced Professional * * 53.9 49.1 65.2 65.5Resident Teacher * * 0.0 0.0 1.1 0.7Conditional Teacher * * 0.6 0.6 1.5 1.0
All Quartiles * * 7.1 5.0 8.4 7.6Elementary Low Poverty * * * * 2.9 3.0Elementary High Poverty * * 1.1 0.0 10.5 11.4Secondary Low Poverty * * * * 6.7 6.0Secondary High Poverty * * 12.7 9.5 17.7 15.7
Class of 2014 (4-Year Rate) * 85.57 86.39Class of 2014 (5-Year Rate) * 86.46 88.70
Attendance Rate %State
2015 2014County
2015 20142015 2014School
Teacher Qualifications 201420152015 20142015 2014School StateCounty
Visit Reportcard.msde.maryland.gov for up-to-date and disaggregated information. For definitions, see school system report pages.

Performance LevelLevel 1 Level 2 Level 3 Level 4 Level 5
Did not yet meet expectations
Partially met expectations
Approached expectations
Met expecations Exceeded expectations
TESTED Count % Count % Count % Count % Count %
Partnership for Assessment of Readiness for College and Careers (PARCC)In 2015 Maryland implemented the new Partnership for Assessment of Readiness for College and Careers (PARCC) state assessments in reading and mathematics. The new assessments replace the Maryland School Assessments in English and Mathematics in grades 3-8, and replace the High School Assessments in Algebra and English 10 for all students not graduating in 2015.
PARCC Performance Level Descriptors (PLD)Performance level descriptors for English language arts/literacy and Mathematics describe what a typical student at each level should be able to demonstrate based on his/her command of grade-level standards.
Level 1: Did not yet meet expectationsLevel 2: Partially met expectationsLevel 3: Approached expectationsLevel 4: Met expectationsLevel 5: Exceeded expectations
PARCC Assessment Performance Results Summary - 2015J. M. Tawes Vocational Center
Visit Reportcard.msde.maryland.gov for up-to-date and disaggregated information. For definitions, see school system report pages.

Princess Anne Elementary
GRADE SCHOOL %5 2015 * * *
2014 * * *
8 2015 * * *
2014 * * *
B 2015 * * *
2014 * * *
3 2015 * * *
2014 * * *
4 2015 * * *
2014 * * *
5 2015 * * *
2014 * * *
6 2015 * * *
2014 * * *
7 2015 * * *
2014 * * *
8 2015 * * *
2014 * * *
A 2015 * * *
2014 * * *
3 2015 * * *
2014 * * *
4 2015 * * *
2014 * * *
5 2015 * * *
2014 * * *
6 2015 * * *
2014 * * *
7 2015 * * *
2014 * * *
8 2015 * * *
2014 * * *
E 2015 * * *
2014 * * *
STATE %24.3 40.8 34.9
19.6 42.5 37.9
24.0 37.6 38.4
19.8 41.0 39.2
31.8 37.5 30.6
28.7 37.3 34.0
19.3 38.4 42.3
12.5 35.9 51.6
20.4 33.5 46.1
14.7 33.9 51.4
23.8 35.7 40.5
18.9 40.3 40.8
22.8 32.2 45.0
16.0 37.0 47.0
14.1 31.3 54.5
13.3 31.9 54.9
16.9 39.0 44.0
17.8 35.7 46.5
22.9 32.8 44.3
22.2 34.3 43.5
16.5 28.9 54.6
10.3 26.5 63.2
17.4 28.1 54.5
11.9 24.3 63.8
16.4 29.9 53.7
11.4 25.0 63.6
16.8 24.6 58.6
13.3 23.5 63.2
10.9 22.8 66.3
12.2 21.0 66.9
13.2 28.8 58.0
12.6 24.6 62.8
19.0 27.7 53.3
18.8 26.6 54.5‡Data from 2013
COUNTY %* * *
* * *
* * *
* * *
* * *
* * *
* * *
* * *
* * *
* * *
* * *
* * *
* * *
* * *
* * *
* * *
* * *
* * *
* * *
* * *
* * *
* * *
* * *
* * *
* * *
* * *
* * *
* * *
* * *
* * *
* * *
* * *
* * *
* * *
GRADE SCHOOL %5 2015 37.7 54.7 7.5
2014 20.4 73.5 6.1
8 2015 * * *
2014 * * *
*B 2015 * * *
2014 * * *
STATE %36.7 53.9 9.5
35.8 54.9 9.3
31.9 61.7 6.4
30.6 62.8 6.6
15.4 61.2 23.4
15.4 61.7 22.9
COUNTY %43.2 50.5 6.4
26.1 67.1 6.8
26.0 69.2 ≥5.0
26.8 70.6 ≥5.0
21.9 67.5 10.6
20.5 71.3 8.2
MSA Proficiency Levels Alt-MSA Proficiency LevelsBasic % Proficient % Advanced %
“na” indicates too few students for School Progress rules. “*” indicates no students or fewer than 10 students in category. • B: Biology E: English A: Algebra/Data Analysis
Scie
nce
Mat
hem
atics
Read
ing
0106
Elementary 94.8 ≥ 95.0 94.8 ≥ 95.0 95.4 95.7Middle * * 93.7 94.2 95.0 95.4High * * 92.3 92.9 92.4 92.7
% of certificates:
% of classes NOT taught by highly qualified teachersCohort Graduation Rate
Standard Professional 47.8 63.6 44.2 41.5 27.4 27.2Advanced Professional 52.2 27.3 53.9 49.1 65.2 65.5Resident Teacher 0.0 0.0 0.0 0.0 1.1 0.7Conditional Teacher 0.0 0.0 0.6 0.6 1.5 1.0
All Quartiles 3.6 0.0 7.1 5.0 8.4 7.6Elementary Low Poverty * * * * 2.9 3.0Elementary High Poverty * * 1.1 0.0 10.5 11.4Secondary Low Poverty * * * * 6.7 6.0Secondary High Poverty * * 12.7 9.5 17.7 15.7
Class of 2014 (4-Year Rate) * 85.57 86.39Class of 2014 (5-Year Rate) * 86.46 88.70
Attendance Rate %State
2015 2014County
2015 20142015 2014School
Teacher Qualifications 201420152015 20142015 2014School StateCounty
Visit Reportcard.msde.maryland.gov for up-to-date and disaggregated information. For definitions, see school system report pages.

Performance LevelLevel 1 Level 2 Level 3 Level 4 Level 5
Did not yet meet expectations
Partially met expectations
Approached expectations
Met expecations Exceeded expectations
TESTED Count % Count % Count % Count % Count %
English/Language Arts 3 54 15 27.8 13 24.1 23 42.6 3 5.6 * ≥5.0
English/Language Arts 4 50 7 14.0 12 24.0 16 32.0 11 22.0 4 8.0
English/Language Arts 5 52 9 17.3 17 32.7 18 34.6 7 13.5 * ≥5.0
Mathematics 3 53 4 7.5 21 39.6 22 41.5 6 11.3 * ≥5.0
Mathematics 4 50 7 14.0 15 30.0 14 28.0 14 28.0 * ≥5.0
Mathematics 5 53 6 11.3 25 47.2 18 34.0 4 7.5 * ≥5.0
Partnership for Assessment of Readiness for College and Careers (PARCC)In 2015 Maryland implemented the new Partnership for Assessment of Readiness for College and Careers (PARCC) state assessments in reading and mathematics. The new assessments replace the Maryland School Assessments in English and Mathematics in grades 3-8, and replace the High School Assessments in Algebra and English 10 for all students not graduating in 2015.
PARCC Performance Level Descriptors (PLD)Performance level descriptors for English language arts/literacy and Mathematics describe what a typical student at each level should be able to demonstrate based on his/her command of grade-level standards.
Level 1: Did not yet meet expectationsLevel 2: Partially met expectationsLevel 3: Approached expectationsLevel 4: Met expectationsLevel 5: Exceeded expectations
PARCC Assessment Performance Results Summary - 2015Princess Anne Elementary
Visit Reportcard.msde.maryland.gov for up-to-date and disaggregated information. For definitions, see school system report pages.

Somerset 6/7 Intermediate School
GRADE SCHOOL %5 2015 * * *
2014 * * *
8 2015 * * *
2014 * * *
B 2015 * * *
2014 * * *
3 2015 * * *
2014 * * *
4 2015 * * *
2014 * * *
5 2015 * * *
2014 * * *
6 2015 * * *
2014 * * *
7 2015 * * *
2014 * * *
8 2015 * * *
2014 * * *
A 2015 * * *
2014 * * *
3 2015 * * *
2014 * * *
4 2015 * * *
2014 * * *
5 2015 * * *
2014 * * *
6 2015 * * *
2014 * * *
7 2015 * * *
2014 * * *
8 2015 * * *
2014 * * *
E 2015 * * *
2014 * * *
STATE %24.3 40.8 34.9
19.6 42.5 37.9
24.0 37.6 38.4
19.8 41.0 39.2
31.8 37.5 30.6
28.7 37.3 34.0
19.3 38.4 42.3
12.5 35.9 51.6
20.4 33.5 46.1
14.7 33.9 51.4
23.8 35.7 40.5
18.9 40.3 40.8
22.8 32.2 45.0
16.0 37.0 47.0
14.1 31.3 54.5
13.3 31.9 54.9
16.9 39.0 44.0
17.8 35.7 46.5
22.9 32.8 44.3
22.2 34.3 43.5
16.5 28.9 54.6
10.3 26.5 63.2
17.4 28.1 54.5
11.9 24.3 63.8
16.4 29.9 53.7
11.4 25.0 63.6
16.8 24.6 58.6
13.3 23.5 63.2
10.9 22.8 66.3
12.2 21.0 66.9
13.2 28.8 58.0
12.6 24.6 62.8
19.0 27.7 53.3
18.8 26.6 54.5‡Data from 2013
COUNTY %* * *
* * *
* * *
* * *
* * *
* * *
* * *
* * *
* * *
* * *
* * *
* * *
* * *
* * *
* * *
* * *
* * *
* * *
* * *
* * *
* * *
* * *
* * *
* * *
* * *
* * *
* * *
* * *
* * *
* * *
* * *
* * *
* * *
* * *
GRADE SCHOOL %5 2015 * * *
2014 * * *
8 2015 * * *
2014 * * *
*B 2015 * * *
2014 * * *
STATE %36.7 53.9 9.5
35.8 54.9 9.3
31.9 61.7 6.4
30.6 62.8 6.6
15.4 61.2 23.4
15.4 61.7 22.9
COUNTY %43.2 50.5 6.4
26.1 67.1 6.8
26.0 69.2 ≥5.0
26.8 70.6 ≥5.0
21.9 67.5 10.6
20.5 71.3 8.2
MSA Proficiency Levels Alt-MSA Proficiency LevelsBasic % Proficient % Advanced %
“na” indicates too few students for School Progress rules. “*” indicates no students or fewer than 10 students in category. • B: Biology E: English A: Algebra/Data Analysis
Scie
nce
Mat
hem
atics
Read
ing
1303
Elementary * * 94.8 ≥ 95.0 95.4 95.7Middle 94.0 94.5 93.7 94.2 95.0 95.4High * * 92.3 92.9 92.4 92.7
% of certificates:
% of classes NOT taught by highly qualified teachersCohort Graduation Rate
Standard Professional 50.0 35.7 44.2 41.5 27.4 27.2Advanced Professional 50.0 50.0 53.9 49.1 65.2 65.5Resident Teacher 0.0 0.0 0.0 0.0 1.1 0.7Conditional Teacher 0.0 0.0 0.6 0.6 1.5 1.0
All Quartiles 7.9 3.4 7.1 5.0 8.4 7.6Elementary Low Poverty * * * * 2.9 3.0Elementary High Poverty * * 1.1 0.0 10.5 11.4Secondary Low Poverty * * * * 6.7 6.0Secondary High Poverty * * 12.7 9.5 17.7 15.7
Class of 2014 (4-Year Rate) * 85.57 86.39Class of 2014 (5-Year Rate) * 86.46 88.70
Attendance Rate %State
2015 2014County
2015 20142015 2014School
Teacher Qualifications 201420152015 20142015 2014School StateCounty
Visit Reportcard.msde.maryland.gov for up-to-date and disaggregated information. For definitions, see school system report pages.

Performance LevelLevel 1 Level 2 Level 3 Level 4 Level 5
Did not yet meet expectations
Partially met expectations
Approached expectations
Met expecations Exceeded expectations
TESTED Count % Count % Count % Count % Count %
English/Language Arts 6 207 17 8.2 62 30.0 76 36.7 48 23.2 * ≥5.0
English/Language Arts 7 178 26 14.6 48 27.0 60 33.7 34 19.1 10 5.6
Mathematics 6 207 * ≥5.0 72 34.8 89 43.0 35 16.9 * ≥5.0
Mathematics 7 178 14 7.9 59 33.1 75 42.1 29 16.3 * ≥5.0
Partnership for Assessment of Readiness for College and Careers (PARCC)In 2015 Maryland implemented the new Partnership for Assessment of Readiness for College and Careers (PARCC) state assessments in reading and mathematics. The new assessments replace the Maryland School Assessments in English and Mathematics in grades 3-8, and replace the High School Assessments in Algebra and English 10 for all students not graduating in 2015.
PARCC Performance Level Descriptors (PLD)Performance level descriptors for English language arts/literacy and Mathematics describe what a typical student at each level should be able to demonstrate based on his/her command of grade-level standards.
Level 1: Did not yet meet expectationsLevel 2: Partially met expectationsLevel 3: Approached expectationsLevel 4: Met expectationsLevel 5: Exceeded expectations
PARCC Assessment Performance Results Summary - 2015Somerset 6/7 Intermediate School
Visit Reportcard.msde.maryland.gov for up-to-date and disaggregated information. For definitions, see school system report pages.

Washington Academy and High School
GRADE SCHOOL %5 2015 * * *
2014 * * *
8 2015 * * *
2014 * * *
B 2015 * * *
2014 * * *
3 2015 * * *
2014 * * *
4 2015 * * *
2014 * * *
5 2015 * * *
2014 * * *
6 2015 * * *
2014 * * *
7 2015 * * *
2014 * * *
8 2015 * * *
2014 * * *
A 2015 * * *
2014 * * *
3 2015 * * *
2014 * * *
4 2015 * * *
2014 * * *
5 2015 * * *
2014 * * *
6 2015 * * *
2014 * * *
7 2015 * * *
2014 * * *
8 2015 * * *
2014 * * *
E 2015 * * *
2014 * * *
STATE %24.3 40.8 34.9
19.6 42.5 37.9
24.0 37.6 38.4
19.8 41.0 39.2
31.8 37.5 30.6
28.7 37.3 34.0
19.3 38.4 42.3
12.5 35.9 51.6
20.4 33.5 46.1
14.7 33.9 51.4
23.8 35.7 40.5
18.9 40.3 40.8
22.8 32.2 45.0
16.0 37.0 47.0
14.1 31.3 54.5
13.3 31.9 54.9
16.9 39.0 44.0
17.8 35.7 46.5
22.9 32.8 44.3
22.2 34.3 43.5
16.5 28.9 54.6
10.3 26.5 63.2
17.4 28.1 54.5
11.9 24.3 63.8
16.4 29.9 53.7
11.4 25.0 63.6
16.8 24.6 58.6
13.3 23.5 63.2
10.9 22.8 66.3
12.2 21.0 66.9
13.2 28.8 58.0
12.6 24.6 62.8
19.0 27.7 53.3
18.8 26.6 54.5‡Data from 2013
COUNTY %* * *
* * *
* * *
* * *
* * *
* * *
* * *
* * *
* * *
* * *
* * *
* * *
* * *
* * *
* * *
* * *
* * *
* * *
* * *
* * *
* * *
* * *
* * *
* * *
* * *
* * *
* * *
* * *
* * *
* * *
* * *
* * *
* * *
* * *
GRADE SCHOOL %5 2015 * * *
2014 * * *
8 2015 33.3 62.9 ≥5.0
2014 27.9 69.8 ≥5.0
*B 2015 22.0 69.0 9.0
2014 21.6 71.6 6.9
STATE %36.7 53.9 9.5
35.8 54.9 9.3
31.9 61.7 6.4
30.6 62.8 6.6
15.4 61.2 23.4
15.4 61.7 22.9
COUNTY %43.2 50.5 6.4
26.1 67.1 6.8
26.0 69.2 ≥5.0
26.8 70.6 ≥5.0
21.9 67.5 10.6
20.5 71.3 8.2
MSA Proficiency Levels Alt-MSA Proficiency LevelsBasic % Proficient % Advanced %
“na” indicates too few students for School Progress rules. “*” indicates no students or fewer than 10 students in category. • B: Biology E: English A: Algebra/Data Analysis
Scie
nce
Mat
hem
atics
Read
ing
0102
Elementary * * 94.8 ≥ 95.0 95.4 95.7Middle 94.0 94.2 93.7 94.2 95.0 95.4High 92.7 92.5 92.3 92.9 92.4 92.7
% of certificates:
% of classes NOT taught by highly qualified teachersCohort Graduation Rate
Standard Professional 29.4 30.3 44.2 41.5 27.4 27.2Advanced Professional 67.6 60.6 53.9 49.1 65.2 65.5Resident Teacher 0.0 0.0 0.0 0.0 1.1 0.7Conditional Teacher 0.0 0.0 0.6 0.6 1.5 1.0
All Quartiles 13.7 13.0 7.1 5.0 8.4 7.6Elementary Low Poverty * * * * 2.9 3.0Elementary High Poverty * * 1.1 0.0 10.5 11.4Secondary Low Poverty * * * * 6.7 6.0Secondary High Poverty * * 12.7 9.5 17.7 15.7
Class of 2014 (4-Year Rate) 84.87 85.57 86.39Class of 2014 (5-Year Rate) 86.32 86.46 88.70
Attendance Rate %State
2015 2014County
2015 20142015 2014School
Teacher Qualifications 201420152015 20142015 2014School StateCounty
Visit Reportcard.msde.maryland.gov for up-to-date and disaggregated information. For definitions, see school system report pages.
Performance LevelLevel 1 Level 2 Level 3 Level 4 Level 5
Did not yet meet expectations
Partially met expectations
Approached expectations
Met expecations Exceeded expectations
TESTED Count % Count % Count % Count % Count %
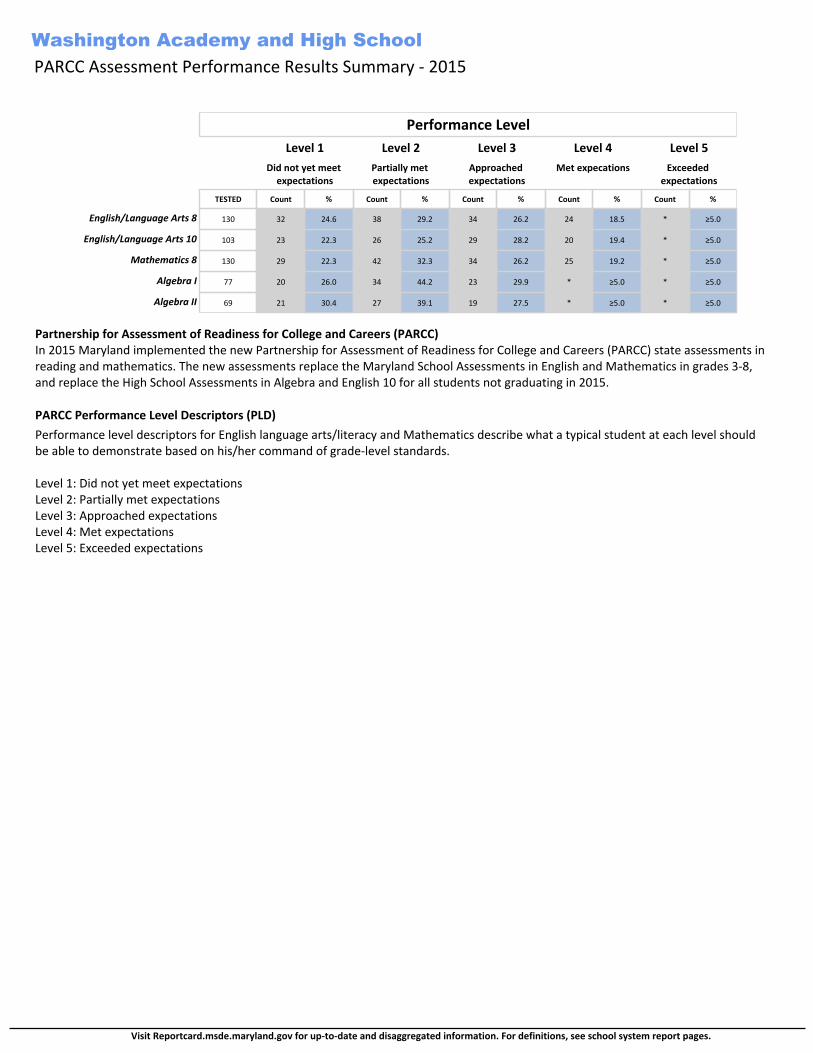
English/Language Arts 8 130 32 24.6 38 29.2 34 26.2 24 18.5 * ≥5.0
English/Language Arts 10 103 23 22.3 26 25.2 29 28.2 20 19.4 * ≥5.0
Mathematics 8 130 29 22.3 42 32.3 34 26.2 25 19.2 * ≥5.0
Algebra I 77 20 26.0 34 44.2 23 29.9 * ≥5.0 * ≥5.0
Algebra II 69 21 30.4 27 39.1 19 27.5 * ≥5.0 * ≥5.0
Partnership for Assessment of Readiness for College and Careers (PARCC)In 2015 Maryland implemented the new Partnership for Assessment of Readiness for College and Careers (PARCC) state assessments in reading and mathematics. The new assessments replace the Maryland School Assessments in English and Mathematics in grades 3-8, and replace the High School Assessments in Algebra and English 10 for all students not graduating in 2015.
PARCC Performance Level Descriptors (PLD)Performance level descriptors for English language arts/literacy and Mathematics describe what a typical student at each level should be able to demonstrate based on his/her command of grade-level standards.
Level 1: Did not yet meet expectationsLevel 2: Partially met expectationsLevel 3: Approached expectationsLevel 4: Met expectationsLevel 5: Exceeded expectations
PARCC Assessment Performance Results Summary - 2015Washington Academy and High School
Visit Reportcard.msde.maryland.gov for up-to-date and disaggregated information. For definitions, see school system report pages.