Embed Size (px)
Citation preview

1 | P a g e
2013
Prepared by
Environmental Finance Center
University of Maryland
February 2013
Recreational Boating and Fiscal Analysis Study

Environmental Finance Center Recreational Boating and Fiscal Analysis Study 2 | P a g e
This report was produced on behalf of the Maryland Department of Natural Resources.
Project Lead and Primary Authors
Dan Nees, Senior Research Associate, Environmental Finance Center, [email protected] Eric Reed, Research Associate, Environmental Finance Center, [email protected] Robert Wieland, Economist, Main Street Economics, [email protected]
Acknowledgements
We thank Sharon Carrick, Arden Fields and Paul Chenoweth of MD DNR for their help in procuring boat registration and dealer sales data for the project. We also thank Doug Lipton and Anna Alberini of the University of Maryland’s Department of Agricultural and Resource Economics for their help with model design issues, and Demetrios Demetreou who helped with the research and analysis. Additional analytical assistance was provided by Ivanova Reyes, a Ph. D candidate at American University. While the assistance provided by the aforementioned was crucial to the project, they bear no responsibility for any errors or omissions in our report.
Environmental Finance Center
The Environmental Finance Center (EFC) is located at the National Center for Smart Growth Research and Education at the University of Maryland in College Park. The EFC is a regional center developed by the Environmental Protection Agency to assist communities and watershed organizations in identifying innovative and sustainable ways of implementing and financing their resource
protection efforts throughout the Mid-‐Atlantic region. The EFC is non-‐advocacy in nature and has assisted communities and organizations in developing effective sustainable strategies for specific watershed protection
Photo credit: Bobby Mikul whose collection can be viewed at http://www.publicdomainpictures.net/view-‐image.php?image=8764&picture=bay-‐sunset

Environmental Finance Center Recreational Boating and Fiscal Analysis Study 3 | P a g e
Part 1: Introduction and Project Description The following report provides a detailed analysis of proposed legislative and policy decisions aimed at revitalizing Maryland’s boating industry and maintaining adequate resources for its Waterway Improvement Fund (WIF). Specifically, the Maryland Department of Natural Resources asked the Environmental Finance Center (EFC) to estimate the probable impacts of changing the reach and scale of the state’s vessel excise tax, as well as extending fees to non-‐motorized boats. The department also asked EFC to assess the effect that a cap on the excise tax might have on:
• Boats registered in Maryland; • Boats bought and sold in Maryland; • Dedicated and general fiscal revenues; and, • Demand for WIF resources.
To address these issues, our assessment considers both the direct and indirect effects of each policy proposal and was informed, when possible, by the experience of other states that have adopted similar caps. In addition, our assessment accounted for the different conditions and factors that are likely to influence market response, including ways in which other states might respond to a Maryland cap. Finally, we provide information about promising alternative means for enabling growth in the boating industry and enhancing the WIF.
This study examines these issues by building upon existing research on boating and its economic impacts in Maryland. Specifically, comparative preferences of boaters and their perceptions of environmental and legal/regulatory conditions in Maryland and neighboring states have been surveyed and evaluated (Lipton and Hicks, 1998). The economic impact of out-‐of-‐state boaters on Maryland’s economy has been assessed (Lipton, 2005). And efforts are ongoing to update information on the economic impact of recreational boating more generally in Maryland. These and other source materials provided a starting place for the study.
From this base of current understanding about boater choices on buying and registering their boats, we developed a predictive model of demand response given each of the targeted policy alternatives. This model took into account relative costs of buying and registering a boat in a number of potentially competitive states along the eastern seaboard. It examined both the wider boating population and specific segments of that population whose behavior will have greater impact on the revenue outcomes of targeted policy alternatives.
Our analysis of likely demand response in the face of each of the policy alternatives employed standard economic methods. Those methods are based on the presumption that consumer choice is a function of prices – including associated costs – alternatives, personal preferences and income or wealth. Based on these assumptions, we developed a model of boater choices, which used the best available data to inform each of these determinants of

Environmental Finance Center Recreational Boating and Fiscal Analysis Study 4 | P a g e
demand. We subjected our findings and analysis to review by other experts in the field and made adjustments based on that review.
Finally, we assessed other revenue options available to the state for generating sufficient revenues to support the Waterway Improvement Fund. Below is a description of our key findings.
Significant Issues and Findings:
• A cap on the state’s vessel excise tax (VET) will result in lost revenue to the state’s Waterway Improvement Fund. Our demand model predicts that a cap on Maryland’s vessel excise tax will not stimulate enough additional sales to recover lost revenue from decreased tax rates on individual boat sales and registrations, though there would be a modest increase in sales and registrations resulting from a cap.
• The decline in the Waterway Improvement Fund is the direct result of decreased boat registrations and sales in Maryland. Maryland’s vessel excise tax (VET) is a 5% charge assessed on the sale or market value of motorized boats registered in Maryland. The VET is the principal source of revenue for Maryland’s Waterway Improvement Fund (WIF). Since 2007 there has been a precipitous decline in all boat registrations, including high value boats (those with a purchase price greater than $150,000), which account for a significant part of VET revenues. Mirroring the decline in high-‐value boat registrations, there has been a steep decline in high value boat sales, which have fallen off more precipitously than boat sales in general.
• WIF projects are important for maintaining the boating economy in Maryland. The WIF is an important source of funding for projects that enhance boating opportunities in Maryland’s waters, including maintaining public boating facilities and public navigation channels. Studies of recreational boating indicate that major factors for where boaters decide to boat are distance from residence to launch site, safety, adequate infrastructure and facilities, the quality of water, fishing, and activities, and taxes and fees. In addition, adequate infrastructure appears to be an important factor in recreational boater’s location decisions regardless of vessel size.
• The VET exposes essential WIF projects, such as boating infrastructure maintenance and investments, to the cyclicality of recreational boating sales. Because the VET is a one-‐time fee paid by boat owners, WIF revenues require constant change or additions in boater registrations. Therefore, to maintain adequate levels in WIF revenues, there must be about 7.5 to 8% growth in the value of new registrations each year. The current level of infrastructure project funding in the WIF may not support boating infrastructure projects necessary to maintain levels of service. Consequently a deterioration of infrastructure due to lack of maintenance or investment could contribute to a decline in the recreational boating economy of Maryland.
Environmental Finance Center Recreational Boating and Fiscal Analysis Study 5 | P a g e
• There is no direct evidence that an excise tax cap in Florida led to decreased boater registrations in Maryland. The state of Florida implemented an excise tax cap in 2010. In 2011, annual boat tax revenues in Florida actually increased, rising to over 95 percent of their 2008-‐2009 value. Still, Florida’s boat tax revenues that year were only a fraction (42.56 percent) of their 2005 high. Notably, even without a tax cap, the decline in VET revenues in Maryland has stabilized over the past few years and in 2011 revenues were 42.97 percent of their 2004 high. In addition, Florida’s excise tax cap was set at $18,000, which only impacted boats at values of $300,000 or higher. Which, given Maryland’s 5% VET, would only impact boats valued at $360,000 and greater.

Environmental Finance Center Recreational Boating and Fiscal Analysis Study 6 | P a g e
Part 2: Background Maryland offers myriad opportunities for recreational boating activities. As a result, there are nearly 200,000 registered boats in the state, and an additional 57,000 non-‐registered vessels. Boating is an important part of Maryland’s culture and quality of life, and as a result, the boating industry has a tremendous impact on Maryland’s economy. For example, a study conducted by Douglas Lipton, a Marine Economic Specialist at the University of Maryland Sea Grant Extension Program, assessed the economic impact of recreational boats registered in Maryland and of the Maryland recreational boating industry. Updated in 2009, the study indicated that approximately every 6 boats registered in Maryland lead to more than one full time equivalent (FTE) job in the State’s economy. Additionally, the study found that each registered boat in 2009 contributed on average $9,230 per year in economic activity, and the industry contributed about $1.8 billion to the Gross State Product for Maryland (Lipton 2011).
The role of the Waterway Improvement Fund. Maryland’s Waterway Improvement Fund (WIF) is used to maintain more than 400 public boating facilities and over 250 public navigation channels. This includes shallow water channels that are no longer maintained by the United States Army Corps of Engineers (DNR 2011). The WIF was established in 1965 and is referred to as Maryland’s Waterway Transportation Trust Fund. The Fund finances projects and activities that benefit the general boating public, including:
• establishing and maintaining aids to navigation; • clearing debris and obstructions from waters of the State; • dredging channels and harbors in cooperation with the Army Corps of Engineers; • constructing and maintaining public boating facilities and pump-‐out stations; • developing comprehensive plans for waterway improvements and evaluating water-‐
oriented recreation needs and capacities of Maryland waterways; • acquiring vessels and equipment for marine firefighting, police and medical services; • funding shoreline erosion control projects; • providing boating information and education; and, • supporting boating safety patrols by the Natural Resources Police.
The Waterway Improvement Fund has financed over 4,500 grant projects valued at $300 million that have been used for developing and maintaining over 400 public boating access sites throughout the State. Again, the WIF finances projects and activities that promote, develop and maintain Maryland’s waterways for the boating public. This is important because boater preference studies have demonstrated that these types of services are critical for maintaining boater demand and its associated economic impact in the state. In fact, studies indicate that boating experience, including water quality, safety, and access, are as important if not more important than taxes and fees in influencing boater preferences (see Abeels 2011; Sidman 2009; New Jersey 2008). As a result, the Waterway Improvement Fund is an important resource for the state. Currently however, revenue

Environmental Finance Center Recreational Boating and Fiscal Analysis Study 7 | P a g e
from an excise tax on vessels is the only major source of funding for the WIF and boating projects, and revenues from the tax are shrinking precipitously.
The Department of Natural Resources has estimated that the WIF needs $35 million in total annual revenue attainment in order to meet its needs and fund necessary projects. This number could rise to $41 million in the event that Maryland were compelled to maintain existing federal shallow waterway channels due to a reduction in the U.S. Army Corps of Engineers dredging activities and funding. However, the total revenues to the Fund in fiscal year 2011 were $14.9 million. As a result, the state is unable to finance many projects that are essential for maintaining the boating industry in the state. Revenues for the Waterway Improvement Fund have decreased 50% since FY 2006 (DNR 2011). This is due entirely to a drop in vessel sales and registrations in the state, which followed a trend of decreased registrations regionally.1 Coinciding with this drop in VET revenue was a decision by legislators in Florida to cap their vessel excise tax as a way to increase the number of registered boats in that state. This has led to efforts in Maryland to follow suit and cap its VET to encourage boat sales and registrations.
The impact of Florida’s VET cap. Welfare economics holds that taxes on the exchange of goods and services generally move markets away from their efficient equilibrium, limiting exchange in the taxed good or service and diminishing welfare relative to what would be obtained without the tax (See McClosky, 1982). There are, however, exceptions to this general case. When costs go unpaid in the normal production or consumption of goods or services, a tax equal to that external cost is expected to move the market back to an optimal equilibrium (See Mankiw 2009). Similarly, a tax whose revenue is dedicated to removing constraints on the use of the goods or services being taxed can also generate increases in use and, perhaps, economic welfare.
Maryland’s vessel excise tax (VET) generates revenues that support the state’s Waterway Improvement Fund, which funds projects and services to enhance boating in Maryland’s waters. To the extent that those funded activities generate greater benefits for the boating sector than the cost of the tax, the VET can be thought of as a dedicated tax. This study does not evaluate the relative costs and benefits of the VET.
This study considers the potential for change in VET revenues given a change in the incidence of the tax. As currently configured, the VET is assessed as a fixed percentage (5%) of the value of any boat registered in Maryland (and, not qualifying for an exemption).2 A boat must be registered in Maryland if this is the state where it is primarily used. In
1 Table 1 in Appendix 4 provides a summary of boat registrations in the Mid-‐Atlantic states since 2007. Regionally, boat registrations fell more than 5% from pre-‐recession levels, with Florida experiencing the largest drop at almost 10% from pre-‐recession levels. 2 We use the terms “boat sales” and “boat registrations” interchangeably at times. When referring to the VET, we are concerned with boats that are primarily used in Maryland waters; such boats are required to pay the 5% VET. There are exceptions to the rule, which we describe in various points in the study.

Environmental Finance Center Recreational Boating and Fiscal Analysis Study 8 | P a g e
addition to this one-‐time assessment, there are additional recurrent costs to maintaining this registration, but those costs are small and are not considered here.
It has been proposed that, if a cap were placed on the tax charged on any single vessel, more high value boats might register in the state. The effect of the cap, with respect to incidence, would be to reduce rates for owners of vessels above a certain value, while keeping them constant for owners of boats below that value. Virginia has had a cap on its boat tax for some time and Florida has more recently adopted such a cap. Both of those states register more boats than Maryland. On the other hand, Delaware, which assesses no boat tax, has far fewer boats. And New York, which generally has a higher boat tax than Maryland, has many more boats.
Clearly, other factors beside the tax rate must help to determine where boaters choose to register their boats. Here, we consider a sample of the boaters registering in Maryland and neighboring states with the goal of accounting some of those other factors and separating out from them the importance of tax rates in boaters’ location choices. We then use the findings from that exercise to address the question of whether Maryland could expect greater VET revenues if it set a cap on the tax assessed on higher end boats.
Maryland’s Vessel Excise Tax. Maryland’s vessel excise tax (VET) is a 5% charge assessed on the sale or market value of boats registered in Maryland. Any motorized vessel, which is principally used in Maryland’s waters must be registered in Maryland. A boat that is bought in Maryland but will be registered in any other place does not generate a VET payment to Maryland. Conversely, a boat bought elsewhere but registering in Maryland must have 5% of its value paid to the Maryland Department of Natural Resources (DNR). However, if an analogous tax payment was already made to a different state (i.e., if the boat was formerly registered in that other state), the boat’s owner need only pay any positive difference between the tax paid to the other state and Maryland’s 5% rate. Additionally, the VET is assessed against the boat’s price net of the value of any boat traded-‐in and applied against the purchase.
The VET is the principal source of revenue for Maryland’s Waterway Improvement Fund. The WIF, in turn, is an important source of funding for projects and services that aim to enhance boating opportunities in Maryland’s waters, including maintaining state-‐funded boating facilities and public navigation channels. WIF revenues have fallen significantly over the past six years, largely due to reduced Maryland boat registrations. Registrations of high value boats (those with a purchase price greater than $150,000) account for a significant part of VET revenues, as shown below in Table 1.

Environmental Finance Center Recreational Boating and Fiscal Analysis Study 9 | P a g e
Although the registration of vessels greater than $150,000 in value constitutes a small percentage of the total number of vessels registered, they account for a sizable portion of total VET revenues. While Table 1 does not show the change in annual registrations and VET revenues over the period, one can see that high value vessels have formed a smaller part of both the number of registrations and VET revenues since 2007. That is, given that boat registrations have fallen over the period, high value boat registrations have fallen off more precipitously than boat sales in general.
Two caveats need to be considered in regards to the distribution of boat values and Maryland VET revenues. First, not all boats registering in a year pay a full 5% VET. As noted, if a boat was formerly registered in another state, the tax owing to Maryland is just the positive remainder from the state boat tax paid elsewhere subtracted from MD’s 5% rate. Additionally, boat
dealers receive an exemption from the tax and exchanges in ownership within a family are not taxed.
Over the ten years from 2002 to 2011, the actual tax harvest on boats valued over $150,000 averages 3.68 of their total value, not 5%. About 10% of registrants pay no VET.
The second caveat to bear in mind is that a significant number of boats sold in Maryland are registered elsewhere every year. These boats are not obligated to pay a Maryland VET. However, for such sales boat dealers are required to complete and submit to Maryland DNR a B110 form which provides information about the sale and plans for where the boat is to be registered. The project obtained data from DNR’s Boat Tax Enforcement Unit based on these B110 forms.
The decline in the registrations of both high valued vessels and all registered vessels is shown in Table 2. In 2007, both high value and all registered vessels entering in the year were greater in number and generated greater VET revenue than in 2002. In 2008 and 2009 registrations of both high value and all other vessels dropped considerably.
Table 1: >$150K Vessels as % of All Vessels Registered, 2002 -‐ 2011
Year Annual VET Revenue
Number of Registrations
2002 33.36% 2.47%
2003 32.83% 3.07%
2004 34.20% 3.38%
2005 38.66% 3.34%
2006 35.80% 3.00%
2007 38.88% 3.22%
2008 36.00% 2.59%
2009 33.52% 1.69%
2010 32.41% 1.77%
2011 29.46% 1.69%

Environmental Finance Center Recreational Boating and Fiscal Analysis Study 10 | P a g e
Table 2: Change in VET Revenue and Registrations 2002 to 2011
Year Vessels Over $150,000 Year On Change (%) All Vessels Year On Change (%)
Annual VET Number Annual VET Number Annual VET Number Annual VET Number
2002 $8,804,950 811
$26,397,020 32,770
2003 $9,335,353 946 5.68% 14.27% $28,432,214 30,820 7.16% -‐6.33%
2004 $11,337,920 1,093 17.66% 13.45% $33,151,864 32,311 14.24% 4.61%
2005 $11,942,540 1,043 5.06% -‐4.79% $30,894,208 31,230 -‐7.31% -‐3.46%
2006 $10,411,413 915 -‐14.71% -‐13.99% $29,078,761 30,498 -‐6.24% -‐2.40%
2007 $10,741,376 940 3.07% 2.66% $27,626,548 29,179 -‐5.26% -‐4.52%
2008 $7,384,002 635 -‐45.47% -‐48.03% $20,513,641 24,516 -‐34.67% -‐19.02%
2009 $4,744,446 393 -‐55.63% -‐61.58% $14,152,085 23,283 -‐44.95% -‐5.30%
2010 $4,556,885 418 -‐4.12% 5.98% $14,059,711 23,676 -‐0.66% 1.66%
2011 $4,196,787 388 -‐8.58% -‐7.73% $14,246,396 22,909 1.31% -‐3.35%
While Maryland B110 boat sales do not generate any VET revenue, they do boost economic activity in the state by providing income to boat dealers and business for boatyards, marinas, and boat-‐moving concerns, among others. Table 3 reports the number of such sales in the greater than $150,000 class for the past three years and 2012 to date (12/17/12) and imputed VET foregone, measured as 5% times the purchase price net of trade-‐ins. Table 3 also provides a comparison between selected B110 sales and vessel registrations in Maryland of boats with a value greater than $150,000.
Table 3: B110 >$150K Boat Sales Compared with MD Registrations
Non-‐VET Boat Sales >$150K As a % of Boat Reg. >$150K
Year # Sales (Imputed VET ) #Registrations VET
2009 171 $3,224,446 43.51% 67.96%
2010 177 $3,067,448 42.34% 67.31%
2011 156 $2,504,904 40.21% 59.69%
2012 125 $2,234,410 39.94% 57.99%

Environmental Finance Center Recreational Boating and Fiscal Analysis Study 11 | P a g e
Clearly, B110 boat sales in Maryland constitute a significant share of registered boat sales in the greater than $150,000 category. If we think of the ratio of VET foregone to actual registrations annually, the far right column of Table 3 reports the percentage increase that might be expected for this class of boat registrations if the B110 boats had all registered in Maryland. While this is a short series, with only one year prior to the change in Florida’s Vessel Tax3, it appears that over the period, the share of foregone to actual VET revenues represented by B110 sales has shifted downward.
Florida’s Boat Tax Cap. In 2010, Florida introduced a cap on its vessel excise tax at $18,000 per sale. Since its boat tax is 6% of the value of the boat, this cap implies that the registration of a boat of greater than $300,000 in value would enjoy a lower effective tax rate. The rationale for the cap was that it would increase boat tax revenues by lowering the cost for new high value boat buyers to register in Florida and by providing an incentive for high value boats currently registered offshore to be shifted to Florida.
Registering a boat off-‐shore obviates the payment of vessel excise taxes to US states. It is expensive, however, requiring the establishment of a corporation in the country of registration and occasional visits by the vessel to that country. Additionally, states may assess additional “use charges” on boats that are registered offshore. Generally, avoidance of US boat taxes through offshore registration is only financially advantageous for owners of higher valued boats. To the extent that a cap on the tax liability of a vessel would remove this advantage, it might induce owners to move their boat’s registration to Florida. If enough boat owners responded to this inducement, and if the cap were set appropriately, then new registrations might compensate for the loss in revenue from individual high value boat sales/registrations.
According to a study sponsored by the Florida Yacht Brokers Association and the Marine Industries Association of South Florida, Florida’s boat tax cap brought in enough additional registrations and sales to generate an additional $13.46 million in direct tax revenue to the state.4 While those estimates are imputed from data that are not readily available, it is clear from data published on-‐line by Florida’s tax authorities5 that the decline in their boat tax revenues seemed to moderate after the cap was instituted. In 2011, annual boat tax revenues actually increased, rising to over 95% of their 2008-‐2009 value. Still, Florida’s boat tax revenues that year were only a fraction (42.56%) of their 2005 high. Notably, even without a tax cap, the decline in VET revenues in Maryland has stabilized over the past few years and in 2011 revenues were 42.97% of their 2004 high.
It is beyond the scope of this study to evaluate the apparent stabilization of Florida’s boat tax revenues with respect to causes. The extent to which this may be due to increased sales
3 As will be discussed, in 2010 Florida capped its 6% vessel tax at $18,000, effectively lowering the tax rate for boats with a value in excess of $300,000. 4 http://www.tradeonlytoday.com/home/518978-‐study-‐touts-‐success-‐of-‐florida-‐boat-‐tax-‐cap 5 http://dor.myflorida.com/dor/taxes/colls_from_7_2003.html, accessed, December 26th, 2012.

Environmental Finance Center Recreational Boating and Fiscal Analysis Study 12 | P a g e
or registrations of higher value boats and the degree to which any such increases were generated by either new sales or by registrations of boats formerly registered offshore requires data which are not readily available. If the stabilization of boat tax revenues is due to an increase in new high valued boat sales registering in Florida, the state might expect to derive benefit for some time. If, on the other hand, it derives from the registration of boats that were formerly registered off-‐shore, its effect might dwindle with the pool of existing offshore registered boats.
Florida’s apparent success with its boat tax cap has obvious relevance to Maryland’s search for a solution to its problem of declining WIF revenues. While Maryland’s boating opportunities are significantly different than Florida’s, there is still some prospect that what worked in Florida might work in Maryland. For a tax cap to generate increased WIF revenue, there would need to be a significant increase in registrations in Maryland. We address this possibility, below.
Increasing MD’s VET Revenues with a Tax Cap. A cap on Maryland’s VET will be relevant to boats that would have born a higher tax in the absence of the cap. These are higher valued boats, wherever one chooses to draw that line. Table 1, above, shows that over the past 10 years a relatively small number of registrations of boats valued at $150,000 or higher have accounted for between 39% and 29% of annual VET revenues. One might also set the value of a high value boat at $200,000 (the price at which MD’s VET would cap if it were set at $10,000) or at $360,000 (the price at which MD’s VET would equal Florida’s tax cap of $18,000). Annual Maryland registrations at the $150,000 level and each of these two alternative definitions for “high valued boats” are shown in Table 4.

Environmental Finance Center Recreational Boating and Fiscal Analysis Study 13 | P a g e
Table 4: Maryland VET, 2002 to 2011 by High Value Class with Cap Implications
Boats >150,000 Boats >$200,000 Boats> $360,000
Year VET # Reg. VET # Reg. VET # Reg.
2002 $8,804,950 812 $6,810,013 493 $3,234,732 150
2003 $9,335,353 946 $6,986,187 574 $3,031,706 161
2004 $11,337,920 1094 $8,640,444 692 $4,207,477 233
2005 $11,942,540 1043 $9,487,957 684 $5,077,058 245
2006 $10,411,413 915 $8,321,847 605 $4,388,543 212
2007 $10,741,376 940 $8,398,804 607 $4,512,038 216
2008 $7,384,002 635 $5,781,836 405 $3,285,870 151
2009 $4,744,446 393 $3,781,616 247 $2,007,094 85
2010 $4,556,885 418 $3,571,142 280 $1,619,600 85
2011 $4,196,787 388 $3,125,988 231 $1,541,937 74
Ten Year Average $8,345,567 758 $6,490,583 482 $3,290,605 161
2011 Shortfall with Cap
$1,286,787 172 $815,988 82 $209,937 12
10 Yr Average Shortfall $2,660,567 355 $1,672,583 167 $389,005 22
This distribution of past registrations can be used to evaluate the effect of different valued tax caps on VET revenues. If the VET on the 388 registrations of boats valued at $150,000 and above in 2011 had been capped at $7,500, then the VET harvest would have been $1.3 million less and would have required another 172 registrations to be brought back to its pre-‐cap level. If one believes that the 10-‐year average of annual registrations is the more appropriate estimator, then the VET shortfall and the number of additional sales needed to generate equivalent revenue increases considerably. The VET shortfall is the value of the transfer to boat buyers and dealers.
Under the assumption that tax costs bear on boaters’ decision about where to register, an appraisal of the revenue effects of a cap on pre-‐cap registrations only tells us what would need to be achieved to maintain revenue neutrality; not what to expect. What we would like to know is the likelihood that the number of registrations in the presence of a cap would increase enough to compensate for the loss in VET revenues. One way to evaluate this likelihood is to consider the individual decisions being made by boaters at existing costs and conditions.

Environmental Finance Center Recreational Boating and Fiscal Analysis Study 14 | P a g e
A Discrete Choice Model for High Value Boat Registrations in Maryland. In order to evaluate the effect of tax costs on boater location choice, we need to know the important factors that go into a boat owner’s decision about where to register his boat and how those factors affect the decisions of different boaters. We know from a review of Maryland’s boater registration data that residents of Pennsylvania and Virginia (and, other states) sometimes register in Maryland. And we know from Maryland boat sales data that Maryland residents sometimes register a boat somewhere other than Maryland. By these revealed preferences, we can infer that boat owners sometimes prefer a state other than their state of residence as a place to register their boat.
While some of the factors that help to determine a boater’s registration decision are particular to that boater, there are common decision factors that affect most if not all boaters’ choices about where to keep their boat. These include: the convenience of getting to the boat to use it, the boating opportunities availed by registering it in a particular place, and the relative costs of registering it in one state as opposed to another.
Although we cannot undertake a basic measurement of the utility that a boater derives from registering in a specific state, we can infer from his choice that his expected utility from registering it where he does is greater than his expected utility from registering it elsewhere.
The Data. We are trying to answer a question about the likely change in demand for registering high valued boats in Maryland given a change in the taxes assessed against such boats. In this we are interested in the set of boat owners and potential boat owners who might register their high value boat in Maryland. In particular, we would like to know them by such characteristics as where they live and where they register their boat.
The project procured from DNR’s Boat Tax Enforcement Unit an 11-‐year record of those who actually have registered high valued boats in Maryland.6 This set is incomplete in not capturing those boats bought and sold over this same period that were not registered in Maryland.7 These latter boat owners are clearly of interest to our question.8
In an earlier study of boater location choice, Lipton and Hicks (1999) conducted a survey of boaters documented by the US Coast Guard. From that sample frame, survey recipients were selected from states that were shown by Maryland Tax Compliance data to have supplied significant numbers of boaters to Maryland’s boat registry. Respondents were
6 A little more than three fifths of those boat owners were Maryland residents and another 35 % were from specific other states on the eastern seaboard. 7 In fact, we know the number of boats registered in the specific other states over the recent past, but we do not know the number of higher end boats registered. Nor do we know from which state any of those registrants hails. 8 Private transactions between individuals are also not captured in the data; we do not address these transactions in our study.

Environmental Finance Center Recreational Boating and Fiscal Analysis Study 15 | P a g e
assumed to represent a wider population of boaters who might consider registering their boat in Maryland.
The opportunity for a similar survey was precluded by time constraints under the current study. Instead, we use as our sample of the population of those who registered a boat somewhere other than Maryland the set of boaters who bought a boat in Maryland since July of 2008, but registered it elsewhere. That set is captured in Maryland’s B110 forms, completed for any dealer-‐intermediated sale for which the Vessel Excise Tax was not collected by reason of an out-‐of-‐state registration. The project was able to collect data on those sales with reference to pertinent characteristics of the buyers (i.e, what state they were from, where they registered their boat and the price paid for the boat).
This study is therefore conditional on the expectation that the set of boat buyers who made their transaction in Maryland but registered their boat elsewhere is representative of those who bought and registered their boat in some state other than Maryland. While we can find no reason why the set of boat buyers who transacted their sale in Maryland but registered their boat elsewhere is inherently biased, this is clearly an issue that would benefit from further investigation.
In combination with Maryland residents, residents of eight other states on the Eastern Seaboard supplied 97% of Maryland’s high valued boat registrants over the past 11 years. Residents of those same states supplied 59% of the buyers who bought their boat in Maryland but registered it somewhere else over the past four years. Due to the requirements of the model, we limit our consideration of both those who registered in Maryland and those who bought their boat here but registered it elsewhere to residents of Maryland and those states that supplied substantial numbers of residents to Maryland’s boat registry.
In addition to information about the set of boaters whose choice of where to register their boat might include Maryland, our model requires that we know the tax costs that they might face in any of the other states where they might register. Those tax costs have been gathered from each state’s on-‐line tax information sites. The only tax that we consider is one-‐time sales and use or excise taxes analogous to Maryland’s VET. Thus, Virginia’s locally assessed property taxes are not a part of our analysis. In New York, where there is both a state and local component to the sales and use tax on a boat, we have used the rate obtaining in Port Washington, New York.
We also seek some measure of the relative attractiveness to boaters of the different states in our set. If the distance and convenience in getting to the boat did not matter, where might boaters in our targeted population wish to locate? Under the assumption that commercial boating facilities are more likely to locate where people like to boat, we use the concentration of marinas and boat yards in each state as a proxy for that state’s relative attractiveness to boaters.
Length of boating season is another consideration that might influence boater location choice and we approximate that by using for each state the number of months that

Environmental Finance Center Recreational Boating and Fiscal Analysis Study 16 | P a g e
temperatures are high enough to support recreational boating activities. For this we use a 50-‐degree average daily temperature by month as a cut off for comfortable boating. Those measures were gathered from NOAA National Weather Service historical data.
Model Results. Referring back to Table 4, using 2011 VET revenues, we know that implementing a VET cap at $7,500 would require 172 additional boat sales and registrations to make up for the lost revenue, or an additional 355 sales and registrations if using the 10-‐year VET average. A $10,000 cap would require 82 additional sales and registrations at the 2011 VET level, and 167 at the 10-‐year VET average.
Our estimates indicate that at a cap of $7,500 Maryland could expect approximately 92 additional boat sales or registrations, or only 54% of the boats needed to maintain the VET revenues at their 2011 levels. If one were seeking maintenance of a ten-‐year average VET revenue, the cap would only generate 26% of the additional registrations needed. If the cap were set at $10,000, our estimates indicate that only 25 additional boats, or 30% of the boats needed to maintain revenue neutrality at 2011 levels would shift to Maryland. If one sought revenues more in line with the VET’s ten-‐year average, only 15% of the necessary boat sales and registrations needed are expected. In short, the tax cap would not stimulate enough additional sales and registrations to make up for the lost revenue to the Waterway Improvement Fund.
Though our estimates indicate that the Waterway Improvement Fund would lose revenue as a result of a VET cap, there would be additional boat sales and registrations, which would have an economic impact within the state. Using the 2011 Lipton study, we know that each registered boat in Maryland generates an average of $9,023 in economic impact. As a result, a cap at $7,500 would result in an additional $838,056 in annual economic impact due to increased boat sales. A VET cap of $10,000 would result in an additional annual economic impact of $226,000. It is important to note that the Lipton study averages the economic impact over all boats across the state, big and small. It is reasonable to assume that larger boats may have a larger economic impact than that of smaller boats.
Our estimate of the population of potential new Maryland registrants is shown to be inflated for the one state where we can evaluate it (Maryland). In that respect, our estimate of likely additions to Maryland’s boat registry can be thought of as a high-‐end estimate. We also employ generous expectations about the likelihood that boaters in distant states even consider the act of registering their boat in Maryland. Therefore, we feel that our estimates are conservative. With more accurate data concerning the population of potential new boat registrants, we expect the shortfall in needed additional sales and registrations to grow larger.

Environmental Finance Center Recreational Boating and Fiscal Analysis Study 17 | P a g e
Part 3: Alternative WIF Revenue Options As we have indicated above, a cap on the state’s vessel excise tax would result in a reduction in revenues supporting the WIF. However, even in the absence of that proposed cap, the WIF is underfunded and unable to meet the needs of the boating industry. Therefore, in addition to assessing the impact of a cap on the VET, we assessed the potential impacts associated with various revenue alternatives, including establishing a graduated boat registration fee system, registering non-‐powered boats, and transferring marine fuel tax revenues back to the WIF.
Because the VET is a one-‐time fee paid by boat owners, WIF revenues require constant change or additions in boater registrations in order to generate revenues. Therefore, to maintain adequate levels in the Waterway Improvement Fund, there must be about 7.5 to 8% growth in the number of new registrations each year.9 The one-‐time tax revenue system would be appropriate only if the demands on the system were related to investments in new boating infrastructure. However, the demands on the WIF have changed over time. While WIF resources are still used to invest in some new boating infrastructure, the Fund now must also conduct maintenance, upkeep, provide on-‐going boating services, and also respond to changes in other sources of funding such as federal funding and the overall boating economy. Additionally these new revenue demands are happening with greater and wider frequency. As a result, the majority of current WIF revenues are supporting operating expenses.
DNR currently estimates annual capital costs to the Waterway Improvement Fund to be between $21 million -‐ $27 million, depending on changes to federal funding policies (DNR 2011). In addition, the operating budget for the WIF is approximately $14 million annually. Therefore, the capital improvement budget must consist of entirely new revenues. Therefore, the WIF revenues ideally should be a combination of one-‐time taxes (like the VET) supporting capital projects, and annual revenues supporting boating services, annual expenditures, and operations and maintenance. To that end, we assessed a variety of options available to the state.
Increasing the existing boat registration fee. The most straightforward way to meet these new resource demands would be to assess an increased boater registration fee. There are a variety of ways in which an annual registration fee could be assessed. One option available to the state is to keep the current registration structure, but increase the fee and transfer the increased revenue to the WIF. As of December 31, 2010, there were just over 196,000 boats registered in the state of Maryland. If the VET were abolished and replaced with a registration fee, the fee per boat—in addition to the fees already assessed—would be
9 Table 3 in Appendix 4 provides an analysis of the number of new boat registrations per year that it would take to achieve revenue goals. Maintaining existing WIF revenue levels (around $14 million) would require around 300 new boat sales/registrations per year, which represents 2.9% annual growth. To achieve $41 million, more than 800 new boat sales/registrations are required, which represents around 8% annual growth.

Environmental Finance Center Recreational Boating and Fiscal Analysis Study 18 | P a g e
approximately $209 per year.10 When analyzed in more detail, the per-‐boat costs for each component of the total WIF expenditures are:
• $107.13 per registered boat for Maryland boating related projects and services; • $71.42 per registered boat for the operating budget for Maryland Statewide Boating
Services; and, • $30.61 per registered boat for potential dredging costs due to a lack of dredging of
federal channels by the U.S. Army Corps of Engineers.11
If a registration fee were used to supplement the VET rather than replace it, the total cost per boat—again, in addition to the fees already assessed—would be approximately $133 per year.12
There is some logic to this basic uniform fee approach. First, it would be relatively easy to administer, thereby reducing program administration and transaction costs. There is also justification for increasing the fee. Specifically, the fee has not been properly adjusted for inflation. If the registration fee were adjusted to 2012 dollars, the impact could be significant. For example, when adjusting for inflation to 2012 dollars, the cost of a certificate of title would increase to $14.62 annually, and the cost of a certificate of number would increase to $55.47. When applied to the estimated 196,000 registered boats in the state, it results in inflation-‐adjusted revenue of about $10.8 million.13
Implementing a graduated boat registration fee. Of course, a standardized boating fee does not account for the relative differences in resource needs and costs associated with different boats. One way to account for these presumed differences is to assess a fee based on the size of the boat. It is estimated that there is a total length of registered boats in Maryland of approximately 3.9 million feet. Assuming $41 million in WIF resource needs, the assessment per foot would be approximately $10. Therefore, a 10 foot boat would be assessed an increased annual fee of $100, a 20 foot boat would be assessed $200, and so on. If a per-‐foot fee were assessed as a means to supplement the VET, then the assessed fee per foot would be between $5.38 and $6.92, which would raise between $21 million and $28 million annually.
Though a per-‐foot fee would be relatively equitable and progressive, assessing a fee in this manner would most likely result in high administrative and transaction costs. Therefore, a more efficient system would be to assess fees based on boat size category. To that end, DNR officials recently proposed legislation that would increase annual boat registration fees
10 This assumes annual revenue needs of $41 million. 11 If the dredging costs are only assigned to larger boats such as those boats greater than 26 feet, the cost per boat is $198.41. If assigned only to registered boats greater than 40’, the cost per boat would be $1,407.13 (based on 4,264 registered boats of this length). 12 This assumes annual revenue needs of $41 million less VET revenues of $15 million. 13 See Table 2 in Appendix 4.

Environmental Finance Center Recreational Boating and Fiscal Analysis Study 19 | P a g e
in an attempt to make up the lost revenue to the WIF. Currently, the biannual fee for registering a boat in Maryland is $24, which generates around $2.3 million annually.14
Under House Bill 1307, which was proposed in the 2011 Maryland General Assembly, the fee for a vessel under 16 feet would go remain at $25 every two years; the fee for a boat 16-‐21 feet would be $50; the fee for a vessel 21-‐32 feet would be $75; 32-‐45 feet would be $100; 45-‐65 feet would be $200; and 65-‐feet-‐plus would be $300. The proposed fee changes were contained in House Bill 1307, which was introduced in the 2012 Maryland General Assembly. Had the bill become law, it would have increased revenues to the WIF by almost $9.5 million annually. These increased revenues would cover around 35 – 45% of the existing revenue shortfall in the WIF.
A graduated fee system is often used by other states to generate boating service revenue. Table 5 shows the rates of six other jurisdictions in the mid-‐Atlantic region. Maryland’s proposed fee would certainly put it in the upper end of the range, though not as high as Connecticut.
Table 5: Graduated Boat Fees in the Mid-‐Atlantic Region
Minimum Maximum
DC $15 $60
Pennsylvania $26 $52
Virginia $27 $45
Delaware $10 $60
New Jersey $12 $250
Connecticut $7 $525
Maryland (proposed) $12 $300
Registering non-‐motorized boats. DNR has also proposed requiring registration or “use” decals on non-‐motorized boats such as kayaks, canoes, and certain sailboats. Assuming a $5 annual fee (currently paid biannually) this would raise around $285,000. Given that kayak, canoe, and sailboat owners benefit from infrastructure projects, as well as ongoing services provided by the WIF, it’s reasonable to expect them to pay additional fees. Were these boat owners assessed a fee at the same level as the smallest boats in the graduated fee
14 Soper, S.J. “DNR Scales Back Boat Registration Fee Proposal.” The Dispatch. March 23, 2012. http://www.mdcoastdispatch.com/articles/2012/03/23/Top-‐Stories/DNR-‐Scales-‐Back-‐Boat-‐Registration-‐Fee-‐Proposal.
Environmental Finance Center Recreational Boating and Fiscal Analysis Study 20 | P a g e
system, or $25 every two years, it would generate more than $700,000 per year.15
Reallocating the Fuel Tax Revenue to the WIF. Historically, there were two sources of revenues for the Waterway Improvement Fund, the 5% vessel excise tax and 0.3% of the State Motor Fuel Tax. However, since FY2009, the WIF no longer receives the 0.3% distribution from the State’s Net Motor Fuel Tax Revenue. Though this revenue represents only about 12% -‐15% of the 2011 VET revenue, it is nonetheless an important potential resource that could help address annual costs associated with the Waterway Improvement Fund. The distribution reflected a rough estimate of net taxes collected from fuel sold at marinas. From FY2000 until FY2008, the revenue to the WIF from the 0.3% distribution from the State’s Net Motor Fuel Tax ranged from $1.471 million to $1,722 million respectively. Applying the historical transfer rate of 0.3% indicates that had the source been available, the WIF would receive annually about $1.65 to $1.7 million in additional revenue.
Conclusion. Clearly there is no single solution that will enable State leaders to capitalize the WIF to levels necessary to meet all the demands on the program. However, there are ways that revenue flows can be augmented and brought more in line with the types of projects and services needed. Most importantly, it is essential for State leaders to identify annual sources of revenue, such as boater registration fees, that are better suited to address ongoing maintenance and service programs. By doing so, DNR can use VET revenues to support capital infrastructure projects and programs. This is a more appropriate use of one-‐time taxes and fees like the VET.
15 Licensing non-‐motorized boats would also generate additional federal funds to Maryland. The Fishing and Recreational Boating Safety Act of 2005 (Subtitle A, Title X, Public Law 109-‐59) created the Sport Fish Restoration and Boating Fund Account, which transfers funds to states based on the number of vessels registered. For fiscal year 2013 this equates to roughly $3 per hull.
Environmental Finance Center Recreational Boating and Fiscal Analysis Study 21 | P a g e
Part 4: Conclusion The study outlined in this report demonstrated that though currently an imperfect revenue tool, capping Maryland’s vessel excise tax would have very detrimental impacts on the state’s Waterway Improvement Fund. The Fund is an important tool that is essential for maintaining the state’s boating infrastructure, and with current revenues at a fraction of what is needed to support boating services and infrastructure across the state, it does not seem prudent to implement policies that would reduce those revenues even further.
The impact of capping the VET in Maryland. Coinciding with a drop in VET revenue over the past 8 years was a decision by Florida to cap their vessel excise tax as a way to increase the number of registered boats in that state. This has led to efforts in Maryland to follow suit and cap its VET to encourage boat sales and registrations. Our goal with this study was to estimate the likely revenue effect of a cap on Maryland’s vessel excise tax (VET) by looking at boats registering in prior years, cap the tax harvest at whatever level is of interest and then take the difference between actual tax revenue and revenue after the tax cap. That number divided by the amount of the tax will tell you how many additional boat registrations are needed in order to maintain VET revenue at the pre-‐tax level. This provided an estimate for what would need to happen; we then developed a demand model to predict what will happen.
To understand what might happen with a tax cap, we developed a model based on four years of data composed of both Maryland boat registrations and boats bought in Maryland but registered elsewhere. Our data set is limited to boats with a value of more than $150,000 and registered by owners who live in either Maryland or one of eight other states that contribute the vast majority of boats to Maryland’s boat registry. Our estimation is based on expectations about the influence of factors specific to both the individuals who own the boat and who make decisions about where to register it and to each state where the boat might be registered.
Our estimates indicate that at a VET cap of $7,500, Maryland could expect approximately 92 additional boat sales or registrations, or only 54% of the boats needed to maintain the VET revenues at their 2011 levels. If one were seeking to maintain a ten-‐year average VET revenue, the cap would only generate 26 % of the additional registrations needed. If the cap were set at $10,000, as has been proposed in Senate Bill 90, our estimates indicate that only 25 additional boats, or 30% of the boats needed to maintain revenue neutrality at 2011 levels would shift to Maryland. To maintain the VET’s ten-‐year average, only 15% of the boats needed are expected. In short, the tax cap would not stimulate enough additional sales and registrations to make up for the lost revenue to the Waterway Improvement Fund.
Economic Impact. Though our estimates indicate that the Waterway Improvement Fund would lose revenue as a result of a VET cap, there would be additional boat sales and registrations, which would have an economic impact within the state. Using the 2011 Lipton study, we know that each registered boat in Maryland generates an average of
Environmental Finance Center Recreational Boating and Fiscal Analysis Study 22 | P a g e
$9,023 in economic impact. As a result, a cap at $7,500 would result in an additional $838,056 in annual economic impact due to increased boat sales. A VET cap of $10,000 would result in an additional annual economic impact of $226,000. It is important to note that the Lipton study averages the economic impact over all boats across the state, big and small. It is reasonable to assume that larger boats, which are the focus of this study, may have a larger economic impact.
Alternative WIF revenue options. Because the VET is a one-‐time fee paid by boat owners, WIF revenues require constant change or additions in boater registrations in order to generate revenues. Therefore, to maintain desired revenue levels in the Waterway Improvement Fund, there must be about 7.5% to 8% growth in the number of new registrations each year. WIF revenues ideally should be a combination of one-‐time taxes (like the VET) supporting capital projects, and annual revenues supporting boating services, annual expenditures, and operations and maintenance. To that end, we assessed a variety of options available to the state.
Though it is unlikely that any single revenue tool will be able to generate sufficient revenues to fully capitalize the Waterway Improvement Fund, there are reasonable approaches that can be taken by state leaders to generate additional revenues. The most efficient and effective way to supplement the VET would be to assess adequate boater registration fees on all registered boats in the state. Implementing a graduated fee structure based on size of boats would put Maryland in line with other mid-‐Atlantic states; implementing the fee rates proposed by Maryland DNR last year in HB 1307 would result in additional revenues to the state of $7.5 million.
Environmental Finance Center Recreational Boating and Fiscal Analysis Study 23 | P a g e
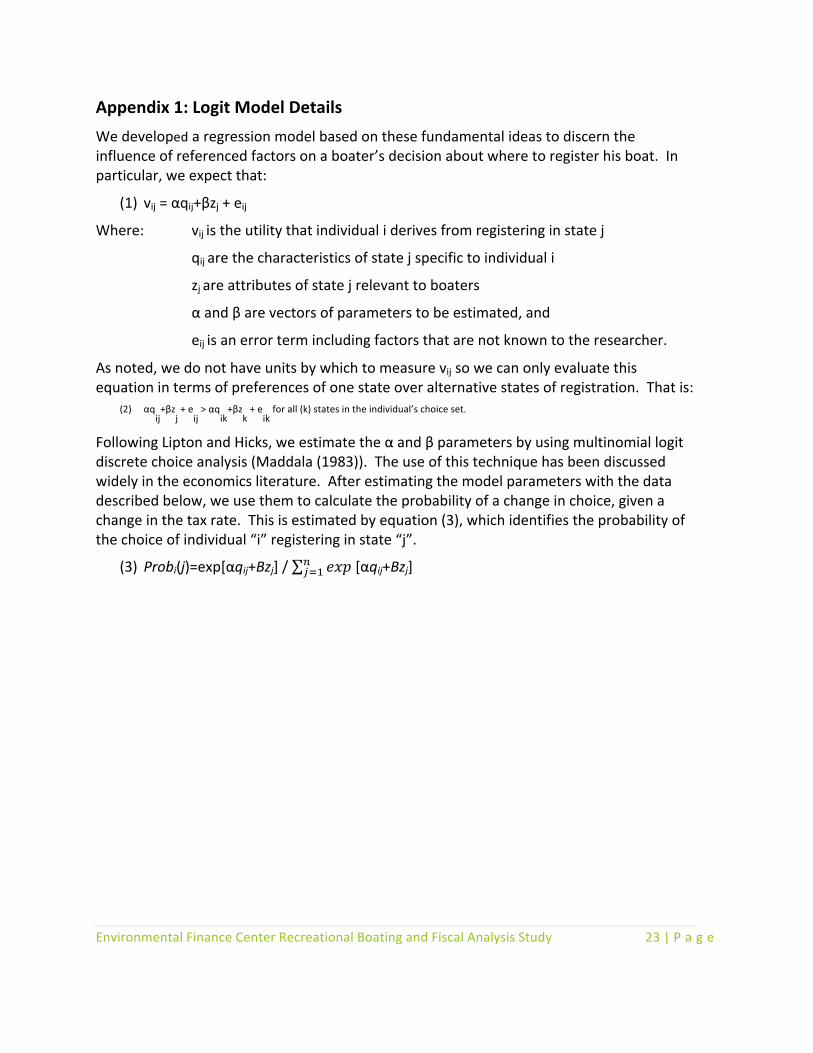
Appendix 1: Logit Model Details We developed a regression model based on these fundamental ideas to discern the influence of referenced factors on a boater’s decision about where to register his boat. In particular, we expect that:
(1) vij = αqij+βzj + eij
Where: vij is the utility that individual i derives from registering in state j
qij are the characteristics of state j specific to individual i
zj are attributes of state j relevant to boaters
α and β are vectors of parameters to be estimated, and
eij is an error term including factors that are not known to the researcher.
As noted, we do not have units by which to measure vij so we can only evaluate this equation in terms of preferences of one state over alternative states of registration. That is:
(2) αqij+βz
j + e
ij > αq
ik+βz
k + e
ik for all (k) states in the individual’s choice set.
Following Lipton and Hicks, we estimate the α and β parameters by using multinomial logit discrete choice analysis (Maddala (1983)). The use of this technique has been discussed widely in the economics literature. After estimating the model parameters with the data described below, we use them to calculate the probability of a change in choice, given a change in the tax rate. This is estimated by equation (3), which identifies the probability of the choice of individual “i” registering in state “j”.
(3) Probi(j)=exp[αqij+Bzj] / 𝑒𝑥𝑝!!!! [αqij+Bzj]
Environmental Finance Center Recreational Boating and Fiscal Analysis Study 24 | P a g e
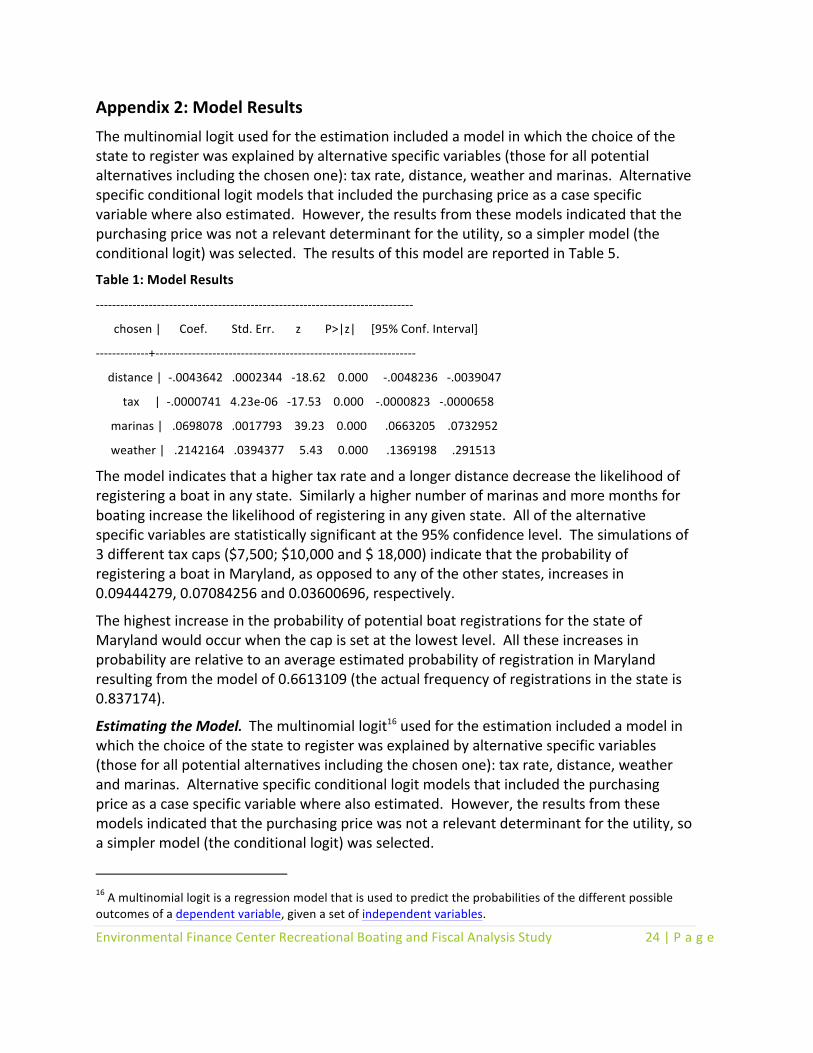
Appendix 2: Model Results The multinomial logit used for the estimation included a model in which the choice of the state to register was explained by alternative specific variables (those for all potential alternatives including the chosen one): tax rate, distance, weather and marinas. Alternative specific conditional logit models that included the purchasing price as a case specific variable where also estimated. However, the results from these models indicated that the purchasing price was not a relevant determinant for the utility, so a simpler model (the conditional logit) was selected. The results of this model are reported in Table 5.
Table 1: Model Results
-‐-‐-‐-‐-‐-‐-‐-‐-‐-‐-‐-‐-‐-‐-‐-‐-‐-‐-‐-‐-‐-‐-‐-‐-‐-‐-‐-‐-‐-‐-‐-‐-‐-‐-‐-‐-‐-‐-‐-‐-‐-‐-‐-‐-‐-‐-‐-‐-‐-‐-‐-‐-‐-‐-‐-‐-‐-‐-‐-‐-‐-‐-‐-‐-‐-‐-‐-‐-‐-‐-‐-‐-‐-‐-‐-‐-‐-‐
chosen | Coef. Std. Err. z P>|z| [95% Conf. Interval]
-‐-‐-‐-‐-‐-‐-‐-‐-‐-‐-‐-‐-‐+-‐-‐-‐-‐-‐-‐-‐-‐-‐-‐-‐-‐-‐-‐-‐-‐-‐-‐-‐-‐-‐-‐-‐-‐-‐-‐-‐-‐-‐-‐-‐-‐-‐-‐-‐-‐-‐-‐-‐-‐-‐-‐-‐-‐-‐-‐-‐-‐-‐-‐-‐-‐-‐-‐-‐-‐-‐-‐-‐-‐-‐-‐-‐-‐
distance | -‐.0043642 .0002344 -‐18.62 0.000 -‐.0048236 -‐.0039047
tax | -‐.0000741 4.23e-‐06 -‐17.53 0.000 -‐.0000823 -‐.0000658
marinas | .0698078 .0017793 39.23 0.000 .0663205 .0732952
weather | .2142164 .0394377 5.43 0.000 .1369198 .291513
The model indicates that a higher tax rate and a longer distance decrease the likelihood of registering a boat in any state. Similarly a higher number of marinas and more months for boating increase the likelihood of registering in any given state. All of the alternative specific variables are statistically significant at the 95% confidence level. The simulations of 3 different tax caps ($7,500; $10,000 and $ 18,000) indicate that the probability of registering a boat in Maryland, as opposed to any of the other states, increases in 0.09444279, 0.07084256 and 0.03600696, respectively.
The highest increase in the probability of potential boat registrations for the state of Maryland would occur when the cap is set at the lowest level. All these increases in probability are relative to an average estimated probability of registration in Maryland resulting from the model of 0.6613109 (the actual frequency of registrations in the state is 0.837174).
Estimating the Model. The multinomial logit16 used for the estimation included a model in which the choice of the state to register was explained by alternative specific variables (those for all potential alternatives including the chosen one): tax rate, distance, weather and marinas. Alternative specific conditional logit models that included the purchasing price as a case specific variable where also estimated. However, the results from these models indicated that the purchasing price was not a relevant determinant for the utility, so a simpler model (the conditional logit) was selected.
16 A multinomial logit is a regression model that is used to predict the probabilities of the different possible outcomes of a dependent variable, given a set of independent variables.

Environmental Finance Center Recreational Boating and Fiscal Analysis Study 25 | P a g e
The high probability of registering in Maryland is in part a function of our data set, which contains a preponderance of boats registered in Maryland over the past four years. As a result, the interpretation of results focuses on the likelihood of buyers of boats in Maryland to register in this state given their state characteristics. The extension of this model to an interpretation about registering boats in any state should be used with caution as it is an approximation affected by the sample used (i.e. a sample of purchases made in Maryland). Nevertheless, given that this was the best data available at the time of this study we employ such an approximation. To test the accuracy of our estimates, checks on the model parameters have been conducted in alternative runs without the state of Maryland registrants and those runs indicate that the state variables have similar influences.
The data used to estimate the model are drawn from July of 2008 to the present and, mindful of the caveats described above, we treat this sample as representative of boats registered in each of the states over a similar period. While we do not have direct estimates for boats valued at $150,000 or more registered in each of the states over this period, we do know boats registered by year by length17 in each of the regions that include the states in the set. We apportion those registrations to individual states in equal proportion to each state’s share of Coast Guard documented vessels greater than 41 feet in length18 for their respective region and use this to estimate their share of relevant regional registrants in each of the 8 alternative states.
A crucial expectation of our model is that the sample represents boaters who would consider registering a boat in Maryland. If this choice is not considered by a boater, then they are not in the set of prospective new registrants. Lipton and Hicks (1999) found that almost half of the boat owners in their sample did not consider registering their boat in a state other than their state of residence. While that sample targeted boat owners in the Mid-‐Atlantic States plus New Jersey, we adopt that same proportion for those same states plus New York, North Carolina and Florida. Thus, we reduce our estimates for new registrations of boats greater than 41 feet in length over the past four years in the relevant states by 50 %.
17 NMMA, 2012 18 This estimate is imperfect in that it generates a far larger number of registrations of greater than $150,000 boats in Maryland over the period than shown by the Maryland VET dataset. It should therefore be treated as an upper bound on the population of interest.

Environmental Finance Center Recreational Boating and Fiscal Analysis Study 26 | P a g e
Appendix 3: Bibliography Abeels, H. (2011). Brevard County Recreational Boating Characterization Study Who's Boating in Our Waters and What Are They Doing?
Business, H. (2012). Marina Industry Business Report. Retrieved January 05, 2013, from http://business.highbeam.com/industry-‐reports/transportation/marinas
Clarke, W. e. (2008). The Estimated Econoic Impact of Reduced Recreational Boating Due to a Deterioration of the Intracoastal Waterway Channel in Georgia.
Clarke, W., Jones, A., Walker, R., & Christian, P. (2008). The Estimated Economic Impact of Reduced Recreational Boating Due to a Deterioration of the Intracoastal Waterway Channel in Georgia.
DNR. (2012). Maryland House Bill 1307 Fact Sheet.
DNR. (2011). Waterway Improvement Capital Program, Benefits, Needs and Opportunities.
Group, S. P. (2012). The Economic Contributions of the Chester River.
Highbeam Business. (2012). Marina Industry Business Report. Retrieved January 05, 2013, from http://business.highbeam.com/industry-‐reports/transportation/marinas
Jersey, M. T. (2008). Recreational Boating in New Jersey: An Economic Impact Analysis.
Lipton. (1998). Boat Location Choice: The Role of Boating Quality and Excise Taxes.
Lipton, D. a. (v. 27). Boat Location Choice: The Role of Boating Quality and Excise Taxes. Coastal Management , 81 -‐ 89.
Lipton, D. (1998). Boat Location Choice: The Role of Boating Quality and Excise Taxes.
Lipton, D. (2007). Economic Impact of Maryland Boating in 2006.
Lipton, D. (2011). Economic Impact of Maryland Boating in 2009.
Lipton, D. (2005). Transient Boating in Maryland:The Economic Impact of Out-‐Of-‐State Boater Spending.
Marine Trades Association of New Jersey. (2008). Recreational Boating in New Jersey: An Economic Impact Analysis.
Moffatt & Nichol. (2010). Delaware River Watershed Corporation Marina Feasibility Study.
Moffatt & Nichol. (2010). Washington D.C. Marina Market Study.
Murray. Assessment of the Economic Impacts of Recreational Boating in Middlesex County, Virginia.
Murray, T. (2011). Assessment of the Economic Impacts of Recreational Boating in Middlesex County, Virginia.
Murray, T. (2009). Assessment of the Economic Impacts of Recreational Boating in the City of Hampton, Virginia.
Nichol, M. &. (2010). Delaware River Watershed Corporation Marina Feasibility Study.
Nichol, M. &. (2010). Washington D.C. Marina Market Study.
Environmental Finance Center Recreational Boating and Fiscal Analysis Study 27 | P a g e
RWMS. (2008). A Regional Waterway Management System for Balancing Recreational Boating and Resource Protections.
Sage Policy Group. (2012). The Economic Contributions of the Chester River.
Sidman, C. e. (2009). A Recreational Boating Characterization for Collier County, Florida.
Sidman, C., Fik, T., Swett, R., Sargent, B., Fann, S., & Fann, D. (2009). A Recreational Boating Characterization for Collier County, Florida.
Swett, R., Listowski, C., Fry, D., Boutelle, S., & Fann, D. (2009). A Regional Waterway Management System for Balancing Recreational Boating and Resource Protections. Environmental Management , 962-‐71.

Environmental Finance Center Recreational Boating and Fiscal Analysis Study 28 | P a g e
Appendix 4: Charts & Tables
Table 1: Boat Registrations from 2007 – 2011 for Atlantic Seaboard States from Rhode Island to Florida (USCG) Chart 1: Percentage Change Per State of Boat Registrations, 2007 – 2011 Table 1 and Chart 1 provide data on boat registrations for eastern seaboard U.S. states from Rhode Island to Florida. In Maryland, from 2007 to 2012, the number of boats registered in Maryland declined by 14,269 or 7.03%. From 2007 to 2012, boat registrations in all of the states declined 5.2% or 174,688 boats. Since 2007, the only states with an increase in registrations are North Carolina (16,571+, 4.46%) and South Carolina (5,705, 1.29%).Excise Tax Rates range from 0% in Rhode Island and Delaware, to a high of 9% in New York. States which have some form of cap on excise taxes are Virginia, North Carolina, South Carolina, and Florida. However, some of these states only apply the cap to boats purchased in state (South Carolina) or some states enable local jurisdictions to access property taxes or other fees (Virginia and Florida). Table 2: Inflation Adjustments to Maryland’s Annual Boating Fees Table 2 derives Inflated Maryland Annual Boating Fees. Applying a rate of inflation to the amount of the fee from the date of last fee change, the inflation adjusted cost of cost of a certificate of number is $55.47. Assessing the cost of a certificate of number to the 196,024 registered boats results in inflation adjusted revenues of about $10.8 Million.
Table 3: Hurdle Points for Value of New Boat Sales or New Boat Registrations to Generate a Certain Level of Excise Tax Revenue at a 5% Excise Tax Rate At an annual WIF budget of $40 Million, the hurdle point for generating WIF revenues solely from excise taxes was derived. For assumption purposes, it is assumed that the only funding of the WIF is generated by excise taxes on new boats or the registration of new boats. Consequently, the entire funding burden is placed on the sale of new boats and the replacement of existing boats or the growth of the market. As has been shown, recreational boating sales can be driven by macro factors such as population, economic, GDP growth, and the boat financing and credit markets. Assuming a 5% excise tax rate and a WIF annual need of $40 Million, the hurdle point to generate tax revenue is an equivalent value equal to the sale or new registration of $800 Million in recreational boat value. This equates to an annual replacement rate or market growth rate of roughly 7.5 – 8% using the estimated total registered boats price of about $10.8 Billion. The total price of registered boats is derived by assigning an average vessel for each size category of boats. Then the average price is applied to the number of registered vessels in the category to derive a total category price. The category prices are added together to come to a total price of registered boats in Maryland of about $10.26 Billion.
Table 4: Estimated Amount Available for Distribution to WIF at a 0.3% Historical WIF Distribution Rate from the Net Motor Fuel Tax Revenue for the Periods FY 2009 – FY 2012

29 | P a g e
Table 1: Boat Registrations from 2007 – 2011 for Atlantic Seaboard States from Rhode Island to Florida (USCG)
2007 2008 2009 2010 2011 2007 -‐ 2011 Change 2007 -‐ 2011 Percentage Change
Rhode Island 43,665 42,524 42,519 45,930 40,989 -‐2676 -‐6.13%
Annual Rate of Change 0.7% -‐2.6% 0.0% 8.0% -‐10.8%
Connecticut 108,539 110,650 109,213 108,078 105,499 -‐3040 -‐2.80%
Annual Rate of Change -‐0.1% 1.9% -‐1.3% -‐1.0% -‐2.4%
New York 494,020 485,541 479,161 475,689 467,828 -‐26192 -‐5.30%
Annual Rate of Change -‐0.8% -‐1.7% -‐1.3% -‐0.7% -‐1.7%
New Jersey 183,147 185,359 173,994 169,750 166,037 -‐17110 -‐9.34%
Annual Rate of Change -‐11.1% 1.2% -‐6.1% -‐2.4% -‐2.2%
Delaware 61,569 56,669 61,523 62,983 57,687 -‐3882 -‐6.31%
Annual Rate of Change 4.0% -‐8.0% 8.6% 2.4% -‐8.4%
Maryland 202,892 199,087 196,806 193,259 188,623 -‐14269 -‐7.03%
Annual Rate of Change -‐0.7% -‐1.9% -‐1.1% -‐1.8% -‐2.4%
Virginia 251,440 249,312 249,235 245,940 242,473 -‐8967 -‐3.57%
Annual Rate of Change 1.3% -‐0.8% 0.0% -‐1.3% -‐1.4%
North Carolina 375,815 371,879 405,663 400,846 392,566 16751 4.46%
Annual Rate of Change 1.5% -‐1.0% 9.1% -‐1.2% -‐2.1%

Environmental Finance Center Recreational Boating and Fiscal Analysis Study 30 | P a g e
South Carolina 442,040 436,844 435,528 435,491 447,745 5705 1.29%
Annual Rate of Change 1.4% -‐1.2% -‐0.3% 0.0% 2.8%
Georgia 344,597 350,479 352,054 353,950 322,346 -‐22251 -‐6.46%
Annual Rate of Change 2.4% 1.7% 0.4% 0.5% -‐8.9%
Florida 988,652 974,553 949,030 914,535 889,895 -‐98757 -‐9.99%
Annual Rate of Change -‐0.3% -‐1.4% -‐2.6% -‐3.6% -‐2.7%
Total 3,496,376 3,462,897 3,454,726 3,406,451 3,321,688 -‐174688 -‐5.20%
Annual Rate of Change
-‐1.0% -‐0.2% -‐1.4% -‐2.5%

Environmental Finance Center Recreational Boating and Fiscal Analysis Study 31 | P a g e
Chart 1: Percentage Change Per State of Boat Registrations, 2007 – 2011
-‐6.13%
-‐2.80%
-‐5.30%
-‐9.34%
-‐6.31% -‐7.03%
-‐3.57%
4.46%
1.29%
-‐6.46%
-‐9.99%
-‐5.20%
-‐12.00%
-‐10.00%
-‐8.00%
-‐6.00%
-‐4.00%
-‐2.00%
0.00%
2.00%
4.00%
6.00%

Environmental Finance Center Recreational Boating and Fiscal Analysis Study 32 | P a g e
Table 2: Inflation Adjustments to Maryland’s Annual Boating Fees
Cost Year of last adjustment Years Since Last Adjustment Inflation Adjusted 2012 Cost
Cost of a certificate of title for a vessel $2.00 1965 47 $14.62
Cost of a replacement certificate $2.00 1973 39 $10.37
Cost of a certificate of number $24.00 1983 29 $55.47
Cost of a boat manufacturer's or dealer's annual license $25.00 1986 26 $52.51
Source:
http://inflationdata.com/inflation/Inflation_Calculators/Inflation_Calculator.asp
U.S. Bureau of Labor Statistics inflation calculator using average annual Consumer Price indexes for the years range from 1914-‐ Present.

33 | P a g e
Table 3: Hurdle Points for Value of New Boat Sales or New Boat Registrations to Generate a Certain Level of Excise Tax Revenue at a 5%
Excise Tax Rate Excise Tax Rate
Total Value (Millions) of Sales and New Registrations 5.00%
Market Replacement and/or Market Growth
Percentage
$50 $2,500,000 0.49%
$100 $5,000,000 0.97%
$150 $7,500,000 1.46%
$200 $10,000,000 1.95%
$250 $12,500,000 2.44%
$300 $15,000,000 2.92%
$350 $17,500,000 3.41%
$400 $20,000,000 3.90%
$450 $22,500,000 4.39%
$500 $25,000,000 4.87%
$550 $27,500,000 5.36%
$600 $30,000,000 5.85%
$650 $32,500,000 6.34%
$700 $35,000,000 6.82%
$750 $37,500,000 7.31%
$800 $40,000,000 7.80%
$850 $42,500,000 8.28%
$900 $45,000,000 8.77%
$950 $47,500,000 9.26%
$1,000 $50,000,000 9.75%

34 | P a g e
Table 4: Estimated Amount Available for Distribution to WIF at a 0.3% Historical WIF Distribution Rate from the Net Motor Fuel Tax Revenue for the Periods FY 2009 – FY 2012
FY 2005 FY 2006 FY 2007 FY 2008 FY 2009 FY 2010 FY 2011 FY 2012
Past Amounts (000's) Distributed to Waterways Improvement Fund (.3%) from Net Motor Fuel Tax Revenue
$1,716 $1,722 $1,721 $1,722 $0 $0 $0 $0
Net Motor Fuel Tax Revenue Available for Distribution (000's)
$561,552 $555,466 $561,684 $563,970
Estimated Amount (000's) Available for Distribution to WIF at 0.3% Historical WIF Distribution Rate
$1,685 $1,666 $1,685 $1,692