Embed Size (px)
Citation preview
For further information contact: Steven D. McCulloch Phone: (410) 946-5530
Analysis of the FY 2017 Maryland Executive Budget, 2016 1
Maryland Department of Transportation
Fiscal 2017 Budget Overview
Department of Legislative Services
Office of Policy Analysis
Annapolis, Maryland
February 2016
J00 – MDOT – Fiscal 2017 Budget Overview
Analysis of the FY 2017 Maryland Executive Budget, 2016 2
J00
Maryland Department of Transportation Fiscal 2017 Budget Overview
Analysis of the FY 2017 Maryland Executive Budget, 2016 3
Analysis in Brief
Issues
Long-term Federal Surface Transportation Reauthorization Passed: At the end of calendar 2015,
Congress passed, and the President signed, the Fixing America’s Surface Transportation Act of 2015
(FAST Act) providing federal funding levels for surface transportation programs for federal fiscal 2016
through 2020 and establishing new freight funding programs. The Maryland Department of
Transportation should comment on how the funding certainty provided by the FAST Act will
affect capital planning, how it intends to utilize National Highway Freight Program formula
funding, and if and for which project(s) it intends to seek funding under the new Nationally
Significant Freight and Highway Projects discretionary grants program.
Scoring System for Transportation Capital Project Selection Could Ensure Greater Focus on
Economic Benefits: Maryland’s ability to fund its transportation capital program falls short of
identified needs. In addition, current statutory requirements do not ensure that the transportation
projects funded by the State will generate the greatest return on investment in terms of easing
congestion or stimulating economic growth. A priority setting process that uses a cost-benefit analysis
may help the State select transportation projects that yield the greatest benefit possible. The Secretary
should comment on how the greater emphasis on economic outcomes could be incorporated in
development of the Consolidated Transportation Program.
Recommended Actions
1. Add annual budget bill language requiring notification of capital budget changes.
2. Add annual budget bill language establishing a position cap.
3. Adopt committee narrative expressing the intent that the Maryland Department of
Transportation use the five-year average annual increase when forecasting operating expenses.
J00 – MDOT – Fiscal 2017 Budget Overview
Analysis of the FY 2017 Maryland Executive Budget, 2016 4
J00
Maryland Department of Transportation Fiscal 2017 Budget Overview
Analysis of the FY 2017 Maryland Executive Budget, 2016 5
Transportation Trust Fund Overview
The Transportation Trust Fund (TTF) is a nonlapsing special fund that provides funding for
transportation. It consists of tax and fee revenues, operating revenues, bond proceeds, and fund
transfers. The Maryland Department of Transportation (MDOT) issues bonds backed by TTF revenues
and invests the TTF fund balance to generate investment income. The Maryland Transit Administration
(MTA), the Motor Vehicle Administration (MVA), the Maryland Port Administration, and the
Maryland Aviation Administration generate operating revenues that cover a portion of their operating
expenditures.
The tax and fee revenues include motor fuel taxes, rental car sales taxes, titling taxes, vehicle
registration fees, a portion of the corporate income tax, and other miscellaneous motor vehicle fees. A
portion of these revenues are credited to the Gasoline and Motor Vehicle Revenue Account (GMVRA).
Of the revenues deposited into the GMVRA, distributions are made to local jurisdictions and the TTF.
The funds retained by the TTF support the capital program, debt service, and operating costs.
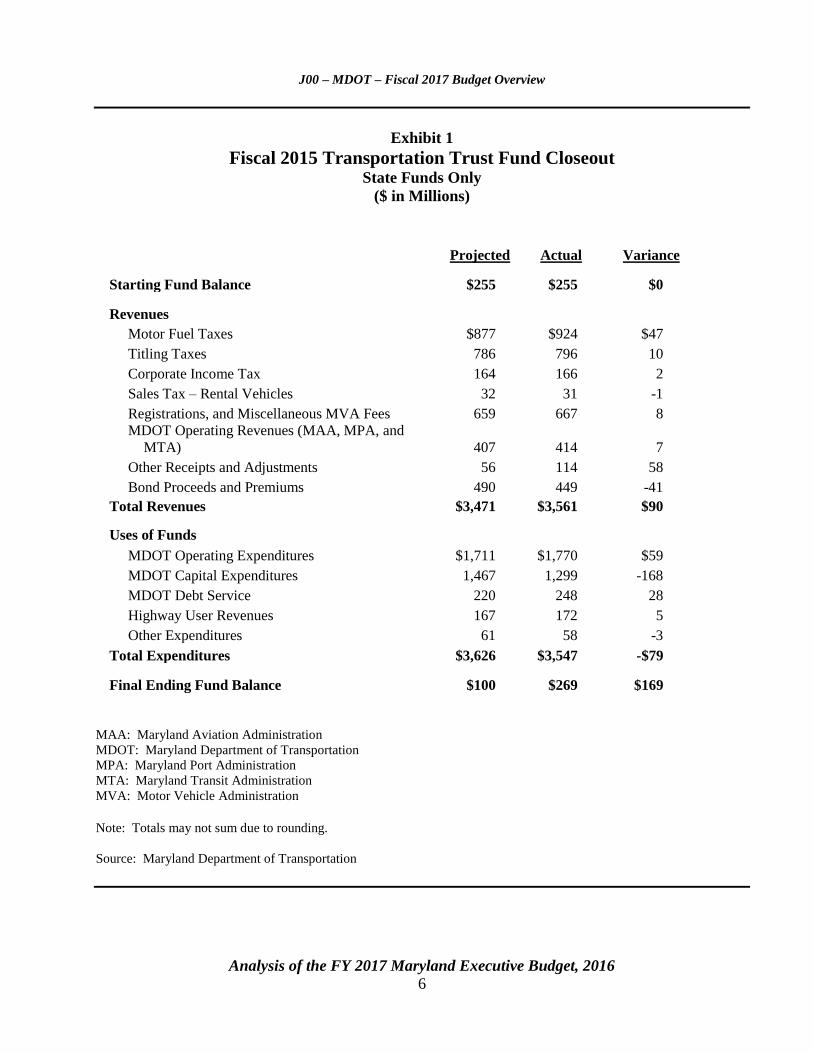
Fiscal 2015 TTF Revenue Closeout
As shown in Exhibit 1, the TTF ended fiscal 2015 with a fund balance of $269 million, an
amount of $169 million higher than the $100 million projected ending balance. The higher fund balance
is the net effect of a lower level of expenditures ($79 million) combined with higher than expected
revenue attainment ($90 million).
Spending was a net of $79 million less than estimated. Increases related to a bond refunding,
winter maintenance, and other department operations were offset by decreased capital spending, the
majority of which was due to suspended spending on the Red and Purple Line transit projects as they
were being reevaluated.
Nonbond-related revenues exceeded projections by a net $131 million. Bond sales were
$89 million below projections reflecting reduced cash flow needs and receipt of $48 million in bond
premiums.
J00 – MDOT – Fiscal 2017 Budget Overview
Analysis of the FY 2017 Maryland Executive Budget, 2016 6
Exhibit 1
Fiscal 2015 Transportation Trust Fund Closeout State Funds Only
($ in Millions)
Projected Actual Variance
Starting Fund Balance $255 $255 $0
Revenues
Motor Fuel Taxes $877 $924 $47
Titling Taxes 786 796 10
Corporate Income Tax 164 166 2
Sales Tax – Rental Vehicles 32 31 -1
Registrations, and Miscellaneous MVA Fees 659 667 8
MDOT Operating Revenues (MAA, MPA, and
MTA) 407 414 7
Other Receipts and Adjustments 56 114 58
Bond Proceeds and Premiums 490 449 -41
Total Revenues $3,471 $3,561 $90
Uses of Funds
MDOT Operating Expenditures $1,711 $1,770 $59
MDOT Capital Expenditures 1,467 1,299 -168
MDOT Debt Service 220 248 28
Highway User Revenues 167 172 5
Other Expenditures 61 58 -3
Total Expenditures $3,626 $3,547 -$79
Final Ending Fund Balance $100 $269 $169
MAA: Maryland Aviation Administration
MDOT: Maryland Department of Transportation
MPA: Maryland Port Administration
MTA: Maryland Transit Administration
MVA: Motor Vehicle Administration
Note: Totals may not sum due to rounding.
Source: Maryland Department of Transportation
J00 – MDOT – Fiscal 2017 Budget Overview
Analysis of the FY 2017 Maryland Executive Budget, 2016 7
Fiscal 2016 Year-to-date Revenue Receipts
Fiscal 2016 attainment for three of the TTF’s largest revenue sources are exceeding projections
based on five-year average attainment rates. With collections recorded through November 2015, motor
fuel tax revenues were $15.1 million higher than expected, motor vehicle titling revenues were
$6.0 million higher, and motor vehicle registration revenues were up by $5.1 million. Should
attainment continue at the level experienced to date, combined collections could exceed estimates by
$74.0 million for all of fiscal 2016.
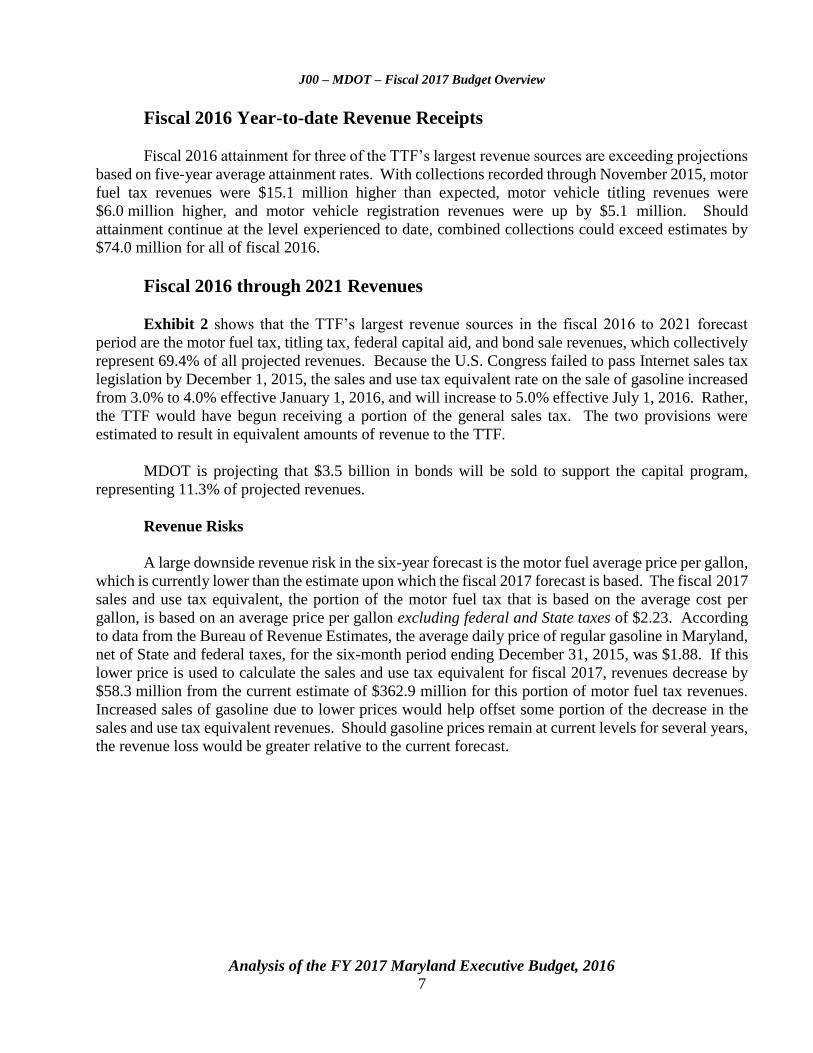
Fiscal 2016 through 2021 Revenues
Exhibit 2 shows that the TTF’s largest revenue sources in the fiscal 2016 to 2021 forecast
period are the motor fuel tax, titling tax, federal capital aid, and bond sale revenues, which collectively
represent 69.4% of all projected revenues. Because the U.S. Congress failed to pass Internet sales tax
legislation by December 1, 2015, the sales and use tax equivalent rate on the sale of gasoline increased
from 3.0% to 4.0% effective January 1, 2016, and will increase to 5.0% effective July 1, 2016. Rather,
the TTF would have begun receiving a portion of the general sales tax. The two provisions were
estimated to result in equivalent amounts of revenue to the TTF.
MDOT is projecting that $3.5 billion in bonds will be sold to support the capital program,
representing 11.3% of projected revenues.
Revenue Risks
A large downside revenue risk in the six-year forecast is the motor fuel average price per gallon,
which is currently lower than the estimate upon which the fiscal 2017 forecast is based. The fiscal 2017
sales and use tax equivalent, the portion of the motor fuel tax that is based on the average cost per
gallon, is based on an average price per gallon excluding federal and State taxes of $2.23. According
to data from the Bureau of Revenue Estimates, the average daily price of regular gasoline in Maryland,
net of State and federal taxes, for the six-month period ending December 31, 2015, was $1.88. If this
lower price is used to calculate the sales and use tax equivalent for fiscal 2017, revenues decrease by
$58.3 million from the current estimate of $362.9 million for this portion of motor fuel tax revenues.
Increased sales of gasoline due to lower prices would help offset some portion of the decrease in the
sales and use tax equivalent revenues. Should gasoline prices remain at current levels for several years,
the revenue loss would be greater relative to the current forecast.

J00 – MDOT – Fiscal 2017 Budget Overview
Analysis of the FY 2017 Maryland Executive Budget, 2016 8
Exhibit 2
Transportation Trust Fund
State-sourced Revenues and Federal Funds Fiscal 2016-2021
($ in Millions)
Total Revenues = $30.6 Billion
MVA: Motor Vehicle Administration
Source: Maryland Department of Transportation, Fiscal 2016-2021 Transportation Trust Fund Forecast
Six-year Transportation Trust Fund Forecast Summary
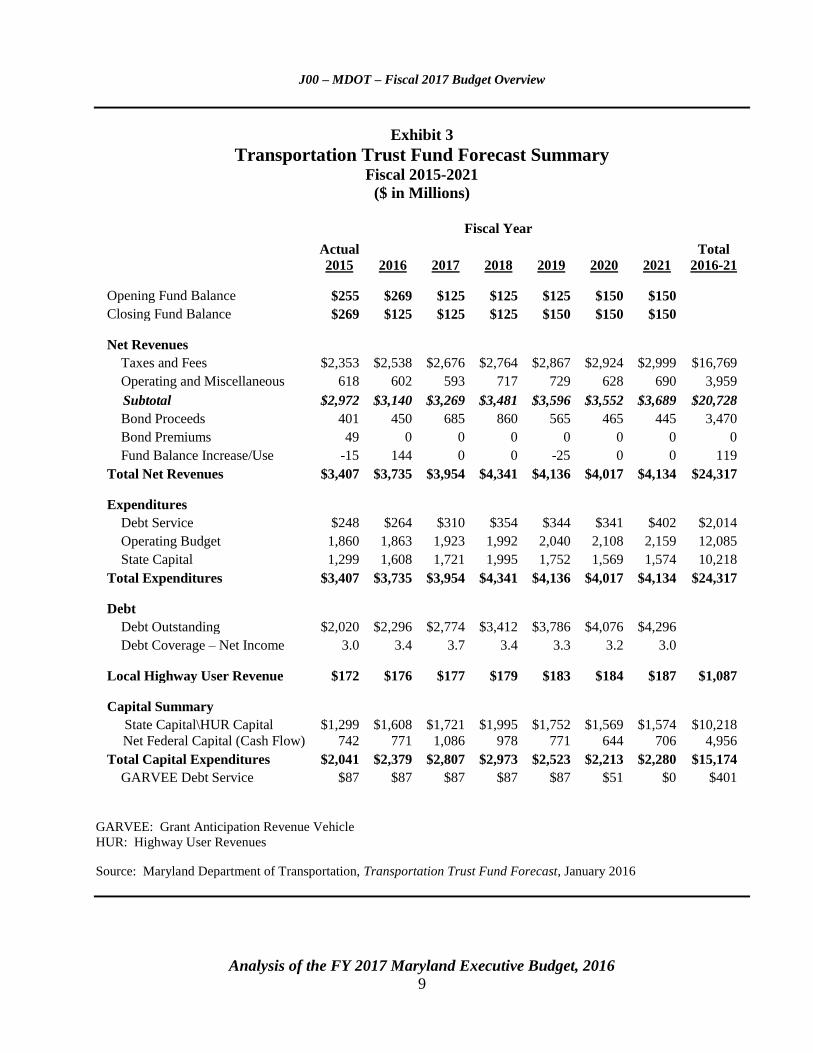
Exhibit 3 shows the TTF forecast summary, including the fiscal 2015 actual and the fiscal 2016
to 2021 projections. It reflects the decision of MDOT to increase the target closing balance from the
$100 million level that it used for many years to $125 million for fiscal 2016 to 2018 and to
$150 million thereafter. The increased fund balance will accommodate working cash-flow
requirements during the year.
Motor Fuel
$7,424
24%
Titling
$5,422
18%
Corporate/Rental Car
$1,258
4%Registration Fees
$2,322
8%
Miscellaneous MVA
Fees
$1,835
6%
Operating
Revenues
$2,851
9%
Federal
Operating/Other
$1,108
4%
Federal Capital
$4,956
16%
Bond Sales
$3,470
11%
J00 – MDOT – Fiscal 2017 Budget Overview
Analysis of the FY 2017 Maryland Executive Budget, 2016 9
Exhibit 3
Transportation Trust Fund Forecast Summary Fiscal 2015-2021
($ in Millions)
Fiscal Year
Actual
2015 2016 2017 2018 2019 2020 2021
Total
2016-21
Opening Fund Balance $255 $269 $125 $125 $125 $150 $150
Closing Fund Balance $269 $125 $125 $125 $150 $150 $150
Net Revenues
Taxes and Fees $2,353 $2,538 $2,676 $2,764 $2,867 $2,924 $2,999 $16,769
Operating and Miscellaneous 618 602 593 717 729 628 690 3,959
Subtotal $2,972 $3,140 $3,269 $3,481 $3,596 $3,552 $3,689 $20,728
Bond Proceeds 401 450 685 860 565 465 445 3,470
Bond Premiums 49 0 0 0 0 0 0 0
Fund Balance Increase/Use -15 144 0 0 -25 0 0 119
Total Net Revenues $3,407 $3,735 $3,954 $4,341 $4,136 $4,017 $4,134 $24,317
Expenditures
Debt Service $248 $264 $310 $354 $344 $341 $402 $2,014
Operating Budget 1,860 1,863 1,923 1,992 2,040 2,108 2,159 12,085
State Capital 1,299 1,608 1,721 1,995 1,752 1,569 1,574 10,218
Total Expenditures $3,407 $3,735 $3,954 $4,341 $4,136 $4,017 $4,134 $24,317
Debt
Debt Outstanding $2,020 $2,296 $2,774 $3,412 $3,786 $4,076 $4,296
Debt Coverage – Net Income 3.0 3.4 3.7 3.4 3.3 3.2 3.0
Local Highway User Revenue $172 $176 $177 $179 $183 $184 $187 $1,087
Capital Summary
State Capital\HUR Capital $1,299 $1,608 $1,721 $1,995 $1,752 $1,569 $1,574 $10,218
Net Federal Capital (Cash Flow) 742 771 1,086 978 771 644 706 4,956
Total Capital Expenditures $2,041 $2,379 $2,807 $2,973 $2,523 $2,213 $2,280 $15,174
GARVEE Debt Service $87 $87 $87 $87 $87 $51 $0 $401
GARVEE: Grant Anticipation Revenue Vehicle
HUR: Highway User Revenues
Source: Maryland Department of Transportation, Transportation Trust Fund Forecast, January 2016
J00 – MDOT – Fiscal 2017 Budget Overview
Analysis of the FY 2017 Maryland Executive Budget, 2016 10
Revenues are used first to pay debt service and then to cover the department’s operating
expenses. Remaining revenues are used for the capital program, which is also funded through the sale
of bonds and with federal capital aid. Over the six-year forecast period, bond proceeds are projected
to cover almost 23% of all capital expenditures. The projected issuance of debt will increase the amount
of debt from the $2.02 billion outstanding at the end of fiscal 2015, to almost $4.30 billion by the end
of fiscal 2021. Bond covenants require MDOT to maintain a net income to debt service ratio of at least
2.0 and the department has an administrative policy to maintain a ratio of no less than 2.5. As shown
in Exhibit 3, the debt service coverage ratio grows from 3.0 in fiscal 2015 to a forecast period high of
3.7 in fiscal 2017 and then declines to 3.0 by fiscal 2021.
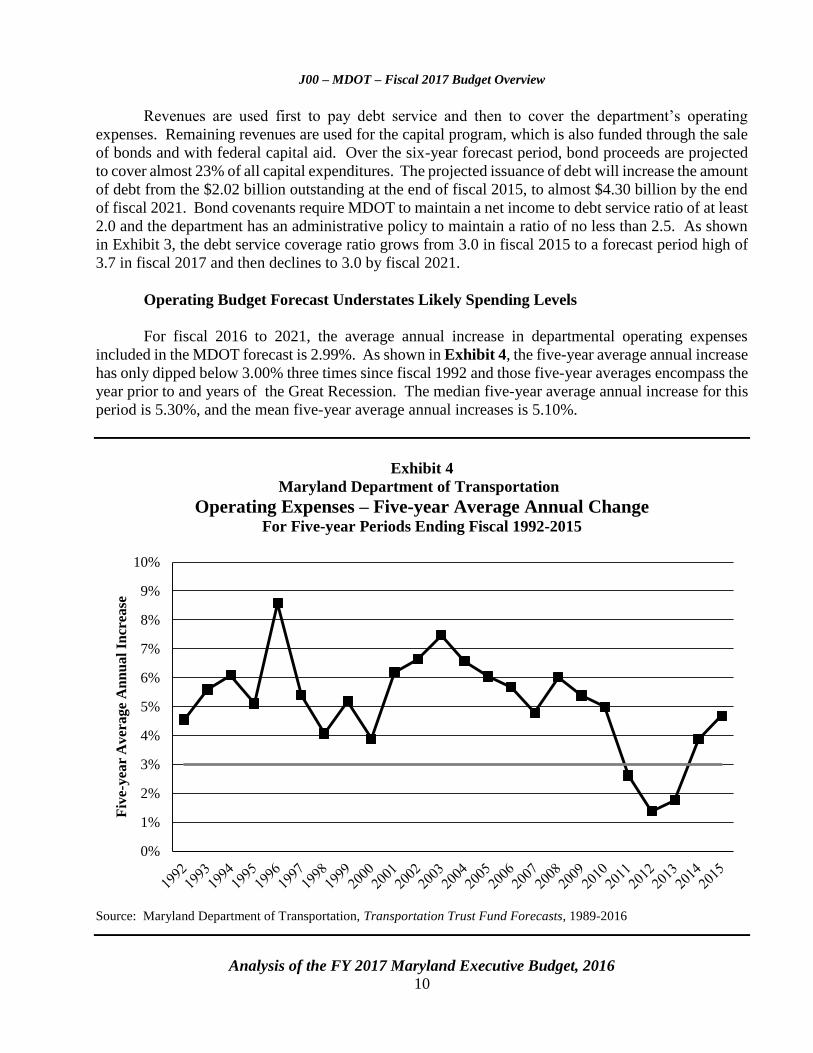
Operating Budget Forecast Understates Likely Spending Levels
For fiscal 2016 to 2021, the average annual increase in departmental operating expenses
included in the MDOT forecast is 2.99%. As shown in Exhibit 4, the five-year average annual increase
has only dipped below 3.00% three times since fiscal 1992 and those five-year averages encompass the
year prior to and years of the Great Recession. The median five-year average annual increase for this
period is 5.30%, and the mean five-year average annual increases is 5.10%.
Exhibit 4
Maryland Department of Transportation
Operating Expenses – Five-year Average Annual Change For Five-year Periods Ending Fiscal 1992-2015
Source: Maryland Department of Transportation, Transportation Trust Fund Forecasts, 1989-2016
0%
1%
2%
3%
4%
5%
6%
7%
8%
9%
10%
Fiv
e-y
ear
Av
era
ge
An
nu
al
Incr
ease
J00 – MDOT – Fiscal 2017 Budget Overview
Analysis of the FY 2017 Maryland Executive Budget, 2016 11
Underestimating the level of operating expenses results in capital spending levels that are
overstated, since operating expenses and debt service are deducted from available revenues to
determine the amounts available for the capital program. Should operating expenses increase at the
median rate of the five-year average annual increases going back to 1992, the amount available for
capital program spending would be $679 million less than in the MDOT forecast. While MDOT is
making efforts to reduce operational spending – it self-imposed a 2% cost containment effort for
fiscal 2016 in response to the 2% across-the-board reduction applied to general fund agencies – cost
controls have been imposed in the past, which are unsustainable over time. An inquiry as part of the
fiscal 2017 baseline budget process revealed that none of the fiscal 2016 cost containment actions being
taken were of an ongoing nature that could be carried into future year. This suggests that while MDOT
may constrain budget growth for a year or two, deferred expenses will eventually be incurred. To
encourage truth in forecasting, committee narrative is included in the recommended action
section of this analysis that would state the intent that MDOT use the five-year average annual
increase for the period ending with the most recent complete fiscal year to calculate out-year
operating expenses. For the current TTF forecast this would be 4.7% and would reduce the
amount available for the capital program by $492 million.
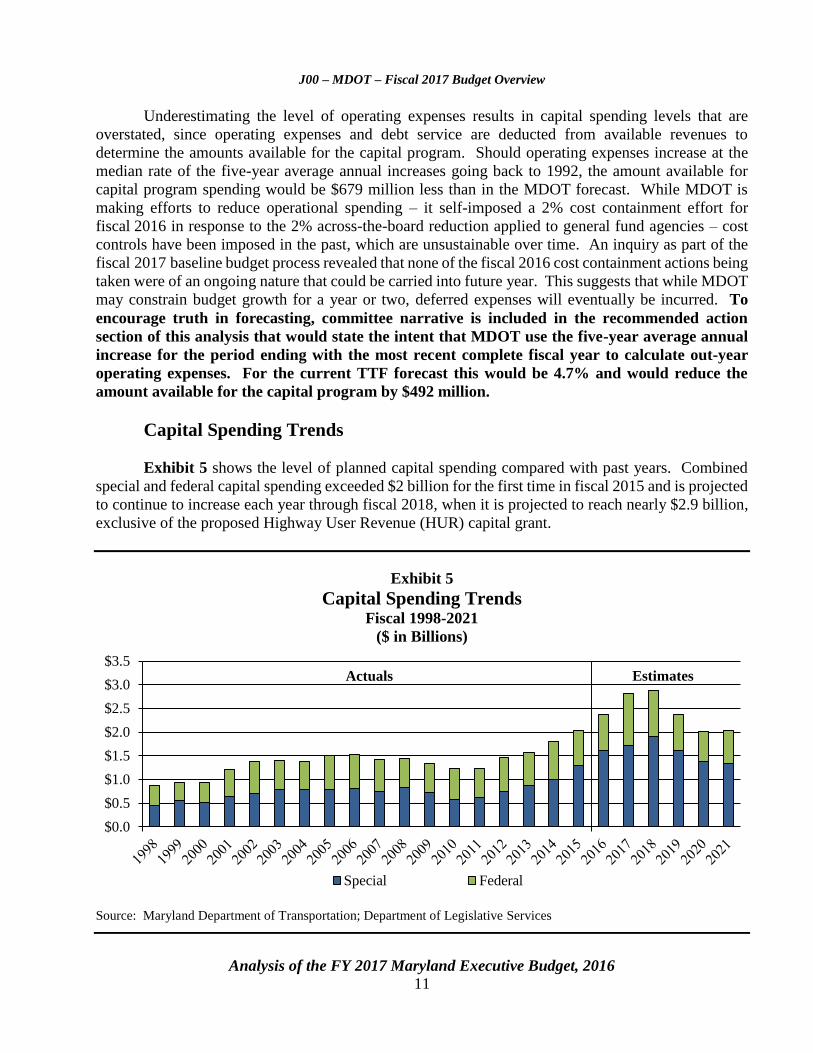
Capital Spending Trends
Exhibit 5 shows the level of planned capital spending compared with past years. Combined
special and federal capital spending exceeded $2 billion for the first time in fiscal 2015 and is projected
to continue to increase each year through fiscal 2018, when it is projected to reach nearly $2.9 billion,
exclusive of the proposed Highway User Revenue (HUR) capital grant.
Exhibit 5
Capital Spending Trends Fiscal 1998-2021
($ in Billions)
Source: Maryland Department of Transportation; Department of Legislative Services
$0.0
$0.5
$1.0
$1.5
$2.0
$2.5
$3.0
$3.5
Special Federal
EstimatesActuals

J00 – MDOT – Fiscal 2017 Budget Overview
Analysis of the FY 2017 Maryland Executive Budget, 2016 12
Budget Overview
Exhibit 6 shows all expenditures from the TTF by category in fiscal 2017. The pay-as-you-go
(PAYGO) capital program comprises just over half the spending, and the operating budgets of the
modes accounts for a further 37% of total spending. The remainder of TTF expenditures go toward
debt service on Consolidated Transportation Bonds (CTB), the share of the HURs distributed to
counties and municipalities, and deductions to other State agencies.
Exhibit 6
Fiscal 2017 Transportation Trust Fund Uses Total Spending: $5.3 Billion
($ in Millions)
PAYGO: pay-as-you-go
Note: The chart includes special funds from the Transportation Trust Fund and federal funds only. It excludes $258 million
in other funding for the capital program. For illustrative purposes, other funding can include the Maryland Transportation
Authority, passenger facility charges, customer facility changes, local county participation, pass through federal funding for
the Washington Metropolitan Area Transit Authority, and funding from the Transportation Security Administration.
Note: The $54 million capital grant to local governments is included in the Highway User Revenues slice and deducted
from the PAYGO Budget slice.
* Includes $10 million for contingencies and $2 million for BaltimoreLink to be added by budget amendment.
Source: Maryland Department of Transportation, Transportation Trust Fund Forecast, January 2016
PAYGO Budget
$2,752
52%
Operating Budget*
$1,923
37%
Debt Service
Payments
$310
6%
Deductions to Other
Agencies
$65
1%
Highway User
Revenues
$231
4%
J00 – MDOT – Fiscal 2017 Budget Overview
Analysis of the FY 2017 Maryland Executive Budget, 2016 13
Proposed Budget
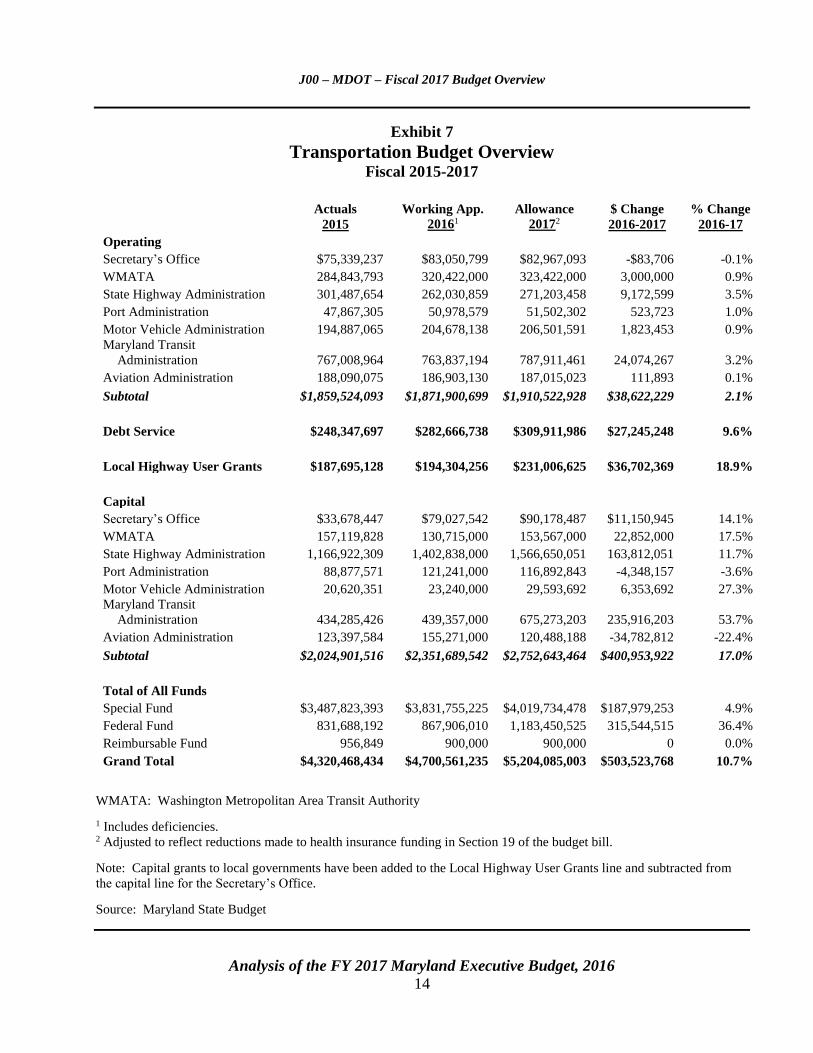
Exhibit 7 shows the operating and PAYGO capital budgets for the modal administrations along
with amounts budgeted for debt service and local highway user grants from the fiscal 2015 actuals
through the 2017 allowance. For all three years, the capital grants to local governments have been
added to the Local Highway User Grants line and subtracted from the capital budget for the Secretary’s
office. Fiscal 2016 includes deficiency appropriations, which add positions to MTA for the
BaltimoreLink initiative. The fiscal 2017 amounts have been adjusted to reflect back of the bill
reductions totaling $1.8 million ($1,842,652 million in special funds and $264 in federal funds), which
reduce the amount budgeted for health insurance. Funds for employee salary step increases are
included in the Department of Budget and Management (DBM) budget, and will be distributed to
agencies by budget amendment and are therefore not included in the amounts shown in Exhibit 7.
MDOT will receive an additional $6.9 million special funds and an estimated $628,000 federal funds
when the salary step funding is distributed.
MDOT’s total fiscal 2017 allowance increases $503.5 million, or 10.7%, compared to the
fiscal 2016 working appropriation. Almost 80.0% of the increase is attributable to increases in the
capital budget ($401.0 million). The remaining changes in descending order are the operating budget
($38.6 million), local aid ($36.7 million), and debt service ($27.2 million). Total special fund spending
increases $188.0 million, or 4.9%, compared to the fiscal 2016 working appropriation, while federal
funds increase by $315.5 million, or 36.4%. It should be noted that the fiscal 2016 working
appropriation does not reflect all known changes from the legislative appropriation due to timing issues
associated with submitting the budget for publication with the fiscal 2017 allowance. For example,
debt service is currently projected at $264.0 million in fiscal 2016, a reduction due to lower bond sales.
Final numbers will be calculated in the budget closeout and reported as actuals with the submission of
the fiscal 2018 budget.
J00 – MDOT – Fiscal 2017 Budget Overview
Analysis of the FY 2017 Maryland Executive Budget, 2016 14
Exhibit 7
Transportation Budget Overview Fiscal 2015-2017
Actuals
2015
Working App.
20161 Allowance
20172 $ Change
2016-2017
% Change
2016-17
Operating
Secretary’s Office $75,339,237 $83,050,799 $82,967,093 -$83,706 -0.1%
WMATA 284,843,793 320,422,000 323,422,000 3,000,000 0.9%
State Highway Administration 301,487,654 262,030,859 271,203,458 9,172,599 3.5%
Port Administration 47,867,305 50,978,579 51,502,302 523,723 1.0%
Motor Vehicle Administration 194,887,065 204,678,138 206,501,591 1,823,453 0.9%
Maryland Transit
Administration 767,008,964 763,837,194 787,911,461 24,074,267 3.2%
Aviation Administration 188,090,075 186,903,130 187,015,023 111,893 0.1%
Subtotal $1,859,524,093 $1,871,900,699 $1,910,522,928 $38,622,229 2.1%
Debt Service $248,347,697 $282,666,738 $309,911,986 $27,245,248 9.6%
Local Highway User Grants $187,695,128 $194,304,256 $231,006,625 $36,702,369 18.9%
Capital
Secretary’s Office $33,678,447 $79,027,542 $90,178,487 $11,150,945 14.1%
WMATA 157,119,828 130,715,000 153,567,000 22,852,000 17.5%
State Highway Administration 1,166,922,309 1,402,838,000 1,566,650,051 163,812,051 11.7%
Port Administration 88,877,571 121,241,000 116,892,843 -4,348,157 -3.6%
Motor Vehicle Administration 20,620,351 23,240,000 29,593,692 6,353,692 27.3%
Maryland Transit
Administration 434,285,426 439,357,000 675,273,203 235,916,203 53.7%
Aviation Administration 123,397,584 155,271,000 120,488,188 -34,782,812 -22.4%
Subtotal $2,024,901,516 $2,351,689,542 $2,752,643,464 $400,953,922 17.0%
Total of All Funds
Special Fund $3,487,823,393 $3,831,755,225 $4,019,734,478 $187,979,253 4.9%
Federal Fund 831,688,192 867,906,010 1,183,450,525 315,544,515 36.4%
Reimbursable Fund 956,849 900,000 900,000 0 0.0%
Grand Total $4,320,468,434 $4,700,561,235 $5,204,085,003 $503,523,768 10.7%
WMATA: Washington Metropolitan Area Transit Authority 1 Includes deficiencies. 2 Adjusted to reflect reductions made to health insurance funding in Section 19 of the budget bill.
Note: Capital grants to local governments have been added to the Local Highway User Grants line and subtracted from
the capital line for the Secretary’s Office.
Source: Maryland State Budget

J00 – MDOT – Fiscal 2017 Budget Overview
Analysis of the FY 2017 Maryland Executive Budget, 2016 15
Operating Budget Analysis
MDOT’s operating allowance includes expenditures for each of the modes, as well as debt
service and local aid through HURs. The fiscal 2017 allowance totals almost $2.5 billion, an increase
of $102.6 million compared to the fiscal 2016 working appropriation. Almost 80% of the operating
allowance is used for the operating budgets of each of the modes.
Fiscal 2017 Proposed Budget
Operating Programs
The fiscal 2017 allowance for the modal operating budgets, adjusted to reflect the back of the
bill reductions for health insurance, totals $1.9 billion, an increase of $38.6 million, or 2.1%, over the
fiscal 2016 working appropriation. The largest increase in dollar terms is for MTA, which increases
$24.1 million, or 3.2%. Other large increases occur in the Maryland State Highway Administration
(SHA) ($9.2 million or 3.5%), and the Washington Metropolitan Area Transit Authority (WMATA)
($3.0 million or 0.9%). The factors leading to these increases will be discussed in the budget analysis
for each of the modes.
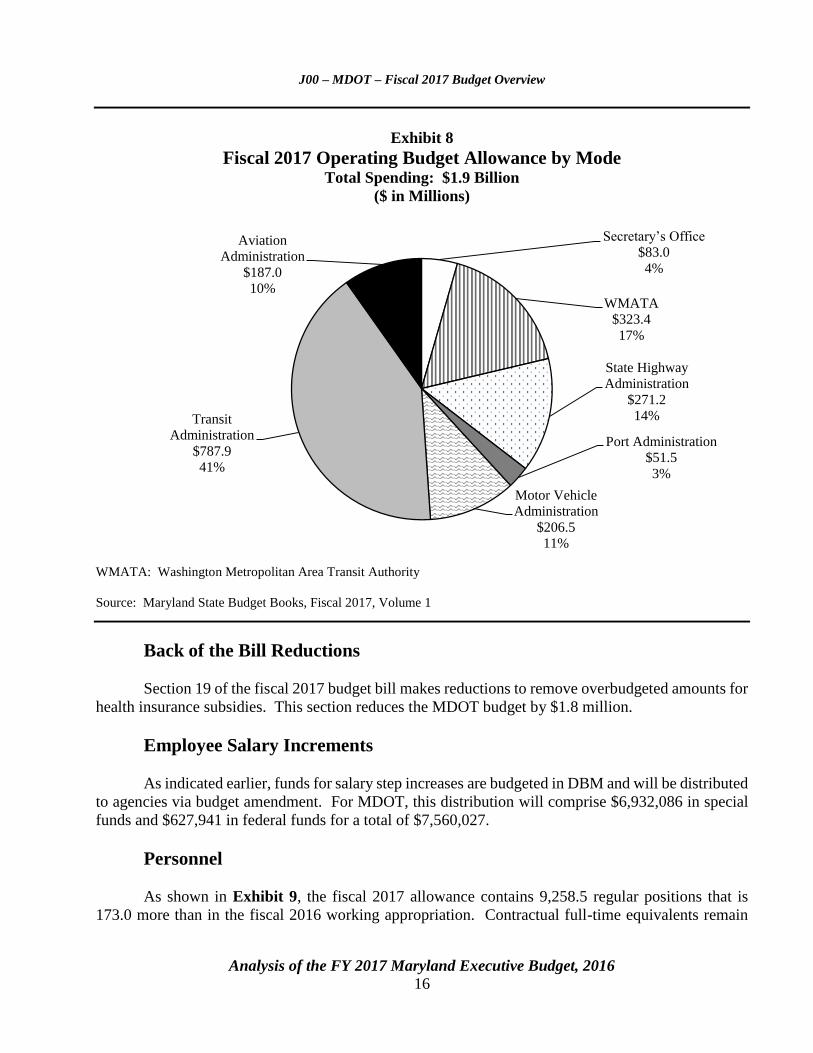
Exhibit 8 shows fiscal 2017 operating budget allowances by mode and provides the percentage
of total operating spending that the budget for each mode represents. Combined MTA and WMATA
transit spending represents the largest share of the MDOT operating budget, at 58.2%.
J00 – MDOT – Fiscal 2017 Budget Overview
Analysis of the FY 2017 Maryland Executive Budget, 2016 16
Exhibit 8
Fiscal 2017 Operating Budget Allowance by Mode Total Spending: $1.9 Billion
($ in Millions)
WMATA: Washington Metropolitan Area Transit Authority
Source: Maryland State Budget Books, Fiscal 2017, Volume 1
Back of the Bill Reductions
Section 19 of the fiscal 2017 budget bill makes reductions to remove overbudgeted amounts for
health insurance subsidies. This section reduces the MDOT budget by $1.8 million.
Employee Salary Increments
As indicated earlier, funds for salary step increases are budgeted in DBM and will be distributed
to agencies via budget amendment. For MDOT, this distribution will comprise $6,932,086 in special
funds and $627,941 in federal funds for a total of $7,560,027.
Personnel
As shown in Exhibit 9, the fiscal 2017 allowance contains 9,258.5 regular positions that is
173.0 more than in the fiscal 2016 working appropriation. Contractual full-time equivalents remain
Secretary’s Office
$83.0
4%
WMATA
$323.4
17%
State Highway
Administration
$271.2
14%
Port Administration
$51.5
3%
Motor Vehicle
Administration
$206.5
11%
Transit
Administration
$787.9
41%
Aviation
Administration
$187.0
10%

J00 – MDOT – Fiscal 2017 Budget Overview
Analysis of the FY 2017 Maryland Executive Budget, 2016 17
unchanged at 40.7 between fiscal 2016 and 2017. New positions are being added in SHA (27.0) due
to the increased capital program, in MVA (17.0) to convert the Highway Safety function from a contract
with the University of Baltimore to an in-house operation, and in MTA (129.0) as part of the
BaltimoreLink transit initiative.
Exhibit 9
Regular and Contractual Full-time Equivalents
Operating and Capital Programs Fiscal 2015-2017
2015
Working
2016
Allowance
2017
Change
2016-17
% Change
2016-17
Regular Positions
Secretary’s Office 298.5 299.5 299.5 0.0 0.0%
State Highway Administration 3,036.5 3,036.5 3,063.5 27.0 0.9%
Port Administration 219.0 219.0 219.0 0.0 0.0%
Motor Vehicle Administration 1,712.5 1,712.5 1,729.5 17.0 1.0%
Transit Administration 3,318.5 3,317.5 3,446.5 129.0 3.9%
Aviation Administration 500.5 500.5 500.5 0.0 0.0%
Subtotal 9,085.5 9,085.5 9,258.5 173.0 1.9%
Contractual Positions
Secretary’s Office 6.0 6.0 6.0 0.0 0.0%
State Highway Administration 17.0 17.0 17.0 0.0 0.0%
Port Administration 0.7 1.2 1.2 0.0 0.0%
Motor Vehicle Administration 0.0 0.0 0.0 0.0 n/a
Transit Administration 16.0 16.0 16.0 0.0 0.0%
Aviation Administration 0.5 0.5 0.5 0.0 0.0%
Subtotal 40.2 40.7 40.7 0.0 0.0%
Source: Department of Budget and Management
Debt Service
The fiscal 2017 allowance for debt service payments is $309.9 million, an increase of
$27.2 million, or 9.6%, from the fiscal 2016 working appropriation. The increase is the result of
established debt service schedules for previously issued bonds and the planned issuance of
$685.0 million in new debt in fiscal 2017.
At the end of fiscal 2017, CTB debt outstanding is expected to total $2.8 billion, which remains
below the statutory cap of $4.5 billion. The MDOT forecast indicates that bond coverage ratios will
be adequate throughout the forecast period.

J00 – MDOT – Fiscal 2017 Budget Overview
Analysis of the FY 2017 Maryland Executive Budget, 2016 18
Local Highway User Revenues
HUR are derived from a portion of tax and fee revenues that are deposited into the GMVRA
and subsequently distributed among the TTF, Baltimore City, counties, and municipalities. The local
share of HUR in fiscal 2017 is $177.4 million, a $1.1 million increase over fiscal 2016. In addition to
the HUR distribution, local governments received a $25.0 million capital grant in fiscal 2016, and the
fiscal 2017 allowance contains a capital grant of $53.6 million. The combined HUR and capital grant
amount in fiscal 2017 equals 12.5% of estimated HUR revenues.
Exhibit 10 provides a summary of HUR and local capital grant distributions for fiscal 2016 and
2017.
Exhibit 10
Distribution of Highway User Revenues and Local Transportation Capital Grants Fiscal 2016-2017
Percent Share Fiscal 2016 Fiscal 2017
Highway User Revenues
MDOT 90.4% $1,660,577,488 $1,670,639,912
Local Share 9.6% 176,344,512 177,413,088
Total HUR 100.0% $1,836,922,000 $1,848,053,000
HUR Local Distribution
Baltimore City 7.7% $141,442,994 $142,300,081
Counties 1.5% 27,553,830 27,720,795
Municipalities 0.4% 7,347,688 7,392,212
Total 9.6% $176,344,512 $177,413,088
Local Transportation Capital Grants
Baltimore City $2,000,000 $5,544,159
Counties 4,000,000 27,720,795
Municipalities 19,000,000 20,328,583
Total $25,000,000 $53,593,537
Total Local HUR and Capital Grants $201,344,512 $231,006,625
MDOT: Maryland Department of Transportation
HUR: Highway User Revenues
Source: Maryland State Budget Books, Fiscal 2017, Volume 1
J00 – MDOT – Fiscal 2017 Budget Overview
Analysis of the FY 2017 Maryland Executive Budget, 2016 19
PAYGO Capital Budget Analysis
The Consolidated Transportation Program (CTP) is issued annually and is posted on the
MDOT website. The CTP provides a description of major projects proposed by MDOT for
development and evaluation or construction over the next six-year period.
Fiscal 2016 through 2021 CTP
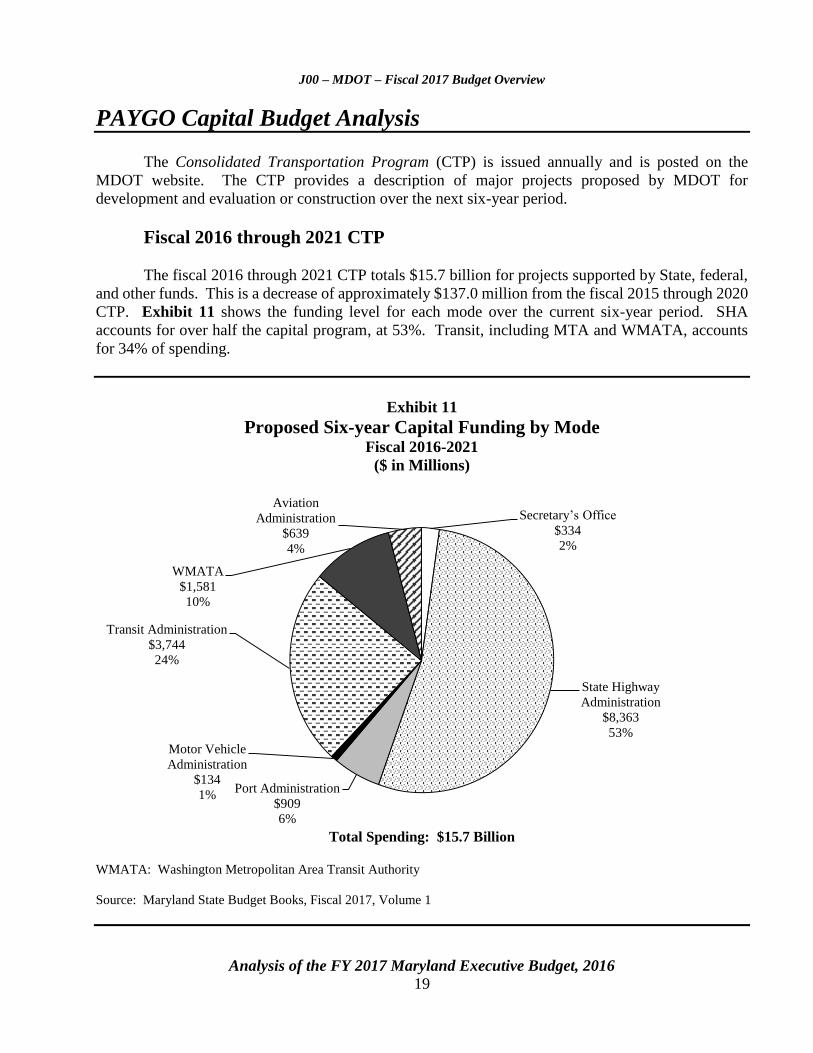
The fiscal 2016 through 2021 CTP totals $15.7 billion for projects supported by State, federal,
and other funds. This is a decrease of approximately $137.0 million from the fiscal 2015 through 2020
CTP. Exhibit 11 shows the funding level for each mode over the current six-year period. SHA
accounts for over half the capital program, at 53%. Transit, including MTA and WMATA, accounts
for 34% of spending.
Exhibit 11
Proposed Six-year Capital Funding by Mode Fiscal 2016-2021
($ in Millions)
Total Spending: $15.7 Billion
WMATA: Washington Metropolitan Area Transit Authority
Source: Maryland State Budget Books, Fiscal 2017, Volume 1
Secretary’s Office
$334
2%
State Highway
Administration
$8,363
53%
Port Administration
$909
6%
Motor Vehicle
Administration
$134
1%
Transit Administration
$3,744
24%
WMATA
$1,581
10%
Aviation
Administration
$639
4%
J00 – MDOT – Fiscal 2017 Budget Overview
Analysis of the FY 2017 Maryland Executive Budget, 2016 20
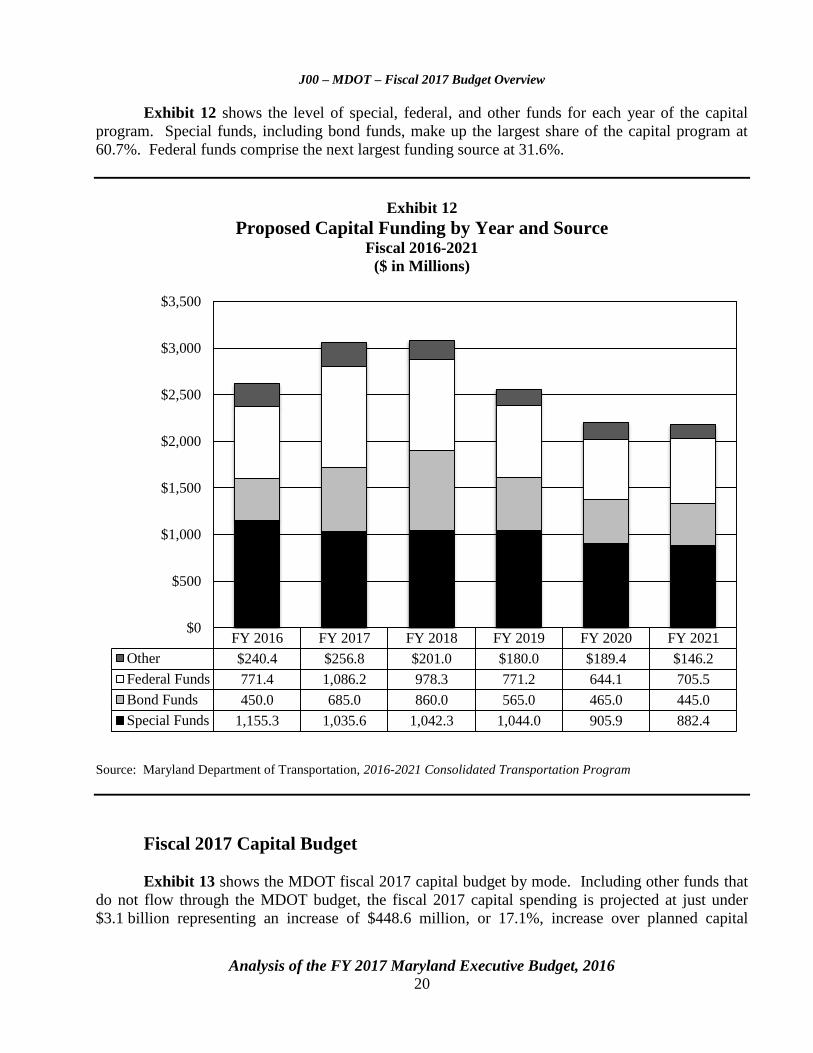
Exhibit 12 shows the level of special, federal, and other funds for each year of the capital
program. Special funds, including bond funds, make up the largest share of the capital program at
60.7%. Federal funds comprise the next largest funding source at 31.6%.
Exhibit 12
Proposed Capital Funding by Year and Source Fiscal 2016-2021
($ in Millions)
Source: Maryland Department of Transportation, 2016-2021 Consolidated Transportation Program
Fiscal 2017 Capital Budget
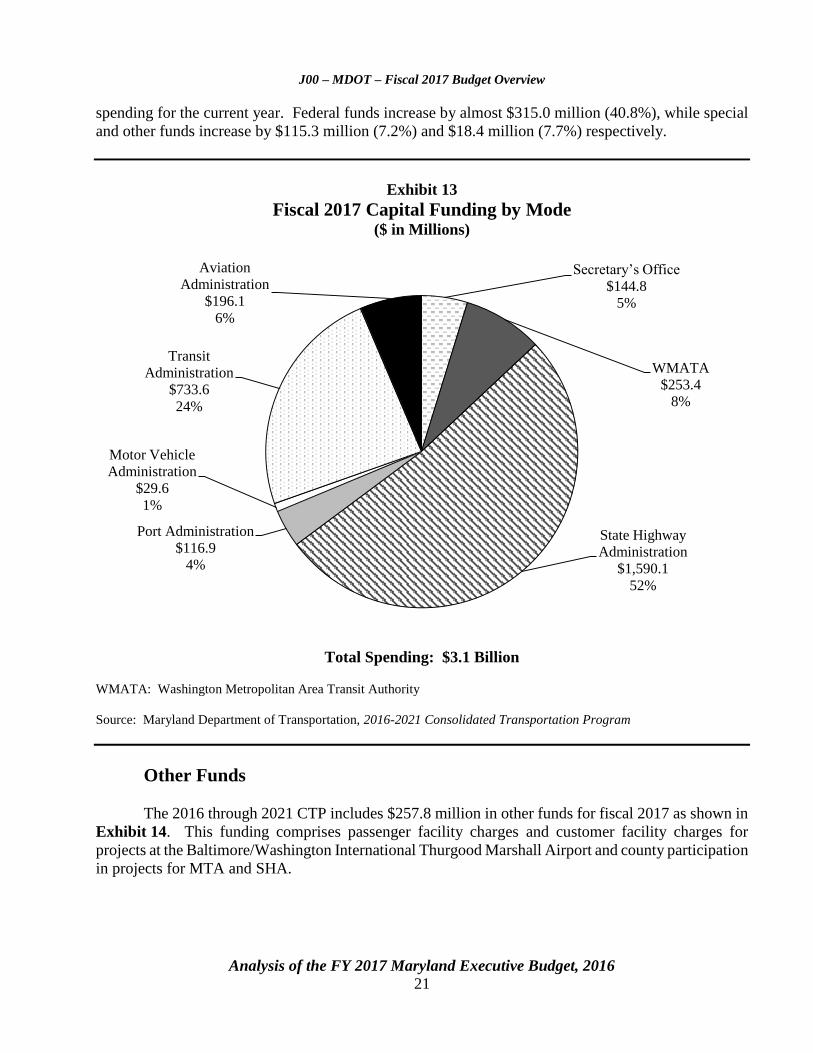
Exhibit 13 shows the MDOT fiscal 2017 capital budget by mode. Including other funds that
do not flow through the MDOT budget, the fiscal 2017 capital spending is projected at just under
$3.1 billion representing an increase of $448.6 million, or 17.1%, increase over planned capital
FY 2016 FY 2017 FY 2018 FY 2019 FY 2020 FY 2021
Other $240.4 $256.8 $201.0 $180.0 $189.4 $146.2
Federal Funds 771.4 1,086.2 978.3 771.2 644.1 705.5
Bond Funds 450.0 685.0 860.0 565.0 465.0 445.0
Special Funds 1,155.3 1,035.6 1,042.3 1,044.0 905.9 882.4
$0
$500
$1,000
$1,500
$2,000
$2,500
$3,000
$3,500
J00 – MDOT – Fiscal 2017 Budget Overview
Analysis of the FY 2017 Maryland Executive Budget, 2016 21
spending for the current year. Federal funds increase by almost $315.0 million (40.8%), while special
and other funds increase by $115.3 million (7.2%) and $18.4 million (7.7%) respectively.
Exhibit 13
Fiscal 2017 Capital Funding by Mode ($ in Millions)
Total Spending: $3.1 Billion
WMATA: Washington Metropolitan Area Transit Authority
Source: Maryland Department of Transportation, 2016-2021 Consolidated Transportation Program
Other Funds
The 2016 through 2021 CTP includes $257.8 million in other funds for fiscal 2017 as shown in
Exhibit 14. This funding comprises passenger facility charges and customer facility charges for
projects at the Baltimore/Washington International Thurgood Marshall Airport and county participation
in projects for MTA and SHA.
Secretary’s Office
$144.8
5%
WMATA
$253.4
8%
State Highway
Administration
$1,590.1
52%
Port Administration
$116.9
4%
Motor Vehicle
Administration
$29.6
1%
Transit
Administration
$733.6
24%
Aviation
Administration
$196.1
6%

J00 – MDOT – Fiscal 2017 Budget Overview
Analysis of the FY 2017 Maryland Executive Budget, 2016 22
Exhibit 14
Fiscal 2017 Other Funds ($ in Thousands)
Project Other Source 2017 Funding
Runway Safety Area/Pavement Management Program Passenger Facility Charges $27,854
D/E Concourses Connector Passenger Facility Charges 33,329
Consolidated Rental Car Facility Customer Facility Charges 2,739
Loading Bridge Replacement Program Passenger Facility Charges 4,091
Concourse B Ticket Counters Passenger Facility Charges 7,000
Permanent Noise Monitoring System Replacement Passenger Facility Charges 578
Subtotal – Maryland Aviation Administration Other Funds $75,591
Purple Line Montgomery/Prince George’s
Counties $16,600
Purple Line Associated Projects Montgomery County 40,728
LOTS Elderly and Disabled Nonprofit Services Local Governments 945
LOTS Baltimore City Harbor Connector Baltimore City 17
LOTS Transportation Development Plan Local Governments 49
Subtotal – Maryland Transit Administration Other Funds $58,339
Canton Railroad Grant Canton Railroad Company $987
Subtotal – The Secretary’s Office Other Funds $987
WMATA Federal Funding Federal Government $99,870
Subtotal – WMATA Other Funds $99,870
MD 140 Reisterstown Road, Garrison View Baltimore $2,653
US 40, South Philadelphia Boulevard Harford 983
MD 97 Georgia Avenue, 16th Street Montgomery 287
MD 586 Multi-Modal Transit Study Montgomery 1,480
MD 355 Rockville Pike Maple Avenue Montgomery 5,509
MD 97 Brookeville Bypass Montgomery 1,950
MD 5 Branch Avenue, MD 373, and Brandywine WSSC 1,832
War of 1812 Archaeological/Historical Study in
Bladensburg National Park service 2
I-81, Maryland Veterans Memorial Highway West Virginia 8,297
Subtotal – State Highway Administration Other Funds $22,993
Total – Other Funds $257,780
LOTS: locally operated transit systems
WMATA: Washington Metropolitan Area Transit Authority
WSSC: Washington Suburban Sanitary Commission
Source: Maryland Department of Transportation
J00 – MDOT – Fiscal 2017 Budget Overview
Analysis of the FY 2017 Maryland Executive Budget, 2016 23
Issues
1. Long-term Federal Surface Transportation Reauthorization Passed
On December 4, 2015, President Barack H. Obama signed the Fixing America’s Surface
Transportation Act of 2015 (FAST Act) providing federal funding levels for surface transportation
programs for federal fiscal 2016 through 2020 and transferring $70.0 billion in federal general funds
and $0.3 billion in the Leaking Underground Storage Tank (LUST) program funds into the Highway
Trust Fund (HTF) to ensure its solvency through federal fiscal 2020. This is the first reauthorization
bill in over 10 years that provides long-term funding certainty for states.
Highway Funding
The FAST Act provides for an average annual increase in highway funding of 2.8% from federal
fiscal 2015 through 2020. Maryland’s apportionment will increase by approximately 5.1% to
$609.6 million in federal fiscal 2016, from the current $580.0 million. Funding then increases by just
over 2.0% per year, with Maryland scheduled to receive $665.5 million in the final fiscal year under
the Act. MDOT projects that SHA will receive an increase of nearly $208.0 million over the six-year
authorization period.
New Highway Programs – Freight
The FAST Act creates two new programs to help state and local governments plan and fund
freight mobility projects:
National Highway Freight Program – A new formula freight program to provide funding to
states for freight projects on the National Highway Freight Network (NHFN). States with over
2% of the total mileage on the NHFN must spend certain proportions of their funding within
certain corridors. States with less than 2% (Maryland included) can spend their apportionments
on any part of the NHFN within the state. Maryland is scheduled to receive $17.4 million in
funding in federal fiscal 2016, increasing to $22.8 million by federal fiscal 2020.
Nationally Significant Freight and Highway Projects – A new discretionary grant program
for the Secretary of the U.S. Department of Transportation to select projects of national or
regional significance. Applicants can be states or groups of states, Metropolitan Planning
Organizations, municipal governments, special purpose districts, federal land agencies, Indian
tribes, or combinations thereof. Projects must be highway freight projects on the NHFN with a
total project cost that exceeds $100 million (with 10% of funding reserved for projects below
$100 million). The FAST Act provides $800 million for this program in federal fiscal 2016
with $50 million increases each year through federal fiscal 2020.
J00 – MDOT – Fiscal 2017 Budget Overview
Analysis of the FY 2017 Maryland Executive Budget, 2016 24
Transit Funding
Maryland’s share of formula funding will be $240.1 million in federal fiscal 2016, and will
grow at an average annual rate of 2.2% over the five-year authorization period ending at an
apportionment of $256.6 million in federal fiscal 2020. Transit programs remain largely unchanged
under the FAST Act although the Act reinstates the Bus and Bus Facility discretionary funding program
with a five-year authorization of $1.5 billion. MDOT indicates that all transit funding in Maryland is
expected to increase by approximately $25.0 million over the six-year authorization period to support
both State-run and locally operated transit systems.
Federal Highway Trust Fund Status
As indicated above, general fund and LUST program balance transfers totaling $70.3 billion
are made in the FAST Act, bringing the total general fund transfers since federal fiscal 2008 to
$139.9 billion and total LUST program transfers to $3.7 billion. The funding offsets or “pay fors” in
the FAST Act are unrelated to transportation and do nothing to address the structural imbalance
between ongoing HTF revenues, provided largely through the 18.4 cent federal gas tax, and ongoing
spending. The largest funding offset is a $53.3 billion transfer from the Federal Reserve surplus
account funded through payments by Federal Reserve member banks. This will make the next surface
transportation reauthorization process more difficult because the purchasing power of the federal gas
tax will have been eroded by an additional five years.
MDOT should comment on how the funding certainty provided by the FAST Act will
affect capital planning, how it intends to utilize NHFP formula funding, and if and for which
project(s) it intends to seek funding under the new Nationally Significant Freight and Highway
Projects discretionary grants program.
2. Scoring System for Transportation Capital Project Selection Could Ensure
Greater Focus on Economic Benefits
Background
The amount of funding that would be needed for all desired transportation projects that meet
the eligibility requirements set forth in statute is far in excess of available funding. The CTP aligns
transportation capital spending with the estimated resources that will be available over the six-year
forecast period. MDOT and ultimately the Governor, has wide latitude in deciding which projects to
include in the CTP and which to defer. A change in Administrations can lead to very different funding
decisions as has been demonstrated with the shift away from mass transit and toward road and highway
funding announced by the current Administration.
Current statutory requirements related to adding projects to the CTP require that each project:
support local government land use plans and goals; and
J00 – MDOT – Fiscal 2017 Budget Overview
Analysis of the FY 2017 Maryland Executive Budget, 2016 25
address State transportation goals as identified in the State’s long-range transportation planning
document – the Maryland Transportation Plan.
Statutory requirements do not, however, ensure that the funded projects will generate the greatest return
on investment in terms of easing congestion and stimulating economic growth. What is lacking in the
CTP development process is a scoring system that would help identify the projects that should receive
the highest funding priority.
Balancing Transportation-related Economic Challenges
While most transportation capital projects can be said to support economic activity, some
projects have tremendous potential in this respect while others are much more limited. Two examples
help illustrate this point. First, the Port of Baltimore, one of Maryland’s largest economic engines, is
hampered by the inability to double-stack shipping containers on railcars because the antiquated
Howard Street tunnel is not big enough. The inability to double-stack containers impedes Maryland’s
ability to compete for shipping business. Second, continued development of the Great Seneca Science
Corridor, a major high-tech employment center planned in Montgomery County, is dependent on
progress in construction of the Corridor Cities Transitway, which is designed to ensure adequate transit
access and help alleviate and prevent unacceptable levels of road congestion in the I-270 corridor.
Maryland’s economy would be greatly improved by replacing the Howard Street Tunnel and
by constructing the Corridor Cities Transitway. The cost for each of these projects is large. However,
if all projects were evaluated and ranked based on a cost-benefit basis for inclusion in the CTP, these
two projects would likely be highly ranked and funded sooner than currently planned.
Priority Setting Processes – Other States
North Carolina, Virginia, and Washington have all enacted laws establishing project priority
setting processes to more effectively guide transportation investment decisions and increase
transparency in how projects are selected for funding. A key component of these processes is the use
of a cost-benefit analysis approach to determine which investments will yield the greatest economic
and other desired outcomes.
Conclusion
Despite the transportation revenue increases passed in 2013, Maryland’s ability to fund its
transportation capital program falls well short of identified needs. This makes it important that the
projects that are funded yield the greatest benefit possible. Developing a data-driven, cost-benefit
approach to project selection would help ensure that outcome. The committees may wish to consider
legislation modifying the project selection process to give greater emphasis on economic
outcomes. The Secretary should comment on how the greater emphasis on economic outcomes
could be incorporated in development of the CTP.

J00 – MDOT – Fiscal 2017 Budget Overview
Analysis of the FY 2017 Maryland Executive Budget, 2016 26
Recommended Actions
1. Add the following language:
Provided that it is the intent of the General Assembly that projects and funding levels
appropriated for capital projects, as well as total estimated project costs within the Consolidated
Transportation Program, shall be expended in accordance with the plan approved during the
legislative session. The department shall prepare a report to notify the budget committees of
the proposed changes in the event that the department modifies the program to:
(1) add a new project to the construction program or development and evaluation program
meeting the definition of a “major project” under Section 2-103.1 of the
Transportation Article that was not previously contained within a plan reviewed in a
prior year by the General Assembly and will result in the need to expend funds in the
current budget year; or
(2) change the scope of a project in the construction program or development and
evaluation program meeting the definition of a “major project” under Section 2-103.1
of the Transportation Article that will result in an increase of more than 10% or
$1,000,000, whichever is greater, in the total project costs as reviewed by the General
Assembly during a prior session.
For each change, the report shall identify the project title, justification for adding the new
project or modifying the scope of the existing project, current year funding levels, and the total
project cost as approved by the General Assembly during the prior session compared with the
proposed current year funding and total project cost estimate resulting from the project addition
or change in scope.
Further provided that notification of project additions, as outlined in paragraph (1) above;
changes in the scope of a project, as outlined in paragraph (2) above; or moving projects from
the development and evaluation program to the construction program, shall be made to the
General Assembly 45 days prior to the expenditure of funds or the submission of any contract
for approval to the Board of Public Works.
Explanation: This annual budget bill language requires the department to notify the budget
committees of proposed changes to the transportation capital program that will add a new
project that was not in the fiscal 2016 through 2021 Consolidated Transportation Program
(CTP) or will increase a total project’s cost by more than 10%, or $1 million, due to a change
in scope. Reports are to be submitted with the draft and final versions of the CTP, with each
using the 2016 session CTP as the basis for comparison. In addition, notification is required as
needed throughout the budget year, if certain changes to projects are made.
J00 – MDOT – Fiscal 2017 Budget Overview
Analysis of the FY 2017 Maryland Executive Budget, 2016 27
Information Request
Capital budget changes from
one CTP version to the next
Capital budget changes
throughout the year
Authors
Maryland Department of
Transportation
Maryland Department of
Transportation
Due Date
With draft CTP
With final CTP
45 days prior to the
expenditure of funds or
seeking Board of Public
Works approval
2. Add the following language:
The Maryland Department of Transportation (MDOT) may not expend funds on any job or
position of employment approved in this budget in excess of x,xxx.x positions and
xx.x contractual full-time equivalents paid through special payments payroll (defined as the
quotient of the sum of the hours worked by all such employees in the fiscal year divided by
2,080 hours) of the total authorized amount established in the budget for MDOT at any
one time during fiscal 2017. The level of contractual full-time equivalents may be exceeded
only if MDOT notifies the budget committees of the need and justification for additional
contractual personnel due to:
(1) business growth at the Helen Delich Bentley Port of Baltimore or
Baltimore/Washington International Thurgood Marshall Airport, which demands
additional personnel; or
(2) emergency needs that must be met, such as transit security or highway maintenance.
The Secretary shall use the authority under Sections 2-101 and 2-102 of the Transportation
Article to implement this provision. However, any authorized job or position to be filled above
the regular position ceiling approved by the Board of Public Works shall count against the Rule
of xx imposed by the General Assembly. The establishment of new jobs or positions of
employment not authorized in the fiscal 2017 budget shall be subject to Section 7-236 of the
State Finance and Procurement Article and the Rule of xx.
Explanation: This annual budget bill language establishes a position ceiling for MDOT each
year to limit growth in regular positions and contractual full-time equivalents.
Information Request
Need for additional regular or
contractual positions
Author
MDOT
Due Date
As needed
J00 – MDOT – Fiscal 2017 Budget Overview
Analysis of the FY 2017 Maryland Executive Budget, 2016 28
3. Adopt the following narrative:
Truth in Forecasting: The committees are concerned that the 2.99% average annual increase
in departmental operating expenses that the Maryland Department of Transportation (MDOT)
used in its fiscal 2016 through 2021 Transportation Trust Fund (TTF) forecast understates the
amount of operating expenses likely to be incurred over the forecast period and, as a
consequent, leads to an overestimate of the level of funding that will be available during the
forecast period to support the capital program. The committees note that in past 24 years that
the 5-year average annual increase in departmental operating expenses has only dipped
three times below 3.00% and those instances covered the years of the Great Recession. It is
therefore the intent of the committees that the out-year estimates of departmental operating
expenses that MDOT incorporates in TTF forecasts be inflated, at a minimum, by a rate equal
to the 5-year average annual increase in operating expenses experienced during the period
ending with the most recently completed fiscal year.