Embed Size (px)
Citation preview
September – 2015
EUR 27738 EN
MaRVEN – Environmental Impacts of Noise, Vibrations and Electromagnetic Emissions from Marine Renewable Energy
RTD-KI-NA-27-738-EN-N
Final study report

EUROPEAN COMMISSION
Directorate-General for Research and Innovation Directorate G — Energy Unit G3— Renewable energy sources Contact: Matthijs Soede
E-mail: [email protected] [email protected]
European Commission B-1049 Brussels

EUROPEAN COMMISSION
MaRVEN – Environmental Impacts of Noise, Vibrations and Electromagnetic Emissions from Marine Renewable Energy
RTD- KI-NA-27-738-EN-N
Final study report

LEGAL NOTICE
This document has been prepared for the European Commission however it reflects the views only of the authors, and the Commission cannot be held responsible for any use which may be made of the information contained therein. More information on the European Union is available on the internet (http://europa.eu). Luxembourg: Publications Office of the European Union, 2015. PDF ISBN 978-92-79-54977-9 ISSN 1831-9424 Doi:10.2777/272281 EUR 27738 © European Union, 2016. Reproduction is authorised provided the source is acknowledged.
EUROPE DIRECT is a service to help you find answers to your questions about the European Union
Freephone number (*): 00 800 6 7 8 9 10 11
(*) The information given is free, as are most calls (though some operators, phone boxes or hotels may charge you)

This report has been prepared under the DHI Business Management System certified by Bureau Veritas to comply with ISO 9001 (Quality Management)
Approved by
Approved by

MaRVEN – Environmental Impacts of Noise, Vibrations and Electromagnetic Emissions from Marine Renewable Energy
Final study report
September 2015
Prepared for European Commission, Directorate General for
Research and Innovation
Project manager Frank Thomsen
Quality supervisor Andreas Brogaard Buhl
Authors Frank Thomsen, Andrew Gill, Monika Kosecka, Mathias Andersson, Michel Andre,
Steven Degraer, Thomas Folegot, Joachim Gabriel, Adrian Judd, Thomas Neumann, Alain
Norro, Denise Risch, Peter Sigray, Daniel Wood, Ben Wilson


iii
CONTENTS
Abstract ...................................................................................................................................... 7
Executive Summary ...................................................................................................................... 9 English ....................................................................................................................................................... 9 French ..................................................................................................................................................... 15
Glossary .................................................................................................................................... 22
Acronyms .................................................................................................................................... 23
1 Introduction ............................................................................................................... 25 1.1 Aim of the study ........................................................................................................................... 25 1.2 Project team ................................................................................................................................. 25 1.3 Structure of the report .................................................................................................................. 26 1.4 Risk based approach to reviews .................................................................................................. 26
2 Historical review of the publications related to environmental impacts of
marine renewable energy devices ........................................................................... 28 2.1 Introduction .................................................................................................................................. 28 2.1.1 Background .................................................................................................................................. 28 2.1.2 Device types ................................................................................................................................. 28 2.2 Environmental effects and receptors ........................................................................................... 29 2.2.1 Overview of effects and receptors ............................................................................................... 29 2.2.2 Habitat loss and change .............................................................................................................. 30 2.2.3 Attraction affects .......................................................................................................................... 31 2.2.4 Injury and mortality effects ........................................................................................................... 31 2.2.5 Avoidance, displacement and barrier effects ............................................................................... 32 2.2.6 Contamination effects .................................................................................................................. 32 2.3 Prioritisation ................................................................................................................................. 32 2.3.1 Prioritisation rationale .................................................................................................................. 32 2.3.2 Ecosystem based prioritisation of issues ..................................................................................... 33
3 Environmental impacts of noise and vibrations during installation and
operation of MREDS .................................................................................................. 36 3.1 Introduction and scope ................................................................................................................. 36 3.2 Exposure assessment .................................................................................................................. 36 3.3 Dose-response assessment ........................................................................................................ 36 3.3.1 MRED sound emissions and hearing in marine organisms ......................................................... 36 3.3.2 Effects of construction of MRED .................................................................................................. 37 3.3.3 Effects of operation of MRED ...................................................................................................... 37 3.4 Risk management ........................................................................................................................ 37 3.5 Vibrations ..................................................................................................................................... 38 3.6 Assessment of state of knowledge .............................................................................................. 38

iv
4 Environmental impacts of electromagnetic emissions during operation of
MREDs ....................................................................................................................... 40 4.1 Introduction to EMF...................................................................................................................... 40 4.2 General awareness in Europe ..................................................................................................... 40 4.3 Exposure assessment ................................................................................................................. 40 4.4 Dose-response assessment ........................................................................................................ 41 4.5 Risk management ........................................................................................................................ 41 4.6 Assessment of state of knowledge .............................................................................................. 41
5 Current norms and standards related to underwater noise................................... 43 5.1 Introduction and scope ................................................................................................................ 43 5.2 Standards applied in relevant EU member states ....................................................................... 43 5.3 Standards in nomenclature .......................................................................................................... 44 5.4 Standards in data collection ......................................................................................................... 45 5.4.1 Construction phase ...................................................................................................................... 45 5.4.2 Operational phase........................................................................................................................ 45 5.4.3 Ambient noise .............................................................................................................................. 46 5.5 Standards in data analysis ........................................................................................................... 46 5.5.1 Construction phase ...................................................................................................................... 46 5.5.2 Operational phase........................................................................................................................ 46 5.6 Additional standards .................................................................................................................... 47 5.7 Assessment of state of knowledge .............................................................................................. 47
6 On-site measurements field experiments ............................................................... 49 6.1 Introduction and scope ................................................................................................................ 49 6.2 Measurement priorities ................................................................................................................ 49 6.3 Methodology ................................................................................................................................ 52 6.3.1 Existing data ................................................................................................................................ 52 6.3.2 Field measurements .................................................................................................................... 52 6.3.3 Belgium OWF Operation .............................................................................................................. 53 6.3.4 Lysekil WAVE Operation ............................................................................................................. 53 6.3.5 Kishorn WAVE Operation ............................................................................................................ 54 6.3.6 Isle of Wight TIDAL Operation ..................................................................................................... 54 6.3.7 S.E. North Sea OWF Construction .............................................................................................. 54 6.4 Results ......................................................................................................................................... 55 6.4.1 Existing data ................................................................................................................................ 55 6.4.2 Belgium OWF Operation - sound ................................................................................................. 55 6.4.2.1 Weather during field work ............................................................................................................ 55 6.4.2.2 Sound pressure recordings at jacket and monopile turbines and transformer ............................ 55 6.4.2.3 Measurement of particle motion at jacket and monopile turbines and transformer ..................... 56 6.4.2.4 Measurement of sound pressure at monopile turbines for different sea states .......................... 57 6.4.3 Belgium OWF Operation - EMF ................................................................................................... 57 6.4.3.1 Measurement of fields from turbines and infield cables at the wind farms .................................. 57 6.4.3.2 Measurement of fields from infield and export cables at the Northwind’s transformer
station .......................................................................................................................................... 57 6.4.4 Lysekil WAVE Operation ............................................................................................................. 58 6.4.5 Kishorn WAVE Operation ............................................................................................................ 58 6.4.6 UK Tidal Operation ...................................................................................................................... 58 6.4.7 S.E. North Sea OWF construction ............................................................................................... 59 6.5 Risk modelling .............................................................................................................................. 59 6.6 Underwater sound measurements from the FINO1 platform, North Sea, Germany ................... 61 6.7 Overview of the field measurement campaign ............................................................................ 62 6.7.1 Key findings – Sound ................................................................................................................... 62 6.7.2 Key findings – EMF ...................................................................................................................... 63
v
7 Research Priorities .................................................................................................... 64 7.1 Noise and vibration ...................................................................................................................... 65 7.1.1 Key draft research priorities ......................................................................................................... 65 7.1.2 Other key knowledge gaps .......................................................................................................... 66 7.2 Electromagnetic fields .................................................................................................................. 67 7.2.1 Key draft research priorities ......................................................................................................... 68 7.2.2 Other key knowledge gaps .......................................................................................................... 68 7.3 Standards ..................................................................................................................................... 69 7.3.1 Key draft research priorities ......................................................................................................... 69
8 Conclusions ............................................................................................................... 70
9 Acknowledgements ................................................................................................... 71
10 Literature ................................................................................................................... 72
FIGURES Executive Summary figure 1 Overview of the main tasks of the study. ....................................................... 10 Figure 1-1 Overview of the risk-based approach (from Boyd et al. 2008; see also WODA 2013). ............... 27 Figure 2-1 The most common foundation types to date ((a) monopile, (b) tripod / lattice, (c) gravity
bases / caissons, (d) floating structures; source: A. Judd, Cefas). .............................................. 29 Figure 2-2 Potential effect - receptor interactions. ........................................................................................ 30 Figure 2-3 Prioritisation of Environment Effects from Offshore Renewables ................................................ 33 Figure 6-1 Ambient noise assessed in summer 2014 (top left); broadband noise footprint of a 5.2m m
diameter single pile-driving strike in the summer season (top right); cumulative emergence of the operational noise above the 50th percentile (median) of the baseline ambient noise in summer for low wind speeds in the 5 to 80 Hz bandwidth (bottom). The white areas are places where the noise from commercial shipping dominates the noise from the MRED project at least half of the time. .......................................................................... 61
TABLES Executive Summary table 1 Final site details where measurements were completed. ................................ 12 Table 6-1 Overview of priorities for measurements and available team data on sound, vibrations and
EMF with regards to marine renewable energy devices during the construction phase (colour codes = priorities for field measurements; green = high orange = medium, red = not applicable / low). .................................................................................................................... 50
Table 6-2 Overview of priorities for measurements and available team data on sound, vibrations and EMF with regards to marine renewable energy devices during the operation phase (colour codes = priorities for field measurements; green = high, orange = medium, red = not applicable / low). .......................................................................................................................... 51
Table 6-3 Final site details where measurements were completed. ............................................................ 53 Table 6-4 Extracted results of the sound pressure measurements at the two wind parks farms
Northwind (monopile) and C-Power (jacket). ............................................................................... 56
vi
ANNEXES ANNEX 1 WP1 literature review ANNEX 2 WP1 literature review – technical annex ANNEX 3a WP1 database ANNEX 3b WP1 database instructions ANNEX 4 WP2 literature review ANNEX 5 WP2 vibration impacts ANNEX 6 WP3 literature review ANNEX 7 WP4 literature review ANNEX 8 WP5 final report Annexes available upon request.
7
Abstract
English
The construction and operation of marine renewable energy developments (MREDs) will lead to, among other things, the emission of electromagnetic fields (EMF), underwater sound, and vibrations into the marine environment. Knowledge on these pressures and associated effects has been increasing over the past decade. Yet, many open questions with regard to the potential for MRED to impact on marine life remain. These information gaps pose challenges to the planning and deployment of MREDs. To address this, the European Union (EU) Commission, Directorate-General for Research and Innovation commissioned a study of the environmental effects of noise, vibrations and electromagnetic emissions from MREDs (Marine Renewable Energy, Vibration, Electromagnetic fields and Noise - MaRVEN). MaRVEN provides a review of the available literature related to environmental impacts of marine renewable energy devices and an in-depth analysis of studies on the environmental effects of noise, vibrations and electromagnetic emissions during installation and operation of wind, wave and tidal energy devices. The current norms and standards related to noise, vibrations and EMF were reviewed. On-site measurements and field experiments to fill priority knowledge gaps and to validate and build on the results obtained in reviews were undertaken. Finally, we outline a programme for further research and development with justified priorities.
French
La construction et l'exploitation des énergies marines renouvelables (MREDs) sont, entre autres choses, générateurs d’ondes électromagnétiques (CEM), acoustiques sous-marines, et de vibrations dans le milieu marin. Les connaissances sur ces pressions et leurs effets associés ont augmenté au cours de la dernière décennie. Pourtant, de nombreuses questions relatives à l'impact des MREDs sur la faune marine subsistent. Ces lacunes de connaissance posent des défis à la planification et au déploiement de MREDs. Pour y remédier, l'Union européenne (UE), la Direction générale de la recherche et de l'innovation a commandé une étude sur les effets environnementaux du bruit, des vibrations et des émissions électromagnétiques provenant de MREDs (Energies Marines Renouvelables, vibrations, champs électromagnétiques et bruit - MaRVEN). MaRVEN fournit un examen de la littérature disponible concernant les impacts environnementaux des dispositifs d'énergies renouvelables marines et une analyse en profondeur des études sur les effets environnementaux du bruit, des vibrations et des émissions électromagnétiques lors de l'installation et de l’exploitation de systèmes éoliens offshore, hydrolien et houlomoteur. Les normes et standards actuels relatifs aux émissions de bruit, de vibrations et d’ondes électromagnétiques ont été examinés. Des mesures sur site ont été mises en œuvre afin d’une part de combler les lacunes de connaissances, et d’autre part de valider les résultats identifiés par la revue bibliographique. Enfin, les efforts qu’il reste à réaliser dans le futur en terme de recherche et développement ont été identifiés et priorisés sous la forme d’un plan stratégique argumenté.

8
9
Executive Summary
English
Background
In Europe and beyond, there are ambitious plans for marine renewable energy developments (MREDs), i.e. wind- wave and tidal power devices. The construction and operation of MREDs will lead to, among other things, the emission of electromagnetic fields (EMF), underwater sound and vibrations into the marine environment. Understanding of EMF emissions from MREDs is limited and studies on potential impacts – for example on migratory fish - are in its infancy. Underwater sound impacts from MREDs have become a particularly important environmental issue. This is because water is an excellent medium for sound transmission. As a consequence, many forms of marine life use sound as their primary mode of communication, to locate a mate, search for prey, avoid predators and hazards, and for short- and long-range navigation. Activities generating underwater sound can affect these vital life functions and, since sound can be far ranging, the spatial scale of impacts can be quite large as well. Research has shown that some species such as the harbour porpoise are very sensitive to disturbance due to windfarm construction sound. It is also possible that construction sound could lead to temporary or even permanent hearing loss in marine mammals and fish, depending on the overall sound energy (the ‘acoustic dose’) that is received over time. Yet, there are many open questions with regard to impacts of MRED related sound and vibration on marine life. These information gaps pose challenges to the implementation of MREDs, one such as the determination of monitoring requirements and risk assessment for prioritised receptor animals.
Scope
In a project for the European Union (EU) Commission, Directorate-General for Research and Innovation, we undertook a study of the environmental impacts of noise, vibrations and electromagnetic emissions from MREDs (Marine Renewable Energy, Vibration, Electromagnetic fields and Noise - MaRVEN). The aims of MaRVEN were to critically review the available scientific evidence and significance of those impacts and then make recommendations on solutions to mitigate or cancel any identified negative impacts. The investigation comprised several tasks including:
• Provision of an historical review of the publications related to environmental impacts of marine renewable energy developments
• An in-depth analysis of studies on the environmental impacts of noise and vibrations during installation and operation of marine renewable energy devices
• An in-depth analysis of studies on the environmental impacts of electromagnetic emissions during the operation of marine renewable energy devices
• An in-depth analysis of the current norms and standards related to noise, vibrations and EMF for marine renewable energy systems
• Performance of relevant on-site measurements and field experiments to validate and build on the results obtained in above studies

10
Team
In order to undertake the monitoring, DHI and Cranfield University assembled a team of nine institutions from six EU member states namely:
• Centre for Environment, Fisheries and Aquaculture Science (Cefas), UK • Totalförsvarets forskningsinstitut (FOI), Sweden • Scottish Association of Marine Science (SAMS), UK • Deutsches Wind Energie Institut (DEWI), Germany • Royal Belgian Institute of Natural Sciences (RBINS) - Operational Directorate Natural
Environment (OD Nature), Belgium • Universitat Politècnica de Catalunya (UPC) - Laboratori d'Aplicacions Bioacústiques, Spain • Quiet Oceans (QO), France
The assembled team comes from EU countries leading on the implementation of marine renewable energy and comprises leading expertise on all topics required for this assignment. Furthermore, it counts six members of the EU Task Group on Underwater Noise and other Forms of Energy (TGN) within its ranks that are directly involved in advice and recommendations with regard to the implementation of the noise descriptor 11 of the Marine Strategy Framework Directive. Thus, not only does the team cover the science but also the necessary policy background of this study.
Method
In order to meet the complex objectives of the project, our work was managed under six key areas:
Executive Summary figure 1 Overview of the main tasks of the study.
11
Results
Historical review of environmental impacts of MRED The database for the literature on impacts of marine renewables energy devices (MREDs) on marine life comprises more than 1,200 sources. The database has a search engine with initial searches based on broad topics and available author names.
We also present a historical review of publications related to the environmental effects of MREDs. Here, the full ranges of impacts are considered. The review provides a summary of all possible impact pathways and biological receptors and analyses effects together with the prioritisation of the various environmental effects of marine renewable energy devices due to their effects at a population or ecosystem level.
In-depth analysis of studies on effects of noise and vibration The main conclusions were that elements of the exposure assessment (i.e. the description of the sources of sound for MREDs and the calculation of the sound exposure) have made major progress since the time of previous benchmark reviews (i.e. Thomsen et al. 2006). In general, it is clear that sound produced during construction of MREDs has the greatest potential for conflict with marine life while operational sound has been much less of a concern. With regard to the dose-response assessment, knowledge has been gained on the behavioural response mainly due to construction of MREDs in a few species (i.e. harbour porpoises, harbour seals, and some fish (cod, sole, and mackerel) either in the field or in laboratory. Yet, results on effects on other species and taxa are very sparse or non-existent. Finally, much progress has been made with regard to risk mitigation especially for impact pile driving. A paper on vibration including the definition of the term ‘vibration’ against the use of ‘sound’ and ‘particle motion’ was commissioned outside the MaRVEN team to the Institute for Sound and Vibration, University of Southampton. Here, a working definition was adopted with ‘sound’ as a vibration existing in a fluid, and ‘vibration’ the energy propagating through wave motion in a solid. This distinction is important for impact assessments as marine life in the water column will mainly experience ‘sound’ (measured as pressure and particle motion), whereas life forms on the ground (for example flatfish) will likely experience both, and those organisms living in the sediment will receive vibrations. Yet, the exact amount of vibration on the seafloor, resulting from construction and operation, is not known and it is transferred in to the water column as sound. It is currently not clear if vibrations will lead to any measurable or significant impacts on bottom living marine life.
In-depth analysis of studies on effects of electromagnetic emissions It is known that several taxonomic groups inhabiting European waters are sensitive to EMF. There are large gaps in understanding the response of these animals to the EMFs and hence any impact of the field generated by MREDs. Field based experimental studies should be conducted to determine the field strength from MREDs in different locations and with different device types and associated hardware. The most likely effects are currently considered as being related to attraction or avoidance of the EMF associated with cables connected to MREDs as the few studies of existing subsea cables of similar design and characteristics have indicated such responses. Studies on the behavioural reactions of different species specifically in relation to different MRED EMF contexts are currently lacking. Early life stages and the potential effects of EMF on their development suggest that some species may be affected, whereas others are not. Whether there are any biologically relevant implications for the sensitive species’ populations cannot be determined. The consequence is that no governmental or commercial incentives exist to infer regulations, there are no standards or guidelines for assessing and measuring EMF developed to date and no perceived requirement for mitigation measures. Indirectly. some potential mitigation of EMF effects has occurred as the result of technical and economic considerations, which change the intensity or range of emission and hence reduce the potential for exposure of receptors. The general void of knowledge and insufficient data is presently the main reason for the uncertainty around EMFs and consequently the passivity of managers as well as the commercial sector to engage with the environmental questions that arise related to EMF.

12
In-depth analysis of current norms and standards The literature review presents an in-depth analysis of the current norms and standards related to noise, vibrations and EMF for MREDs. The review outlines the currently leading standards as developed in Germany, the Netherlands and the UK and compares it with regard to the methods prescribed for data collection (construction and operation of MREDs) during construction and operation. Finally, the standards are critically assessed.
On site measurements and field experiments analysis The primary objective was to collect field data to fill priority gaps in the knowledge base. The sites where the field measurements were to be conducted represented the three main marine renewable energy sources, namely wind, wave and tidal power.
Five sites provided the data for meeting the objectives of the field studies.
Executive Summary table 1 Final site details where measurements were completed.
Device type Phase Site Data recorded
Wind Operation Belgian wind farms Sound pressure Particle motion EMF
Wind Construction S.E. North Sea Particle motion Wave Operation Lysekil, Sweden Sound pressure
Particle motion
Wave Operation Kishorn, Scotland Sound pressure Tidal Operation Isle of Wight, England Sound pressure
Key findings – sound
The measurements at the Belgian wind farms were the first of their kind to simultaneously measure sound pressure, particle motion and EMF. The important results were that particle motion is measurable from an OWF turbine and that it was lower at the jacket-based turbine compared to the steel monopole; this corresponds with the sound pressure measurements, where monopiles emitted higher sound levels than jacket foundation turbines.
At the Swedish wave site we also simultaneously measured particle motion (PM) and sound pressure from a wave energy converter. The levels of particle motion were low but from a fish receptor PM would be detectable at 23 m for wave heights up to 2 m. Interestingly, levels of sound pressure were below hearing threshold at 23 m for fish for wave heights up to 2 m.
The Scottish wave site showed a negligible effect of the single wave device sound to the overall soundscape at 400 m distance (this large recording distance was chosen due to logistical considerations since the developer originally intended to increase the array size), hence it was concluded that any addition to the soundscape by the device would likely be small. The recorded ambient sound pressure levels were consistent with weather related events, local shipping sound, as well as dominated by the continuous contribution of Acoustic Deterrent Devices (ADDs) deployed on several fish farm cages in the area. Hence, there is no predicted effect of the sound emitted by the wave device on receptor species in the area at the distance measured (400 m and above). Whether levels of sound emitted by the device(s) at closer range are within the range of hearing of receptor species is unknown but based on our study they would be much localised.
Wave devices function in very different ways and one measurement at one device cannot describe the sound from other designs. More measurements of both sound pressure and particle motion relating to various designs are necessary in order to determine the way that sound pressure and particle motion are generated at biologically relevant levels.

13
The maximum sound level in terms of particle motion remains to be described for any wave energy device. Future measurements should be undertaken under a variety of weather and wave conditions, since variable wave heights may change the interactions and potential sound generation of sound emitting components of the devices.
Finally, sound pressure and particle motion levels should be compared between single devices and arrays of different sizes to evaluate possible cumulative sound generation.
For the measured tidal device (turbines mounted on a mid-water platform) a distinct step-wise frequency modulated tonal sound signature (mainly between 1 – 2.5 kHz), was apparent, which matched the acoustic signature produced by the two turning turbines. Within 150-400 m of the device sound pressure levels were elevated by as much as 10-15 dB as compared to baseline ambient noise levels.
Given the frequency distribution of the recorded turbine signature and sound levels above ambient noise at a given range, it is possible that the turbines could be detected by harbour porpoises, although the main energy of the turbine sound is emitted at the lower end of their hearing sensitivity, although it can be audible for pinnipeds that are more sensitive to low frequency sound. Some fish species, such as herring, will likely be able to hear the signal, as their hearing extends beyond 1 kHz, while other low frequency specialists, like cod may be able to detect the recorded lower frequency sounds produced by the turbines.
Key Findings – EMF
Electric and magnetic fields from industry standard inter-array and export electricity cables were clearly measurable during power generation by offshore wind turbines. The EM field emitted by a wind turbine was considerably weaker than the field from the cables.
The emitted EMFs were higher for the export cables to shore compared to the inter-turbine cables, which were predicted, based on the amount of power being transmitted and the lower electrical capacity rating of the cables.
Of the two components making up the EMF (E fields and B fields) of the AC cables studied, the electric fields measured were within the range of known detection by sensitive receptor species (principally the sharks, skates and rays). The magnetic field component was however at the lower end and potentially outside of the known detectable range of sensitive species.
Two different methods to measure EMF were trialled, drifting and sledge towing. The drifting method has the advantage that it can assess the EMF relatively quickly and it avoids the potential risk of damaging the sensors on the seabed. The seabed sledging demonstrated that the EMF at the seabed, where cables are buried, can be measured as well as the propagation distance if the sledge is pulled perpendicular to the axis of the cable.
The measurement technology was proven and demonstrates that components of the EM fields at biologically relevant levels can be observed both by suspending the sensors from the side of a boat as well as by sledging. The results are restricted to AC-transmission systems and are transferable between device types using cables of similar characteristics. The same methodologies should be employed on a DC-transmission system.
Programme of further research and development An important output of MaRVEN was to determine the priorities for further research following the reviews and field studies. Here we present the research priorities together with justifications for the proposed recommendations.
For noise and vibration, one of the most urgent topics in Europe is to properly determine the impact of impulsive sound on marine species. Unfortunately, we are lacking understanding of the displacement effects and thus its impact at the population level. The research priorities should take into account that the European waters are diverse and that whilst one strategy will
14
ensure a focus on key topics it will most probably not be sufficient or it will need combinations of different research activities that may need to be adapted to local circumstances.
The key research priorities that we suggest fit with respective risk assessment categories and should focus on, in rank order:
• Dose-response assessment: Pile driving effects on invertebrates and fish species of commercial, conservation and/or key to ecosystem function (e.g. herring, cod) and investigation of whether effects translate to population level consequences (e.g. displacement or altered movement patterns).
• Dose-response assessment: Pile driving sound effect on baleen whales (e.g. minke whales) but only in areas where wind farms spatially overlap with the distribution range of the taxa.
• Exposure assessment: Sediment vibration due to construction of MRED
For electromagnetic fields, the literature review clearly demonstrated that there are significant gaps in knowledge about EMF. At present, there is a pervading attitude that the knowledge base is so poor that it is not worth considering. Our opinion is that by ignoring EMF effects on marine animals the marine renewable energy sector is missing a key opportunity to demonstrate best practice in responsibility (much in the same way as pile-driving mitigation highlights developer responsibility during construction based on best understanding). In a similar way, if EMF studies are undertaken that demonstrate no significance of interaction with receptor animals then decisions can be made to reduce unnecessary environmental monitoring, however if there is some significant effect then we should mitigate appropriately.
In light of the state of knowledge, we suggest that studies should focus on, in rank order of priority: • Dose-response assessment: Establish the response of key marine species at their most
sensitive stages of life to exposure to a range of EMFs (sources, intensities predicted from MREDs).
• Dose-response assessment: Field experiments (e.g. tracking studies) on the potential for cumulative impacts from multiple cables in relation to movement/migratory behavior of EMF receptor species.
• Exposure assessment: Develop affordable techniques for measuring electromagnetic fields so as to validate EMF predictions within models, including consideration of scaling up of findings for large devices and higher rating cables in the future.
With regard to standards the key research priorities at this stage are:
• Determination of the parameters influencing the reproducibility of underwater sound measurements (e.g. measurement depth)
• Definition and validation of input parameters for existing propagation models, especially for shallow water regions, including validation of results using empirical data
• Enhancement of near field / source modelling methods for MREDs and validation of results
The specific research undertaken should ensure that it has the wider consideration of improvement and application to unification of national / EU standards and requirements.
Conclusions
Through structured reviews of key topics, field studies to address key knowledge gaps and an assessment of the findings in a risk assessment framework, the MaRVEN project has been able to consolidate our understanding of underwater noise, vibration and EMF as a result of MREDs construction and operation, and provide a set of research priorities that we suggest will be beneficial to the industry, regulatory and scientific sectors in reducing potential blockages to the promotion and deployment of MREDs. It also provides a focus on which future research should be prioritised to further enable the MRED sector advance.
15
French
Contexte
En Europe et ailleurs, il existe des plans ambitieux pour l’exploitation d’énergies renouvelables marins, visant à la construction de systèmes électrogènes exploitant le vent, la houle et la marée (MREDs = Marine Renewable Energy Developments). La construction et l'exploitation de MREDs conduiront, entre autres choses, à la génération de champs électromagnétiques (CEM), à la génération de bruits sous-marins et à des vibrations dans le milieu marin. La compréhension des émissions de CEM des MREDs est limitée et les études sur les impacts potentiels – par exemple sur les poissons migrateurs – sont à leurs balbutiements. L’impact sur l’acoustique sous-marine des MREDs est devenu une question particulièrement importante pour l'environnement. En effet, l'eau est un excellent milieu pour la transmission du son. En conséquence, de nombreuses formes de vie marine utilisent le son comme leur principal mode de communication, pour localiser un partenaire, pour la recherche d'une proie, pour éviter les prédateurs et d’autres dangers, et pour la navigation à courtes et à longues distances. Les activités génératrices de sons sous-marins peuvent affecter ces fonctions vitales et, puisque le son peut aller loin, l'échelle spatiale de l'impact peut être grande. La recherche a montré que certaines espèces comme le marsouin commun sont très sensibles aux perturbations dues aux sons produits pendant la construction des éoliennes. Il est également possible que le son dû à la construction pourrait conduire à une perte auditive temporaire ou même permanente chez les mammifères marins et les poissons, en fonction de l'énergie sonore globale (la « dose acoustique ») qui est reçue au fil du temps. Pourtant, il y a beaucoup de questions ouvertes en ce qui concerne l’impact des MREDs sur la faune marine en termes de sons et vibrations. Ces lacunes d'information posent des défis à la mise en œuvre des MREDs, l’un étant la spécification des exigences de surveillance et de l'évaluation des risques pour des animaux réceptifs priorisés.
Portée
Dans un projet pour la Commission de l'Union européenne (UE), Direction générale de la recherche et de l'innovation, nous avons effectué une étude sur les impacts environnementaux du bruit, des vibrations et des émissions électromagnétiques provenant des MREDs (énergies marines renouvelables, vibrations, champs électromagnétiques et le bruit – MaRVEN). Les objectifs de MaRVEN étaient d’effectuer une revue critique des données scientifiques disponibles et ensuite de donner des recommandations de solutions visant à atténuer ou annuler les effets négatifs identifiés. L'enquête s’est décomposée en plusieurs tâches, y compris:
• La fourniture d'un examen bibliographique des publications liées aux impacts environnementaux du déploiement d'énergies marines renouvelables (MREDs)
• Une analyse en profondeur des études sur les impacts environnementaux du bruit et des vibrations lors de l'installation et de l’exploitation des dispositifs d'énergies marines renouvelables
• Une analyse en profondeur des études sur les impacts environnementaux des émissions électromagnétiques pendant l’exploitation des dispositifs d’énergies marines renouvelables
• Une analyse en profondeur des normes et standards actuels relatifs aux émissions de bruit, aux vibrations et aux EMF applicables aux systèmes d'énergies marines renouvelables
• Mise en œuvre de mesures pertinentes sur site et d’expériences pratiques pour valider et développer les résultats identifiés par les analyses ci-dessus.

16
L’équipe
Afin de mener à bien cette mission, l'Université de Cranfield et DHI ont réuni une équipe de neuf institutions dans six Etats membres de l'UE, à savoir :
• Centre pour l'Environnement, la Pêche et l'Aquaculture (CEFAS), Royaume-Uni • Totalförsvarets forskningsinstitut (FOI) (Institut National de Recherche pour la Défense), en
Suède • Association écossaise des sciences marines (SAMS), Royaume-Uni • Deutsches Wind Energie Institut (DEWI) (Institut Allemand de l’Energie Eolienne),
Allemagne • Institut royal des sciences naturelles de Belgique (IRSNB) – Direction opérationnelle de
l'environnement naturel (OD Nature), en Belgique • Université Polytechnique de Catalogne (UPC) - Laboratoires d’Applications Bioacoustiques,
Espagne • Quiet Oceans (QO) (Océans Calmes), France
Cette équipe provient de pays UE de premier rang en ce qui concerne la construction de dispositifs d’énergies renouvelables marines et dispose d'une expertise de pointe sur tous les sujets nécessaires pour cette mission. En outre, l’équipe compte six membres du Groupe de Travail de l'UE sur le bruit sous-marin et autres formes d'énergie (TGN). Ces membres sont directement impliqués dans le conseil et les recommandations pour la mise en œuvre du descripteur de bruit 11 de la directive-cadre sur la stratégie marine. L'équipe couvre ainsi non seulement le contexte scientifique, mais aussi le contexte politique nécessaire pour cette étude.
Méthode
Afin de répondre aux objectifs complexes du projet, notre travail a été géré sous six domaines clés :
Revue historique des impacts environnementaux des dispositifs d'énergies renouvelables marines
Analyse approfondie des études sur les effets du bruit et des vibrations des dispositifs d’énergies renouvelables marines
Analyse approfondie des normes et standards actuels concernant le bruit, les vibrations et les émissions électromagnétiques
Analyse approfondie des études sur les impacts dus aux émissions électromagnétiques des dispositifs d’énergies renouvelables marines
Enregistrements sur site et expériences
Programme de recherche et développement dans le futur
Executive Summary figure 1 Aperçu des principales tâches de l'étude
Résultats
Revue historique des impacts sur l’environnement dus aux MRED La base de données bibliographique sur les impacts dus aux dispositifs d’énergies renouvelables marines (MREDs) sur la faune marine comprend plus de 1200 sources. La base de données dispose d'un moteur de recherche avec des recherches initiales basées sur les grands thèmes et les noms des auteurs disponibles.
Nous présentons également une revue historique des publications liées aux effets environnementaux des MREDs. Ici, tous les impacts sont considérés. L'examen fournit un
17
résumé de toutes les voies possibles d'impact et des récepteurs biologiques ainsi y analyse des effets environnementaux priorisés en raison de leurs effets au niveau de la population ou d'un écosystème.
Analyse approfondie des études sur l’impact dû au bruit et aux vibrations Les principales conclusions de l’étude bibliographique sont que la description des sources du bruit et le calcul de l'exposition au bruit ont fait grands progrès depuis l'époque des revues de référence antérieures (à savoir Thomsen et al 2006). En général, il apparaît que le bruit produit lors de la construction des MREDs a un grand potentiel d’impact sur la faune marine tandis que le bruit émis lors de l’exploitation des MREDs donne lieu à moins de préoccupation ; les données disponibles sont toutefois limitées. En ce qui concerne l'évaluation dose-réponse, la connaissance a été acquise pour un nombre restreint d’espèces (à savoir marsouins communs, phoques et poissons (cabillaud, sole, maquereau)), soit sur site soit en laboratoire ; ceci concerne la réponse comportementale due principalement à la construction des MREDs). Les résultats concernant d’autres espèces et taxons sont très rares ou inexistants. Enfin, beaucoup de progrès a été fait en ce qui concerne l'atténuation des risques en particulier de l’impact dû au battage (de pieux). Une étude sur les vibrations a été commandée à l'Institut pour le Son et les Vibrations, Université de Southampton, hors de la présente étude assurée par l'équipe MaRVEN. Cette étude a inclus une recherche de la définition du terme « vibration » contre les termes « son » et « mouvements de particules ». Ici, une définition de travail a été adoptée avec « son » comme une vibration existante dans un fluide, et « vibrations » comme l'énergie se propageant dans un solide par un mouvement d’ondes. Cette distinction est importante pour les évaluations d'impact, étant donné que la faune marine dans la colonne d'eau ressentira principalement le « son » (mesuré par la pression et le mouvement de particules), tandis que les formes de vie sur le fond marin (par exemple des poissons plats) connaîtront probablement les deux, et les organismes vivant dans les sédiments recevront des vibrations. Cependant, la quantité exacte de vibrations sur le fond marin résultant de la construction et de l’exploitation de MREDs n’est pas connue et les vibrations sont transférées dans la colonne d'eau en tant que son. Il n’est actuellement pas clair si les vibrations vont conduire à des impacts mesurables ou importants sur la faune sur les fonds marins
Analyse approfondie des études sur l’impact dû aux émissions électromagnétiques On sait que plusieurs groupes taxonomiques vivant dans les eaux européennes sont sensibles aux champs électromagnétiques. Il y a de grandes lacunes dans la compréhension de la réponse de ces animaux aux champs électromagnétiques et donc aussi dans la compréhension de l’impact du champ généré par les MREDs sur ces animaux. Des études expérimentales sur site devraient être menées afin de déterminer l'intensité des CEM émis par les MREDs dans des endroits différents et avec différents types de dispositifs et matériel associés aux MREDs. Les effets les plus probables sont actuellement considérés comme étant liés à l'attraction ou l'évitement des CEM associé avec des câbles reliés à MREDs. Des études sur les réactions comportementales des différentes espèces par rapport aux CEM émis par les MREDs font actuellement défaut. Les premiers stades de vie et les effets potentiels des CEM sur leur développement suggèrent que certaines espèces peuvent être affectées, tandis que d'autres ne le seraient pas. On ne peut pas déterminer s’il y a des implications biologiquement pertinentes pour les populations des espèces sensibles, ce qui a pour conséquence qu’aucunes incitations gouvernementale/commerciale existent pour imposer des règlements et des mesures d'atténuation. Une certaine atténuation potentielle des impacts dus aux CEM a eu lieu indirectement à la suite de considérations techniques et économiques. A ce jour il n’existe ni des normes ni des standards pour la méthodologie de mesure. L’absence générale de connaissances et de données suffisantes est actuellement la principale raison de l'incertitude entourant les CEM ; la conséquence de cette incertitude est une passivité des gestionnaires et du secteur commercial à s’engager avec les questions d'environnement qui se posent liées aux CEM.
18
Analyse approfondie des normes et des standards actuels L’examen de la littérature présente une analyse en profondeur des normes et standards actuels liés au bruit, aux vibrations et aux CEM pour les MREDs. L’examen présente les principales normes actuellement développées en Allemagne, aux Pays-Bas et au Royaume-Uni et les compare en ce qui concerne les méthodes prescrites pour la collecte des données (la construction et l'exploitation des MREDs) pendant la construction et le fonctionnement. Enfin, une revue critique des standards a été faite.
Mesures sur site et analyse des expériences L'objectif principal était de recueillir des données sur site pour combler les lacunes prioritaires dans la base de connaissances. Les sites où les campagnes de mesures devaient être menées représentent les trois principales sources d'énergies marines renouvelables, à savoir le vent, les vagues et l'énergie marémotrice.
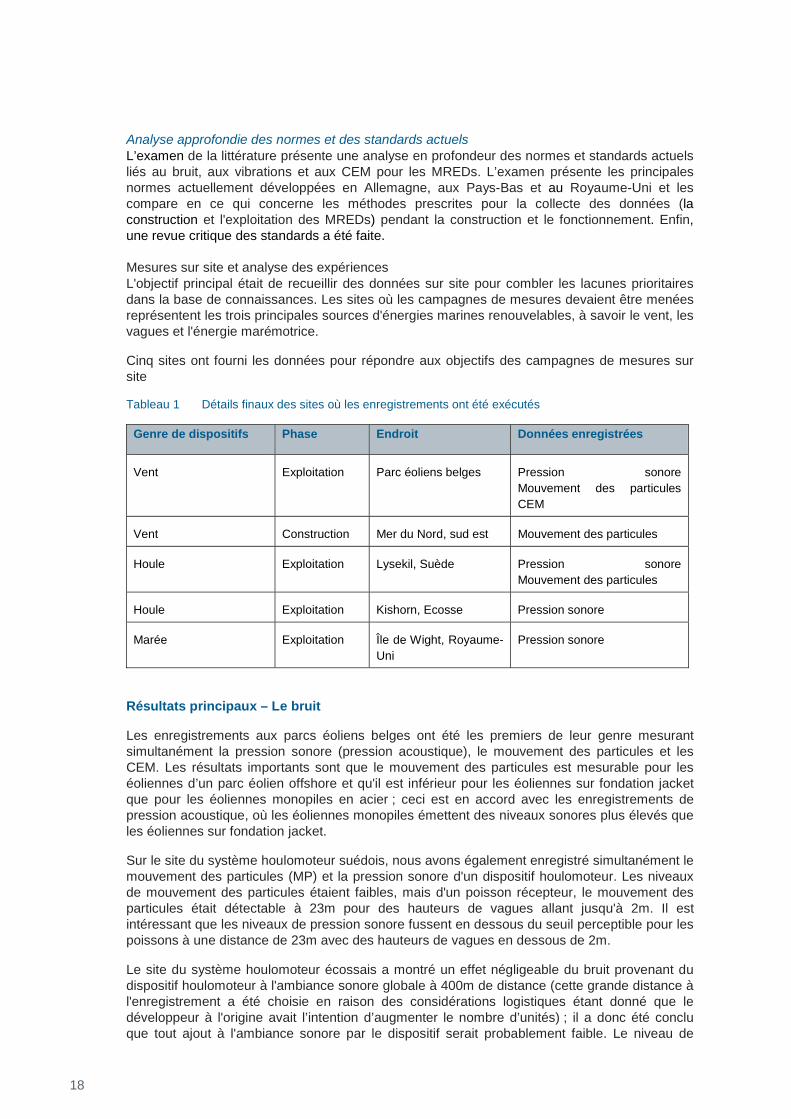
Cinq sites ont fourni les données pour répondre aux objectifs des campagnes de mesures sur site
Tableau 1 Détails finaux des sites où les enregistrements ont été exécutés
Genre de dispositifs Phase Endroit Données enregistrées
Vent Exploitation Parc éoliens belges Pression sonore Mouvement des particules CEM
Vent Construction Mer du Nord, sud est Mouvement des particules
Houle Exploitation Lysekil, Suède Pression sonore Mouvement des particules
Houle Exploitation Kishorn, Ecosse Pression sonore
Marée Exploitation Île de Wight, Royaume-Uni
Pression sonore
Résultats principaux – Le bruit
Les enregistrements aux parcs éoliens belges ont été les premiers de leur genre mesurant simultanément la pression sonore (pression acoustique), le mouvement des particules et les CEM. Les résultats importants sont que le mouvement des particules est mesurable pour les éoliennes d’un parc éolien offshore et qu'il est inférieur pour les éoliennes sur fondation jacket que pour les éoliennes monopiles en acier ; ceci est en accord avec les enregistrements de pression acoustique, où les éoliennes monopiles émettent des niveaux sonores plus élevés que les éoliennes sur fondation jacket.
Sur le site du système houlomoteur suédois, nous avons également enregistré simultanément le mouvement des particules (MP) et la pression sonore d'un dispositif houlomoteur. Les niveaux de mouvement des particules étaient faibles, mais d'un poisson récepteur, le mouvement des particules était détectable à 23m pour des hauteurs de vagues allant jusqu'à 2m. Il est intéressant que les niveaux de pression sonore fussent en dessous du seuil perceptible pour les poissons à une distance de 23m avec des hauteurs de vagues en dessous de 2m.
Le site du système houlomoteur écossais a montré un effet négligeable du bruit provenant du dispositif houlomoteur à l'ambiance sonore globale à 400m de distance (cette grande distance à l'enregistrement a été choisie en raison des considérations logistiques étant donné que le développeur à l'origine avait l’intention d’augmenter le nombre d’unités) ; il a donc été conclu que tout ajout à l'ambiance sonore par le dispositif serait probablement faible. Le niveau de
19
pression acoustique ambiante enregistré était compatible avec les événements liés à la météo, le bruit de la navigation locale, ainsi que la contribution continue des dispositifs de dissuasion acoustique (DDAs) déployés sur plusieurs cages d'élevage de poissons dans la région. Par conséquent, il n'y a aucun impact prédit du bruit émis par le dispositif houlomoteur sur les espèces de récepteurs dans la région à la distance de l’enregistrement (400m et plus). On ne sait donc pas si le bruit émis par un ou plusieurs dispositifs situés plus près sera perceptible aux espèces réceptrices ou non, mais selon notre examen, il sera très local.
Les dispositifs houlomoteurs fonctionnent très différemment l’un de l’autre et un enregistrement pour un dispositif ne peut pas décrire le bruit des autres modèles. Il est nécessaire d’obtenir plus d’enregistrements simultanés de la pression acoustique et du mouvement de particules liées à diverses conceptions afin de pouvoir déterminer, à des niveaux biologiquement pertinents, la façon dont la pression acoustique et le mouvement de particules se produisent.
Le niveau sonore maximal en termes de mouvement des particules reste à être décrit pour tout dispositif houlomoteur. Des enregistrements futurs devraient être effectués sous une variété de conditions météorologiques et de houle, étant donné que des hauteurs de houle variables peuvent modifier les interactions et la génération potentielle de bruit provenant du son émis par les composants divers des houlomoteurs.
Enfin, les niveaux de bruit et de mouvement de particules doivent être comparés entre les appareils simples et les lignes et parcs de tailles différentes pour évaluer la production possible de bruit cumulatif.
Pour le dispositif hydrolien (turbines montées sur une plate-forme à niveau moyen), on a enregistré une fréquence modulée par étape (principalement comprise entre 1 – 2,5 kHz), ce qui correspond à la signature acoustique produite par les deux turbines tournantes. De 150 à 400m du dispositif, les niveaux de pression acoustique étaient augmentés par autant que 10 à 15 dB par rapport au niveau de bruit ambiant.
Compte tenu de la distribution de fréquence de la signature de la turbine en question et des niveaux sonores au-dessus du bruit ambiant dans un intervalle donné, il est possible que les turbines soient détectées par les marsouins communs, bien que l'énergie primaire du bruit de turbine soit émise à une fréquence à l'extrémité inférieure de leur sensibilité de l'ouïe ; aussi, ces fréquences peuvent être audibles pour les pinnipèdes qui sont plus sensibles aux sons de basse fréquence. Certaines espèces de poissons, comme par exemple le hareng, seront probablement en mesure d'entendre le signal, leur audience se prolongeant au-delà de 1 kHz, tandis que d'autres spécialistes de la basse fréquence, comme la morue, peuvent être en mesure de détecter les sons de fréquence inférieure produits par les turbines.
Résultats principaux - CEM
Les champs électriques et magnétiques des câbles entre les éoliennes et des câbles d'exportation d'électricité standard de l'industrie étaient clairement mesurables lors de la production d'électricité par les éoliennes offshore. Le champ électromagnétique (CEM) émis par une éolienne était considérablement plus faible que le champ des câbles.
Les champs électromagnétiques émis étaient plus élevés pour les câbles de l'exportation vers la rive par rapport aux câbles inter-turbines, ce qui a été prédit à partir de la quantité d'énergie étant transmise.
Les champs électriques mesurés étaient dans la gamme de détection connue pour les espèces de récepteurs sensibles (principalement les requins, skates et les raies). Les champs magnétiques sont à l'extrémité inférieure et potentiellement en dehors de la gamme détectable des espèces sensibles connues.
Deux méthodes différentes pour mesurer les champs électromagnétiques ont été mises à l'essai : enregistrement « à la dérive » et enregistrement « au traîneau ». La méthode « à la

20
dérive » présente l'avantage de pouvoir évaluer le CEM assez rapidement et permet d'éviter le risque d'endommagement des capteurs sur le fond marin. L’enregistrement « au traîneau » au fond marin a démontré que le CEM au fond de la mer, où les câbles sont enterrés, peut être mesurée ; aussi la distance de propagation peut être mesurée si le traîneau est tiré perpendiculairement à l'axe du câble.
La technologie d’enregistrement a été validée et démontre que les CEM à des niveaux biologiquement pertinents peuvent être observés soit en suspendant les capteurs sur le côté d'un bateau soit en utilisant le traîneau. Les résultats sont limités aux systèmes de transmission AC et sont transférables entre les types de dispositifs utilisant des câbles de caractéristiques similaires. Les mêmes méthodes devraient être utilisées sur un système de transmission DC.
Programme pour les recherches et développements dans le futur Un résultat important de MaRVEN est l’établissement des priorités pour la recherche future suivant les analyses bibliographiques et les campagnes d’enregistrement sur site. Nous présentons ici les priorités de recherche appuyées par les justifications des recommandations proposées.
En ce qui est le bruit et les vibrations, un des thèmes les plus urgents en Europe est de déterminer correctement l'impact du bruit impulsif sur les espèces marines. Malheureusement, nous manquons de compréhension concernant les effets de déplacement et de son impact au niveau de la population. Les priorités de recherche devront tenir compte du fait que les eaux européennes sont très divers une stratégie garantissant un résultat pour un des sujets clés, ne sera très probablement pas suffisante ou devra être combinée avec d’autres activités de recherche pour être adaptée aux circonstances locales.
Les priorités clés de recherche que nous proposons suivent les catégories d'évaluation des risques et devrait se concentrer sur, par ordre d'importance :
• Evaluation de la dose-réponse : Effets du battage de pieux sur les espèces de poissons et leur conservation et sur le fonctionnement de l'écosystème (par exemple le hareng, la morue) et enquête pour savoir si les effets se traduisent par des conséquences au niveau de la population (par exemple déplacement ou habitudes de déplacement modifiées).
• Evaluation de la dose-réponse : Effets du bruit de battage sur les baleines à fanons (par exemple petits rorquals), mais seulement dans les zones où les parcs éoliens se chevauchent spatialement avec l'aire de répartition des taxons.
• Evaluation de l'exposition : Les vibrations de sédiments causées par la construction des MREDs.
Pour les champs électromagnétiques, la revue bibliographique a clairement démontré qu'il existe des lacunes importantes dans les connaissances sur les CEM. Aujourd’hui, c’est l’impression générale que la base de connaissances est si pauvre que cela ne vaut pas la peine de la considérer. Notre opinion est qu’en ignorant les effets des CEM sur la faune marine, le secteur de l'énergie renouvelable marine manque une occasion de démontrer les meilleures pratiques en matière de responsabilité (notons par exemple que l'atténuation du battage pendant la construction souligne le sens de responsabilité des développeurs). Si des études de CEM sont mises en œuvre et démontrent aucune signification sur l'interaction avec les animaux récepteurs, des décisions peuvent alors être prises pour éviter des campagnes de surveillance environnementale inutiles ; cependant, s’il y a un certain effet significatif, alors nous devrons les atténuer de manière appropriée.
Selon nos connaissances, nous suggérons que les études dans le futur devraient se concentrer sur, dans l'ordre de rang de priorité :
• L'évaluation de la dose-réponse : Établir la réponse des espèces marines clés, à leurs stades de vie les plus sensibles, à l'exposition à une gamme de CEM (sources, intensités prévues pour les MREDs).

21
• L'évaluation de la dose-réponse : Expériences sur site (par exemple des études de suivi) sur le potentiel d'impacts cumulatifs de plusieurs câbles en relation avec le mouvement/comportement migratoire des espèces réceptrices CEM.
• Evaluation de l'exposition : Développer des techniques abordables pour enregistrer les champs électromagnétiques de manière à valider des prévisions de CEM par modèles numériques.
En ce qui concerne les normes et standards, les priorités de la recherche à ce stade sont :
• La détermination des paramètres qui influent sur la reproductibilité des mesures acoustiques sous-marines (par exemple profondeur de mesure)
• La définition et la validation des paramètres d'entrée aux modèles de propagation existants, en particulier pour les régions d'eau peu profonde, y compris validation de résultats utilisant des données empiriques
• L’amélioration des méthodes de modélisation en champ proche / sources pour MREDs et la validation des résultats
La recherche spécifique devra assurer qu'il y aura une plus grande prise en compte de l'amélioration et de l'application à l'unification des normes et des exigences nationales / européennes.
Conclusions
Grâce à des examens structurés de sujets clés, à des campagnes d’enregistrement sur site pour combler des lacunes dans les connaissances et à une revue des résultats obtenus dans un cadre d'évaluation des risques, le projet MaRVEN a pu consolider notre compréhension du bruit sous-marin, des vibrations et des champs électromagnétiques provenant de la construction et de l’exploitation de MREDs. Le projet a aussi permis d’identifier et prioriser des thèmes de recherche qui profiteront à l'industrie et aux secteurs réglementaires et scientifiques en réduisant les blocages potentiels de la promotion et du déploiement des MREDs.
22
Glossary
Audiogram Graphical presentation of hearing thresholds at a given range of frequencies
Continuous sound A sound with no clear definable beginning or end and small changes in loudness or character. Example: operational noise under steady conditions
Equivalent continuous sound pressure level (Leq)
Equivalent to SPL (Sound pressure level), see below
Frequency weighting Consideration of the hearing characteristics with respect to a certain species.
Noise Sound that has the potential to cause negative impacts on marine life or for which adverse effects are specifically described, or when referring to specific technical distinctions such as ‘masking noise’ and ‘ambient noise’.
Peak sound pressure The maximum sound pressure during a stated time interval
Peak sound pressure level (Lpeak, SPLz-p, zero to peak sound pressure level) -
Logarithmic value of peak sound pressure during a stated time interval
Percentile level Statistical quantity, referencing all sound data of a measurement totality to one value. Example: SEL5 - Percentile level of SEL. Sound exposure level, which is exceeded in 5 % of the measurements over the total measuring period
Permanent threshold shift (PTS) Permanent elevation of the hearing threshold for certain frequencies of whole bandwidth of hearing. Thus, irreversible reduction in hearing sensitivity that can result for example from exposure to intense impulse or continuous sound
Sound The acoustic energy radiated from a vibrating object, with no particular reference for its function or potential effect. Sounds include both meaningful signals and ‘noise’, which may have either no particular impact or may have a range of adverse effects.
Sound exposure level (SEL) Logarithmic value representing the energy content of the sound wave (referenced to a period of 1 s).
Sound pressure The difference between instantaneous total pressure and pressure that would exist in the absence of sound The unit for sound pressure is Pascal
23
Sound pressure level (SPL) Logarithmic value of sound pressure for a stated time interval. A decibel scale (dB) is used. Each dB value stands for a factor related to a reference. The reference pressure in underwater acoustics is defined as 1 micro Pascal (μPa)
Source level Calculated value to quantify the sound power radiated by a source of noise. It is used e.g. as input to sound propagation calculations. Frequently SPL standardised to 1m distance to the source is used as a substitute of the source level.
Spectrum Representation of frequency components of a signal
Temporary threshold shift (TTS) Temporary elevation of the hearing threshold for certain frequencies of whole bandwidth of hearing. Thus, reversible reduction in hearing sensitivity that can result for example from exposure to intense impulse or continuous sound
Third (1/3) octave band A frequency band whose bandwidth is one third of an octave
Transient / Impulsive sound Sound of relatively short duration having an obvious start and end within a relatively short time. Transient sound includes impulse transient sounds from explosions, airguns, pile drivers and sonars
Vibration Energy propagating through wave motion in a solid
Waveform Functional form or shape of a signal or sound versus time
Acronyms
µPa Micropascal
A Ampere
AC Alternating current (electricity)
ADD Acoustic deterrent device
AHD Acoustic harassment device
BF Beaufort wind force scale
dB Decibel
DC Direct current (electricity)
EIA Environmental impact assessment
EMF Electromagnetic field
ERNL Effective radiated noise level
EWEA European Wind Energy Association
FAD Fish aggregation device
GBF Gravity based foundation
HSD Hydro sound damper

24
Hz Hertz
ICES International Council for the Exploration of the Sea
km Kilometre
LE Sound Energy Density Level
Leq Equivalent sound level
Lpeak Peak sound level
Lz-p Zero – peak sound level
m Meter
MRE Marine renewable energy
MRED Marine renewable energy developments (including devices)
ms Millisecond
MW Megawatt
NOAA National Oceanic and Atmospheric Administration
OSPAR The Convention for the Protection of the marine Environment of the North-East Atlantic
OWF Offshore windfarm
p Pressure
Pa Pascal
PM Particle motion
PTS Permanent threshold shift
RHIB Rigid-hulled inflatable boat
RPM Revolutions per minute
s Second
SD Standard deviation
SEL Sound exposure level
SELcum Cumulative sound exposure level
SPL Sound pressure level
T Tesla
TEC Tidal energy converter
TSGN EU Task Study Group on Underwater Noise and other Forms of Energy
TTS Temporary threshold shift
UT Universal time
V Volt
VMS Vessel Monitoring System
WEC Wave energy converter
25
1 Introduction
In Europe and beyond, there are ambitious plans for marine renewable energy developments (MREDs), i.e. wind- wave and tidal power devices. The construction and operation of MREDs will lead to, among other things, the emission of electromagnetic fields (EMF), underwater sound, and vibrations into the marine environment. Migratory fishes that respond to natural environmental cues, such as the Earth’s geomagnetic field move through the same waters that the MRED occupy, thereby raising the question of whether there are any effects of MRED on migratory and other fish species. Yet, the exact EMF emissions of cables from MREDs are not known and studies on potential impacts are in their infancy. Underwater sound impacts from MREDs have become a particularly important environmental issue. This is because water is an excellent medium for sound transmission. Sound travels more than four times faster underwater than in the air and absorbed less compared to air. On the other hand, vision, touch, smell and taste are limited in range and/or the speed of signal transmission. Consequently, many forms of marine life use sound as their primary mode of communication, to locate a mate, to search for prey, to avoid predators and hazards, and for short- and long-range navigation. Activities generating underwater sound, particle motion and vibrations can affect these functions and, since sound can be far ranging, the spatial scale of impacts can be quite large as well. Research has shown that some species such as the harbour porpoise are very sensitive to disturbance due to wind farm construction. Yet, there are many open questions with regard to impacts of MRED related sound on marine life. These information gaps pose challenges to the planning and deployment of MREDs.
1.1 Aim of the study
In a project for the European Union (EU) Commission, Directorate-General for Research and Innovation, we have studied the environmental effects of noise, vibrations and electromagnetic emissions from MREDs (Marine Renewable Energy, Vibration, Electromagnetic fields and Noise - MaRVEN). MaRVEN has critically reviewed the available scientific evidence and significance of those effects and made recommendations on solutions to mitigate or cancel the identified negative impacts. The investigation comprised of several tasks including the review, field work and recommendations on a programme for further R&D with justified priorities to inform researchers working in the field, stakeholders (for example planners and NGO’s) but also regulators in the EU and beyond.
1.2 Project team
In order to undertake the MaRVEN project, DHI has partnered with Cranfield University UK, who are the leading authorities on EMF impacts from MREDs. DHI and Cranfield University then assembled a team with 7 other institutions:
• Centre for Environment, Fisheries and Aquaculture Science (Cefas), United Kingdom
• Totalförsvarets forskningsinstitut (FOI), Sweden
• Scottish Association of Marine Science (SAMS), United Kingdom
• Deutsches Wind Energie Institut (DEWI), Germany
• Operational Directorate Nature (ODN), RBINS, Belgium
• Universitat Politècnica de Catalunya (UPC) / Laboratori d'Aplicacions Bioacústiques, Spain
• Quiet Oceans (QO), France
26
Our team members are from seven EU countries leading the implementation of renewable energy. Their expertise encompasses the key topics required for the study. It also brings together six members of the EU Task Study Group on Underwater Noise and other Forms of Energy (TSGN) that are directly involved in advice and recommendations with regard to the implementation of underwater noise regulation across the EU (Marine Strategy Framework Directive). There are also four members of Working Groups (including co-chairs) within the International Council for the Exploration of the Sea (ICES) associated with marine renewable energy.
1.3 Structure of the report
In line with the objectives of the study, this report has been divided into several chapters summarising the main results of the study:
• Chapter 2 - Historical review of the publications related to environmental impacts of marine renewable energy devices
• Chapter 3 - In-depth analysis of studies on the environmental impacts of noise and vibrations during installation and operation of marine renewable energy devices
• Chapter 4 - In-depth analysis of studies on the environmental impacts of electromagnetic emissions during the operation of marine renewable energy devices
• Chapter 5 - In-depth analysis of the current norms and standards related to noise, vibrations and EMF for marine renewable energy systems
• Chapter 6 - On-site measurements and field experiments to validate and build on the results obtained in above studies
• Chapter 7 - Programme for further R&D with justified priorities
The last three chapters (8-10) cover the conclusions, the acknowledgments and the references.
Details to chapters 2-7 are covered in more expansive background reports in the Appendices to this document.
References have been restricted to key papers. The fully cited reviews and detailed reference lists can be found in Annexes 1-8.
1.4 Risk based approach to reviews
The reviews in chapters 3 and 4 are structured along a risk assessment framework, based on (Boyd et al. 2008). We believe that this provides a more systematic approach to the review process. This approach involved a stepwise procedure including:
• Risk identification – characterisation of the potential threats of a source;
• Exposure assessment – specifying the number of individuals that might be exposed to the hazard;
• Dose-response assessment (assessment – of the quantitative relation between received sound and the effect);
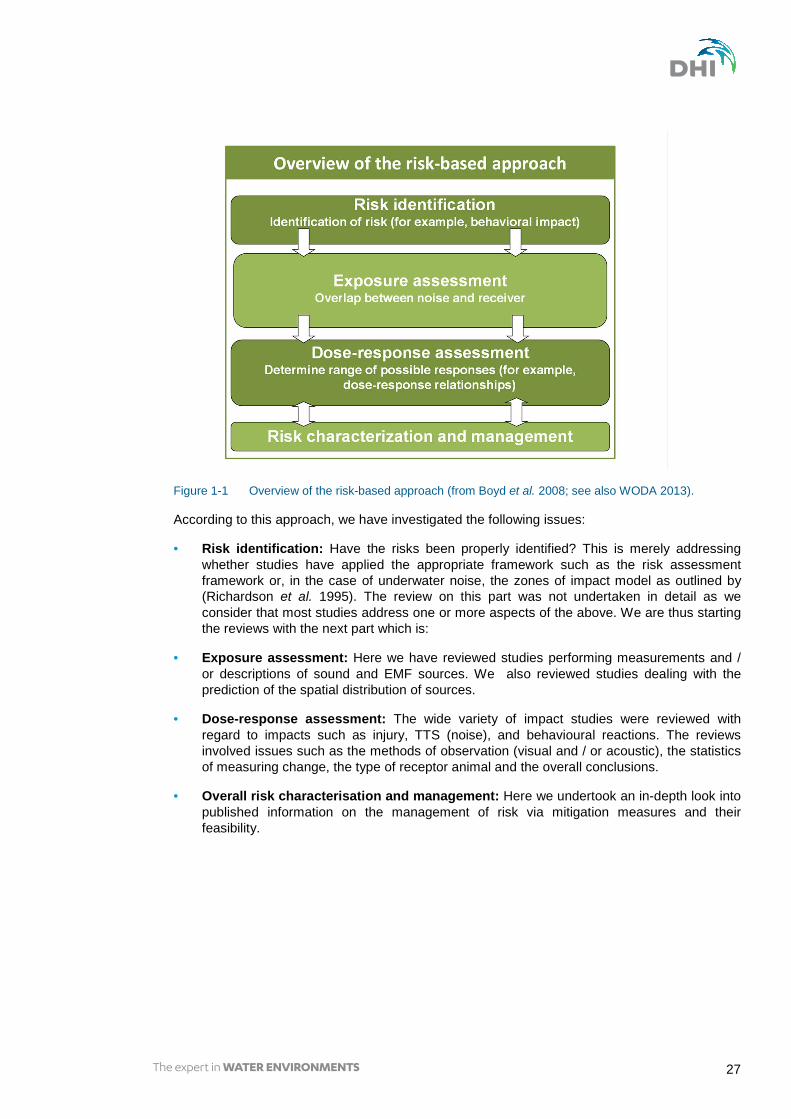
• Overall characterisation of the risk – leading to risk management with appropriate mitigation measures (see Figure 1-1).
27
Figure 1-1 Overview of the risk-based approach (from Boyd et al. 2008; see also WODA 2013).
According to this approach, we have investigated the following issues:
• Risk identification: Have the risks been properly identified? This is merely addressing whether studies have applied the appropriate framework such as the risk assessment framework or, in the case of underwater noise, the zones of impact model as outlined by (Richardson et al. 1995). The review on this part was not undertaken in detail as we consider that most studies address one or more aspects of the above. We are thus starting the reviews with the next part which is:
• Exposure assessment: Here we have reviewed studies performing measurements and / or descriptions of sound and EMF sources. We also reviewed studies dealing with the prediction of the spatial distribution of sources.
• Dose-response assessment: The wide variety of impact studies were reviewed with regard to impacts such as injury, TTS (noise), and behavioural reactions. The reviews involved issues such as the methods of observation (visual and / or acoustic), the statistics of measuring change, the type of receptor animal and the overall conclusions.
• Overall risk characterisation and management: Here we undertook an in-depth look into published information on the management of risk via mitigation measures and their feasibility.

28
2 Historical review of the publications related to environmental impacts of marine renewable energy devices
2.1 Introduction
Background 2.1.1
This chapter considers the full range of environmental effects of renewable energy devices (excluding noise and electromagnetic fields that are reviewed in detail in chapters 3 and 4). Thus, it sets the context for the work undertaken in the remainder of this report.
This review was undertaken in two phases:
• A detailed critique of over 270 reports relating to the environmental effects of offshore renewable energy developments (presented in Annexes 1 and 2).
• Use of expert judgement to summarise the key effects, issues and findings associated with offshore wind farms, wave energy converters and tidal energy converters for the key biological receptors (plankton, benthos, fish, turtles, birds, marine mammals and bats) and apply qualitative confidence levels to the analysis; presented in Annex 1 and 2).
These reports, along with those from the noise, vibration and EMF reviews, were logged in an MS Access database (sources updated to the date December 2014). The database will be available via the MaRVEN website.
Here, the main findings are summarised. The interested reader is referred to the Annexes 1 and 2 for more details.
This second phase entailed building single statements derived from components of multiple discussions by many different authors and as such the statements in this summary document are not wholly attributable to the authors of the literature reviewed.
Device types 2.1.2
For offshore wind energy devices, the aerial component typically comprises of vertically rotating blades. The most common foundation type to date is the monopile but other foundation types are possible as well (Figure 2-1).
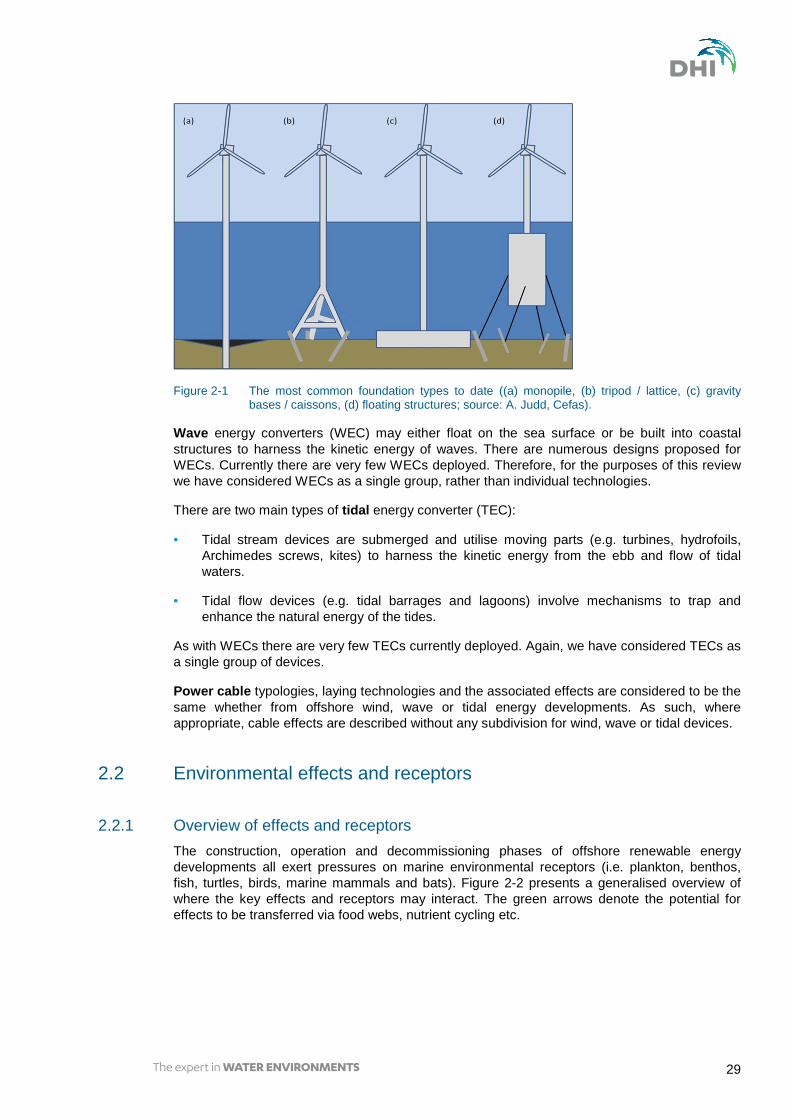
29
Figure 2-1 The most common foundation types to date ((a) monopile, (b) tripod / lattice, (c) gravity bases / caissons, (d) floating structures; source: A. Judd, Cefas).
Wave energy converters (WEC) may either float on the sea surface or be built into coastal structures to harness the kinetic energy of waves. There are numerous designs proposed for WECs. Currently there are very few WECs deployed. Therefore, for the purposes of this review we have considered WECs as a single group, rather than individual technologies.
There are two main types of tidal energy converter (TEC):
• Tidal stream devices are submerged and utilise moving parts (e.g. turbines, hydrofoils, Archimedes screws, kites) to harness the kinetic energy from the ebb and flow of tidal waters.
• Tidal flow devices (e.g. tidal barrages and lagoons) involve mechanisms to trap and enhance the natural energy of the tides.
As with WECs there are very few TECs currently deployed. Again, we have considered TECs as a single group of devices.
Power cable typologies, laying technologies and the associated effects are considered to be the same whether from offshore wind, wave or tidal energy developments. As such, where appropriate, cable effects are described without any subdivision for wind, wave or tidal devices.
2.2 Environmental effects and receptors
Overview of effects and receptors 2.2.1
The construction, operation and decommissioning phases of offshore renewable energy developments all exert pressures on marine environmental receptors (i.e. plankton, benthos, fish, turtles, birds, marine mammals and bats). Figure 2-2 presents a generalised overview of where the key effects and receptors may interact. The green arrows denote the potential for effects to be transferred via food webs, nutrient cycling etc.
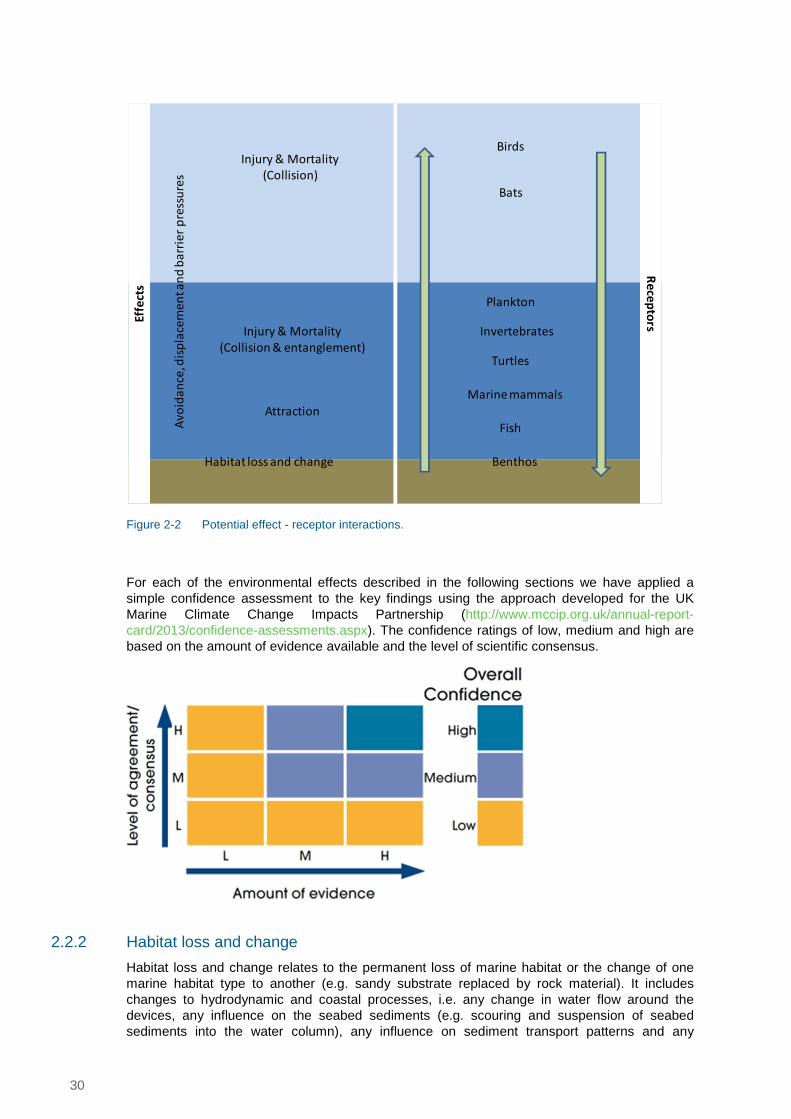
30
Figure 2-2 Potential effect - receptor interactions.
For each of the environmental effects described in the following sections we have applied a simple confidence assessment to the key findings using the approach developed for the UK Marine Climate Change Impacts Partnership (http://www.mccip.org.uk/annual-report-card/2013/confidence-assessments.aspx). The confidence ratings of low, medium and high are based on the amount of evidence available and the level of scientific consensus.
Habitat loss and change 2.2.2
Habitat loss and change relates to the permanent loss of marine habitat or the change of one marine habitat type to another (e.g. sandy substrate replaced by rock material). It includes changes to hydrodynamic and coastal processes, i.e. any change in water flow around the devices, any influence on the seabed sediments (e.g. scouring and suspension of seabed sediments into the water column), any influence on sediment transport patterns and any
Effects
ReceptorsBirds
Bats
Marine mammals
Turtles
Fish
Benthos
Plankton
Habitat loss and change
Injury & Mortality(Collision & entanglement)
Injury & Mortality (Collision)
Attraction
Avoi
danc
e, d
ispla
cem
ent a
nd b
arrie
r pre
ssur
es
Invertebrates

31
influence that devices may have on coastlines. Habitat change also includes changes to hydrodynamic conditions such as tidal flow, tidal height, wave heights etc. as a result of extracting energy from the water using wave or tidal energy converters.
Wind farms • Benthic species are most at risk from habitat loss and change effects. Confidence: high.
• There is no evidence of changes to infauna (i.e. those organisms living within seabed sediments) (composition, densities, biomass, diversity and abundance). Confidence: high.
• Colonizing epifauna are often different to the native infauna. Confidence: high.
• Faunal communities are more species-poor on steel foundations compared to concrete foundations. Confidence: medium.
Wave and tidal energy converters • Evidence base is poor. Confidence: low.
Attraction affects 2.2.3
Wind farms • There is an open debate whether fish simply relocate or if the structures act as a fish
aggregation device (FAD) to facilitate increases fish population size. Confidence: medium.
• Changes in species composition within OWF have been observed compared to reference sites. Confidence: medium.
• Vessel Monitoring System (VMS) evidence suggests that fishing effort is decreased in areas where OWF are constructed, but it is not clear if efforts are increased at other locations. Confidence: medium.
• Cormorants and herring gulls may be attracted to turbines for the use of roosting, perching and wing drying. Confidence: medium.
• Increased numbers of common scoter, lesser black-backed and herring gull, Common gull and Black-legged kittiwake have also been observed within wind farm areas. Confidence: medium.
• Some studies suggest neutral effects on marine mammals (e.g. harbour porpoise, harbour and grey seal), some show increased numbers and others decreased numbers. Confidence: medium.
Wave and tidal energy converters • Limited evidence is available on the attraction effects of on marine biota. Confidence: low.
Injury and mortality effects 2.2.4
Wind farms • Most likely factor in influencing collision mortality risk is flight height, species commonly
flying at rotor heights are gulls (great black-backed gull, herring gull and lesser black-backed gull), white-tailed eagles, northern gannets and skuas. Confidence: medium.
• Several research projects have shown that some birds tend to choose corridors between the turbines (e.g. herring gull, black-backed gulls), dependent on the spacing of turbines. Confidence: medium.
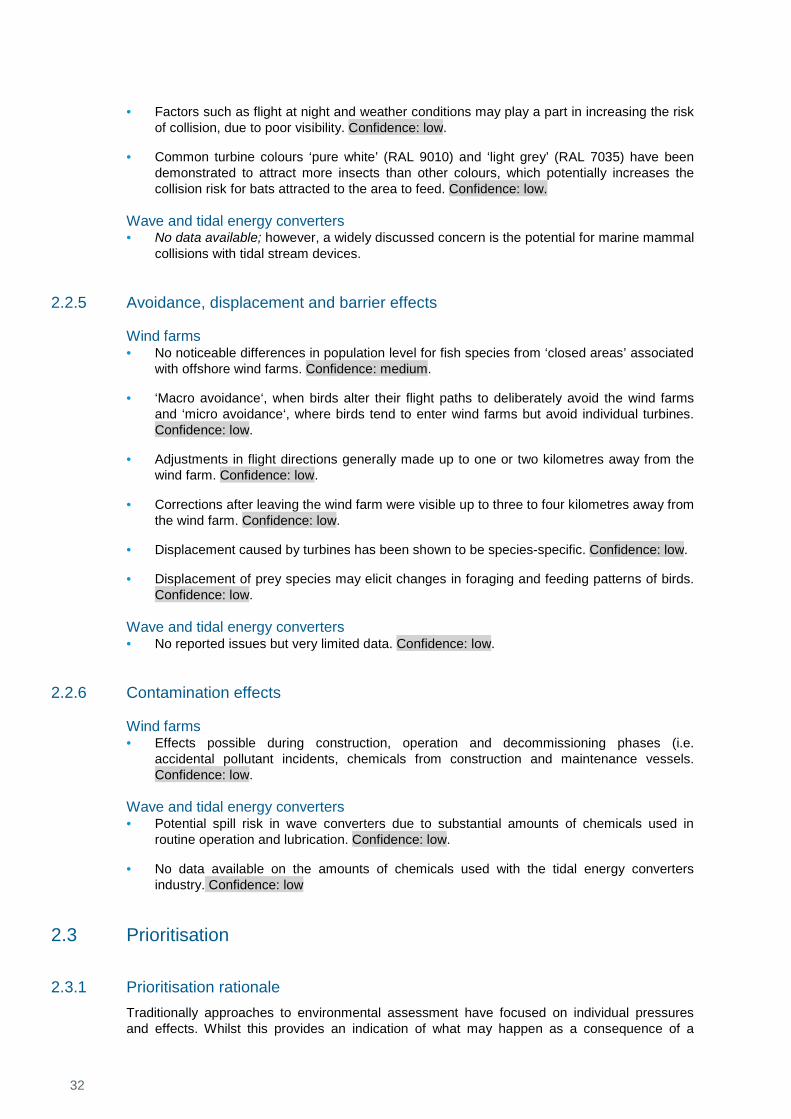
32
• Factors such as flight at night and weather conditions may play a part in increasing the risk of collision, due to poor visibility. Confidence: low.
• Common turbine colours ‘pure white’ (RAL 9010) and ‘light grey’ (RAL 7035) have been demonstrated to attract more insects than other colours, which potentially increases the collision risk for bats attracted to the area to feed. Confidence: low.
Wave and tidal energy converters • No data available; however, a widely discussed concern is the potential for marine mammal
collisions with tidal stream devices.
Avoidance, displacement and barrier effects 2.2.5
Wind farms • No noticeable differences in population level for fish species from ‘closed areas’ associated
with offshore wind farms. Confidence: medium.
• ‘Macro avoidance‘, when birds alter their flight paths to deliberately avoid the wind farms and ‘micro avoidance‘, where birds tend to enter wind farms but avoid individual turbines. Confidence: low.
• Adjustments in flight directions generally made up to one or two kilometres away from the wind farm. Confidence: low.
• Corrections after leaving the wind farm were visible up to three to four kilometres away from the wind farm. Confidence: low.
• Displacement caused by turbines has been shown to be species-specific. Confidence: low.
• Displacement of prey species may elicit changes in foraging and feeding patterns of birds. Confidence: low.
Wave and tidal energy converters • No reported issues but very limited data. Confidence: low.
Contamination effects 2.2.6
Wind farms • Effects possible during construction, operation and decommissioning phases (i.e.
accidental pollutant incidents, chemicals from construction and maintenance vessels. Confidence: low.
Wave and tidal energy converters • Potential spill risk in wave converters due to substantial amounts of chemicals used in
routine operation and lubrication. Confidence: low.
• No data available on the amounts of chemicals used with the tidal energy converters industry. Confidence: low
2.3 Prioritisation
Prioritisation rationale 2.3.1
Traditionally approaches to environmental assessment have focused on individual pressures and effects. Whilst this provides an indication of what may happen as a consequence of a
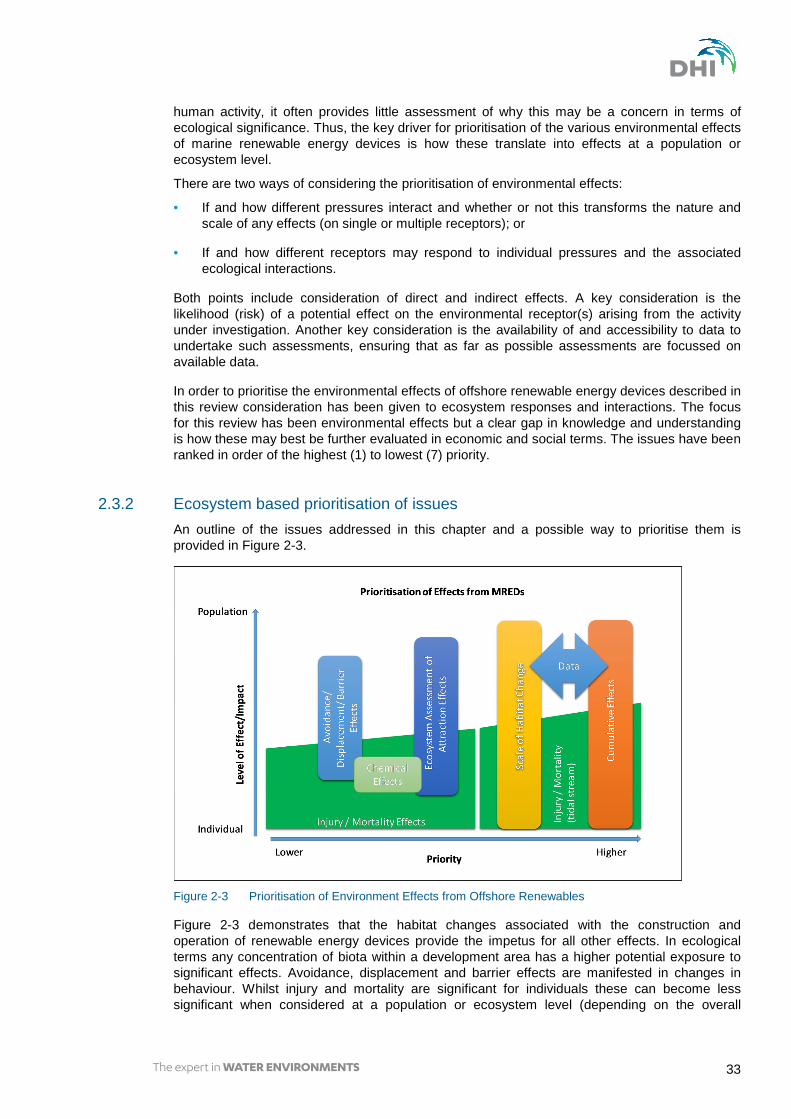
33
human activity, it often provides little assessment of why this may be a concern in terms of ecological significance. Thus, the key driver for prioritisation of the various environmental effects of marine renewable energy devices is how these translate into effects at a population or ecosystem level.
There are two ways of considering the prioritisation of environmental effects:
• If and how different pressures interact and whether or not this transforms the nature and scale of any effects (on single or multiple receptors); or
• If and how different receptors may respond to individual pressures and the associated ecological interactions.
Both points include consideration of direct and indirect effects. A key consideration is the likelihood (risk) of a potential effect on the environmental receptor(s) arising from the activity under investigation. Another key consideration is the availability of and accessibility to data to undertake such assessments, ensuring that as far as possible assessments are focussed on available data.
In order to prioritise the environmental effects of offshore renewable energy devices described in this review consideration has been given to ecosystem responses and interactions. The focus for this review has been environmental effects but a clear gap in knowledge and understanding is how these may best be further evaluated in economic and social terms. The issues have been ranked in order of the highest (1) to lowest (7) priority.
Ecosystem based prioritisation of issues 2.3.2
An outline of the issues addressed in this chapter and a possible way to prioritise them is provided in Figure 2-3.
Figure 2-3 Prioritisation of Environment Effects from Offshore Renewables
Figure 2-3 demonstrates that the habitat changes associated with the construction and operation of renewable energy devices provide the impetus for all other effects. In ecological terms any concentration of biota within a development area has a higher potential exposure to significant effects. Avoidance, displacement and barrier effects are manifested in changes in behaviour. Whilst injury and mortality are significant for individuals these can become less significant when considered at a population or ecosystem level (depending on the overall

34
population seize). Finally, the use of chemicals is an emerging consideration that warrants investigation.
Scientific understanding of the individual pressures is continually improving. As such, it is recommended that greater value can be derived from any future research if designed to address holistic, ecosystem-based issues. Assessments should integrate a suite of pressures and receptors, rather than more narrow focussed assessments.
• Priority 1- If and how different pressures interact and whether or not this transforms the nature and scale of any effects (on single or multiple receptors)
The largest gap in evidence, knowledge and understanding is the potential for pressures to combine into cumulative effects on single or multiple receptors. The consequences of pressure – pressure interactions, and whether or not these result in additive, synergistic or antagonistic effects have not been sufficiently investigated. Indeed the tools to undertake such investigations are currently lacking. To date consideration of cumulative effects has mostly focused on construction activity and pressure maps and relating these to habitat and species sensitivities. However, there is an inherent disparity in relating such approaches to the need and focus of management measures. Work in OSPAR1, has focussed on better defining the terminology and application of cumulative effects assessment as a basis for a scientific ecosystem based approach. However, further work is needed to develop and apply these concepts and definitions at the project, national and regional sea scales.
• Priority 2 - Data availability and accessibility
Data availability and accessibility at the project, national and international scales is a considerable limiting factor for prioritisation of issues for MREDs. Currently a large number of data have been collected as part of EIA’s. However, these data have largely remained inaccessible for use beyond that of the individual licence applications. Key issues for resolution include better mechanisms for managing and co-ordinating the format, standards, availability and restrictions that currently apply to environmental data generated for offshore renewable energy developments. This includes providing reassurance to developers / data holders that mechanisms are in place to manage the implications associated with the (re)use of their data. Such mechanisms will facilitate sharing of data and allow for consideration and potential development of better coordination of monitoring and a focus on cross-border issues.
• Priority 3-7. - If and how different receptors may respond to individual pressures and the associated ecological interactions
Priority 3 The scale and significance of habitat change effects should be considered in terms of implications for food webs, and not just focus on direct effects (e.g. epifauna colonising foundations). Research should also consider indirect effects (e.g. competition with resident biota; changes in predation; changes in water and sediment quality; spread of species). It is also essential that the scale of effect is appropriately determined (i.e. focuses on each turbine and how effects are magnified across the array). Applying artificial delineations to offshore renewable energy developments as a block or polygon may not be appropriate where multiple developments take place in a particular area. For example where there is more than one MRED in a location it may be more appropriate to consider the multiple neighbouring OWF’s, rather than examining individual wind farms based on the licence blocks. This provides the means for a more realistic scaling up of effects to provide a better understanding of the consequences for ecological connectivity and coherence.
1 The OSPAR convention is the mechanism by which fifteen Governments of the western coasts and catchments of
Europe, together with the European Union, cooperate to protect the marine environment of the North-East Atlantic.
35
Priority 4 An ecosystem based approach needs to be applied to the consideration of attraction effects. Research should focus on linking the epibenthos colonising subsea structures; fish aggregating within offshore renewable energy developments (whether for food or shelter) and changes / implications for predator distributions (e.g. marine mammals and birds). This should include analyses of direct and indirect effects, in particular any interactions between pressures and the consequences of these on the suite of receptors at risk.
Priority 5 Effects of avoidance, displacement and barrier to migration or transit to feeding and breeding / nursery grounds should be assessed in terms of energy expenditure and food requirements / availability and the implications for population viability.
Priority 6 Injury and/or mortality from collision must be based on the likelihood and significance of effect. For example, priority should be given to quantifying bird collision risk, rather than further work on validating bird collision models. This priority is particularly relevant where very significant economic decisions may be made based on perceived impacts versus proven impacts.
Priority 7 Investigations into the release, transport, accumulation in sediments, bioaccumulation within food webs and the associated human health implications of chemicals used in offshore renewable energy sector.

36
3 Environmental impacts of noise and vibrations during installation and operation of MREDS
3.1 Introduction and scope
One of the main issues of concern when it comes to MREDs is the environmental impact of noise during installation and operation. This is so because water is an excellent medium for sound transmission and many marine life forms use sound for navigation, communication and other functions. Initially the effects of offshore wind farms on marine mammals and fish have been covered in two benchmark reviews published in 2006 (Madsen et al. 2006; Thomsen et al. 2006). Since then, many more wind farms have gone into operation off the European coasts, and the first wave and tidal turbines have been installed as well. Along with that, many studies have been looking at effects in environmental impacts assessments (EIAs), grey literature or field studies and peer reviewed research. Thus, we have now much more information on the impacts of MRED sound on marine life. Here, we present a summary of an in-depth review of the environmental effects of underwater sound during installation and operation of MREDs, extensive review can be found in Annex 4. We do this following a risk-based approach as outlined in chapter 1.4.
3.2 Exposure assessment
The results of the review indicate that the description of sound sources and the modelling of sound exposure during MRED construction and operation have made much progress since 2006. It is clear that sound levels during wind farm construction are loud enough to cause concern if impact pile driving is used which has been the case for the majority of projects. Further, sound levels depend on pile diameter with larger piles emitting higher levels compared to smaller ones. In general, most of the measured levels exceed environmental thresholds set forth in regulation in particular EU member states. Sound levels during operation of wind farms are much lower causing much less concern for the wellbeing of marine life. For wave and tidal devices, construction sound levels could be similar to wind farms if pile driving is used. Operational sound levels are not well understood, but it is reasonable to assume that the sound output could be similar to that of medium sized vessels, causing relatively low concern.
Our review further highlights that numerical sound modelling has been established in a variety of impact studies throughout the EU, leading to improved environmental impact assessments.
3.3 Dose-response assessment
MRED sound emissions and hearing in marine organisms 3.3.1
With regard to potential risks, it is essential to gain knowledge on the hearing of marine organisms in relation to MRED sound production. There is very little knowledge on how marine invertebrates hear and even less on their sensitivity. It is reasonable to assume that they are only sensitive to the particle motion of the sound wave. This could be relevant for impacts near the source during construction. Our knowledge on hearing in fish is also prone to large data gaps. In principle, all studied fish are sensitive to particle motion and some in addition are able to perceive pressure. For these species, there is a considerable overlap between the frequency bandwidth of sounds used in communication and MRED sound frequencies. They are consequently most sensitive at frequencies that are relevant to MRED sounds. Marine mammal hearing as well as acoustic characteristics of produced sounds is diverse, ranging from infrasonic to ultrasonic frequencies. Thus, due to functional hearing of cetaceans and pinnipeds marine mammals have been divided into low, mid and high frequency cetaceans and pinnipeds

37
in water, while assessing impact of underwater sounds on marine organisms (see Southall et al. 2007; Popper & Fay 2011).
Effects of construction of MRED 3.3.2
Construction of MRED devices may involve a variety of activities that generate sound into marine environment such as: pile driving, drilling, dredging or increased shipping. Among those, impact pile driving, commonly used for wind MRED construction, is considered to be a high level impact on marine organisms due to the relatively high sound levels emitted into the water column. With respect to the construction activities, there is increasing evidence that harbour porpoises respond with avoidance behaviour to impact pile driving at considerable distance to the source (e.g. 20 km under certain conditions). Effects on fish have been shown in experimental setups indicating changes in schooling and individual behaviour at exposure levels that could happen at far distances from the pile driving source. Harbour seals on the other hand seem to be mostly unaffected by wind farm construction sound. For marine mammals and fish there is a risk of physiological response closer to the sound source and / or at relatively high acoustic doses. No results are available for invertebrates (Tougaard et al. 2009a; Thomsen 2010; Thomsen et al. 2012; Hawkins et al. 2014) or sea turtles (Popper et al. 2014).
Effects of operation of MRED 3.3.3
Due to the lower sound levels, impacts during operation are assumed to be much less evident than during construction. Modelling studies undertaken under very precautionary scenarios indicate that operational sounds could be audible to marine mammals several km from the source and in some cases fish could pick up wind farm sounds at distances of several km as well. No study has shown any behavioural impact of sound during the operational phase of wind farms, although it has to be mentioned that due to the lower sound emissions during operation measurements and research remain to be lower priority in comparison with pile driving generated sound. Physiological reactions are very unlikely unless marine mammals stay in the immediate vicinity of offshore wind farms for extended periods. The same is true for fish (Tougaard. et al. 2009b; Marmo et al. 2013).
3.4 Risk management
Due to the suspected high impacts, much effort has been put into investigating feasible mitigation measures for construction of MREDs. At present, there are three general ways to mitigate negative effects from pile driving:
• Source mitigation: reducing the sound directly at the sources via engineering solutions (sound dampers, variation of the pile driving impact duration).
• Channel mitigation: reducing the sound levels in the water column between source and receiver (marine life; i.e. mitigation targeting the channel; for example pile sleeves, bubble curtains and steel tubes around the pile driver).
• Mitigation addressing the receiver: reducing physical consequences (injury) by chasing the receiver out of the zone of immediate danger (acoustic mitigation devices, pingers).
Each of the methods has cost and benefits. Methodologies for source reduction do not seem to be very advanced at present. Measures such as bubble curtains and steel tubes (water filled or air filled) have been very effective on occasion to reduce sound levels depending on the sound frequency. Deterrent and harassment devices work for some marine mammal species but there are environmental concerns in using this method as well. Alternative to installation of foundations, where impact pile driving is needed (monopoles, jackets, tripods, triples), are ‘low noise’ installation technologies involving the usage of gravity based or suction bucket foundations, floating platforms and the usage of technologies such as vibratory piling or drilling,
38
which generate much lower sound levels. The feasibility of these methods depends on local conditions (e.g. seabed composition). The development of low noise foundation installation technologies is on-going. Still further research and development in this sector are needed in order to enable the use of these techniques during construction of MREDs in the near future.
3.5 Vibrations
A conceptual paper on vibration associated with MREDs, including the definition of the term ‘vibration’ against the use of ‘sound’ and ‘particle motion’ can be found as a separate document annexed to the report (Annex 5). Here, a working definition was adopted with ‘sound’ as a vibration existing in a fluid, and ‘vibration’ the energy propagating through wave motion in a solid. This distinction is important for impact assessments as marine life in the water column will mainly experience ‘sound’ (measured as pressure and particle motion), whereas life forms on the ground (for example flatfish) will likely experience both, and those organisms living in the sediment will receive vibrations. Yet, the exact amount of vibration on the seafloor is not known and it is transferred in to the water column as sound. It is not clear if vibrations will lead to any measurable or significant impacts on bottom living marine life.
3.6 Assessment of state of knowledge
It became evident that with regard to the exposure assessment in relation to sound impacts from MREDs good progress has been made since the compilation of the last benchmark reviews in 2006. For example, the literature on sound pressure emissions from construction and operation of MREDs seems to be quite comprehensive for offshore wind farms. That impact pile driving sounds have the potential to affect marine life at considerable distances is not debated any longer.
It is also evident that modelling of underwater sound has made huge progress over the last decade from very simple calculations based on generic spreading loss to sophisticated numerical underwater sound modelling using state of the art models (for example parabolic equations, ray-theorems). Most of the current literature deals with the right parameterisation of the models and model details. Gaps still exist in the adequate description of sources, most notably for impact pile driving (= hammering of the foundation pile into the seabed for wind turbines). This involves the sediment transport of the sound wave (after the definition used here the vibrational part, see separate report). Thus, the overall paths of sound emission during pile driving are not completely understood. In any, case it has proven that numerical sound modelling can reduce the uncertainty on exposure of marine life to sound and it is therefore recommended that it is used as standard in any MRED EIA.
It was further evident that there are very few publications available concerning underwater sound generated by construction and operation of wave and tidal devices. There is also a gap of knowledge on particle motion and vibration levels emitted during construction and operation of MRED devices.
Huge gaps still exist when looking at the dose – response part of the risk assessment. Most of the available information on audibility concludes that pile driving can be detected over a huge area by marine mammals (i.e. several hundreds of km, depending on local conditions). Sensitive fish can detect pile driving at great distances as well. All studies also indicate that the zone of audibility is much smaller for operational sound. Yet, information on audibility is only available for the few taxa for which hearing has been investigated.
Little is known about masking effect both for marine mammals and fish. Yet, it is recognised that masking during construction of MREDs might not be a major issue as most construction sound (for example pile driving) is impulsive and thus has little masking potential This does not rule out a change of the behaviour with the consequence that acoustic communication is interrupted. For the operational masking effects, preliminary assessments indicate a small zone of masking for
39
seals around wind farms. There is a potential of masking sounds used by low frequency cetaceans as operational sound lies in the frequency range of their vocalisations. Thus, there is a need for future research concerning impacts of MRED operational sound, especially on baleen whales in areas of suspected spatial overlap between the industry and whale habitat.
Behavioural reactions to MRED sound was mostly investigated in studies dealing with construction and operation of wind MRED on harbour porpoises and harbour seals. The evidence base for behavioural impacts is much smaller for marine fish compared to the studies undertaken on porpoises.
In general, there is a gap in knowledge on the zone of physical impact due to MRED construction. This considers hearing loss (=permanent hearing loss / PTS) and temporary hearing loss (TTS values) in marine mammals. TTS due to impulsive sound has been shown in a harbour porpoises at relatively low levels of exposure. Yet, it has to be considered that pile driving although broadband, has most of its energy at the lower frequencies (i.e. <1 kHz). There is no indication that a TTS at these frequencies can affect the ability of porpoises to navigate and forage using echolocation (main frequencies around 130 kHz). Potentially, the ability to detect low frequency sounds from vessels could be affected. However, most vessel sound is much below 1 kHz where porpoise hearing is poor. The biological relevance of a low frequency TTS is thus difficult to assess, although it is considered a temporary physical damage to the animal.
It is clear that the overall acoustic dose received by marine life due to pile driving is much higher for a series of pile driving strikes compared to single strikes. It is thus very likely that impact ranges for multiple strikes will be larger than for single strikes. But based on the uncertainties of the criteria for multiple strikes as well as the validity of the underlying assumptions, these ranges are fraught with uncertainty. There are draft recommendations by NOAA that are currently under review to base the assessment of cumulative impacts on 1 hour periods to account for responsive movement (NOAA 2013).
The long-term effects of this displacement are also uncertain. In some cases, porpoises have returned (or other animals have entered the area) of the wind farm site shortly after the end of the construction period. Still, in one case, animals may be very slow (in Teilmann and Carstensen 2012).
In the framework of the risk characterization and management, the main topic of the discussion is how to adequately address the risks. This is challenging as there is very little information on sound levels that are aversive to marine life. Furthermore, models that incorporate the movements of marine mammals and fish into impacts assessment are just under development. Yet, these questions deal mostly with details of the impacts. The general conclusion that the construction phase (pile driving) is the most problematic issue for wind farm sound impacts is shared among most investigators. This will likely hold true for wave and tidal devices as well. Consequently, much effort has been undertaken to investigate feasible mitigation measures for this activity.
40
4 Environmental impacts of electromagnetic emissions during operation of MREDs
This chapter provides the summary of the literature review on environmental impacts of electromagnetic emissions which can be found in Annex 6.
4.1 Introduction to EMF
Producing electricity inevitably generates electromagnetic fields (EMF). This implies that MREDs will emit EMF into the environment. Herein the definition of MREDs includes all electric sources located at sea, e.g. electric generator, transformers, cables and transformer station. A general physical property of EMFs is that they propagate outward from the source and will thus cover areas larger than the source itself. Even if the propagation distance is short, the EMF along the length of, for example, electric cables will make the emitted area long and thus constitute a potential barrier to movement for sensitive species. Predictions, backed up by results from measurements performed in-situ (see chapter 6), suggest that the major source of EMF is the cables that are running inside the MRED footprint and the cable that connects the devices with the land-based grid.
4.2 General awareness in Europe
As part of the MaRVEN project, a questionnaire was sent to selected regulatory agencies of the EU member states to investigate awareness of EMF. The answers combined with published reviews indicate that in general the awareness of EMF is high. However, several member states maintain that there is a lack of evidence showing that there is a negative effect as well as a lack of methodologies for measuring the electromagnetic field, and thus there are no regulations or guidelines developed on how to deal with electromagnetic field from MREDs. An important step forward is therefore, to develop guidelines and standards dealing with EMF, preferably on a European level.
4.3 Exposure assessment
Only a few studies have been conducted where the emitted EMF was predicted employing ordinary computer-based modelling. The same status pertains for in-situ measurements. Measured and calculated magnetic fields seem to agree well, while the same agreement has not been demonstrated for electric fields. It should be underlined that there are large uncertainties in the description of the modelled EMF. The magnetic properties of the cables are to a large extent unknown, likewise the actual burial depth and the sediment properties. Neither the influence of unbalanced electric transmission has been investigated nor the diversion from perfect symmetry of the positions of the conductors in a cable, all of which will influence the predicted results. In order to rely on modelling, the results have to be validated using in-situ measured data. The technique to measure EMF exists. There are commercially available sensors for measuring magnetic fields. However, to measure electric fields requires trained and skilled personnel. This is one reason why EMF from MREDs has not been measured as part of Environmental Impact Assessment (EIA) in Europe. It should be noted that it has now been demonstrated in the field measurements within the MaRVEN project (see chapter 6) that it is feasible to measure both electric and magnetic field at the same time using commercial sensors mounted on an underwater platform operated from a boat. The argument that there is no technique is therefore not valid anymore. Another important point to emphasise in relation to exposure assessment is to ensure the EMFs measured are interpreted in relation to their biological relevance.
41
4.4 Dose-response assessment
The ability to sense and respond to EMF is widespread in the marine environment with many receptive species. The groups that are referred to most often are: elasmobranchs (sharks, skates and rays), crustacea (lobsters and prawns), cetacea (whales and dolphins), bony fish (teleosts and chondrosteans – e.g. sturgeons) and marine turtles. The majority of these are receptive to magnetic fields principally for navigating or orienting within their marine environment. Some, like the elasmobranchs and chondrosteans, are sensitive to electric fields, either directly or induced by the magnetic fields present. Studies investigating the impact of EMF are scarce. In terms of magnetic fields, the best evidence to date comes from tracking studies of eels that demonstrate a diversion from a migratory route but this is not regarded as harmful as the individuals were not diverted too long and resumed their original trajectory. In another experiment it was observed that benthic elasmobranchs (sensitive to electric fields) were attracted to the source of the EMF from a cable. In order to determine if diversion or attraction may be harmful there would need to be some evidence to show that the animals are in some way affected. This is important when considering multiple encounters with EMFs and plausible cumulative effects of encounter with EMFs. As yet, there is no evidence to enable an assessment of cumulative effects. There have been some studies that suggest that there may be effects on early life stages of fish but other studies have not shown any effects. The lack of information on effects has led to the general conclusion that EMFs from MRED are not harmful. However, this is in the absence of any detailed evidence that biota are not at risk of harm.
4.5 Risk management
The commercial introduction of the three-conductor cable was a step forward to reduce AC electromagnetic fields, likewise the introduction of the helically twisted three-conductor cable, which lowers the emission of electromagnetic fields even more. An alternative method often suggested is to increase the burial depth of the cables. This does not dampen the EMF it only increases the distance between receptor species and the cable because of the physical presence of the seabed. Hence, at the surface of the sediment into the water column there is effectively a lower dose. This is only relevant if the response expected is one of avoidance for a particular species, however a lower emission may provide a great potential attraction for other species. Hence, the lack of understanding on EMF effects may cause an issue for appropriate risk management.
4.6 Assessment of state of knowledge
It cannot be stated that EMF from MREDs are harmful but neither can it be ruled out. To settle this question further knowledge is required. These requirements are summarized in the following key findings:
• It is known that several taxonomic groups of species in European waters are sensitive to electric and magnetic fields. There are large gaps in understanding the response of these animals to the EMFs and hence the impact of the fields generated by MREDs. Field based experimental studies should be conducted to determine the field strength from MREDs in different locations and with different device type and associated hardware.
• The most likely effects are currently considered as being related to attraction or avoidance of the EMF associated with cables connected to the MREDs. Hence, studies of the behavioural reactions of different species in relation to different MREDs are lacking.
• Early life stages of fish and the potential effects of EMF on their development suggest that some species may be affected whereas others are not. Whether there are any biologically relevant implications for the species population has not been determined.

42
• Due to the lack of understanding and methodologies for measuring electromagnetic fields there are no governmental/commercial incentives to infer regulations and mitigation measures. The apparent mitigation that has been done is indirectly the result of technical and economic considerations. The general void of knowledge and insufficient data is presently the main reason for the uncertainty around EMFs and consequently the passivity of managers as well as the commercial sector to engage with the environmental questions that arise related to EMF.
• There are no standards or guidelines for the measurement methodology developed to date, which is considered to be a consequence of the interpretation of current knowledge not indicating any significant environmental impacts that require regulation. The interpretation and associated assumptions will likely require reviewing in the future as the knowledge base improves and with the development of larger power rated cables and greater networks of electrical infrastructure. .
It is evident that there are significant gaps in knowledge. However, it is important that these gaps are appropriately identified and justified with the aim of building the evidence base from a fully objective stance. We suggest the following studies to fill in the gaps:
• The sources of EMF are directly related to the electrical topology of the MREDs. There has not been an in depth analysis on the electric design of the MREDs to identify the sources and their strength. To fill in this gap we suggest that a general analysis of the electrical topology of the MREDs is performed.
• At present, there is no off-the-shelf technique that can be used to assess the EMF in the underwater environment. The availability is an essential component for assessing the field. To fill in this gap we suggest that affordable techniques for measuring electromagnetic fields are developed.
• Today we do not have an overall view of the fields that cables and electric devices emit. However, we know that there are several different electric techniques that most probably differ in the emitted EMF-footprint, e.g. the AC- and DC-transmission techniques. These two differ in that they will emit either AC fields or DC field, which from the perspective of species are very different. To fill in the gap we suggest that measurements are undertaken at several MRED installations to establish electromagnetic levels linked to location/depth, device type, number and extent.
• The relation between EMF and the response of animals is crucial for both predicting the effect on marine species, and for applying mitigation measures. At present, there is a lack of results from relevant dose response studies. To fill in this gap we suggest that response/effect studies are conducted on marine species (at different life stages) to exposure to different EMFs (sources, intensities) and that emergent properties are determined that would be associated with impact at the biologically relevant unit of the species population.
• To effectively assess the impact of the MREDS (including a whole wind farm, inter-array cables, transformer station and the export cables) EMF predictions via engineering models in parallel with ecological individual based- species population models is the most cost effective way forward. To fill in this gap we suggest that modelling tools are developed that take the EMF sources and the species based response into account.

43
5 Current norms and standards related to underwater noise
5.1 Introduction and scope
This chapter focuses on standards for underwater noise emitted by marine renewable energy developments (MREDs). Detailed description of the literature review can be found in Annex 7. Underwater sound from wind farms is the primary topic, as there are only few wave and tidal energy sites in Europe today, also there are now standards for EMF (see chapter 4) and particle motion. Nevertheless, elements of standards for underwater sound from wind turbines can be used for any other type of marine renewable energy devices. Regarding the wind farm standards, those for construction sound of wind turbines are of outstanding importance. Since the majority of wind farm foundations are installed by pile driving, sound emission in this phase has high biological relevance due to the very high sound levels emitted (see chapter 3). Data for this analysis were obtained via a questionnaire about underwater sound standards distributed to regulators of EU countries with relevant installations of renewable energy systems ((see Annex 7).
The main topics of standardisation are:
• Which are the relevant parameters that describe the biological impact of underwater sound?
• How should the parameters be measured? • How should the parameters be analysed and statistically evaluated?
The fundamental discussion of physical quantities and biologic relevance is complex but necessary and may end in new approaches for standardisation, including sound modelling and prognosis. The aim is to get standards tailored to the protection target, being comparable and granting a minimum of uncertainty.
5.2 Standards applied in relevant EU member states
The approach to determine relevant countries is based on statistics of the European Wind Energy Association (EWEA) “The European offshore wind industry - key trends and statistics 2013”, and assumes that a relevant number of installations is a requirement for experience in standardization. The following countries have been identified:
• UK 1082 offshore devices • Denmark 513 offshore devices • Belgium 135 offshore devices • The Netherlands 124 offshore devices • Germany 116 offshore devices • Sweden 91 offshore devices
As there is a representative of France within this project, we have also sent a questionnaire to this expert and included it in the review. The questionnaires are mentioned in detail in the Annex 7. Documents of states with a defined standardisation are listed below:
United Kingdom • EMEC 2014: Underwater Acoustic Monitoring at Wave and Tidal Energy Sites: Guidance
Notes for Regulators (Lepper et al. 2014) [1]

44
Beyond wind turbine sound EMEC 2014 aims to inform regulators for discussions with developers of marine energy converter systems and aid the assessment of monitoring activities.
• NPL 2014: Good Practice Guide No. 133 Underwater Noise Measurements (Robinson et al. 2014) [2]
This document provides “guidance on best practice for in-situ measurement of underwater sound, for processing the data and for reporting the measurements using appropriate metrics”.
The Netherlands • TNO 2011a: Ainslie, M.A. Standards for measurement and monitoring of underwater noise,
Part 1: Physical quantities and their units. TNO Report ref: TNO-DV2011 (Ainslie 2011)[ 3]
The use of “appropriate metrics” definitely is a key point. Thus, part 1 of the TNO report “Standards for measurement and monitoring of underwater noise” is named and deals with “Physical quantities and their units”. This report provides an agreed terminology and conceptual definitions for use in the measurement procedures for monitoring of underwater noise from MREDs.
• TNO 2011b: de Jong, C.A.F. (2011) Standards for measurement and monitoring of underwater noise, Part II: Procedures for measuring underwater noise in connection with offshore wind farm licensing. TNO Report ref: TNO-DV 2011 C251 (de Jong et al. 2011) [4]
Measurement and reporting of monitoring wind farm sound are addressed in the second part of the report “Standard for measurement and monitoring of underwater noise, Part II: procedures for measuring underwater noise in connection with offshore wind farm licensing”. It provides a proposal for a measurement procedure.
Germany • BSH 2011: Offshore wind farms: Measuring instruction for underwater sound monitoring,
Current approach with annotations, Application instructions (BSH 2011) [5].
In this document, relevant physical parameters are defined as well as measurement and evaluation procedures2.
5.3 Standards in nomenclature
Clear definitions of terms are necessary to avoid misunderstandings. Thus, standards for the assessment of impacts have to start with definitions of relevant terms and quantities. Mostly all mentioned standards give a short overview of the physical quantities they are dealing with. The most detailed elaboration of underwater sound quantities and units is the first part of the TNO 2011a report (Ainslie 2011).
A few quantities need to be mentioned in the MaRVEN context and can be found in the Glossary at the beginning of this document.
With regard to assessment of impacts, frequency weighting is often applied:
• Example 1: A-weighting for human beings: The human ear is less sensitive to low audio frequencies (e.g. 50 Hz) compared to higher frequencies (e.g. 1 kHz). A-weighting takes this into account. A-weighted broadband values are used in onshore noise emission control (e.g. noise limit of 45 dB(A))
2 In the course of the finalisation of this document, the Danish Energy Agency published Guidelines for underwater
noise in reference to piling installations for offshore wind farms off the Danish Coast (see Energistyrelsen 2014). A detailed review of the document was beyond the timeline of MaRVEN. Yet, in principle the required sound measurements are in line with the requirements of BSH 2011.
45
• Example 2: M-weighting: Frequency weighting with respect to marine mammals (see Southall et al. 2007). To date M-weighting is not recommended in the considered standards for measurements of underwater sound from MREDs.
Any frequency weighting is related to a certain species or groups of species with similar bandwidth of hearing. Standards for underwater sound measurements use mostly unweighted data. Thus, there is flexibility for later evaluations which might e.g. use M-weighting. Recalculations for other receptors, or other frequency weighting based on improved knowledge is possible.
5.4 Standards in data collection
The documents NPL 2014 (UK), TNO 2011a (NL), TNO 2011b (NL) and BSH 2011 (D) provide advice on standards for data collection. All documents distinguish between the pre-construction, the construction and the operational phase. Ambient noise is measured prior to the construction phase and will be treated further below.in section 5.4.1. To date there are no specific standards for monitoring the decommissioning phase.
All reviewed standards describe measuring instrumentation and calibration procedures.
Construction phase 5.4.1
For both TNO 2011 documents and BSH 2011 the objectives of sound monitoring during the construction phase have to be determined in coordination with the licensing authorities. TNO 2011 mentioned some more possible objectives such as validating the results of predictions in the environmental impact assessment, or characterizing the sources and for validating source and propagation models. The main objective is to compare the measured levels with threshold values, if these are set by the licensing authority.
Details of data collection during the construction phase are described in TNO 2011, BSH 2011 and NPL 2014. All standards specify a primary measurement position at a distance of 750 m. But the hydrophone depths differ (NL and UK: lower half of the water column; Germany: 2 to 3 m above sea ground). Thus comparability of measurement data is limited because of the given depth dependency of underwater sound.
Operational phase 5.4.2
According to both TNO 2011 and BSH 2011 the objectives of sound monitoring during the operational phase have to be determined in coordination with the licensing authorities. The document UK NPL 2014 (Robinson et al. 2014) just outlines the method for data collection during the operational phase.
For measurements of operational sound the wind turbine standards give exemplarily the following instructions for the data collection:
• TNO 2011 (NL): Measurements must be carried out at two locations (at least), one at a distance of about 100 m, one at either greater distance (derived from the Environmental Impact Assessment) or a fixed distance of 4 km from the site.
• BSH 2011 (D): Measurements at three power output ranges named “low”, “medium” and “nominal power” each one at least for three hours; measurements of background noise; measurement positions 100 m from the sound source, in the middle of the wind farm and at two positions outside the wind farm area.
Both standards specify a primary measurement position at a distance of 100 m. However, the hydrophone depths differ. Thus, comparability of measurement data is limited because of the given depth dependency of underwater sound.

46
According to the document UK NPL 2014 exemplary measurements have shown that underwater sound during the operational phase is not able to harm marine life, thus there is no straight regulation of sound monitoring in UK with regard to the operational phase.
Ambient noise 5.4.3
Measuring the initial ambient noise prior to the construction of the MREDs is the only chance to get information about the original situation with regard to background noise. In general the objectives for measurements of ambient noise are:
• To give an overview of the initial ambient noise in different seasons and during different weather conditions
• To give reference ambient noise data for the evaluation of the effects of intensive sound emission (e.g. pile driving sound)
For measurements of ambient noise, the analysed wind turbine standards give instructions for data collection.Details are given in TNO 2011 (NL), BSH 2011(D).
5.5 Standards in data analysis
Commonly percentile levels are used to describe statistics of the whole measurement with just one relevant value. Which percentile is regarded as most relevant depends on the character of the sound and is different for impulsive and continuous sound. Thus, data analysis is different for the construction and the operational phase.
Construction phase 5.5.1
TNO 2011 (NL) For each measurement position and measurement period with a fixed hammer setting, reporting should be 1/3-octave band spectra (for individual transients, minimum range 20 Hz to 20 kHz) of the maximum and median SEL ± SD and the average value of SEL.
Additionally, plots can be provided of the median broadband SEL and the median peak acoustic pressure as function of distance to the foundation - for a fixed hammer setting - or as function of hammer setting (strike energy) – at a fixed measurement position.
BSH 2011 (D) The unweighted sound pressure p(t) over the entire measuring period has to be presented.
The broadband levels (Leq, LE, Lpeak) have to be determined for 30 s intervals for the 5th 50th and 90th percentile.
Whereas the 5th percentile (5% exceedance) of the sound exposure level SEL5 is relevant in Germany, the median (50% exceedance) SEL is reported for measurements according to the Dutch standard.
Operational phase 5.5.2
TNO 2011 (NL) The measured background noise at each hydrophone position shall be analysed to 1/3-octave band spectra (minimum range 20 Hz to 20 kHz) of the 5-second average unweighted sound

47
pressure level (SPL5s). The results should be shown in a variety of formats (details in Annex 7 to this document and TNO 2011 (NL).
BSH 2011 (D) A frequency-resolved analysis has to be carried out in third-octave bands and in narrowband spectra with a resolution of < 2 Hz. The results are being shown in a variety of formats (details in Annex 7 to this document and BSH 2011 (D).
5.6 Additional standards
Beside the documents mentioned in chapter 5.2, there are also some relevant international standards under development regarding underwater sound measurements of MRED’s:
• ISO/DIS 18405: Underwater acoustics – Terminology (under development)
• ISO/CD 18406: Underwater acoustics -- Measurement of radiated sound from percussive pile driving (under development).
Both documents are still under development, thus they are not discussed in this document.
In Germany, there is also a guideline under development, which handles the determination of the effectivity of sound mitigation systems (DIN SPEC 45653: Hochseewindparks - In-situ-Ermittlung der Einfügungsdämpfung schallreduzierender Maßnahmen im Unterwasserbereich). The guideline is expected to be published until June 2015.
Furthermore, consideration of underwater sound emitted by ships is handled in ISO/DIS 17208-1 (Underwater acoustics -- Quantities and procedures for description and precision measurement of underwater sound from ships -- Part 1: Requirements for precision measurements in deep water used for comparison purposes) and ISO/CD 17208-2 (Underwater acoustics -- Quantities and procedures for description and measurement of underwater noise from ships -- Part 2: Determination of source levels). Because they are dealing mainly with measurements in deep waters they are not covered by this document.
5.7 Assessment of state of knowledge
Noise standards are developed in the context of noise emission control which depends on biological aspects. Thus, it is up to biologists to define protection goals which the standards have to conceptualise. Based on these defined aims physicists and acousticians can customize adequate measurement and evaluation guidelines. Most important is noise control in the case of construction sound especially related to pile driving. Accordingly, several EU member states have started to define noise limits for construction noise. For example there is the German limit of 160 dB (SEL5) at a distance of 750 m from the piling site. BSH 2011 has been developed with this threshold in mind.
We have to note here that thee standards all refer to sound pressure which is not relevant from most fish and invertebrates. Thus, there is a need to start the standardisation process for this stimulus as well.
Based on input from acousticians of relevant EU member states NPL 2014, TNO 2011 and BSH 2011 have been identified as standards for underwater sound from MREDs. In addition, there are basic sound metrics reported in TNO 2011a. Differences between the standards show up in data collection and data analysis.
48
Because of different measurement depths, comparability of measurement data is limited. For future revisions of the standards, sound modelling and further research might help to work out a solution for an optimized hydrophone position in terms of reproducibility of data.
With respect to sound limits, one significant difference is in the proposed data thresholding procedure. An example is the 5 % percentile (5 % exceedance) of the sound exposure level SEL5 (relevant in Germany), which is not reported for measurements according to the Dutch standard. That is why only the 50 % percentiles can be regarded when comparing measurements carried out in accordance to both standards.
Nevertheless, it is desirable to have a consensus about relevant quantities to be reported. This discussion has to be conducted in an international workgroup bringing biologists, physicists, industry and licensing authorities together. Another topic for this workgroup is the improvement of the existing standards. Future focus of improvement of standards should be on to reducing uncertainty and improving reproducibility of measurements. However, even the best standard is useless if not correctly applied. From onshore emission control, we can learn that round robin tests (RR, measurements according to a certain standard, performed by several measuring institutions) are necessary to ensure comparability of reported data, even if the standards seem to be elaborated and well defined. Findings from the assessment of these round robin tests will significantly support the process of improvement of the standards.
49
6 On-site measurements field experiments
6.1 Introduction and scope
The reviews undertaken in chapters 2-5 provided the current state of knowledge and hence the basis for the fieldwork component of MaRVEN to prioritise knowledge gaps where data collection was to be focussed for underwater sound (sound pressure and particle motion), vibration and electromagnetic fields (EMF). The outputs from chapters 2-5 demonstrated that there is understanding of sound pressure aspects relating to sound however very limited understanding of particle motion, vibration and EMFs associated with marine renewable energy devices (MREDs in all forms) and how they may be of biological relevance to animals within the marine environment. Subsequently, to narrow the knowledge gaps the principle followed was:
• to identify the main stressor component (e.g. particle motion) that would potentially cause some change in the surrounding marine environment and potentially be received by sensitive species
• The stressor identified would depend on the phase of development of the MRED
• The potential type of effect on a sensitive species would be either acute or chronic which may require different consideration in terms of the time and spatial scale that the stressor effect is considered over
The data acquired and interpreted or analysed took two forms: a) existing data and b) field measurements. The existing data was primarily related to sound pressure from offshore wind farms. There were few data from other MRE devices and poor coverage of the particle motion element of sound and EMF. Hence, the field work prioritised collection of data from other device technologies and filling the gaps in understanding of particle motion and EMF. Here we present the main outcomes of the conducted work and field campaign; detailed results can be found in Annex 8.
6.2 Measurement priorities
As construction and operation are very different in terms of sound related emissions and EMF we separated the priorities for measurement into these two different phases. Table 6-1 shows an overview of the priorities during construction and Table 6-2 the priorities during operation.

50
Table 6-1 Overview of priorities for measurements and available team data on sound, vibrations and EMF with regards to marine renewable energy devices during the construction phase (colour codes = priorities for field measurements; green = high orange = medium, red = not applicable / low).
Wind Wave Tidal
Sound pressure • A large amount of measurements have been taken across the EU; some not in the public domain and will require negotiations to access.
• Sufficient data in far-field; complexities not described well enough so far
• Vibration and shear wave?
• Limited data available. Not expected to be different as scales with pile size
• No need to repeat
• Limited data available. Not expected to be different as scales with pile size
• No need to repeat
Particle motion • Needs to be measured - acceleration; impact ranges; different species; gradient through water column
• No data available. Not expected to be different, scales with pile size
• No need to repeat
• No data available. Not expected to be different, scales with pile size
• No need to repeat
Vibration • Limited understanding of biological relevance
• Vibration from pile driving transmitted down turbine structure could translate into sound pressure and particle motion in water and bottom waves in the sediment
• Limited understanding of biological relevance; theoretically could translate into sound pressure and particle motion in water and bottom waves in the sediment
• Limited understanding of biological relevance; theoretically could translate into sound pressure and particle motion in water and bottom waves in the sediment
EMF n/a n/a n/a
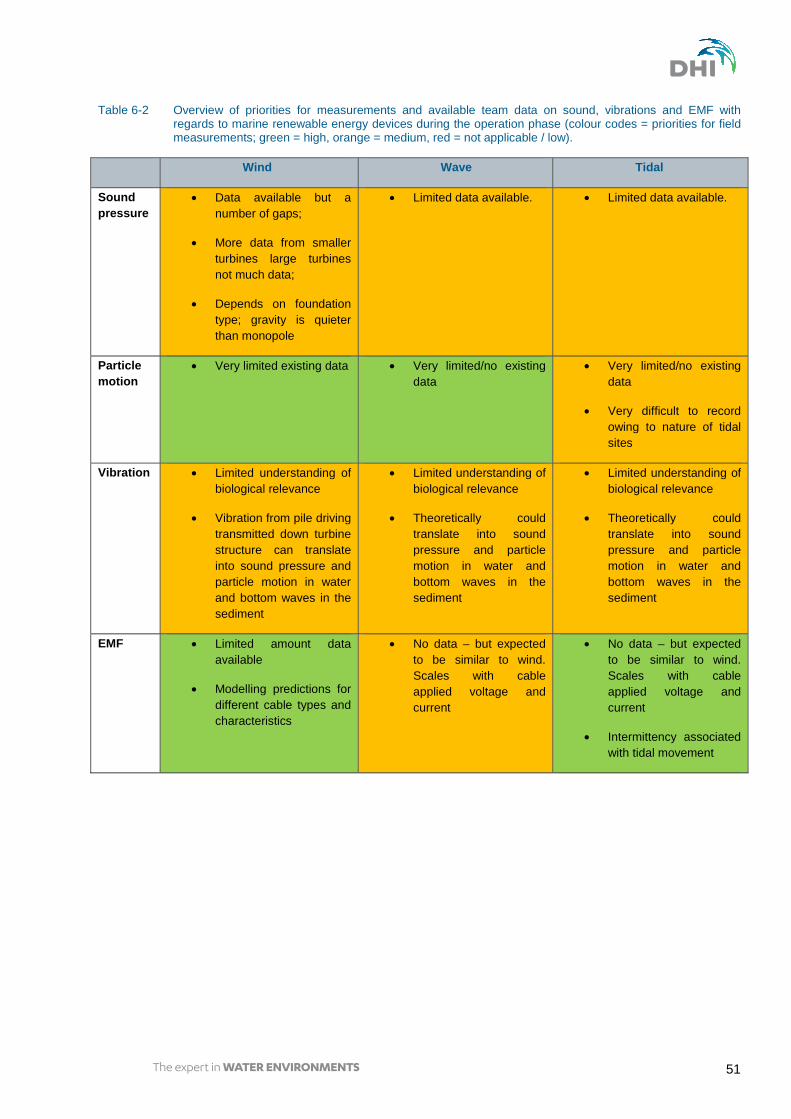
51
Table 6-2 Overview of priorities for measurements and available team data on sound, vibrations and EMF with regards to marine renewable energy devices during the operation phase (colour codes = priorities for field measurements; green = high, orange = medium, red = not applicable / low).
Wind Wave Tidal
Sound pressure
• Data available but a number of gaps;
• More data from smaller turbines large turbines not much data;
• Depends on foundation type; gravity is quieter than monopole
• Limited data available. • Limited data available.
Particle motion
• Very limited existing data • Very limited/no existing data
• Very limited/no existing data
• Very difficult to record owing to nature of tidal sites
Vibration • Limited understanding of biological relevance
• Vibration from pile driving transmitted down turbine structure can translate into sound pressure and particle motion in water and bottom waves in the sediment
• Limited understanding of biological relevance
• Theoretically could translate into sound pressure and particle motion in water and bottom waves in the sediment
• Limited understanding of biological relevance
• Theoretically could translate into sound pressure and particle motion in water and bottom waves in the sediment
EMF • Limited amount data available
• Modelling predictions for different cable types and characteristics
• No data – but expected to be similar to wind. Scales with cable applied voltage and current
• No data – but expected to be similar to wind. Scales with cable applied voltage and current
• Intermittency associated with tidal movement

52
Given the scope and timescale of the MaRVEN project, the focus was on what needed to be measured (based on the reviews summarised in chapters 3, 4 and 5) and represented in Table 6-1 and Table 6-2. As some of these measurements required state of the art bespoke sensors we also included in the field work an assessment of how to measure appropriately the energy emissions (whether sound or EMF) and what can be measured that is biologically relevant. These aspects were fundamental prior to any assessment of effect or even impact (e.g. EMF from intra-array cables, using 3 axis electric field sensors, detecting E fields within the range of EM-sensitive species).
In terms of sound pressure, several members of the MaRVEN team routinely measure this variable using standardised hydrophone methods. We used the available equipment and adapted it according to the site conditions (for details refer to reports from sites in the appendices).
At the field sites we measured one or more of sound pressure, particle motion and EMF, and where possible at different distances from the source emission and a suitable control site.
In summary, for the fieldwork the focus was on sound and EMF for the three MRED technologies considered. Hence, there were some adjustments to the inception plan, namely:
• A focus on sound pressure and particle motion rather than vibration. As the vibration is emitted as sound into the water column.
• Measurement of sound pressure during construction was not required, there were enough data existing already.
• Particle motion was recorded during construction but not at the Belgian site, as planned. New sites were identified and one site was used to successfully measure particle motion of pile driving.
• The priority for the operational phase was to measure at wave device sites. The ability to measure particle motion at a tidal site was deemed compromised by the tidal movement interference.
• EMF was measured at the operational wind farm in Belgium. No cable connected tidal sites were available during the project time frame. The different measurements taken at the OWF site are transferable to other technologies that use similar cabling.
6.3 Methodology
Existing data 6.3.1
Based on the existing data, best available standards (chapter 5) and consultation within the MaRVEN team we determined the key data outputs and units that should be defined when reporting results from underwater sound and EMF measurements to provide some comparability between sound and EMF data studies from different technologies.
Field measurements 6.3.2
The primary objective was to collect field data to fill priority gaps in the knowledge base (see Section 6.2). The field sites where the field measurements were to be conducted represented the three main marine renewable energy sources, namely wind, wave and tidal power.
During the course of the MaRVEN project a number of changes relating to site availability, weather constraints and activities by the companies operating at these sites occurred. By the
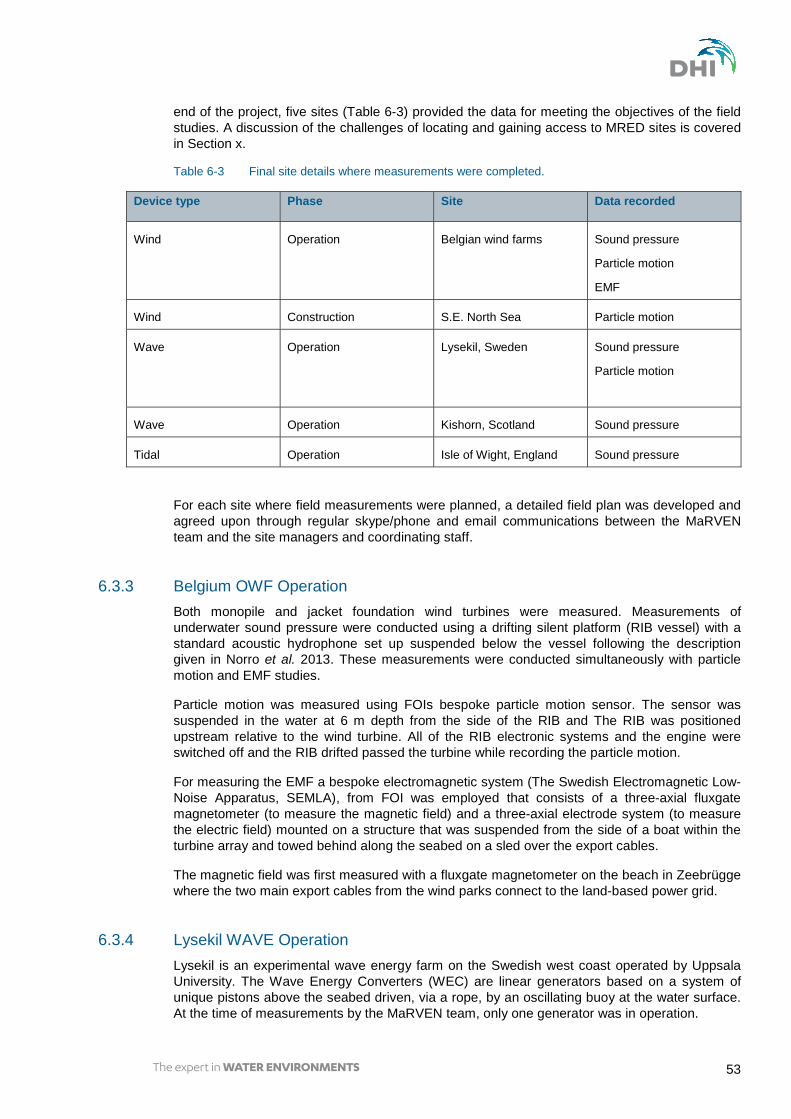
53
end of the project, five sites (Table 6-3) provided the data for meeting the objectives of the field studies. A discussion of the challenges of locating and gaining access to MRED sites is covered in Section x.
Table 6-3 Final site details where measurements were completed.
Device type Phase Site Data recorded
Wind Operation Belgian wind farms Sound pressure
Particle motion
EMF
Wind Construction S.E. North Sea Particle motion
Wave Operation Lysekil, Sweden Sound pressure
Particle motion
Wave Operation Kishorn, Scotland Sound pressure
Tidal Operation Isle of Wight, England Sound pressure
For each site where field measurements were planned, a detailed field plan was developed and agreed upon through regular skype/phone and email communications between the MaRVEN team and the site managers and coordinating staff.
Belgium OWF Operation 6.3.3
Both monopile and jacket foundation wind turbines were measured. Measurements of underwater sound pressure were conducted using a drifting silent platform (RIB vessel) with a standard acoustic hydrophone set up suspended below the vessel following the description given in Norro et al. 2013. These measurements were conducted simultaneously with particle motion and EMF studies.
Particle motion was measured using FOIs bespoke particle motion sensor. The sensor was suspended in the water at 6 m depth from the side of the RIB and The RIB was positioned upstream relative to the wind turbine. All of the RIB electronic systems and the engine were switched off and the RIB drifted passed the turbine while recording the particle motion.
For measuring the EMF a bespoke electromagnetic system (The Swedish Electromagnetic Low-Noise Apparatus, SEMLA), from FOI was employed that consists of a three-axial fluxgate magnetometer (to measure the magnetic field) and a three-axial electrode system (to measure the electric field) mounted on a structure that was suspended from the side of a boat within the turbine array and towed behind along the seabed on a sled over the export cables.
The magnetic field was first measured with a fluxgate magnetometer on the beach in Zeebrügge where the two main export cables from the wind parks connect to the land-based power grid.
Lysekil WAVE Operation 6.3.4
Lysekil is an experimental wave energy farm on the Swedish west coast operated by Uppsala University. The Wave Energy Converters (WEC) are linear generators based on a system of unique pistons above the seabed driven, via a rope, by an oscillating buoy at the water surface. At the time of measurements by the MaRVEN team, only one generator was in operation.
54
The first objective was to demonstrate that it is possible to measure particle motion and sound pressure from a wave energy convertor. The multisensory platform designed at FOI was used to measure PM and pressure via a three-axis accelerometer and a hydrophone. The second objective was to try to capture the short but loud sound described by Haikonen et al (2013) that can occur when the translator strikes the end stop, known as an ‘end stop hit’. However, this only occurs when waves are high (> 2-3 m).These measurements were conducted simultaneously with particle motion.
Kishorn WAVE Operation 6.3.5
The aim at this site was to measure sound pressure levels and acoustic signatures of a very different wave energy device to the Lysekil oscillating buoy, the WaveNET under varying wave and sea conditions. Developed, constructed and deployed by Albatern Wave Energy, WaveNET is a Wave Energy Converter (WEC), which is flexible in all directions, enabling it to capture wave power regardless of wave direction and array configuration. WaveNET arrays consist of single interconnecting SQUID units which are modular and scalable.
Acoustic measurements were carried out in Loch Kishorn, western Scotland, where a single SQUID unit was deployed and tested. A static hydrophone set up was deployed at approximately 400 m distance to the SQUID device, so as to ensure the safe retrieval of the device and avoid potential entanglement issues. The site was near the port of Kishorn, with regular scheduled ship traffic, passing by the deployment site. In addition, several fish farm sites with multiple cages were within a few kilometres of the device. The presence of nearby fish farms was notable, since, as shown in the study results, the presence of acoustic deterrent devices (ADDs), dominated the ambient noise measurements at this site.
Isle of Wight TIDAL Operation 6.3.6
Measurements were carried out using the ‘Drifting Ear’ deployment methodology specifically designed by the Scottish Association for Marine Science (SAMS) for sound measurements in high flow tidal sites (Wilson et al. 2014). The basic principal of the Drifting Ear design is to keep a free-floating drogue mounted hydrophone static in relation to a moving body of water rather than the seabed. This approach circumvents parasitic noise created by water flowing over the hydrophone element normally experienced by moored recorders in flowing water. The device hangs at around 6m depth and is connected to a surface float and satellite communication system for field-based tracking, as well as a GPS unit to record precise location information. The recorded satellite and GPS data allow the drift rate and tracks to be reconstructed relative to the turbines of each ‘Drifting Ear’ unit for subsequent analysis.
Several deployments of the ‘Drifting Ear’ were performed at various distances from the PLAT-O device on the Isle of Wight side of the Solent, U.K., within an ebb tide flowing predominantly East-West flow direction, such that the PLAT-O platform and SCHOTTEL turbines were located downstream from a support vessel. Ebb tides were targeted by the turbine company and also for MaRVEN recordings because this tidal-stream dominates at the site.
S.E. North Sea OWF Construction 6.3.7
One of the aims of the MaRVEN project was to measure particle motion during wind farm construction (piling). Since measuring particle motion is far from being a routine job, the first objective was to demonstrate that it is possible to measure it from a piling source in an offshore environment at a set distance. The second objective was to compare measured levels with various mitigation measures in place with levels obtained without mitigation thereby documenting the effectiveness of the mitigation measures in terms of the emitted particle motion. Finally, the particle motion measured was related to the hearing characteristics of some relevant species of receptor to explore an initial risk assessment.

55
The measurement site was located in the German North Sea, where the wind farm site already has a large number of operational wind turbines and several more under construction at the time of the recordings (spring 2015). For the pile-driving of the new wind turbine foundations a heavy-lift jack-up vessel was used to hydraulically hammer the steel monopile foundations (7.5 m diameter) into the sandy seabed in water depth of approximately 35 m.
One pile was used as a reference to test different mitigations technique combinations, thereby enabling particle motion to be measured with and without mitigations. FOIs bespoke particle motion sensor was deployed on the seabed at 750m from the piling. As there are no standards for particle motion a new metric, acceleration exposure, was developed and applied to filtered data which were then interpreted in relation to potential sensitive marine organisms (fish and invertebrates).
6.4 Results
Existing data 6.4.1
The following key data outputs were determined to be appropriate when reporting results from underwater sound and EMF measurements:
i. Sound pressure (spectrum) – frequency spectrum (1/3 octave at a standardised distance i.e. nearest consistent distance across recordings) + closest recording to device (i.e. not standardised)
ii. Sound pressure (max) – peak level zero-peak (Lz-p), for impulsive sound add peak sharpness/rise time
iii. Sound pressure (averaged) – SPL (dB re 1µPa) iv. Sound PM – frequency spectrum (1/3 octave at a standardised distance i.e. nearest
consistent distance across recordings) + closest recording to device (i.e. not standardised) v. Sound PM - peak level zero-peak (Lz-p) and SPL (dB re 1µPa); for impulsive sound add
peak sharpness/rise time vi. EMF – description of power generation (incl. current in cable and cable characteristics) vii. EMF B field – (tesla) viii. EMF E field – (V/m)
Belgium OWF Operation - sound 6.4.2
6.4.2.1 Weather during field work During the first half of the week, the wind was oriented from the North-East- North-West while during the second part of the week the orientation turned to the Southwest. The wind speed reached a max of 13.1 m/s with a mean value of 8.3 m/s during the North wind, during the SW wind a maximum of 10.8 m/s was recorded only one occasion and a mean value of 6.4 m/s.
6.4.2.2 Sound pressure recordings at jacket and monopile turbines and transformer Drifting at a distance of 40 m from E5, a jacket foundation turbine, the Lz-p = 151 dB re 1µ pa for a SPL of 137 dB re 1µ Pa. At 150 m from the source the levels were lower with Lz-p = 137 dB re 1 µ Pa and SPL of 122 dB re 1 µ Pa (Table 2)
The 1/3 octave spectrum of the jacket foundation turbine recorded an important peak at about 50 Hz then secondary peaks at 150 Hz, 400 Hz, 500Hz and 1200 Hz.
When drifting, the nearest distance to the steel monopile H5 was 40 m and the Lz-p = 150 dB re 1µ pa for a SPL of 135 dB re 1µ Pa. At 150 m from the source almost similar values were

56
recorded with Lz-p = 147 dB re 1 µ Pa and SPL of 133 dB re 1 µ Pa (Table 2). The nearest recordings (i.e. at 40m) were similar to those observed at E5, the jacket foundation wind turbine. However, at the greater distance of 150m the jacketed turbine was quieter.
The 1/3 octave spectrum for the monopile foundation also recorded a peak at 50 Hz as well as the one at 140 Hz, their intensities were higher by few dBs than the jacket foundation turbine.
Table 6-4 Extracted results of the sound pressure measurements at the two wind parks farms Northwind (monopile) and C-Power (jacket).
Record& distance
Start time (UT) Duration (s) LZ-P (dB re 1 µPa) SPL (dB re 1 µPa)
Jacket - E5_40m 31/7 @ 10:23:18 6 151 137
E5_60m 31/7 @ 10:40:00 20 148 128
E5_150m 31/7 @ 10:25:00 20 137 122
Monopile -H5_40 m 31/7 @ 12:10 20 150 135
H5_150 m 31/7@12:15 20 147 133
Transformer-OHMV_60m
31/7 @ 12:47:00 20 145 139
OHMV_150m 31/7@12:55 20 139 120
The last survey was made close by the transformer station located inside the Northwind wind farm (Table 2, OHMV). At 60 m from the structure Lz-p = 145 dB re 1 µ Pa and SPL = 139 dB re 1µ Pa. At a distance of 150 m the level zero to peak Lz-p reduced to 139 dB re 1 µ Pa with a SPL of 120 dB re 1 µ Pa. The 1/3 octave spectrum drifting at a distance 60m from the station Showed lower levels than for the two turbines, but peaks were still apparent at 50 and 140 Hz.
6.4.2.3 Measurement of particle motion at jacket and monopile turbines and transformer A key objective was to show that particle motion could be measured at an operational wind turbine. The results from three different measurement surveys (jacket, monopile and transformer station) suggest that it is possible to employ a drifting technique but that this should be complemented with a seabed deployed particle motion sensor combined with accelerometer mounted on the foundations. The reasons being that the sound levels are high due to unwanted motion of the sensor whilst drifting, induced by waves and the heave of the vessel, which resulted in high background levels below 500 Hz contaminating the recordings.
At the jacket foundation turbine, the particle motion showed two tones in the 1/3 octave spectrum, a weak 400 Hz tone unlikely to be attributed to the operational sound of the turbine and a second tone around 1250 Hz, which is also present in the sound pressure measurement. This indicates that the tone was generated by the wind turbine.
The second study was undertaken near to H5, a monopile turbine. The same procedure as for the E5 measurement was employed. The RIB passed the turbine at a closest distance of 40 m. The backgrounds levels induced by the sensor motion were high, particularly for frequencies lower than 500 Hz. The amplitude derived from the power spectrum integrated over 1 Hz bands shows two tones are discernible in the spectrum at 460 and 900 Hz. These two tones were not present in the measurement of sound pressure variations. There is no clear explanation for this result.
The third measurement near to the transformer station (cf. OHSV) showed no clear tone present in the spectrum at higher frequencies. Furthermore, the amplitude of the spectrum decreased
57
with increasing distance, supporting the conclusion that the spectrum was generated by the transformer station. The spectra analysis also showed that the tones observed at the E5 and H5 turbines were not present at the station. It can be concluded that the turbines at E5 and H5 most probably generate the recorded tones.
This study demonstrated that it is possible to study particle motion from a drifting vessel around MREDs. Earlier studies performed by Sigray & Andersson 2011 showed that particle motion levels are weak and already below background noise at about 10 m distance from the wind turbine (2 MW). They concluded that the background noise increased with increasing depth. The measurement undertaken in this study confirms their results. Still, the present study suggests that particle motion is detectable at 40 m distance from the steel monopole whilst being barely discernible close to the foundation of the jacket-based turbine. The results obtained at the monopile are in part likely to be attributed to the tower length and the power capacity of the turbines. The background levels encountered suggest that an investigation should be complemented with seabed-deployed sensors, especially for investigating levels below 100 Hz where background precluded measurements of particle motion.
6.4.2.4 Measurement of sound pressure at monopile turbines for different sea states Existing and newly collected data showed an increase in sound pressure level and maximum emitted sound during operation and higher sea state/wind regime over several weeks. The jacket foundations appeared to have lower SPL compared to the monopile foundation turbines at the wind speeds assessed.
Belgium OWF Operation - EMF 6.4.3
The beach experiment demonstrated that the magnetic field component emitted by electrical cables can easily be recorded on land. The electric current in the cable was 51±9 A with the signal dominated by a 50 Hz component, as expected from an AC-transmission system in Europe. The observed rms-variation of the background Electric (E) and Magnetic (B) fields were 0.8 μV/m and 0.14 μT respectively.
It should be noted, however, that measurements obtained in the water will not be fully comparable since the conducting water will alter the EM field. The land-based measurement served as a simple proxy for the emitted EMF and provided the evidence of the relative intensity of the fields that could be expected in the water.
6.4.3.1 Measurement of fields from turbines and infield cables at the wind farms The experiment was done at the same wind turbine as the sound measurements. The EMF-sensor was suspended from the side of the RIB at 6 m depth and the engine was switched off whilst the boat drifted. The water depth was 20-25 m and the cable was buried about 1.0-1.5 m below the seabed.
Within the C-Power wind farm, the maximum electric field was 0.3 mV/m and the magnetic field was 4nT associated with an inter-turbine cable. The signal content was dominated by the 50 Hz component. For the Northwind farm The magnetic field was not clearly identified and only a weak electric field was observed at the closest distance to the turbine. The nearest infield cable was located south of the turbine.
6.4.3.2 Measurement of fields from infield and export cables at the Northwind’s transformer station EMF was recorded on both sides of the transformer station. The map of the area (see Annex 8b) showed that there are a number of infield cable branches converging at the station. The export cable exits in a southeast direction from the station, which is where the strongest fields were observed. At the most northern point of the track the fields were relative low where there is no

58
infield cable located. The same phenomena were discernible in the magnetic field. The current in the export cable was 70 A.
The maximum observed electric field was 1.5 mV/m and the magnetic field was 17 nT at a distance between sensors and cables of 15 m.
Lysekil WAVE Operation 6.4.4
The wave height varied over the measurement period as a consequence of changes both in wind speed and direction. Only waves approximately 1-3 m height were expected to generate large enough waves for the wave buoy to lift the translator high enough to produce electricity. The analysis of sound focussed on wave heights of between 1.5 - 2 m.
The main energy of the total particle acceleration during scraping transient sounds (1-2 sec long) was below 100 Hz, although it was significantly stronger than the ambient levels for all frequencies measured. The hydrophone signal, did not contain strong transients in the time span as seen in the acceleration signals, although, it was noticeable.
Kishorn WAVE Operation 6.4.5
Weather conditions were relatively calm with wave heights below 1m for most of the deployment period. However, over two days wave heights increased up to 2m. For this period, ambient noise data were recorded 400m distant from the single Albatern SQUID device. No tonals or other sound signatures which could be directly attributed to the operation of the WEC were detected in the data. Subsequent detailed sound pressure level analysis was then carried out for two days of contrasting wind conditions. For each day snippets of 1-2 seconds, data files were identified and analysed with and without Acoustic Deterrent Device (ADD).
Data were dominated by echoes and/or distant presence of ADD pulses with main energy at 10 kHz but some energy extending down to 100 Hz. Mean SPL was between 55 and 70 dB re 1 µPa, except a peak at 10 kHz and subsequent smaller peaks at 20 and 30 kHz which were related to echoes and distant recordings of ADD signals.
The results indicated that at this site broadband contribution of ships and ADDs had a larger influence on the overall soundscape than weather related sound contributions during the recording period.
No obvious sound signatures could be observed and sound levels on the analysis day with higher sea state were not significantly elevated, the contribution of the single WEC SQUID device was deemed negligible with respect to the overall soundscape at this site, at least at the spatial scale of the presented recordings (i.e. 400 m distance from the WEC).
UK Tidal Operation 6.4.6
Two individual drifts were selected, one without the turbines operating (R3) and the second with both turbines operating (R6). During the period of the analysis, the ‘Drifting Ear’ was displaced approximately 184 m for R3 and 228 m for R6 by the current. Median current speed was 1.3 m/s for R3 and 1.6 m/s for R6.
Narrowband, stepwise frequency modulated tonal signals at different frequencies but with constant relationships could be observed in all analysed data collected while the turbines were running. Overlapping and slightly offset tonal signals were clearly associated with the turning of both turbines simultaneously. The two signatures showed different shapes, which were likely dependent on the offset between the two revolving turbines. Most energy of the observed tonal signals was between 1 and 2.5 kHz most likely related to the gear ratios of the turning turbines and the operating frequency converter. There was also some energy extending as low as 200 Hz and a broadband signal was observed between 4 and 6 kHz.
59
The direct comparison of recorded sound levels in third octave bands for ambient vs operational turbines showed a 10 to 15 dB difference in sound levels in the dominant sound bands (1 – 2.5 kHz) at a median distance of 282 m between ‘Drifting Ear’ and operating turbines, as well as slightly elevated sound levels (approximately 5 dB) in the lower frequencies between 200 and 400 Hz and in the higher frequencies above 4 kHz. Some of these differences in sound levels may be due to the slightly higher flow speed (0.3 m/s), however, most of the observed difference, is likely due to the operational turbine sound. A preliminary look at sound levels in the four third octave bands with most energy with range revealed a 3 to 5 dB decrease in sound levels over a distance of about 200 m, indicating, that at a distance of about 500 – 600 m, sound levels emitted by the turbines may be expected to be equal to or below ambient sound levels in this environment.
S.E. North Sea OWF construction 6.4.7
Within the spectrograms constructed from the noise recordings, the most pronounced levels were when the mitigation was removed. When all mitigation systems were on, the noise was substantially lower over the whole frequency range. For the trial with the stand-alone bubble curtain on, strong low frequency noise (<100 Hz) were apparent. Through the measurement, there were otherwise some low frequency noise (<20 Hz) that were most likely was caused by waves. Ambient noise in the area contained some stationary noise in the frequency band 100-1000 Hz, which share characteristics with that of typical distant shipping noise.
Plotting the received levels in 1/3 octave bands clearly highlighted the effect of hammer energy and mitigation. Higher hammer energy resulted in higher levels and mitigation measures resulted in a reduction of particle motion. For the stand-alone big-bubble-curtain (BBC), relatively high levels were recorded in the frequencies below 100 Hz. The combination of the two mitigation methods reduced the particle motion to a level that is comparable to the ambient level.
The ambient noise - e.g. the period between piling including the removal of the mitigation, was relatively high above 100 Hz. With the exception of very low frequencies, the particle motion from pile driving was always above ambient particle motion.
The results from this study show that particle motion levels at 750 m are above ambient noise for most of the frequency spectrum. The results also confirm that noise mitigation systems are quite effective in reducing particle motion levels considerably, especially when used in combination.
There are no international standards to use when measuring or analysing particle motion in water. In order to have a value similar to SEL (Sound Exposure Level) an approximation was made that was termed the acceleration exposure (AE). To date, there are no studies or measurements to compare the values found in this study with, thereby making it very difficult to extrapolate any effect on marine animals.
6.5 Risk modelling
The focus of the risk modelling was to address the gap identified in various noise impact assessments that have been undertaken at specific sites across MRED projects in EU waters, specifically from the point of view of detectability of the noise by marine life. In that sense, it supports the review on noise impacts undertaken in WP 2. A methodology was proposed to evaluate a noise footprint, which was illustrated through an exemplar risk assessment case study based on offshore wind farms in Belgian waters. The study used data mining, in-situ noise measurements and modelling to quantify the levels and areas where the noise induced by MRE projects was predicted to be above the baseline noise from shipping/vessel movement. The impact assessment applied a generic and representative approach in order to guide future EIA conducted across EU waters.

60
To achieve the quantification of the noise footprint, the methodology required an assessment of the baseline noise generated by the other maritime activities at the relevant basin scale. The comparison of the noise from construction or from operation with the baseline noise provided quantified levels of noise elevation above the baseline, and the area of influence of the project based on local geography.
The study demonstrated that the area of detectability largely depended on the existing environmental conditions (i.e. sediment type and bathymetry), in addition to the noise generated by the other maritime activities occurring in the area but which were not related to MREDs. Therefore, the emergence of any noise from MREDs during construction and during operation is highly dependent on the local context which is determined to a large degree by the sediment type, the bathymetry and shipping activities in the area.
Basing the exemplar risk assessment on the Belgian offshore wind farm case study, it was confirmed that there were large areas where there was potential for behavioural responses of harbour porpoises, mid-frequency species and pinnipeds. However, during construction, the combined effect of the bathymetry and the noise generated by shipping in the Belgian example was predicted to be of greater relevance3 to the porpoises, along the coastline where the noise emitted from a single pile-driving strike did not add to the soundscape for at least half of the time. Hence, this illustrated the importance of understanding the existing precise background soundscape context when assessing the risk of pile driving to sensitive receptors, such as the porpoises. An additional benefit of quantifying the footprint for a single strike is that this area also defines the geographical limits for cumulative effects from multiple pile-driving strikes; if one strike does not add to the existing soundscape then multiple strikes will also not.
For operational noise, we proposed a similar generic methodology to quantify the cumulative area of detectability, which we have illustrated for the particular case of the three windfarms operating in the Belgian waters. These predictions were limited to low wind speeds but were considered for several probabilities. The results suggest that the area of detectability for operational noise will be mainly limited by the fact that the other anthropogenic pressure will dominate the soundscape most of time for this particular case (see note 3).
3 Note here that in this example,the analysis was restricted to the 2014 summer period of 3 months of shipping data which were used based on AIS data.

61
Figure 6-1 Ambient noise assessed in summer 2014 (top left); broadband noise footprint of a 5.2m m diameter single pile-driving strike in the summer season (top right); cumulative emergence of the operational noise above the 50th percentile (median) of the baseline ambient noise in summer for low wind speeds in the 5 to 80 Hz bandwidth (bottom). The white areas are places where the noise from commercial shipping dominates the noise from the MRED project at least half of the time.
6.6 Underwater sound measurements from the FINO1 platform, North Sea, Germany
In the summer of 2009 a hydro sound recording system was installed at the FINO 1 research platform close to the first German offshore wind farm Alpha Ventus in the North Sea. Since then the system is continuously recording underwater sound.
Data archived cover construction sound of Alpha Ventus wind turbines and pile driving sound from other distant offshore installation works as well as ambient noise, shipping sound, weather induced noise, generally related wind farm sound and operational sound of the nearby turbines.
A typical example month, June 2011, was chosen to analyse the effect of operational sound and weather induced sound. Both sources hardly influence the underwater soundscape that is dominated by sound from ships and construction and can therefore not be identified in the sound pressure level.
62
Although about 60 km away, the piling sound associated with the wind farm construction work, could be identified well above background noise. .
To obtain some general information about operational sound from the Alpha Ventus wind farm, eleven periods, each lasting several hours were analyzed. In six periods, all wind turbines were working on nominal power. In five periods, all turbines were switched off. No clear relation between turbine status and recorded sound pressure was found. In narrow band spectra for these eleven periods, small differences depending on the turbine status can be identified at single frequencies. A direct correlation between rising wind speed and an increasing sound pressure level is not clear obvious due to the constant overlay of ship-induced sound. However, sorting out shipping dominated sound and focusing on single frequencies a relationship between underwater sound and wind speed can be found.
6.7 Overview of the field measurement campaign
Taking all of the outputs from the activities, we provide the key findings with regard to their biological relevance as identified by the MaRVEN project team.
Key findings – Sound 6.7.1
The measurements at the Belgian wind farms were the first of their kind to simultaneously measure sound pressure, particle motion and EMF. The important results were that particle motion is measurable from an OWF turbine and that it was lower at the jacket-based turbine compared to the steel monopole; this corresponds with the sound pressure measurements, where monopoles emitted higher sound than jacket foundation turbines.
Another first was the measurement of particle motion during pile driving of steel monopiles. As there are no standards for particle motion, a metric named ‘acceleration exposure’ was developed, calculated and presented. Particle motion levels were shown to be reduced by mitigation, most effectively using a combination of measures. How receptor animals would experience particle motion will to a large degree depend on where in the marine environment they inhabit; the seabed or the water column. Our results indicate that for most fish, particle motion levels at 750 m are high enough to be detected during pile driving of even a mitigated pile. Yet, in sharks and rays (elasmobranchs) detectability of mitigated piles is likely restricted to relatively short ranges from the source depending on the ambient noise in the area. For invertebrates there is even less information on how they perceive particle motion but the literature would indicate that some invertebrates should be able to detect the piling noise at a distance of 750 m, whether mitigated or not.
At the Swedish wave site, we also simultaneously measured particle motion and sound pressure from a wave energy converter. The levels of particle motion were low but from a fish receptor, PM would be detectable at 23 m for wave heights up to 2 m. interestingly, levels of sound pressure were below hearing threshold at 23 m for fish at wave heights up to 2 m.
The Scottish wave site showed negligible effect of the single wave device noise to the overall soundscape at 400 m distance, hence it was concluded that any addition to the soundscape by the device would likely be small. The recorded ambient sound pressure levels were consistent with weather related events, local shipping noise, as well as dominated by the continuous contribution of Acoustic Deterrent Devices deployed on several fish farm cages in the area. Hence, there is no predicted effect of the noise emitted by the wave device on receptor species in the area at the distance measured (400m+). Whether levels of noise emitted by the device(s) are within the range of receptor species is unknown but based on our study they would be very localised and difficult to decipher owing to the other noise sources in the area.
Wave devices function in very different ways and one measurement at one device cannot describe the noise from other designs. More measurements of both sound pressure and particle
63
motion relating to various designs are necessary in order to determine the way that sound pressure and particle motion are generated at biologically relevant levels.
The maximum sound level in terms of particle motion remains to be described for any wave energy device. Future measurements should be undertaken under a variety of weather and wave conditions, since variable wave heights may change the interactions and potential noise generation of sound emitting components of the devices.
Finally, noise and particle motion levels should be compared between single devices and arrays of different sizes to evaluate possible cumulative noise generation.
For the tidal device (turbines mounted on a mid-water platform) a distinct step-wise frequency modulated tonal sound signature (mainly between 1 – 2.5 kHz), was apparent which matched the acoustic signature produced by the two turning turbines. Sound pressure levels were elevated by as much as 10-15 dB as compared to baseline ambient noise levels.
Given the low frequency distribution of the recorded turbine signature and noise levels above ambient noise at a given range, it is possible that harbour porpoises and pinnipeds could detect the turbines, although the main energy of the turbine noise is emitted at the lower end of their hearing sensitivity. Some fish species, such as herring will likely be able to hear the signal, as their hearing extends into the mid-range, while other low frequency specialists, like cod may be able to detect the recorded lower frequency sounds produced by the turbines.
It should be mentioned here that in terms of wave and tidal devices emitted sound is device specific and the measurements were taken on a deployed single test devices. Thus one should have in mind that the sound level as well as frequency component of generated sound may differ between different devices due to their structure, number of devices deployed at one location as well as the existing ambient noise levels at a site.
Key findings – EMF 6.7.2
Electric and magnetic fields from industry standard inter-array and export electricity cables were clearly measurable during power generation by offshore wind turbines. The EM field of a wind turbine was considerably weaker than the field from the cables.
The emitted EMFs were higher for the export cables to shore compared to the inter-turbine cables, which was predicted based on the amount of power being transmitted and the lower electrical capacity rating of the cables.
The E-fields measured were within the range of known detection by sensitive receptor species. The magnetic fields were at the lower end and potential outside of the detectable range of known sensitive species.
Two different methods to measure EMF were trialled. The drifting has the advantage that it can assess the EMF relatively quickly and it avoids the risk of damaging the sensors on the seabed. The seabed sledging demonstrated that the EMF at the seabed where cables are buried can be measured as well as the propagation distance if the sledge is pulled perpendicular to the axis of the cable.
The measurement technology was proven and demonstrates that fields at biologically relevant levels can be observed both by suspending the sensors from the side of a boat as well as by sledging. The results are restricted to AC-transmission systems and are transferable between device types using cables of similar characteristics. The same methodologies should be employed on a DC-transmission system.
64
7 Research Priorities
An important output of the MaRVEN project was to determine the priorities for further research following the reviews and field studies. This chapter of the final report sets out the process that the MaRVEN team went through, including justifications for the recommendations for further research.
Our research priorities reflect the key gaps in knowledge, which are the basis for the recommended research priorities by the MaRVEN team that have been identified through:
• Reviews’ main findings (see previous chapters) • Analysis of field measurements and data • MaRVEN team’s assessment of the importance of the knowledge to be gained
It is important that knowledge gaps were appropriately identified and justified with the aim of building the evidence base from an objective stance. The MaRVEN team took a holistic approach whereby key research topics from each of the WPs with supporting argument were considered in the context of the level of certainty associated with the up to date evidence and the importance of not addressing the particular topic.
In addition, we have taken the perspective of what may be of heightened importance in terms of cumulative and long term effects and if an issue was identified what may be the potential environmental cost of not mitigating.
Furthermore, there is added value in our consideration that the activities introducing energy into the environment and their cumulative and long term effects should not be already fully regulated under other EU-regulations or monitoring and assessment should deliver added value because e.g. it enables assessment of potential cumulative impact caused by different activities (not necessarily restricted to sound/energy). It is worth highlighting that there is other priority research that, whilst important for interpretation in relation to MREDs and the marine environment, is more fundamental research that we considered would perhaps be better funded via other programmes because the outputs can be used for a variety of contexts not just renewable energy.
Within this overall context, the report constitutes the MaRVEN team’s recommendations to provide some direction on the likely areas where priority research is envisaged. We have made only short supporting statements to each priority. The interested reader should refer to our reviews (chapters 3-5) and the results of the data collection campaign (chapter 6) for more information.
65
7.1 Noise and vibration
The most developed understanding within the set of topics considered by MaRVEN is that of underwater sound. However, there are some significant gaps in knowledge that lead to research priorities for underwater sound (and the linked topic of vibration). When determining the potential research priorities we focused on the scale, duration and intensity of the sound and the amount of available evidence regarding impact.
One of the most urgent topics in Europe related to energy emissions is to properly determine the impact of impulsive sound that is generated during MRED construction activities on marine species. This is underlined by the Marine Strategy Framework Directive and associated expert group (see Dekeling et al. 2013). The MSFD indicator 11.1.1 covers loud, low-mid frequency impulsive sound such as emitted during offshore wind farm construction activities.
Key draft research priorities 7.1.1
The key draft research priorities that we suggest fit with respective risk assessment categories and should focus on, in rank order:
• Dose-response: Pile driving effects on fish and invertebrate species of commercial or conservation importance and/or key to ecosystem function and investigation of whether effects translate to population level consequences (e.g. displacement or altered movement patterns).
- If predictions of future development turn out to be correct, MREDs will be one of the largest contributors to the introduction of impulsive sound in the sea. Many areas designated for wind farm development are vital areas for fish, for example, in herring spawning areas or along migratory routes of some highly protected species (such as Atlantic salmon and European eel). For invertebrates, many species have limited movement ability hence are vulnerable to elevated sound levels as they are limited in their ability to move away from the sound source. Of the few species of fish and invertebrates that have been studied, a number are known to be very sensitive to sound and investigations have shown behavioral effects from impulsive sounds (e.g. air guns) over large ranges (details, see chapter 3).
- Much of the consideration of underwater sound is based on knowledge from sound pressure rather than particle motion; however, the latter is essential for many species of fish and invertebrates. Through MaRVEN we have demonstrated that particle motion is recordable at levels that can be detected by fish and invertebrate species. This is particularly relevant when assessing the likely effects of pile driving. The key biological aspect that needs to be addressed is the link between levels of particle motion and dose response for fishes and invertebrates lacking swim bladders (e.g. mackerel, flatfish, and cuttlefish). Implicit in this consideration is the need to understand species associated sensory abilities. We have made a start by documenting particle motion during impact piling from a fixed position (see chapter 6). Yet, further investigations covering levels of particle motion at further distance from the source are critical to complete the risk assessment for fish and marine invertebrate impacts.
- To ensure the risk assessment undertaken on pile driving is appropriate it is fundamental that an aspect of the studies should take relevant dose-response outputs and use them to investigate population level consequences.

66
• Dose-response: Pile driving sound effect on baleen whales
- There is some overlap between specific areas planned for MREDs, particularly wind farms, and ranges of mysticete cetaceans (e.g. minke whales on the Dogger Bank). Pile driving sounds carry far from the source and could potentially affect the behaviour of protected baleen whales such as minke whales. Such research has wider implications outside Europe, many offshore wind farms are planned along critical habitat of baleen whale (e.g. humpback whales off Cape Cod, Mass). As low-frequency cetaceans (Southall et al. 2007), baleen whales are potentially more vulnerable to low frequency pile driving sound than other cetaceans.
• Exposure assessment: Sediment vibration due to construction of MRED
- Common risk assessment takes only the sound transmission in the water column into account. Yet, a significant portion of the acoustic energy from pile driving are transported from the pile to the sediment and then subsequently released back into the water column. This could lead to complex sound fields at distance and in-sediment effects that need to be understood better to complete the risk assessment. How important this is for receptor species, particularly species that live on or within the sediment is currently unknown.
Other key knowledge gaps 7.1.2
Other key knowledge gaps that remain priority topics that require consideration are:
• Dose-response: Cumulative exposure- effect of repetitive sound over the long term.
- There is an agreement among scientist that physiological effects such as injury or temporary hearing loss are related to the dose of exposure, which involves the duration of impacts (see also WODA 2013). One important question here is whether multiple pile driving impulses have larger scale effects in comparison to single strikes.
• Exposure assessment: Consideration of the relationship between disturbance and sound level/sound frequency/ and exposure duration in terms of mitigation.
- Understanding whether is it better, for example, to expose at a higher level for 1% of the time, or 3dB less for 10% of the time. Alternatively, is there an acceptable resting (quiet) period during a day or a season?
• Exposure assessment: Methodologies to establish science based risk maps which would address both probability of occurrence and severity of the consequences.
- These risk maps could take into account sound level, statistics of exposure duration, noise footprint, probability of presence, size of the habitat, tolerance to displacement, variability in sound characteristics.
• Exposure assessment: Ground roll waves emitted during pile driving
- Ground roll waves are vibrations at the interface between sediment and water column. They can be of medium scale (i.e. several km) and potentially effect bottom dwelling creatures (i.e. benthic fauna and flatfish).
67
• Exposure assessment: MRED construction – new technologies (vibropiling, bucket piling) sound levels
- Recently, there have been new technologies developed that can be used in MRED construction instead of pile driving. The sound levels emitted from these activities are supposedly much lower than from impact piling but there are little data available.
• Exposure assessment: Sound levels of wave and tidal energy converters in operation
- Our measurements indicate only relatively low sound levels from tidal and wave energy converters (TEC, WEC; see chapter 6). Yet, we have also highlighted the diversity of TECs and WECs. Therefore, we recommend additional data collection efforts to round up the picture.
• Dose-response assessment: Masking effects of operational sound on low frequency cetaceans and fish
- Many larger whales communicate with low frequency calls that overlap with the frequency of operational sound. These calls function over long distances and it is at least conceivable that arrays of wind farms could act as acoustic barriers that could affect long-range communication. Most fish on the other hand communicate over very short distances. Thus, when inside the wind farm, fish communication could be altered.
• Exposure assessment: Infrasound during operation of MREDs
- The results of the study undertaken at the FINO 1 platform (see Annex (a) have shown that operational sound from offshore wind farm comprises very low frequencies (5 Hz) below the range of human hearing. These low frequencies could potentially travel far underwater and lead to effects on fish.
7.2 Electromagnetic fields
The output of chapter 4 clearly demonstrated that there are significant gaps in knowledge about EMF. At present, there is a pervading attitude that the knowledge base is so poor that it is not worth consideration. Our opinion is that by ignoring consideration of EMF effects on marine animals then the marine renewable energy sector is missing a key opportunity to demonstrate best practice in responsibility (much in the same way as pile-driving mitigation highlights developer responsibility during construction based on best understanding). In a similar way if EMF studies are undertaken that demonstrate no significance of interaction with receptor animals then decisions can be made to reduce unnecessary environmental monitoring, however if there is some significant effect then we can mitigate appropriately.
The field studies showed that EMFs are emitted into the marine environment, particularly in association with the sub-sea cabling associated with a marine renewable energy device. The levels measured were higher than those predicted and they are within the range of intensity that is detectable and may cause a reaction in sensitive species. The key aspect that is important is whether any reaction, if it occurs, raises the risk of any biologically relevant impacts. This may become of greater relevance in the future with the development of large devices and higher power rated cables.
68
Key draft research priorities 7.2.1
In light of the state of knowledge and the evidence of EMFs measured through the MaRVEN project, we suggest that studies should be:
• Dose-response assessment: Establish the response/effect on key marine species at their most sensitive stages of life to exposure to a range of EMFs (sources, intensities predicted from MREDs).
- Information from such studies would provide a valuable first database to assess potential risks due to EMF. It could help to assess emergent properties that would be associated with impact at the biologically relevant unit of the species population.
• Dose-response assessment: Field experiments (e.g. tracking studies) on the potential for cumulative impacts from multiple cables in relation to movement/ migratory behaviour of EMF receptor species.
- Such studies should take relevant dose-response outputs and apply population-based approaches (e.g. ecological modelling) to determine significance.
• Exposure assessment: Develop further affordable techniques for measuring electromagnetic fields so as to validate EMF predictions within models.
- So far, only custom-made EM detectors, such as ours, have been used in measuring EMFs. In order to facilitate a better comparison of measurements, including measuring emissions from larger devices and higher rating cables in the future, further development of detectors and deployment in different situations is necessary.
Other key knowledge gaps 7.2.2
Other key knowledge gaps that were identified through the review were addressed through WP5 of MaRVEN. They are not regarded as strict priorities as they provide an extension to the knowledge base namely:
• Exposure assessment: Undertake a programme of measurements at several contrasting MRED installations/cables to establish electromagnetic levels linked to location/depth, cable type, number and extent, electrical topology of the MREDs. These field studies should then be applied to verify modelled results.
- Today there is large uncertainty about the actual levels of EMF emitted from the MRED cables as the cables vary according to different manufacturing process and different cable characteristics and deployments in the field (e.g. burial vs. rock armouring). This creates a large uncertainty in emitted levels that cannot be modelled owing to lack of baseline data. If dose response studies highlight that exposure of marine organism to EMF is an issue then the understanding gained from field measurement programme will feed directly into considerations of how to mitigate the effects.
• Exposure assessment: standards for measuring EMF
- If EMF is deemed of significance, based on above and further understand, then guidelines and standards for measurement methodology EMFs should be developed.

69
7.3 Standards
The review undertaken in chapter 5 raised a key question about its precise. From onshore noise emission control, it is well known that standards elaborated by interdisciplinary expert groups are desirable because we would suggest that there should be an initiative and resourcing for periodical meetings of a “Workgroup on Underwater Energy Emissions from MREDs”.
Standards constantly have to be adapted and improved, based on continual feedback from their use. However, it is important to recognize that the best standard has to be applied correctly. From onshore noise emission control it is evident that round robin tests (i.e. measurements according to an identified standard, performed by several measuring institutions) are necessary to ensure comparability of reported data, even if the standards seem to be elaborated and well defined. Findings from the assessment of these round robin tests will significantly support the process of improvement of the standards.
The review in chapter 5 combined with the outputs from other reviews presented in this report and their associated research priorities led the team to consider future EC research priorities in relation to standards.
Key draft research priorities 7.3.1
The key research priorities at this stage concerning standards are:
• Determination of the parameters influencing the reproducibility of underwater sound measurements (e.g. measurement depth)
• Definition and validation of input parameters for existing propagation models, especially for shallow water regions. Including validation of results
• Enhancement of near field/source modelling methods for MREDs and validation of results
The specific research undertaken should ensure that it has the wider consideration of improvement and application to unification of national/EU standards and requirements.

70
8 Conclusions
Through structured reviews of the topics, field studies to address key knowledge gaps and an assessment of the findings in a risk assessment framework the MaRVEN project has been able to consolidate our understanding of underwater sound, vibration and EMF from MREDs and provide a set of research priorities that we suggest will be beneficial to the industry, regulatory and scientific sector in moving out of the way potential blockages to promoting MREDs. It also provides a focus on which future research to further enable the MRED sector advance is prioritised.

71
9 Acknowledgements
We would like to thank the people who helped to fill out the questionnaires sent out on standards: Rene Dekeling, Sonia Mendes, Maria Boethling and Christ de Jong. For help with the fieldwork, we like to thank the companies G-power, Belwind and Northwind and DONG Energy Wind Power (Denmark).
Moreover the MaRVEN team would like to acknowledge the time and support of a number of people and organisations who were involved in the field work at some stage in the planning and/or the undertaking of the fieldwork, including Jan Sundberg and Kalle Haikonen at Uppsala University, David Cowan and Michael Butler at EMEC, Marine Current Turbines, Tony Hawkins, Ian Davies, CM Assets ltd, Dutch Tidal Test Centre. Teresa Simas at Wavec.
We thank Albatern, especially David Campbell, for their enthusiasm and for being extremely helpful providing logistics, site access and data on wave height and weather conditions. We thank Janet Price from the Kishorn Port Office for providing data on vessel movements and providing site access. Thanks to Douglas Gillespie from Sea Mammal Research Unit – SMRU, St Andrews University, for loan of the recording equipment.
Thanks to Sustainable Marine Energy Ltd, particularly Clemency Ives and Andrew Hunt, for their support during fieldwork. Also to Ralf Starzmann from SCHOTTEL HYDRO for confirming the turbine acoustic signature and for additional information on turbine operation. We would also like to thank Federica Page (Baker Consultants) for her great help in the field campaign.
72
10 Literature
/1/ Ainslie M, A., (2011) Standard for measurement and monitoring of underwater noise. Part 1. Physical quantities and their units., TNO-DV 2011 C235
/2/ Boyd I, Brownell B, Cato D, Clarke C, Costa D, Evans PGH, Gedamke J, Genrty R, Gisiner B, Gordon J, Jepson P, Miller P, Rendell L, Tasker M, Tyack P, Vos E, Whitehead H, Wartzok D, Zimmer W (2008) The effects of anthropogenic sound on marine mammals - a draft research strategy, European Science Foundation and Marine Board
/3/ BSH (2011) Offshore-Windparks Messvorschrift für Unterwasserschallmessungen Aktuelle Vorgehensweise mit Anmerkungen Anwendungshinweise, Bundesamt fuer Seeschifffahrt und Hydrographie, Hamburg
/4/ Dekeling RPA, Tasker ML, Van der Graaf AJ, Ainslie MA, Andersson MH, André M, Borsani JF, Brensing K, Castellote M, Cronin D, Dalen J, Folegot T, Leaper R, Pajala J, Redman P, Robinson SP, Sigray P, Sutton G, Thomsen F, Werner S, Wittekind D, Young JV (2013) Monitoring Guidance for Underwater Noise in European Seas -Executive Summary. 2nd Report of the Technical Subgroup on Underwater Noise (TSGN) November 2013 PART I - Executive Summary & Recommendations, Brussels
/5/ de Jong CFA, Ainslie M, A.,, Blackquiere G (2011) Standard for measurement and monitoring of underwater noise, Part II: procedures for measuring underwater noise in connection with offshore wind farm licensing, TNO-DV2011-C251
/6/ Energistyrelsen (2014) Guideline for underwater noise - Installation of impact-driven piles Enrgistyrelsen (Danish Energy Agency)
/7/ Haikonen K, Sundberg J, Leijon M (2013) Characteristics of the Operational Noise from Full Scale Wave Energy Converters in the Lysekil Project: Estimation of Potential Environmental Impacts. Energies 6:2562-2582
/8/ Hawkins AD, Roberts L, Cheesman S (2014) Responses of free-living coastal pelagic fish to impulsive sounds. J Acoust Soc Am 135:3101-3116
/9/ Lepper P, Robinson S, Humphrey V, Butler M (2014) Underwater Acoustic Monitoring at Wave and Tidal Energy Sites: Guidance Notes for Regulators
/10/ Madsen PT, Wahlberg M, Tougaard J, Lucke K, Tyack P (2006) Wind turbine underwater noise and marine mammals: implications of current knowledge and data needs. Marine Ecology Progress Series 309:279-295
/11/ Marmo B, Roberts I, Buckingham MP, King S, Booth C (2013) Modelling of Operational Offshore Wind Turbines including noise transmission through various foundation types, Scottish Government Edingburgh
/12/ NOAA (2013) Draft Guidance for Assessing the Effects of Anthropogenic Sound on Marine Mammals, National Oceanic and Atmospheric Administration, Washington
/13/ Norro A, Rumes B, Degraer SJ (2013) Differentiating between Underwater Construction Noise of Monopile and Jacket Foundations for Offshore Windmills: A Case Study from the Belgian Part of the North Sea. The ScientificWorld Journal 2013:1-7
/14/ NPL (2014) Good Practice Guide No. 133 Underwater Noise Measurements
/15/ Popper AN, Fay RR (2011) Rethinking sound detection by fishes. Hearing Research 273 25-36
/16/ Popper AN, Hawkins AD, Fay RR, Mann DA, Bartol S, Carlson TJ, Coombs S, Ellison WT, Gentry RL, Halvorsen MB, Løkkeborg S, Rogers PH, Southall BL, Zeddies DG,
73
Tavolga WN (2014) Sound Exposure Guidelines for Fishes and Sea Turtles: A Technical Report prepared by ANSI-Accredited Standards Committee S3/SC1 and registered with ANSI.
/17/ Robinson S, Lepper P, A.,, Hazelwood R, A., (2014) Good practice guide for underwater noise measurement., National Measurement Office, Marine Scotland, The crown Estate
/18/ Southall BL, Bowles AE, Ellison WT, Finneran JJ, Gentry RL, Greene CRJ, Kastak D, Ketten DR, Miller JH, Nachtigall PE, Richardson WJ, Thomas JA, Tyack P (2007) Marine mammal noise exposure criteria: initial scientific recommendations. Aquatic Mammals 33:411-521
/19/ Teilmann J, Carstensen J (2012) Negative long term effects on harbour porpoises from a large scale offshore wind farm in the Baltic—evidence of slow recovery Environ. Res. Lett. 7:1-10Thomsen F (2010) Sound impacts. In: Huddleston J (ed) COWRIE - Understanding the Environmental Impacts of Offshore Windfarms Information Press, Oxford, p 32-43
/20/ Thomsen F, Lüdemann K, Kafemann R, Piper W (2006) Effects of offshore wind farm noise on marine mammals and fish, biola, Hamburg, Germany on behalf of COWRIE Ltd, Newbury, UK
/21/ Thomsen F (2010) Sound impacts. In: Huddleston J (ed) COWRIE - Understanding the Environmental Impacts of Offshore Windfarms Information Press, Oxford
/22/ Thomsen F, Mueller-Blenkle C, Gill A, Metcalfe J, McGregor P, Bendall V, Amdersson M, Sigray P, Wood D (2012) Effects of pile driving on the Behavior of Cod and Sole. In: Hawkins A, Popper AN (eds) Effects of Noise on Aquatic Life Springer, New York, p 387-389
/23/ TNO (2011a) Ainslie, M.A. Standards for measurement and monitoring of underwater noise, Part 1: Physical quantities and their units. TNO Report ref: TNO-DV2011
/24/ TNO (2011b) de Jong, C.A.F. Standards for measurement and monitoring of underwater noise, Part II: Procedures for measuring underwater noise in connection with offshore wind farm licensing. TNO Report ref: TNO-DV 2011 C251
/25/ Tougaard T, Carstensen J, Teilmann J, Skov H, Rasmussen P (2009a) Pile driving zone of responsiveness extends beyond 20 km for harbor porpoises (Phocoena phocoena (L.)). Journal of the Acoustical Society of America 126:11-14
/26/ Tougaard. J, Damsgaard. O, Henriksen. (2009b) Underwater noise from three types of offshore wind turbines:Estimation of impact zones for harbor porpoises and harbor seals. Journal of the Acoustical Society of America 25 3766-3773
/27/ Wilson B, Lepper PA, Carter C, Robinson SP (2014) Rethinking Underwater Sound-Recording Methods to Work at Tidal-Stream and Wave-Energy Sites. Marine Renewable Energy Technology and Environmental Interactions
/28/ WODA (2013) Technical Guidance on: Underwater Sound in Relation to Dredging World Organisation of Dredging Associations Delf

How to obtain EU publications
Free publications:
• one copy: via EU Bookshop (http://bookshop.europa.eu);
• more than one copy or posters/maps: from the European Union’s representations (http://ec.europa.eu/represent_en.htm); from the delegations in non-EU countries (http://eeas.europa.eu/delegations/index_en.htm); by contacting the Europe Direct service (http://europa.eu/europedirect/index_en.htm) or calling 00 800 6 7 8 9 10 11 (freephone number from anywhere in the EU) (*). (*) The information given is free, as are most calls (though some operators, phone boxes or hotels may charge you).
Priced publications:
• via EU Bookshop (http://bookshop.europa.eu).

The construction and operation of marine renewable energy developments (MREDs) will lead to, among other things, the emission of electromagnetic fields (EMF), underwater sound, and vibrations into the marine environment. Knowledge on these pressures and associated effects has been increasing over the past decade. Yet, many open questions with regard to the potential for MRED to impact on marine life remain. These information gaps pose challenges to the planning and deployment of MREDs. To address this, the European Union (EU) Commission, Directorate-General for Research and Innovation commissioned a study of the environmental effects of noise, vibrations and electromagnetic emissions from MREDs (Marine Renewable Energy, Vibration, Electromagnetic fields and Noise - MaRVEN). MaRVEN provides a review of the available literature related to environmental impacts of marine renewable energy devices and an in-depth analysis of studies on the environmental effects of noise, vibrations and electromagnetic emissions during installation and operation of wind, wave and tidal energy devices. The current norms and standards related to noise, vibrations and EMF were reviewed. On-site measurements and field experiments to fill priority knowledge gaps and to validate and build on the results obtained in reviews were undertaken. Finally, we outline a programme for further research and development with justified priorities.
Studies and reports
ISBN 978-92-79-54977-9
[Catalo
gue n
um
ber]
KI-N
A-2
7-7
38-E
N-N