Embed Size (px)
Citation preview
Prediction of milk coagulation properties by Fourier Transform Mid‐Infrared Spectroscopy (FTMIR)
for genetic purposes, herd management and dairy profitability
Martino CASSANDRO
e Massimo De MARCHI
Department of Agronomy, Food, Natural resources, Animals and EnvironmentDAFNAE ‐
University of Padova
‐
Italy

Overwiev1.
Introduction
2.
Milk Coagulation Properties (MCP)1.
What is MCP
2.
How to measure MCP3.
Researches on MCP
3.
Prediction of MPC by FTMIR4.
Predicted values of MCP: genetic applications1.
Breed effect on MCP
2.
Genetic Improvement of MCP
5.
MCP and Dairy industry1.
MCP and cheese yield
2.
MCP and milk payment system
6.
Conclusions & Perspectives
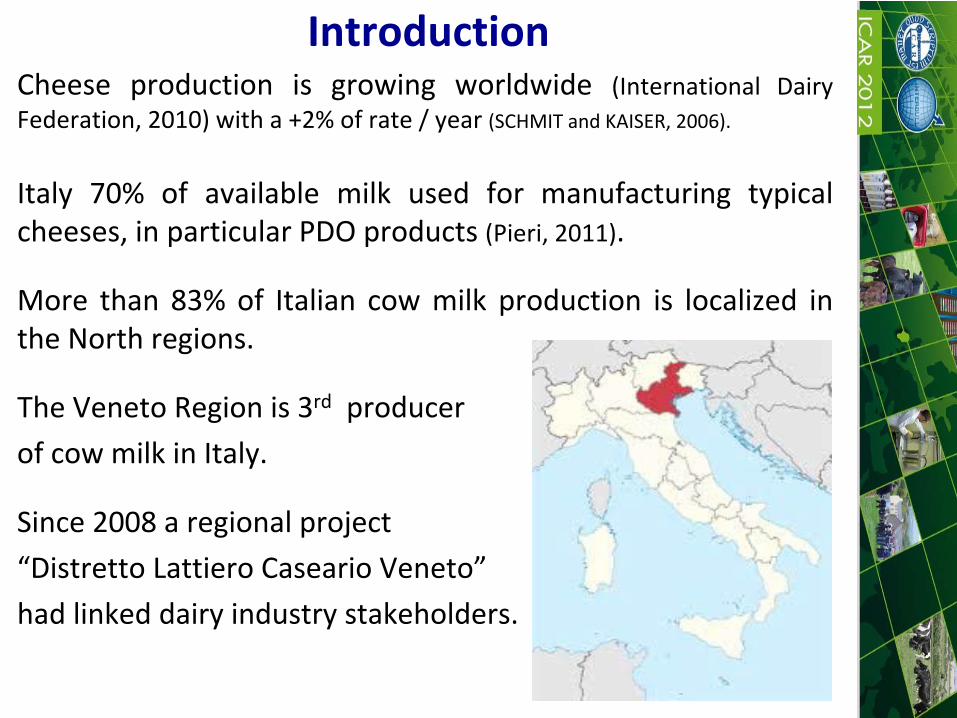
IntroductionCheese
production
is
growing
worldwide
(International
Dairy
Federation, 2010) with a +2% of rate / year (SCHMIT and KAISER, 2006).
Italy
70%
of
available
milk
used
for
manufacturing
typical cheeses, in particular PDO products (Pieri, 2011).
More
than
83%
of
Italian
cow
milk
production
is
localized
in the North regions.
The Veneto Region is 3rd
producer of cow milk in Italy.
Since 2008 a regional project “Distretto Lattiero Caseario Veneto”had linked dairy industry stakeholders.
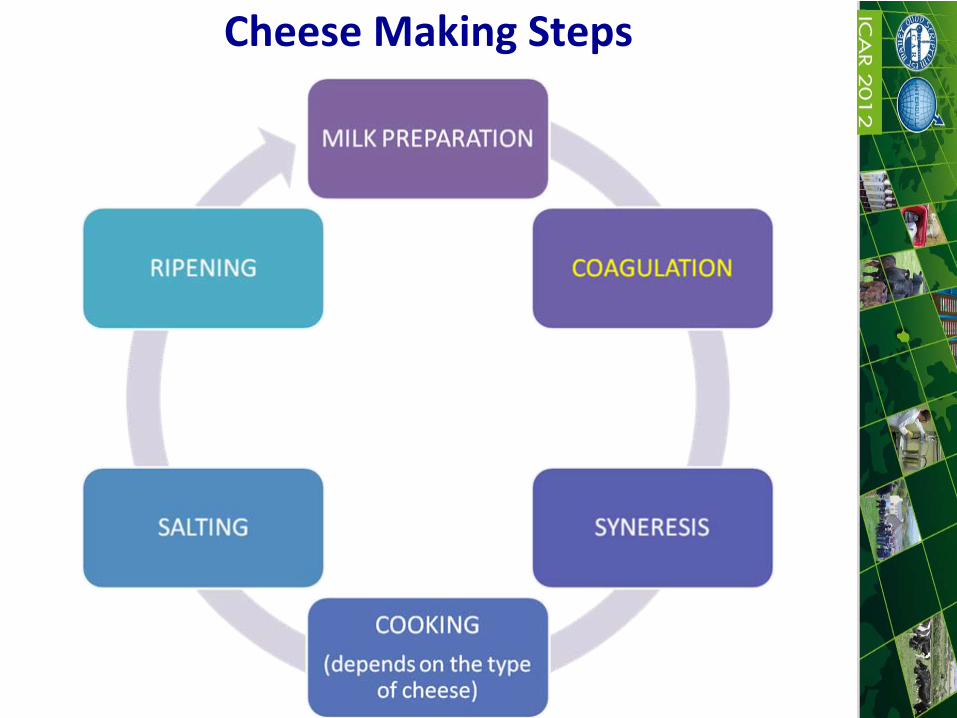
Cheese Making Steps

(by M. Malacarne)
Stability of milk due to the crown of k‐casein
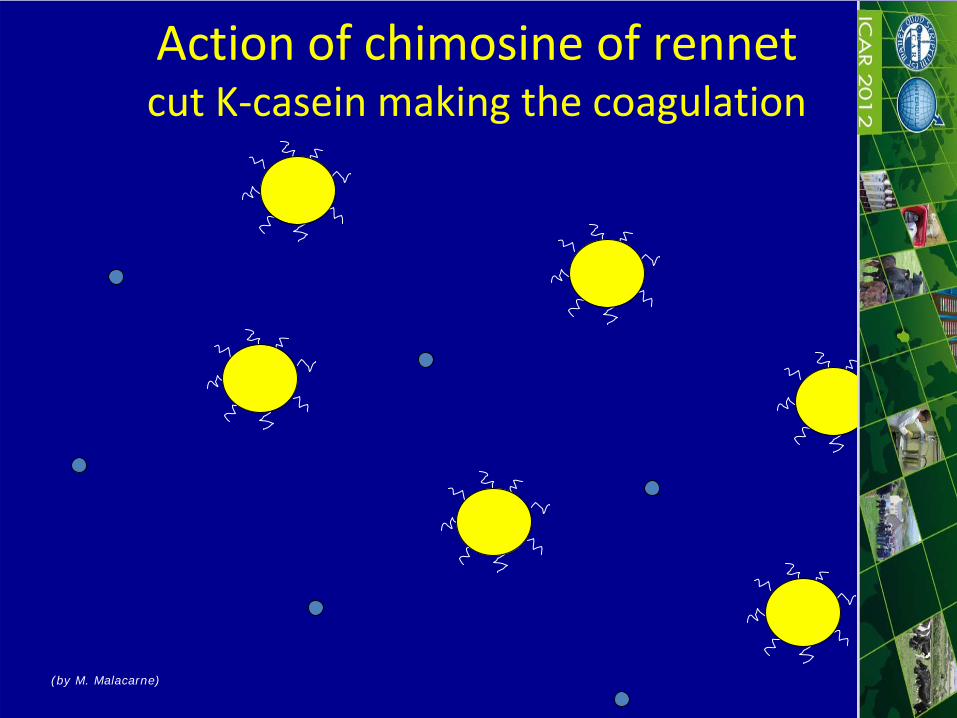
(by M. Malacarne)
Action of chimosine of rennet cut K‐casein making the coagulation
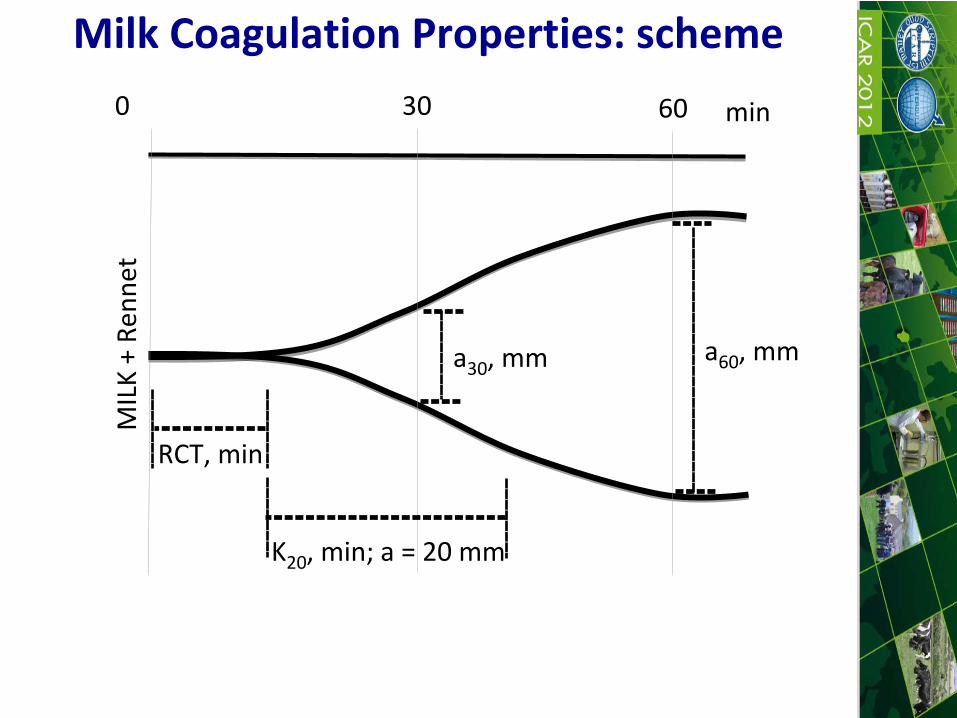
Milk Coagulation Properties: scheme0 30 min60
RCT, min
K20
, min; a = 20 mm
a30
, mm a60
, mm
MILK + Re
nnet
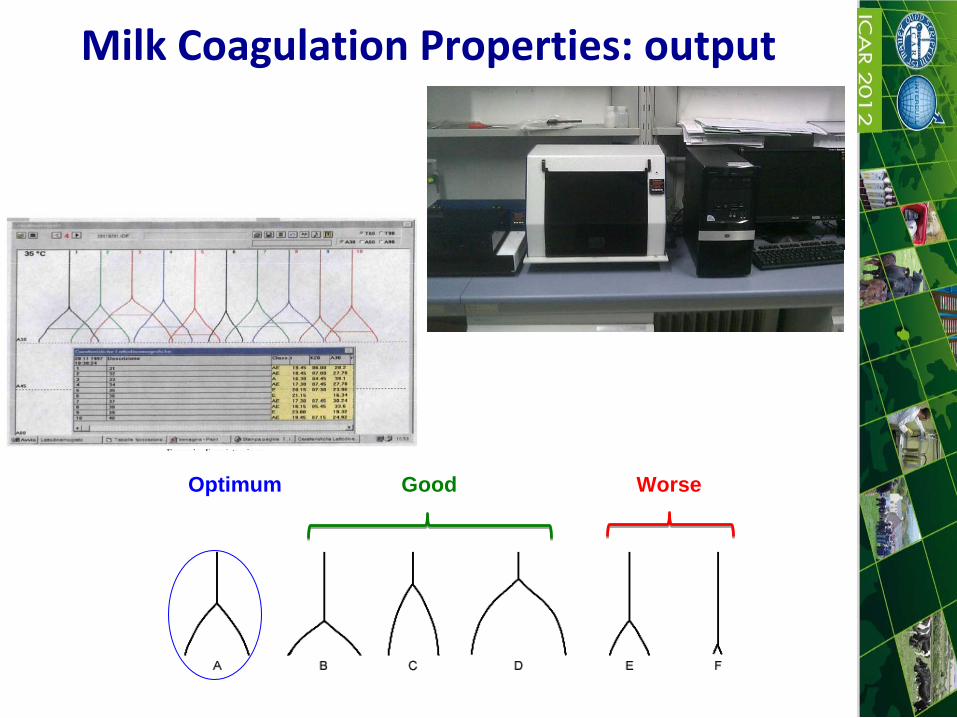
Optimum Good Worse
Milk Coagulation Properties: output

Cheese
processing,
cheese
yield,
cheese composition and quality dairy efficiency.
[Aleandri
et
al.,
1989;
Ng‐Kwai‐Hang
et
al.,
1989;
Martin
et
al.,
1997;
Walsh et al., 1998; Ikonen et al., 1999; Summer et al., 2003; Wedholm et al., 2006; De Marchi et al., 2008].
Mechanic
and
optical
methodology
has
been studied.
[Laporte et al.,
1998; O’Callaghan et al., 2002; Klandar et al., 2007; Cassandro et al., 2008; Dal Zotto et al., 2008; Pretto et al., 2011].
The common method is the lactodynamograph.
MCP: Why and How measured?
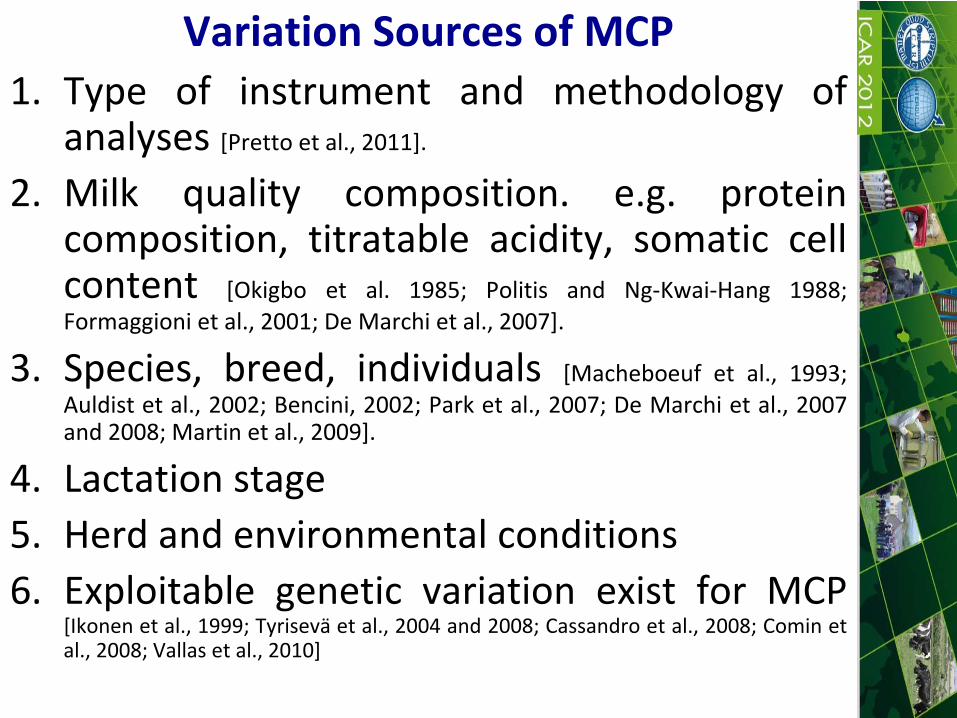
1.
Type
of
instrument
and
methodology
of analyses [Pretto et al., 2011].
2.
Milk
quality
composition.
e.g.
protein composition,
titratable
acidity,
somatic
cell
content
[Okigbo
et
al.
1985;
Politis
and
Ng‐Kwai‐Hang
1988; Formaggioni et al., 2001; De Marchi et al., 2007].
3.
Species,
breed,
individuals
[Macheboeuf
et
al.,
1993; Auldist et al.,
2002;
Bencini,
2002;
Park
et
al.,
2007;
De
Marchi
et
al.,
2007 and 2008; Martin et al., 2009].
4.
Lactation stage 5.
Herd and environmental conditions
6.
Exploitable
genetic
variation
exist
for
MCP [Ikonen et al., 1999; Tyriseva
et al., 2004 and 2008; Cassandro et al., 2008; Comin et
al., 2008; Vallas et al., 2010]
Variation Sources of MCP

Prediction of MCP by FTMIR

1.
Fast / No destructive / Easy to use.2.
Largely used by milk labs to
assess milk
quality and for
milk payment or for routine milk recording analyses.3.
Absorptions
of
IR
at
frequencies
correlated
to
the
vibrations of specific chemical bonds within a molecule (Coates, 2000).
Prediction of MCP by FTMIR
Protein1570‐1550 cm‐1
Lipids3000‐2800 cm‐1
Fatty acid carbonyl group1736; 1805;1745 cm‐1
C‐O stretching
C‐H bending640‐1500 cm‐1

1.
Fatty
acids
[Soyeurt
et
al.,
2006;
Rutten
et
al., 2009; De Marchi et al., 2011; Soyeurt et al., 2011].
2.
Protein
composition
[Lynch
et
al.,
2006;
De Marchi et al., 2009; Rutten et al., 2011].
3.
Acetone
[Heuer et al., 2001].4.
MCP
[Dal Zotto et al., 2008; De Marchi et al., 2009;
De Marchi et al., 2012].5.
Body energy status [McParland et al., 2011].
6.
Sensory
texture
traits
of
cheese
[Fagan
et
al., 2007].
7.
Melamin [Foss, personal communication].
Milk/Cheese traits by FTMIR: applications

•
1,200 individual milk samples.•
NO preservative / Analysis within 3 hours.
•
Computerized renneting meter (Polo Trade). •
Spectra from Milko‐Scan FT120.
•
RCT (14.96±3.84 min) and a30
(41.7±8.76 mm).•
RCT = R2cv
of 0.62; a30
R2cv
of 0.37.RCT
model
allows
the
discrimination
between
high
and low value. a30
no satisfactory prediction.K20
no prediction.Low range of variability (no samples RCT > 29.5 min).Reference methods / Lab conditions.
Prediction of MCP by FTMIR2009 2010÷2011 2012
De Marchi et al., 2009 J. Dairy Sci. 92:423–432

•
850 milk samples (individual HF and bulk).•
Preservative
/ Analysis within 3 days.
•
Formagraph
(Foss Electric).•
Spectra from Milko‐Scan FT6000.
•
RCT (19.82±4.59 min) and a30
(22.63±10.95 mm).•
RCT = R2cv
of 0.66; a30
R2cv
of 0.70.RCT and a30
quite satisfactory prediction models.K20
no prediction.no sample RCT > 29.5 min.Limited range (RCT from 8 to 25 min).
Prediction of MCP by FTMIR2009 2010÷2011 2012

Summer
2011 ‐
RCT
and
a30
models
were
installed in
Milko‐scan
FT6000
of
Regional
breeder
association.
Difficult to predict RCT < 8 and > 24 minutes
Prediction of MCP by FTMIR2009 2010÷2011 2012
0
5
10
15
20
25
30
0 5 10 15 20 25 30
Mea
sure
d R
CT
(min
)
Predicted RCT (min)
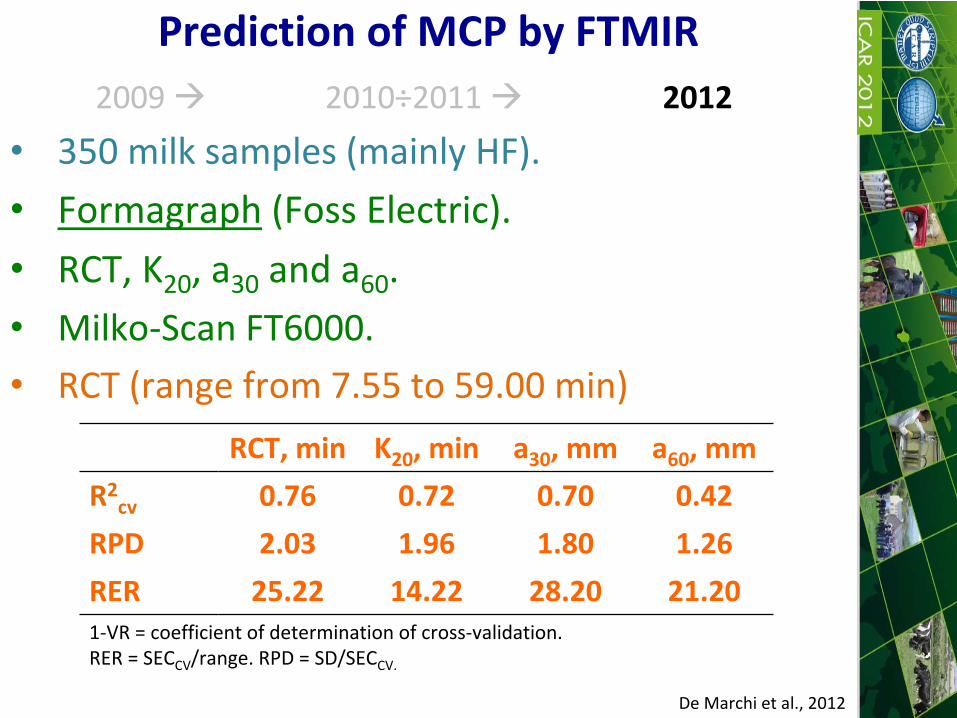
•
350 milk samples (mainly HF).•
Formagraph
(Foss Electric).
•
RCT, K20
, a30
and a60
.•
Milko‐Scan FT6000.
•
RCT (range from 7.55 to 59.00 min)
Prediction of MCP by FTMIR2009 2010÷2011 2012
De Marchi et al., 2012
RCT, min K20
, min a30
, mm a60
, mmR2
cv 0.76 0.72 0.70 0.42RPD 2.03 1.96 1.80 1.26RER 25.22 14.22 28.20 21.201‐VR = coefficient of determination of cross‐validation. RER = SECCV
/range. RPD = SD/SECCV.
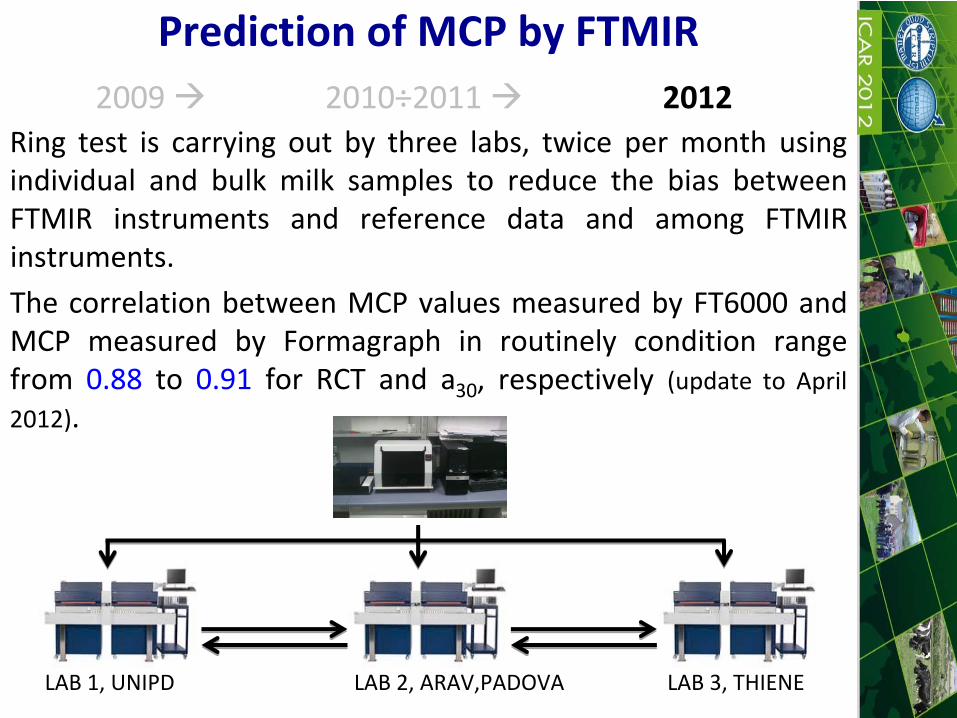
Ring
test
is
carrying
out
by
three
labs,
twice
per
month
using individual
and
bulk
milk
samples
to
reduce
the
bias
between
FTMIR
instruments
and
reference
data
and
among
FTMIR instruments.
The
correlation
between
MCP
values
measured
by
FT6000
and MCP
measured
by
Formagraph
in
routinely
condition
range
from
0.88
to
0.91
for
RCT
and
a30
,
respectively
(update
to
April 2012).
Prediction of MCP by FTMIR2009 2010÷2011 2012
LAB 1, UNIPD
LAB 2, ARAV,PADOVA
LAB 3, THIENE

Prediction of MCP by FTMIR2009 2010÷2011 2012
De Marchi et al., 2012

Predicted MCP Values: applications
Predicted MCP Values: genetic applications
In Veneto region about 25,000 controlled cows/month
RCT
and
a30
measured
using
Milko‐Scan
FT6000 (Foss Electric A/S, Hillerød, Denmark).
Effect of cow breed on MCP in multibreed herds1.39 mixed herds were selected. 2.11,978
individual
milk
samples
collected
from
3,279
cows
during
monthly
test‐days
between September 2011 and May 2012.

Predicted MCP Values: genetic applications
17,00
18,00
19,00
20,00
21,00
22,00
RCT, min
BS SI HF
10,00
15,00
20,00
25,00
30,00
a30, min
BS SI HF

Predicted MCP Values: genetic applicationsGenetic parameters for MCP in Holstein Friesian 312 herds
‐
3,488 HF cows
‐
140 bulls
Mean SD Range h2 SE
Parity, n 1.9 1.1 1‐10
Days in milk, d 198 130 5‐982
Milk Yield, kg/d 30.90 9.60 3.8‐88.0 0.12 0.04
Protein, % 3.40 0.40 2.29‐5.87 0.20 0.02
Fat, % 3.72 0.75 1.50‐8.75 0.29 0.06
SCS, punti 3.08 1.94 ‐1.64‐10.72 0.03 0.02
pH 6.66 0.10 6.17‐7.13 0.19 0.04
RCT, min 19.50 5.00 2.90‐30.00 0.17 0.05
a30
, mm 25.00 12.50 1.00‐64.3 0.20 0.04

1,200
Brown
Swiss
cows,
50
sires,
30
herds. Measured MCP: RCT and a30
measured by CoagulometerPredicted MCP: RCT and a30
predicted by Milko‐scan FT120
De Marchi
et al. 2009. J. Dairy
Sci. 92:423‐432 Cecchinato
et al. 2009 J. Dairy Sci. 92:5304‐5313
Measured vs. Predicted MCP: Genetic analysis
RCT, minMeasured
Predicteda30
, mmMeasured
Predicted
R2
MIRS 0.64 0.49Mean 15.1 14.9 41.5 41.7σ2a 4.9 3.7 19.4 17.2σ2h 1.7 1.5 9.4 5.3σ2e 9.5 4.6 20.6 20.0h2 32 37 24 35rg 94 77

Predicted MCP Values: genetic applicationsGenetic parameters for MCP in Holstein Friesian
0%
10%
20%
30%
40%
-12 -10 -8 -6 -4 -2 0 2 4 6 8 10 12
% b
ulls
EBV_a30, mm
0%
10%
20%
30%
40%
-5 -4 -3 -2 -1 0 1 2 3 4 5
% b
ulls
EBV_RCT, min
Top 12 HF BULLS for MCP
ACTIVE PRINCEBROSIO PURPOSEDUKO QUASIMO
LAMBRO SITTAXMISIS TABAIBA
PASSIRIO WATHA

MCP and Dairy Industry: Variation Sources1,508
bulk milk samples.
436
dairy herds.4
dairy
cooperatives
(Lattebusche,
Latteria
di
Soligo,
Latterie
Trevigiane,
Latterie
Vicentine).
2 years of sampling.
Table 1: Results from ANOVA for milk coagulation properties of bulk milk samples. Trait1
RCT, min k20, min a30, mmEffect F P-value F P-value F P-valueDairy cooperative2 25.03 <0.001 9.36 <0.001 25.57 <0.001Herd (within dairy cooperative) 1.86 <0.001 1.57 <0.001 1.83 <0.001Year of sampling 19.08 <0.001 1.12 0.290 0.07 0.797Season of sampling 13.75 <0.001 2.66 0.047 1.51 0.211Casein, % 0.71 0.585 4.84 0.001 5.88 <0.001Fat, % 0.58 0.676 1.06 0.376 1.47 0.209Titratable acidity, °SH/50mL 14.31 <0.001 4.78 0.001 13.63 <0.001Somatic cell count, cells/mL 2.31 0.056 1.13 0.339 0.97 0.422Bacterial count, cells/mL 2.48 0.042 1.70 0.148 1.56 0.183R2 0.52 0.52 0.52RMSE3 3.03 1.65 6.72

MCP and Dairy Industry: Variation Sources
(a) (b)

MCP and Dairy Industry: Cheese Yield
Cheese yield
Effect1 df SS P‐value
Cheese‐making day 11 1.246 <0.0001
Milk fat, % 2 0.525 <0.0001
Milk protein, % 2 0.446 0.0002
TA, SH°/50 mL 2 0.383 0.0006
a30, mm 2 0.175 0.0277b
aba
Mean per class: 20.52 ‐
26.05 ‐
31.88
Pretto et
al. ‐
Submitted

TOTAL INDEX that combine RCT and a30
MCP and Milk Payment System
mean mean
sdsdsd sd

MCP and Economic Value of MCP under different milk payment systems
Relative Economic Value for the traits standardizedby genetic standard deviation (Pretto
et al. 2010)
The weight for MCP ranged from 1.6 to 7.4 % (sum of absolute weight for RCT and a30
),
when the effect on cheese yield ranged from 1 to 5 % from the worst and the best MCP.

Conclusion and ImplicationMilk Coagulation Properties (MCP) are depleting and are an important target for improvement in the dairy sector. Several sources of variation of MCP were detected and quantified.
MIR models showed good predictions for MCP.
The
MCP
are
fairly
good
for
predicting
in
cheese
yield
(e.g.
Grana Padano).
The Economic Value of MCP should be about 7‐8% of the milk price and
it
is
likely
to
increase
if
will
increased
consumption
of
dairy
products and if it will worsen the characteristics of dairy milk.
The development of MCP are indispensable for italian
dairy chain.
The
model
and
methods
applied
for
these
traits
(MCP)
and research experience of the Veneto dairy chain might be applied for more
novel
milk
traits
with
the
aim
to
design
a
new
italian
dairy
system.

Acknowledgement
Dott. Mauro PenasaDott. Francesco TiezziDott. Denis PrettoDott.ssa Valentina ToffaninDott.ssa Alba SturaroDott.ssa Lucia Ancillotto
Dott. Claudio GentileDott. Gianfranco FaitDott. Marco Cesari

THANK YOU for
your ATTENTION


VALUE of
CHESSE YIELD and actual
MILK PRICE

At HERD LEVEL the comparison
between VALUE of
CHEESE YIELD actual
MILK PRICE
∆
+46%

MCP in the last 10 years in VENETO
Tipe of
LDG 2008‐2009 1999
r (min) a 30 (mm) caseina % r (min) a 30 (mm) caseina %
A 15,77 32,36 2,60 15,314 32,92 2,61
B 19,15 35,18 2,76 19,29 29,21 2,7
D 8,53 39,5 2,44 10,69 40,55 2,62
E 21,25 22,5 2,52 19,69 24,46 2,52
F > 30,00 < 10,0 2,47 > 30,00 < 10,0 2,49
83%
36%
Fonte: E. Tealdo – VA-THIENE (2010)

MCP index K‐
casein Βeta‐Lactoglobulin
ACTIVE AB AB
BROSIO AB BB
DUKO AA AB
LAMBRO BB AB
MISIS AB BB
PASSIRIO AA BB
PRINCE AB AB
PURPOSE AA AB
QUASIMO AB AB
SITTAX AB AA
TABAIBA AA AA
WATHA AB AA
Relation among
MCP index
and Protein
polymorphism

Comparison
among
bulls: k‐caseinaAllele k‐casein Mean MCP
AA 98,4
AB 101,7
BB 105,0

Comparison
among
bulls: k‐caseinaAllele k‐casein Mean MCP
AA 98,4
AB 101,7
BB 105,0
Mean
of
all 140 bulls
evaluated

Comparison
among
bulls: k‐caseinAllele k‐casein Mean MCP index
AA 98,4
AB 101,7
BB 105,0

Relationships between sire rankings for RCT observed and predicted
0
10
20
30
40
50
0 10 20 30 40 50
pRCT
RC
T
r = 0.97
Rennet coagulation time
0
10
20
30
40
50
0 10 20 30 40 50
pa30
a30
r = 0.86
Curd firmness
Cecchinato
et al. 2009 J. Dairy Sci. 92:5304‐5313

Heritablity
of
MCP measures
(CRM) and predictions
(MIR)
Traits h2 s.e.Rennet coagulation time (RCT)-
measured (CRM) 0.32 0.08
-
predicted
(MIR) 0.37 0.10Curd firmness (a30 )-
measured
(CRM) 0.24 0.07
-
predicted
(MIR) 0.35 0.10Cecchinato
et al. 2009 J. Dairy Sci. 92:5304‐5313

Genetic
(rA
) and phenotypic
(rP
) correlations
Correlations rA rP
Rennet coagulation time (RCT)-
measured with predicted 0.93 0.67
Curd firmness (a30 )-
measured
with
predicted 0.77 0.51
Cecchinato
et al. 2009 J. Dairy Sci. 92:5304‐5313