Embed Size (px)
DESCRIPTION
Jurna
Citation preview

The 9th International Conference on Marine Technology
An Investigation into the Effect of Water Depth
on the Resistance Components of Trimaran Configuration
Muhammad,IQBAL
1 and I Ketut Aria Pria, UTAMA
2
1Department of Naval Architecture Diponegoro University, Semarang 50275, Indonesia 2Department of Naval Architecture and Shipbuilding Enginering
Institut Teknologi SepuluhNopember (ITS), Surabaya 60111, Indonesia
Abstract
Research, in order to breackdown the resistance components of trimaran hull form, has been carried out
worlwide. Almost all of the work is focused on the resistance investigation of trimaran configuration in deep sea
condition. None of the research has formulated the estimation of trimaran resistance components into certain
equation such as for catamaran. The current work is concentrated on the investigation of the effect of water depth,
namely deep, medium and shallow waters, into the total resistance of the trimaran configuration. Experimental
investigation using ITS model were carried out at a towing tank at various hull separation (S/L = 0.2, 0.3 and 0.4)
and various speeds or Froude Numbers. Special consideration is given to medium and shallow water depth
because the Froude Numbers are based on water depth and not based on ship length such as in deep water
condition. CFD investigation using a CFD code called Tdyn, is also conducted in order to validate the results of
the experimental investigation. The results of the experimental test and CFD analysis are in good agreement and
comparative studies with other published data strengthen the findings.
Keywords: trimaran, resistance, model test, CFD.
1. Background
One of the most popular type of vessels at present is the multihulls where this vessel has
several benefits compared to monohull. Trimaran is one type of multihull vessels which has three
hulls connected by bridge construction hence the trimaran has wider deck space area compared to
monohull of similar displacement.
Trimaran has been investigated by many experts and naval architects in order to replace the use
of monohull attributed to several advantages [1,2,3,4] explained that there are several benefits of the
use of trimaran compared to monohull, namely lower wave resistance at higher speeds, wider deck
space area, better transverse stability and better maneuverability hence more comfortable for
passengers.
Among those advantages, the difference of ship operational condition such as difference of
water depth has caused unique hydrodynamics phenomena compared to deep sea condition. A ship
moving at shallow water can cause its speed to decrease and consume more fuels. Moreover, the
vessel is vulnerable for grounding, which is the situation when the bottom of ship hits the sea bottom.
This is also dangerous for the vessel itself, where a ship moving at shallow waters can harm the
maritime environment, onshore construction, and other vessels or objects situated nearby [5].
There is significant increase of resistance when a vessel moving at shallow waters. Based on
the curve of resistance, there is peak of the curve which indicates the highest resistance among other
speeds. This condition occurs at Frh 1,00 where Frh is called depth Froude number [6,7].
When a vessel moving at restricted waters, it may cause interaction between the bottom of ship
and the bottom of seawaters. This interaction is caused by the significant pressure changes due to the
change of flow speed under the ship [7]. In addition, interference between hulls can also cause the
increase of ship’s resistance.
2. Research Method
2.1. Main Dimension
The experimental model tests were carried out at ITS towing tank at the model scale of 1:8 at
the speeds of 1.0371 – 1.7657 m/s (5.7 – 9.7 knots of the real vessel speed) or in term of Froude

The 9th International Conference on Marine Technology
numbersFrL0,21 – 0,41 orFrh0,88 – 1,70without rudder and propeller. The ship model can be seen in
Figure 1 and the principal particular can be found in Table 1.
Figure 1. Ship model
Table 1. Principal particular of ship and model
Dimensions Main Hull Side hull
Full Scale Model Full Scale Model
Length between waterline, LWL (m) 14.50 1.8125 12.00 1.50
Breadth, B (m) 2.00 0.25 1.147 0.1434
Draft, T (m) 0.72 0.09 0.52 0.065
Height, H (m) 1.44 0.18 1.239 0.1549
Displacement, Δ (ton) 6.96 0.01359 2.42 0.00473
Block Coeffisient, Cb 0.384 0.384 0.39 0.39
Watted Surface Area, WSA (m2) 26.874 0.4199 14.278 0.2231
Total Displacement Total WSA
Full scale = 11.8 ton Full scale = 55.43 m2
Model = 0.023 ton Model = 0.866 m2
2.2. Sidehull Position
The position of sidehull is notified as S/L ratio where S is distance between main-hull
centreline and side-hull centreline and L or LWL is the length of main-hull in m. The values of S/L
used for the tests were 0.2, 0.3 and 0.4. Details of the paramaters can be seen in Figure 2 and Table 2.
Figure 2. Variation of sidehull position
Side hull MainHull Side hull

The 9th International Conference on Marine Technology
Table 2. Distance between mainhull and sidehull positions (m)
S/L Full Scale Model
0.2 2.90 0.363
0.3 4.35 0.544
0.4 5.80 0.725
2.3. Depth of Water
The depth of water of the tests was divided into three: deep, medium and shallow waters and
notified as h/T where h is the depth of water (m) and T is ship’s draught (m). The depth of water was
categorized based on h/T values: 1.2 – 1.5 for shallow water, 1.5 – 19.3 for medium water and > 19.3
for deep water [8] and tabulated in Table 3.
Table 3. Water depth (m)
h/T Full Scale Model
1.22 (shallow water) 0.88 0.11
1.56 (medium water) 1.12 0.14
20 (deep water) 14.40 1.80
3. Results and Discussion
3.1 Experimental and CFD
The results of resistance tests can be seen in Figure 3. Both experiment and CFD results
demonstrated similar trends where at shallow waters the curve of total resistance decreases from FrL
0,24 to 0,41. At medium waters, the curve of resistance increases from FrL 0,24 to 0,28 and later
decreases until FrL 0,41. Meanwhile, at deep waters the curve of resistance does not change
significantly.
Figure 3. Comparison of CFD and Experiment
The 9th International Conference on Marine Technology
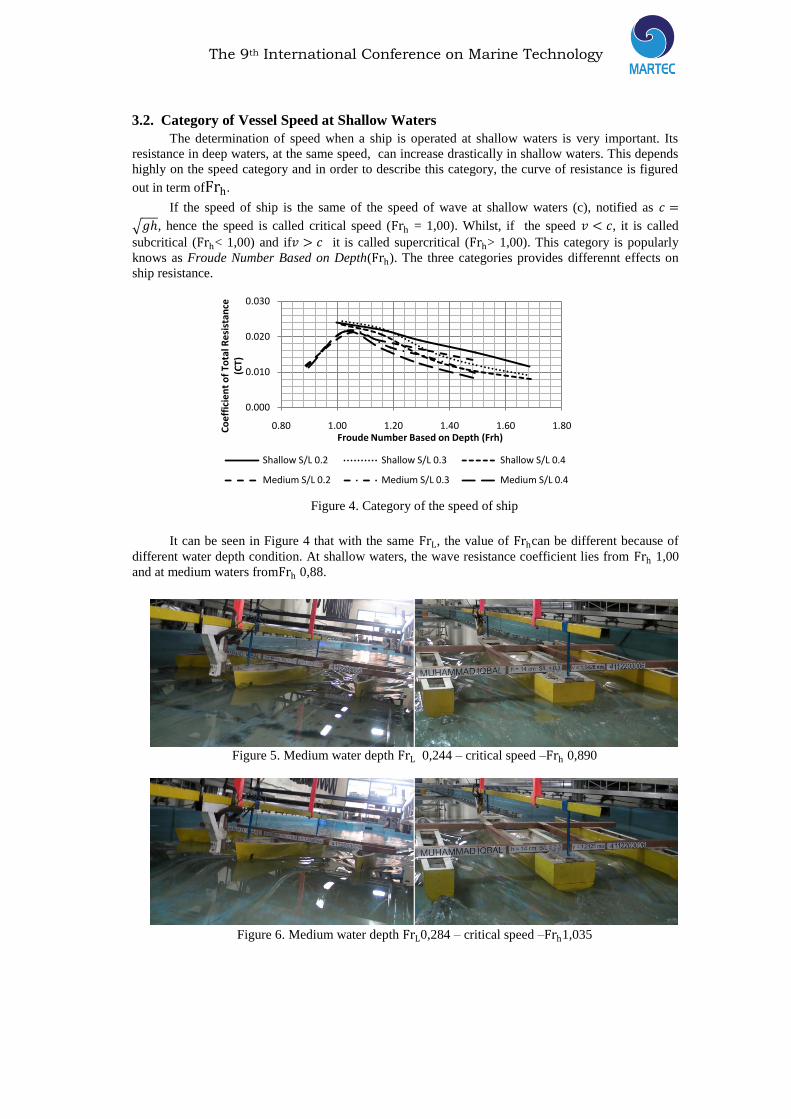
3.2. Category of Vessel Speed at Shallow Waters
The determination of speed when a ship is operated at shallow waters is very important. Its
resistance in deep waters, at the same speed, can increase drastically in shallow waters. This depends
highly on the speed category and in order to describe this category, the curve of resistance is figured
out in term ofFrh.
If the speed of ship is the same of the speed of wave at shallow waters (c), notified as 𝑐 =
𝑔ℎ, hence the speed is called critical speed (Frh = 1,00). Whilst, if the speed 𝑣 < 𝑐, it is called
subcritical (Frh< 1,00) and if𝑣 > 𝑐 it is called supercritical (Frh> 1,00). This category is popularly
knows as Froude Number Based on Depth(Frh). The three categories provides differennt effects on
ship resistance.
Figure 4. Category of the speed of ship
It can be seen in Figure 4 that with the same FrL, the value of Frhcan be different because of
different water depth condition. At shallow waters, the wave resistance coefficient lies from Frh 1,00
and at medium waters fromFrh 0,88.
Figure 5. Medium water depth FrL 0,244 – critical speed –Frh 0,890
Figure 6. Medium water depth FrL0,284 – critical speed –Frh1,035
0.000
0.010
0.020
0.030
0.80 1.00 1.20 1.40 1.60 1.80Co
eff
icie
nt
of
Tota
l Re
sist
ance
(CT)
Froude Number Based on Depth (Frh)
Shallow S/L 0.2 Shallow S/L 0.3 Shallow S/L 0.4
Medium S/L 0.2 Medium S/L 0.3 Medium S/L 0.4

The 9th International Conference on Marine Technology
Figure 7. Medium water depth FrL 0,410 – supercritical speed –Frh1,495
Figure 8. Wave contour elevation at medium water depth
Figures 5 to 7 show the difference among subcritical, critical and supercritical speeds based on
experimental model tests, whereas Figure 8 demonstrates the difference from CFD analysis. Those
show similar trend.
Both experiment and CFD results show that wave at the bow part at critical speed is higher
than that of subcritical speed. Meanwhile, the wave angle of entrance at critical speed is close to 90o
and this is in agreement with statement from [7]. At the critical speed the submerge transom part
appears, but it does not appear at subcritical speed. At supercritical speed, the created wave is
dominated by divergent wave, whilst the transverse wave disappears. According to [7] , it is attributed
to gravity waves, which does not occur at 𝑐 > 𝑔ℎ.
3.3. Variation of Pressure and Speed of Flow Figure 9 shows the measurement positions of pressure and speed of flow. Measurement if
pressure is carried out in order to seek the interaction between the bottom of ship and see bed which
affects pressure and fluid flow. The position of measurement lies at 0.01 m beneath ship model or it is
0.1 m below water surface if assumed that the coordinate from x = 0 showing that the after
perpendicular (AP) until x = 1.8125 m showing the fore perpendicular (FP).
The 9th International Conference on Marine Technology
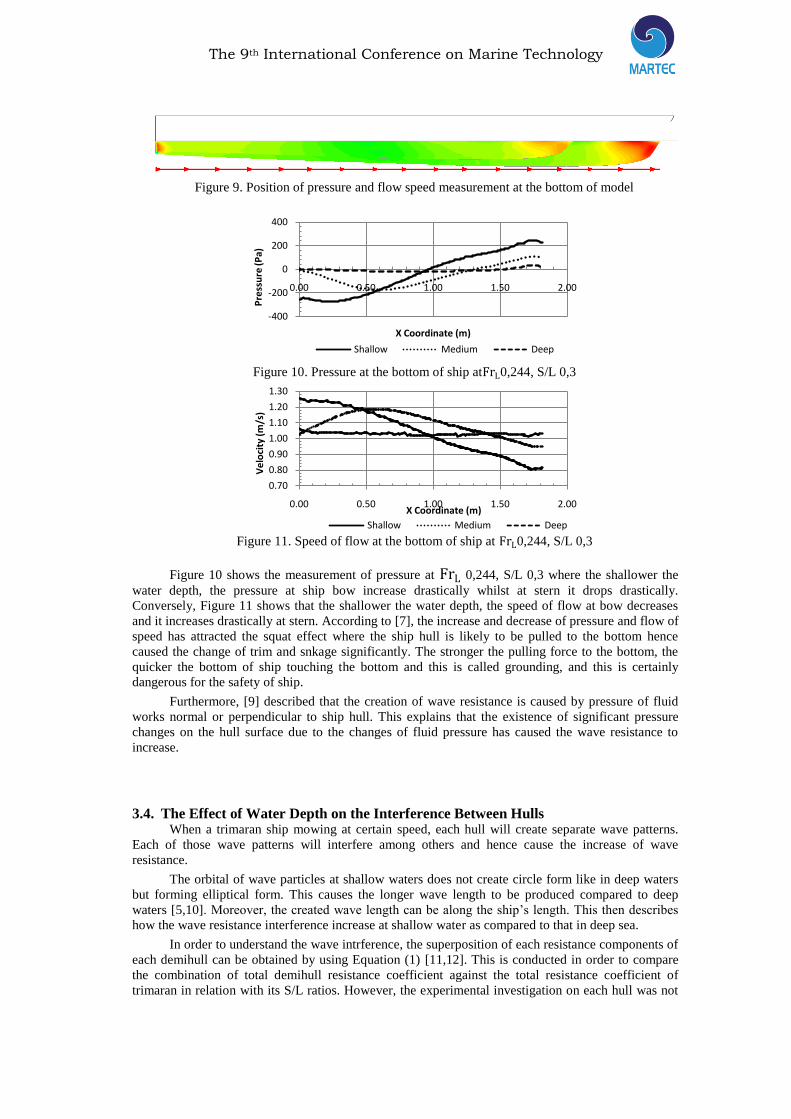
Figure 9. Position of pressure and flow speed measurement at the bottom of model
Figure 10. Pressure at the bottom of ship atFrL0,244, S/L 0,3
Figure 11. Speed of flow at the bottom of ship at FrL0,244, S/L 0,3
Figure 10 shows the measurement of pressure at FrL 0,244, S/L 0,3 where the shallower the
water depth, the pressure at ship bow increase drastically whilst at stern it drops drastically.
Conversely, Figure 11 shows that the shallower the water depth, the speed of flow at bow decreases
and it increases drastically at stern. According to [7], the increase and decrease of pressure and flow of
speed has attracted the squat effect where the ship hull is likely to be pulled to the bottom hence
caused the change of trim and snkage significantly. The stronger the pulling force to the bottom, the
quicker the bottom of ship touching the bottom and this is called grounding, and this is certainly
dangerous for the safety of ship.
Furthermore, [9] described that the creation of wave resistance is caused by pressure of fluid
works normal or perpendicular to ship hull. This explains that the existence of significant pressure
changes on the hull surface due to the changes of fluid pressure has caused the wave resistance to
increase.
3.4. The Effect of Water Depth on the Interference Between Hulls When a trimaran ship mowing at certain speed, each hull will create separate wave patterns.
Each of those wave patterns will interfere among others and hence cause the increase of wave
resistance.
The orbital of wave particles at shallow waters does not create circle form like in deep waters
but forming elliptical form. This causes the longer wave length to be produced compared to deep
waters [5,10]. Moreover, the created wave length can be along the ship’s length. This then describes
how the wave resistance interference increase at shallow water as compared to that in deep sea.
In order to understand the wave intrference, the superposition of each resistance components of
each demihull can be obtained by using Equation (1) [11,12]. This is conducted in order to compare
the combination of total demihull resistance coefficient against the total resistance coefficient of
trimaran in relation with its S/L ratios. However, the experimental investigation on each hull was not
-400
-200
0
200
400
0.00 0.50 1.00 1.50 2.00
Pre
ssu
re (P
a)
X Coordinate (m)
Shallow Medium Deep
0.70
0.80
0.90
1.00
1.10
1.20
1.30
0.00 0.50 1.00 1.50 2.00
Ve
loci
ty (
m/s
)
X Coordinate (m)
Shallow Medium Deep
The 9th International Conference on Marine Technology
carried out. Therefore, the CFD results on the total resistance cannot be compared with the
experimental work.
It can be found from that comparison that the difference of total resistance for each S/L ratios
to each sidehull is called interference factor (η). The calculation of interference factor is formulated in
Equation (2). Negative values indicated that the interference is an advantage [12].
𝐶𝑡𝑡𝑟𝑖−𝑁𝐼 =𝐶𝑡𝑚 𝑆𝑚+ 2𝐶𝑡𝑠𝑆𝑠
𝑆𝑡𝑟𝑖 (1)
𝜂 =𝐶𝑡𝑡𝑟𝑖
𝐶𝑡𝑡𝑟𝑖 −𝑁𝐼− 1,0 (2)
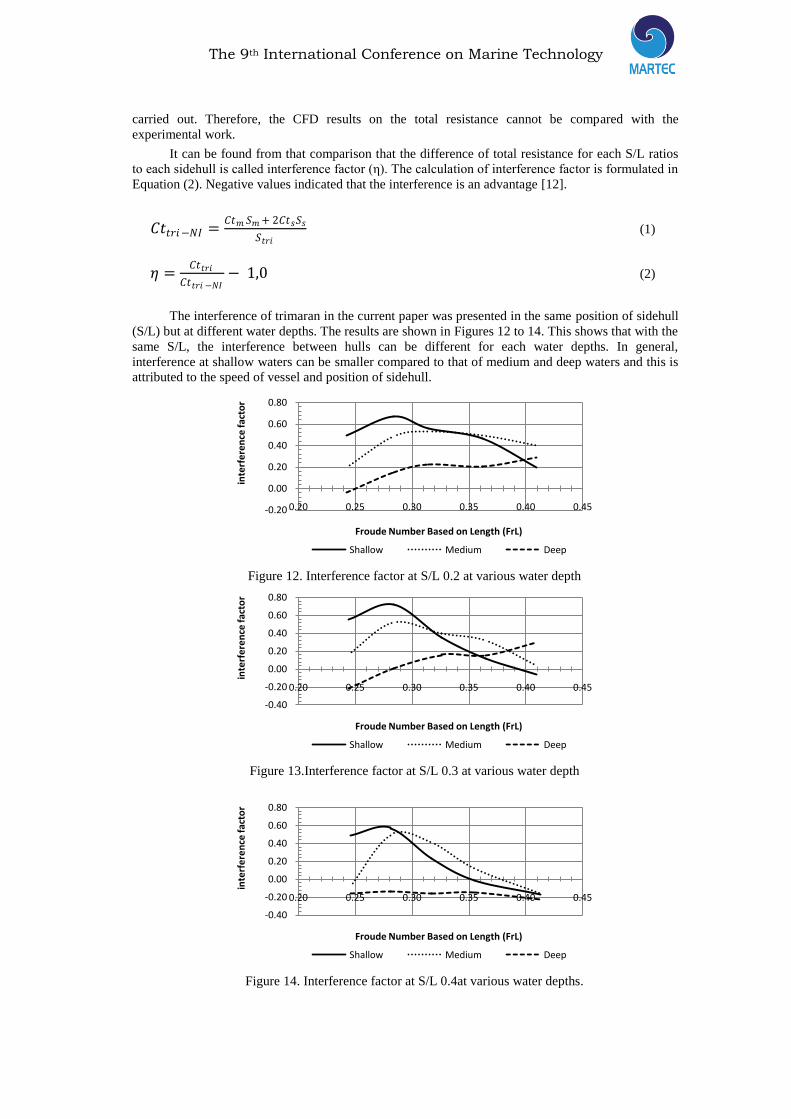
The interference of trimaran in the current paper was presented in the same position of sidehull
(S/L) but at different water depths. The results are shown in Figures 12 to 14. This shows that with the
same S/L, the interference between hulls can be different for each water depths. In general,
interference at shallow waters can be smaller compared to that of medium and deep waters and this is
attributed to the speed of vessel and position of sidehull.
Figure 12. Interference factor at S/L 0.2 at various water depth
Figure 13.Interference factor at S/L 0.3 at various water depth
Figure 14. Interference factor at S/L 0.4at various water depths.
-0.20
0.00
0.20
0.40
0.60
0.80
0.20 0.25 0.30 0.35 0.40 0.45
inte
rfe
ren
ce fa
cto
r
Froude Number Based on Length (FrL)
Shallow Medium Deep
-0.40
-0.20
0.00
0.20
0.40
0.60
0.80
0.20 0.25 0.30 0.35 0.40 0.45
inte
rfe
ren
ce fa
cto
r
Froude Number Based on Length (FrL)
Shallow Medium Deep
-0.40
-0.20
0.00
0.20
0.40
0.60
0.80
0.20 0.25 0.30 0.35 0.40 0.45
inte
rfe
ren
ce fa
cto
r
Froude Number Based on Length (FrL)
Shallow Medium Deep

The 9th International Conference on Marine Technology
4. Conclusions
Based on the experimental and CFD analysis, it can be found that (at the same speed) the total
ship resistance in deep waters can increase almost double at medium waters and about two and a half
times at shallow waters. The difference between experiment and CFD analysis is quite small, under
10%.
The increase of ship resistance is believed to be due to the significant pressure changes caused
by significant change of flow speed. Moreover, the effect of water depth onto the interference between
hulls is also obvious. In general, the interference at shallow waters is smaller than that of medium and
deep waters and it depends highly on the speed of vessels and position of side-hulls.
5. References
[1] Fang, M., Chen, T. (2008). “A Parametric Study of Wave Loads on trimaran Ships Travelling in
Waves”, Ocean Engineering, Vol. 35, hal. 749-762.
[2] Mynard, T., Sahoo, P.K., Mikkelsen, J., McGreer, D. (2008), “Numerical and Experimental Study
of Wave Resistance for Trimaran Hull Forms”, Australian Maritime College, hal 117-132 .
[3] Utama, I.K.A.P., Murdijanto., Sulisetyono, A., Jamaludin, A. (2009). “Development of Multihull
Ship Modes for Safe, Comfort and Efficient River and Ferry Transportations (in Indonesian), Final
Report of Applied Intensive Research Scheme (RIT), ITS Research Centre (LPPM-ITS), Surabaya,
Indonesia.
[4] Min, X., Shi-lian, Z. (2011), “A Numerical Study on Side Hull Optimization for trimaran”,
Journal of Hydrodynamics, Vol. 23, No. 2, hal. 265-272.
[5] Lyakhovitsky, Anatoly. (2007), Shallow Water and Supercritical Ships, Backbone Publishing
Company, Fair Lawn, NJ-USA.
[6] Hofman, M., (2006). “Prediction of Wave Making Resistance of Fast Ships in Shallow Water And
Computer Program ShallowRess®”, Report BR001/2006 Technical Solution, Dept. Of Naval
Architecture Faculty of Mechanical Engineering University of Belgrade, Serbia.
[7] Molland, A.F., Turnock, S.R, Hudson, D.D, (2011), Ship Resistance and Propulsion, Cambridge
University Press, Cambridge.
[8] Koh, K.K., Yasukawa, H. (2012). “Comparison study of a pusher–barge system in shallow water,
medium shallow water and deep water conditions”, Ocean Engineering, Vol. 46, hal. 9-17.
[9] Jamaluddin, A. (2012). Experimental and Numerical Analysis of Wave and Viscous Resistance
Interference of Catamaran at Various Configurations (in Indonesian), PhD Thesis, Faculty of
Marine Technology, ITS, Surabaya, Indonesia.
[10] Djatmiko, E. B., (2012). Behaviour and Operability of Floating Bodies in Random Waves (in
Indonesian), ITS Press, Surabaya.
[11] Pei-young, L., Young-ming, Q., Min-tong, G. (2002), ”Study of Trimaran Wavemaking Resistance
With Numerical Calculation and Experiment”, Journal of Hydrodynamics, Vol. 2, hal 99-105.
[12] Hafez, K.A., El-Kot, A.A. (2012). “Comparative Investigation of The Stagger Variation Influence
on The Hydrodynamic Interference of High Speed Trimaran”, Alexandria Engineering Journal,
Vol. 51, hal. 265-272.