Embed Size (px)
Citation preview
Food Security Information for Action
Markets Assessment and Analysis
Lesson 3
Market Indicators
Learners’ Notes
© FAO, 2008
This course is funded by the European Union and implemented by the Food and Agriculture Organization
of the United Nations

Course – Markets Assessment and Analysis Lesson 3 – Market Indicators
Learners’ Notes 1
Table of contents
Learning objectives .......................................................................................................2
Introduction....................................................................................................................3
Indicators and market analysis......................................................................................4
Policy environment ........................................................................................................5
Profiling the market system...........................................................................................6
Selecting prices .............................................................................................................7
Measuring prices ...........................................................................................................9
Collecting price information.........................................................................................10
Analysing prices ..........................................................................................................11
Use of market indicators..............................................................................................15
Market Centre Food Security Indicators .....................................................................16
Summary .....................................................................................................................17
If you want to know more ............................................................................................18
Annex 1: Typical Market Indicators .............................................................................20
Annex 2: Market Related Policy Questions.................................................................23
Annex 3: Policy impacts on markets and population ..................................................24
Annex 4: Market Integration ........................................................................................25
Annex 5: Parity Pricing ................................................................................................26
Annex 6: Inflation Scenarios .......................................................................................29
Annex 7: Presenting Price Data ..................................................................................30
Annex 8: Market Indicators for Early Warning ............................................................31
Annex 9: Market Indicators for Emergency Impact Assessment ................................32
Annex 10: Market Indicators for Recovery and Transition..........................................34

Course – Markets Assessment and Analysis Lesson 3 – Market Indicators
Learners’ Notes 2
Learning objectives
At the end of this lesson you will be able to:
• understand what typical market indicators are; • understand the role of prices as market indicators; and • select appropriate market indicators in different food security contexts.
Course – Markets Assessment and Analysis Lesson 3 – Market Indicators
Learners’ Notes 3
Introduction
In this lesson you will see what the indicators which allow you to create a market profile or baseline are. You will then find out which sets of indicators are normally used to assess markets in different food security contexts: early warning, emergency, recovery and transition.

Course – Markets Assessment and Analysis Lesson 3 – Market Indicators
Learners’ Notes 4
Indicators and market analysis
The basic characteristics of a market system have a significant affect on how the market operates day by day and on market outcomes. Market indicators can be divided into two broad categories: Indicators that describe the market system and provide context (e.g. locations within the catchment area, types and numbers of market participants). Indicators that track day to day market dynamics (e.g. prices and volumes of commodities in a market on a given day). Some indicators can be directly observed (e.g. the price of rice), but others must be calculated from observed information (e.g., terms of trade, inflation). There is a wide range of possible market indicators. Indicators for a specific situation are selected based on market context, resources and time constraints and analytical capacity. The selection of market indicators should collectively: describe market system dynamics; capture trends and anomalies; evaluate incentives to trade (within national borders, cross border, etc); anticipate response and market outcomes; link market phenomena to households and household food security; measure impact; and triangulate information and verify findings. The type and number of indicators to be selected depend on the context. However, there are a set of typical market indicators.
See Annex 1: Typical Market Indicators

Course – Markets Assessment and Analysis Lesson 3 – Market Indicators
Learners’ Notes 5
Policy environment
Indicators of macroeconomic and policy environment (e.g. inflation, unemployment and exchange rates) help you understand the economic activities of market participants and the supply response. A very useful exercise for food security analysts is to make an inventory of policies that relate to food crops, cash crops, livestock, basic consumer goods and labour markets. They should then trace the effects that these policies have on markets and how these markets affect food security, especially the food security of vulnerable groups. Some additional macroeconomic policies can be included as well.
See Annex 2: Market Related Policy Questions
See Annex 3: Matrix: policy impacts on markets and population This matrix can then be used as a reference to orient assessments and analyze policy changes. It can also be used for developing scenarios by those monitoring food security on an on-going basis throughout the year.
Course – Markets Assessment and Analysis Lesson 3 – Market Indicators
Learners’ Notes 6
Profiling the market system
Information on the structure, conduct and performance of the market helps you understand how the different components of the market system are related. Structure indicators: They describe relatively stable features of the market that influence the rivalry among the buyers and sellers. E.g. number and type of sellers in the market, concentration of total sales among sellers. Structure indicators allow the building of a profile of key markets and the market system. They can be collected all at once during a market profiling exercise or in stages. Conduct indicators: They describe patterns of behaviour that traders and other market participants adopt to affect or adjust to the markets in which they sell or buy. Some indicators are direct measures such as commodity stock management (stocks over time) and the measurement has a direct relation to food security. Other indicators are more indirect. For example, understanding of trader decision variables (e.g. margin calculations) provides the analyst with very useful indicators of conduct.
Trader decision variables Traders often monitor a series of commodities and markets to determine the most lucrative options of commodities to trade and markets to source and provision in a given season. They form expectations of potential returns and subsequently execute their market strategy. Decision variables may change from one context to another. Measures of security risks become important where there is civil insecurity. Relative prices and cross commodity sector comparisons become important where production and consumption patterns are diverse: rice is dominant in a number of Asian countries, whereas a series of cereals, roots and tubers characterize West African food production, consumption preferences and markets.
Performance indicators: They describe how well the market fulfills certain social and private objectives, e.g. supply and price stability over the season. Market efficiency and profitability are indicators of market performance. For food security, equally important are indicators of stability of food availability and affordability over the agricultural season and through time, distribution of income and other measures of social welfare.
Course – Markets Assessment and Analysis Lesson 3 – Market Indicators
Learners’ Notes 7
Selecting prices
Prices are a standard and important element of market analysis. Consequently, prices are probably the indicator most often used, analyzed and reported. Regular monthly or weekly collection of price data for a set of key commodities is a standard component of most food security monitoring systems. Looking at prices helps to estimate how food insecure households and food suppliers will react to market changes. Prices are signals of both food availability and food access. In fact: Producer or farm gate prices tell us how much producers will receive for their products. Consumer or retail prices tell us how much consumers have to pay for their food. The difference between prices at different market locations can tell us if there is an incentive for sellers to sell, and for commodities to move from one location to another. The difference in a commodity price over the season or calendar can tell us whether it is economical to buy, store and sell a commodity later in the season. Changes in prices can help us determine whether a commodity is becoming scarcer or more abundant. As the amount of a commodity available in the market decreases relative to the demand for that commodity, the price normally rises. In this case, the commodity is said to be becoming scarcer. Conversely, as the volume available increases relative to the demand, the price tends to fall. In this case, the commodity is becoming more abundant. Similarly, if demand increases relative to supply, those who can and are willing to pay more bid the price up in order to secure the amount they would like to buy: the price is pushed up as the commodity becomes relatively scarcer. When demand declines relative to supply, sellers lower their expectations of the price they can capture and the price falls. Key commodity prices at different levels of the market (e.g. farmgate, wholesale and retail) and prices of key substitute commodities are nearly always important to include in your market analysis. The selection of prices to include will also depend on the particular market participant’s perspective that we are most concerned with. For example:

Course – Markets Assessment and Analysis Lesson 3 – Market Indicators
Learners’ Notes 8
Table 1: Prices Relevant to Different Market Participants Group Prices Producers Prices relevant for producers
• Farm gate (producer) prices of basic staples to value production and income.
• Retail and wholesale prices of basic staples as indicators of expected producer prices in the future.
• Farm gate (producer), wholesale or international prices for cash crops.
• Retail prices of inputs. Pastoralists For pastoralists/livestock farmers
• Producer, wholesale and retail prices of different livestock. Consumers For consumers (including producers, pastoralist, non-farm, urban
populations) • Retail (consumer) prices of food. • Retail (consumer) prices of basic goods and services.
Traders For traders • Farm gate (producer), wholesale and retail prices along with
margins as incentives. • Prices of fuel and handling, storage and transportation fees. • Typical government taxes and other fees incurred. • Prices of competing imported commodities (e.g. sugar, rice,
etc.). • Prices in foreign markets if exporting.
Labourers For labourers • Wage rates. • Prices of food and basic goods relative to wage rates. • Wholesale and international prices of commodities that are
produced with hired labour as an indication of employment opportunities and expected wage rates.

Course – Markets Assessment and Analysis Lesson 3 – Market Indicators
Learners’ Notes 9
Measuring prices
Prices are measured as a ratio of an amount of a particular currency to a unit of a selected commodity, for example: CFA Franc 120.00/kg of sorghum $US dollars 80/50 kg bag of rice Afghanis 130/day 8000 Kenyan Shillings/head of cattle Typically a local currency is used when the users of the information are local and will be working and thinking in terms of the local currency. Another currency is sometimes used when making comparisons between countries or within a region (e.g. the Nigerian Naira is sometimes converted to CFA in order to more easily compare prices in northern Nigeria with those in the rest of the Sahel). If the users of the information work on different countries, the US dollar, Euro or some other convertible, often quoted currency will be used.
Course – Markets Assessment and Analysis Lesson 3 – Market Indicators
Learners’ Notes 10
Collecting price information
An array of institutions collect price information on a range of commodities. The availability and dissemination of price information varies by country, as does the access to time series data. Usually one market information system (MIS) operates within a country. The MIS tends to track prices of a few key agricultural commodities and livestock in local markets throughout the country. An MIS can be limited to markets in provincial centers, but often some districts markets are also regularly monitored. In addition, there are a few regional systems. Some good examples of regional systems include: FoodNet in Uganda and Rwanda (www.foodnet.cgiar.org) and RATIN in East Africa (www.ratin.net). Case Study: FoodNet in Uganda The International Institute for Tropical Agriculture’s (IITA’s) FoodNet uses market enumerators to collect price data on 19 different agricultural commodities from market centres across the country on a weekly basis and from the main wholesale markets on a daily basis. Price information is disseminated to both farmers and traders through weekly radio broadcasts in several local languages. Price information is also available in national newspapers, e-mail and internet website (http://www.foodnet.cgiar.org/market/market.htm) and SMS text messaging. Additionally, IITA sends weekly price spreadsheets to major trading companies, government departments, agricultural development agencies and famine early warning agencies. It is linked to regional and international market information network. Having collected the information since 1999, researchers can now access time series data for market analysis. The program is funded by ACDI/VOCA through USAID Title II funds.
Course – Markets Assessment and Analysis Lesson 3 – Market Indicators
Learners’ Notes 11
Analysing prices
Analysts are not interested in the price itself but more on relationships among prices of different commodities. In fact, viewing the price of a commodity in relation to incomes (or purchasing power) and prices of other goods allows us to measure the exchange value that determines access to food and incentives to market or trade. Example: How would you determine if rice is expensive? How would you determine if rice is expensive at a price of $2.00/kg? If incomes are just $6.00/day and the average household consumes 1 kg per day, the household’s rice consumption would be equivalent to 30 percent of household income and that would be considered expensive. If the price of rice is compared to the price for maize at $2.85/kg and price of millet is $1.75/kg, you could say rice is less expensive than maize, but more expensive than millet. Knowing how the price of rice relates to the prices of other cereals adds perspective. Therefore, it is important to assess prices of a commodity in relation to incomes or purchasing power and in relation to the prices of other goods, especially those that are substitutes and complements. Price ratio of two commodities: terms of trade “Terms of trade” indicates how many units of one commodity can be exchanged for a unit of another commodity. It is generally defined as the price ratio of the two commodities. E.g. if a goat is exchanged for millet, how much millet the goat herder receives is determined by their relative prices: the price of goat over the price of millet. Example: pastoralists during the dry season For example, “terms of trade” helps to measure the purchasing power of pastoralists. During the dry season, they typically shift their consumption from livestock products to cereals and exchange (sell) their animals in order to purchase cereal. At this time, as the number of animals offered is high and the demand for cereal expands, prices of livestock tend to fall and prices of cereals tend to rise. This shrinks pastoralists’ terms of trade. It is particularly useful to compare the prices of a good with those of substitute and complementary commodities. Substitute Commodity A substitute (commodity) is a commodity that can replace another in consumption or production, such as millet for sorghum. When the price of one commodity rises, consumers or agro-processors will decrease their consumption of it and increase consumption of the substitute commodity. Wild and gathered products can be substitutes for preferred staples of food insecure households, especially in times of stress or increasing food insecurity. The term “substitute” can also be applied to crops where farmers choose to plant more or less of substitute crops, e.g., sorghum or millet, depending on the prices they expect to receive once they harvest and sell their crop.

Course – Markets Assessment and Analysis Lesson 3 – Market Indicators
Learners’ Notes 12
Whether a substitute in consumption or production, the more easily one commodity (crop) can replace the other, the more important it is to consider the price and price behavior of both commodities in your market analysis. Complementary Commodity or Good A complementary commodity is a commodity that is purchased or used in combination with another, sometimes in fixed proportions, but more often with some degree of flexibility in the proportions. An example of complementary inputs would be fertilizer, herbicides and labour in non-organic cotton production. If the price of fertilizer and herbicides increases significantly, the demand for labour decreases. Price differences between different areas may cause movement of commodities from one area to another. If the difference in prices between locations is large enough to cover transport, handling and all other costs, as well as provide some margin of profit, there is an incentive to move commodities from surplus areas (low prices) to areas of scarcity (high prices). Typically, this leads to a reduction in the price difference. Costs of moving commodities You have to consider all the costs associated with moving goods from one place to another. There are transport costs and sometimes taxes and fees. Then there are sometimes risks in moving goods – trucks can be robbed or break down on poor roads, corrupt officials can extract bribes and prices change by the time commodities are shipped. To view how easily and regularly commodities flow from one market to another: See Annex 4: Market Integration
See Annex 5: Parity Pricing
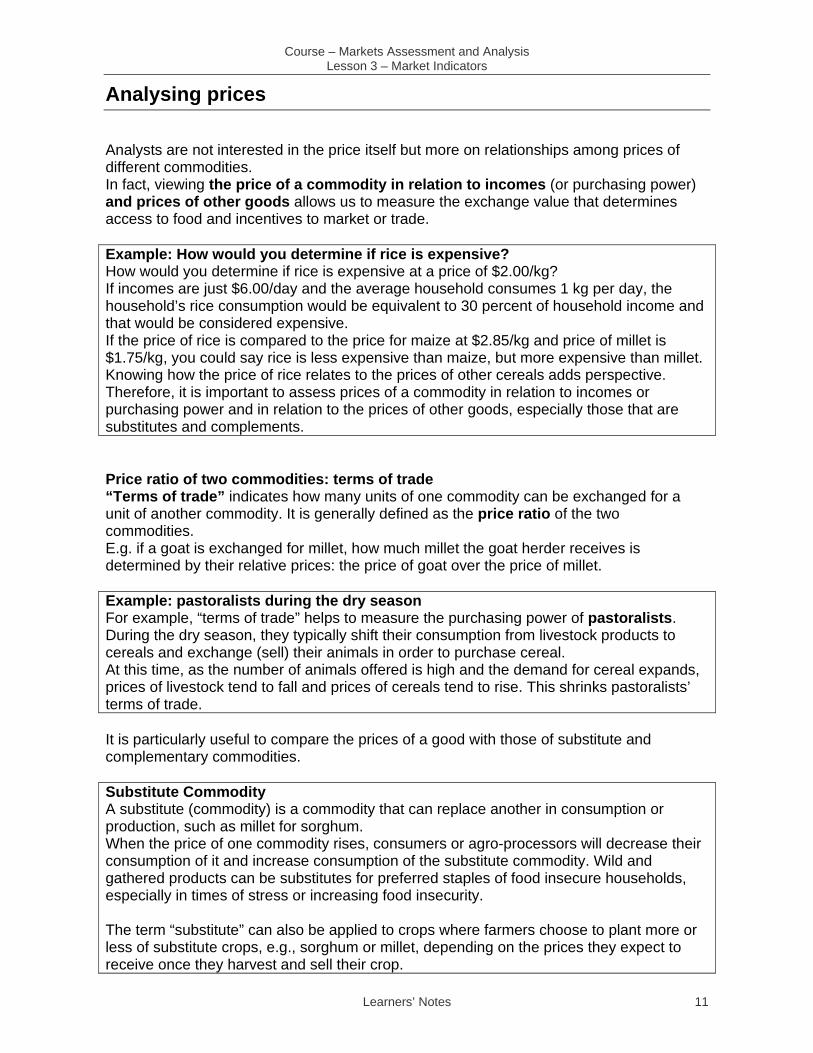
Prices follow seasonal trends, which means that they go up and down regularly over the season. Seasonal trends must be taken into account to understand whether there is any anomaly in price behaviour. If there is an increase of price, you should try to understand whether: the increase in the price is typical for this time of year or not; the magnitude of the increase is particularly large; and the price itself is particularly high. Comparisons can be made to the average price for the same period or to another significant period (e.g. a year of a drought), which is called “reference period”. In the example below, the increase of price from December 2007 to January 2008 is compared to the average period (from 2002/3 through 2006/7) and a reference period (in year 2004/5).
Course – Markets Assessment and Analysis Lesson 3 – Market Indicators
Learners’ Notes 13
Inflation is another common phenomenon which can confound the interpretation of price behavior. Inflation is an overall rise in the prices of goods and services in an economy, due to the decrease of the value of money. When there is little or no inflation, the comparison of prices over time is relatively straight forward. But, if there is inflation, this needs to be considered in order to correctly interpret price behaviour.
See Annex 6: Inflation Scenarios
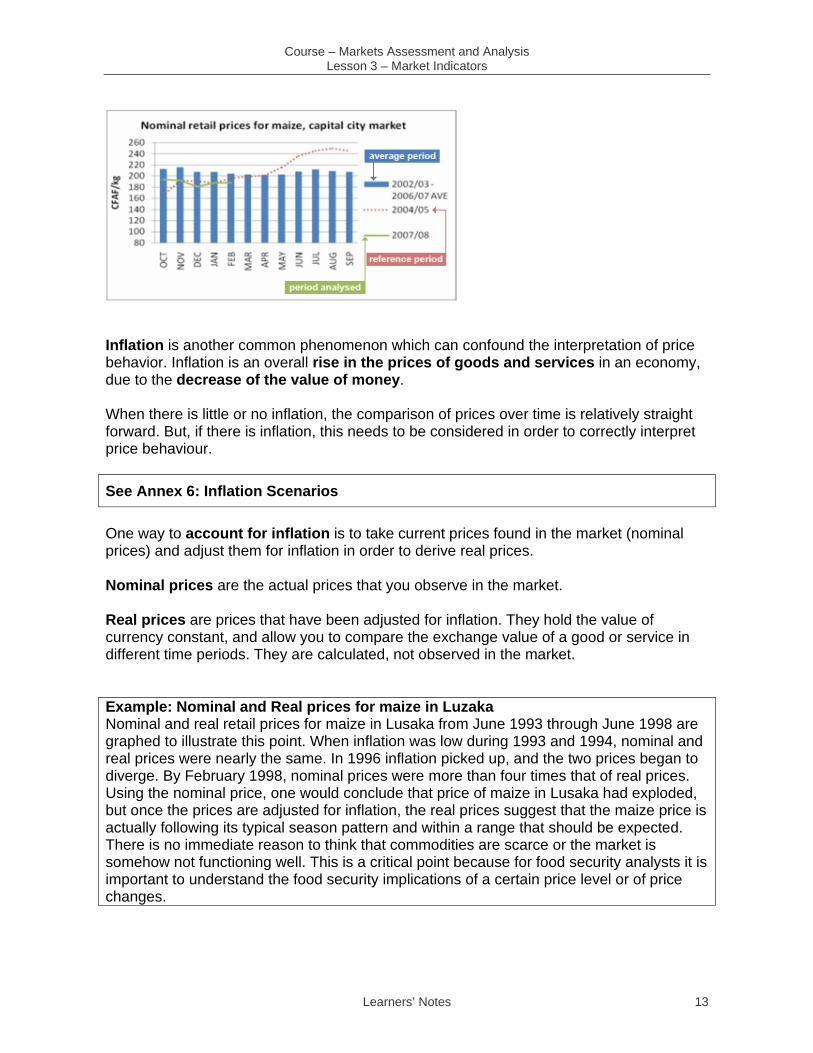
One way to account for inflation is to take current prices found in the market (nominal prices) and adjust them for inflation in order to derive real prices. Nominal prices are the actual prices that you observe in the market. Real prices are prices that have been adjusted for inflation. They hold the value of currency constant, and allow you to compare the exchange value of a good or service in different time periods. They are calculated, not observed in the market. Example: Nominal and Real prices for maize in Luzaka Nominal and real retail prices for maize in Lusaka from June 1993 through June 1998 are graphed to illustrate this point. When inflation was low during 1993 and 1994, nominal and real prices were nearly the same. In 1996 inflation picked up, and the two prices began to diverge. By February 1998, nominal prices were more than four times that of real prices. Using the nominal price, one would conclude that price of maize in Lusaka had exploded, but once the prices are adjusted for inflation, the real prices suggest that the maize price is actually following its typical season pattern and within a range that should be expected. There is no immediate reason to think that commodities are scarce or the market is somehow not functioning well. This is a critical point because for food security analysts it is important to understand the food security implications of a certain price level or of price changes.
Course – Markets Assessment and Analysis Lesson 3 – Market Indicators
Learners’ Notes 14
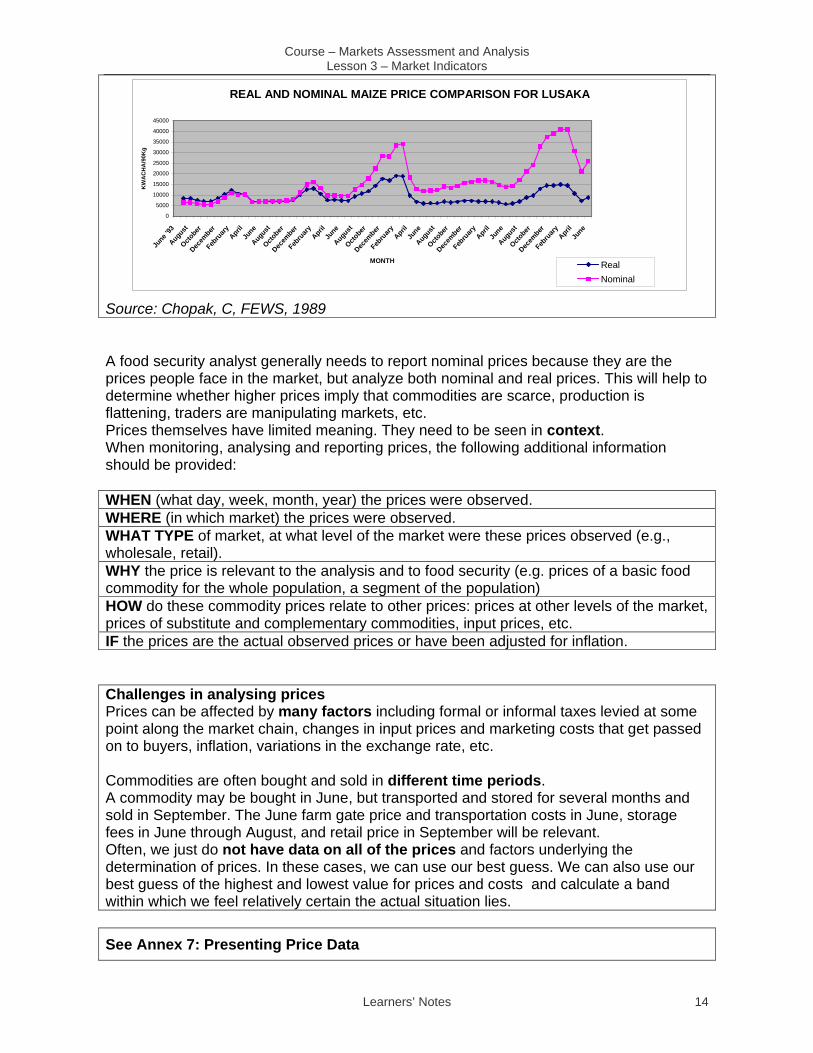
Source: Chopak, C, FEWS, 1989 A food security analyst generally needs to report nominal prices because they are the prices people face in the market, but analyze both nominal and real prices. This will help to determine whether higher prices imply that commodities are scarce, production is flattening, traders are manipulating markets, etc. Prices themselves have limited meaning. They need to be seen in context. When monitoring, analysing and reporting prices, the following additional information should be provided: WHEN (what day, week, month, year) the prices were observed. WHERE (in which market) the prices were observed. WHAT TYPE of market, at what level of the market were these prices observed (e.g., wholesale, retail). WHY the price is relevant to the analysis and to food security (e.g. prices of a basic food commodity for the whole population, a segment of the population) HOW do these commodity prices relate to other prices: prices at other levels of the market, prices of substitute and complementary commodities, input prices, etc. IF the prices are the actual observed prices or have been adjusted for inflation. Challenges in analysing prices Prices can be affected by many factors including formal or informal taxes levied at some point along the market chain, changes in input prices and marketing costs that get passed on to buyers, inflation, variations in the exchange rate, etc. Commodities are often bought and sold in different time periods. A commodity may be bought in June, but transported and stored for several months and sold in September. The June farm gate price and transportation costs in June, storage fees in June through August, and retail price in September will be relevant. Often, we just do not have data on all of the prices and factors underlying the determination of prices. In these cases, we can use our best guess. We can also use our best guess of the highest and lowest value for prices and costs and calculate a band within which we feel relatively certain the actual situation lies.
See Annex 7: Presenting Price Data
REAL AND NOMINAL MAIZE PRICE COMPARISON FOR LUSAKA
0
5000
10000
15000
20000
25000
30000
35000
40000
45000
June
'93
August
Octobe
rDec
ember
Febru
ary AprilJu
neAug
ust
Octobe
rDec
embe
rFeb
ruary Apr
ilJu
neAugu
stOcto
ber
Decem
berFeb
ruary April
June
Augus
tOcto
ber
Decem
ber
Febru
ary April
June
Augus
tOcto
ber
Decem
berFeb
ruary Apr
ilJu
ne
MONTH
KW
AC
HA
/90K
g
RealNominal
Course – Markets Assessment and Analysis Lesson 3 – Market Indicators
Learners’ Notes 15
Use of market indicators
Let’s now have a look at how markets indicators are used for different purposes in different food security contexts. 1. Market Indicators for Early Warning For early warning purposes, you want your market indicators to collectively be able to: describe trends; identify anomalies; account for and anticipate both supply and demand response; disaggregate and pinpoint impacts over populations and space; provide a perspective on future events; and help clarify policy and program options.
See Annex 8: Market Indicators for Early Warning
2. Market Indicators for Emergency Impact Assessment For emergency impact assessments, market indicators should:
• verify current conditions on the ground; • provide a clear measure of impact on markets and market related infrastructure; • provide indications of whether the situation is improving or continuing to decline; • disaggregate and pinpoint impacts over populations and space; and • help clarify and prioritize policy and program options.
See Annex 9: Market Indicators for Emergency Impact Assessment
3. Market Indicators for Recovery and Transition For recovery and transition monitoring and analysis, market indicators should:
• measure both diversity and magnitude or volume of activities; • account of changes in quality (improved roads, restored storage, reduced spoilage
of commodities, etc); • measure change and make comparisons over time; • disaggregate and pinpoint impacts and indicators of progress over populations and
space; • incorporate perceptions of market participants on constraints, character and speed
of transition and expectations for the near future; and • help clarify when policies and programs need to be updated and modified to reflect
recovery and transition, including exit strategies.
See Annex 10: Market Indicators for Recovery and Transition

Course – Markets Assessment and Analysis Lesson 3 – Market Indicators
Learners’ Notes 16
Market Centre Food Security Indicators
Market centres can serve as barometers of the current economic and food security conditions of the surrounding population. During periods of stress, households resort to the markets to employ a range of typical coping strategies (e.g. distress sales of livestock). The number of small-scale enterprises and petty traders can swell, the units of measure can shrink and the volume and quality of consumer goods being offered can change. Large-scale traders may reduce premiums paid to suppliers or the employment of ad hoc services (e.g. casual labour to help cart and bag goods). These signs can be translated into indicators and incorporated into regular monitoring plans or assessment tools. Some typical behaviours that could serve as relevant market centre food security indicators include, but are certainly not limited to:
• sales of indicator commodities – e.g. breeding stock; • early sales – e.g. farmers selling green maize, livestock coming on the market
earlier in the season; • rise in the number of people selling certain goods – e.g. charcoal, fuel wood and
gathered commodities; • smaller or altered units of measure – e.g. new, smaller cups for retail purchases; • more farmers acting as petty traders; • new ethnic groups appearing in the market, sometimes migrating from significant
distances; • increased number of children working in the market; and • larger number of idle casual day labourers.
Course – Markets Assessment and Analysis Lesson 3 – Market Indicators
Learners’ Notes 17
Summary
A range of typical market indicators are used to create a market profile or baseline. Prices are probably the indicator most often used, analyzed and reported. The selection of prices depends on the particular market participants’ perspective that we are most concerned with. Prices need to be analysed in relation to seasonal trends in order to determine whether there is any anomaly in price behaviour. Inflation is a common phenomenon which must be taken into account when analysing prices. Different market indicators are used for different purposes in different food security contexts: early warning, emergency, impact assessment and recovery/transition. Market centres can serve as barometers of the current economic and food security conditions of the surrounding population.
Course – Markets Assessment and Analysis Lesson 3 – Market Indicators
Learners’ Notes 18
If you want to know more
Online resources FEWS NET “Southern Africa Monthly Update” http://www.foodnet.cgiar.org/market/market.htm Additional reading Ame, 2006 Awuor, Thomas (2007). “Review of Trade and Markets Relevant to Food Security in the Greater Horn of Africa. FEWS NET Chopak, C (1989). FEWS NET (2008) “Import/Export Price Parity Analysis.” Market Guidance No 1. FEWS NET (2008) “Structure-Conduct-Performance and Food Security” Market Guidance No 2. Tegegne, et.al (1999) Ward, William “Calculating Import and Export Parity Prices,” Training material of the Economic Development Institute, CN-3 (Washington D.C.: World Bank, 1977)
Course – Markets Assessment and Analysis Lesson 3 – Market Indicators
Learners’ Notes 20
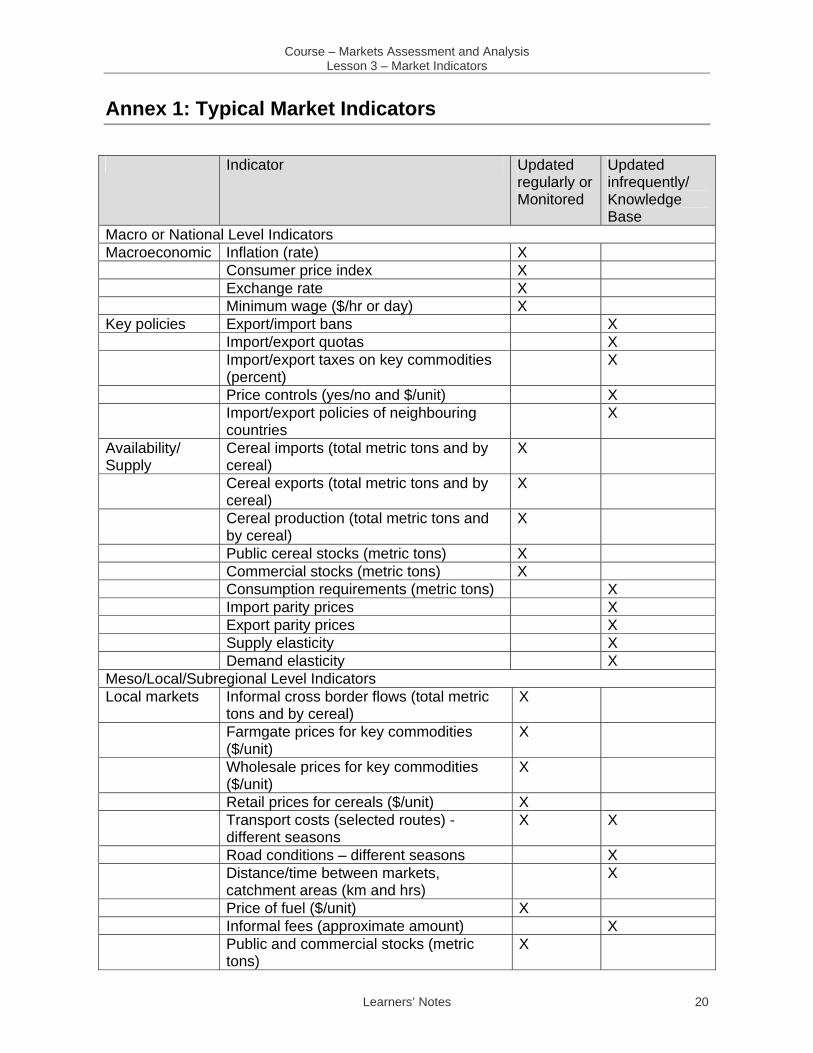
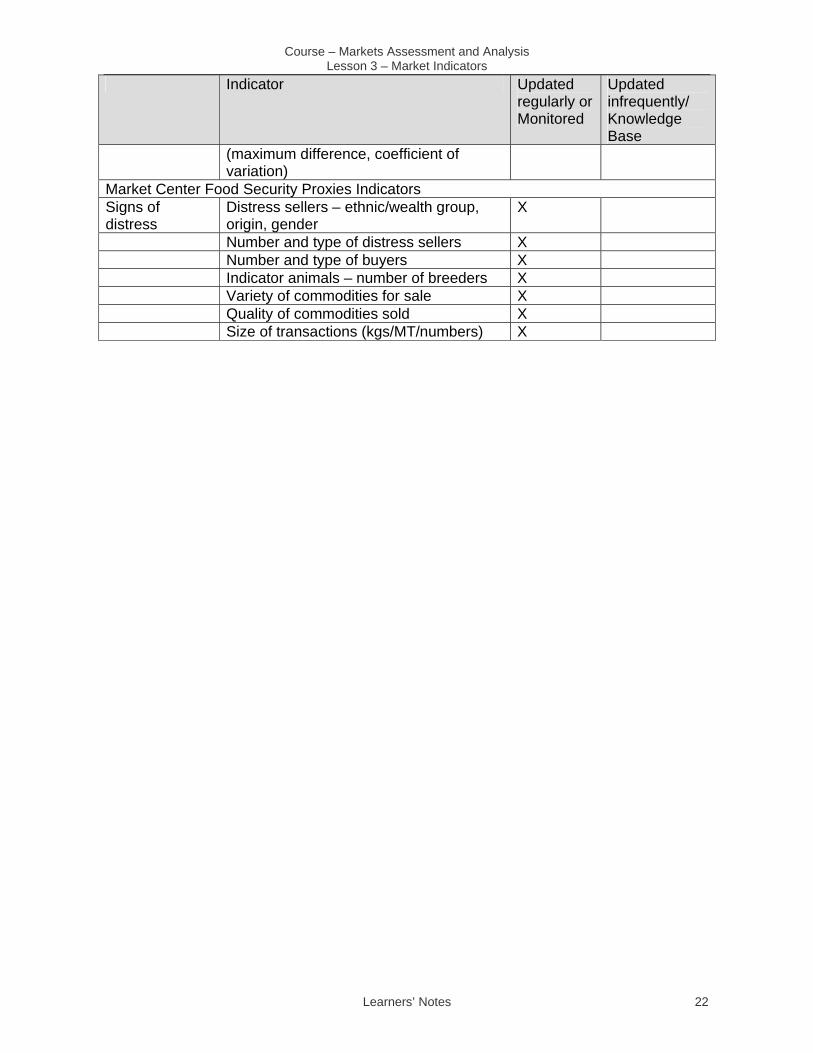
Annex 1: Typical Market Indicators
Indicator Updated regularly or Monitored
Updated infrequently/ Knowledge Base
Macro or National Level Indicators Macroeconomic Inflation (rate) X Consumer price index X Exchange rate X Minimum wage ($/hr or day) X Key policies Export/import bans X Import/export quotas X Import/export taxes on key commodities
(percent) X
Price controls (yes/no and $/unit) X Import/export policies of neighbouring
countries X
Availability/ Supply
Cereal imports (total metric tons and by cereal)
X
Cereal exports (total metric tons and by cereal)
X
Cereal production (total metric tons and by cereal)
X
Public cereal stocks (metric tons) X Commercial stocks (metric tons) X Consumption requirements (metric tons) X Import parity prices X Export parity prices X Supply elasticity X Demand elasticity X Meso/Local/Subregional Level Indicators Local markets Informal cross border flows (total metric
tons and by cereal) X
Farmgate prices for key commodities ($/unit)
X
Wholesale prices for key commodities ($/unit)
X
Retail prices for cereals ($/unit) X Transport costs (selected routes) -
different seasons X X
Road conditions – different seasons X Distance/time between markets,
catchment areas (km and hrs) X
Price of fuel ($/unit) X Informal fees (approximate amount) X Public and commercial stocks (metric
tons) X

Course – Markets Assessment and Analysis Lesson 3 – Market Indicators
Learners’ Notes 21
Indicator Updated regularly or Monitored
Updated infrequently/ Knowledge Base
Storage costs ($/bag or metric ton) X Casual labour wage rate ($/day or hr) X Livestock prices ($/herd by species and
type: bull, cow, etc) X
Basic input prices, e.g., fertilizer ($/unit or ha)
X
Supply elasticity X Demand elasticity X Market Structure – Conduct – Performance Indicators Structure Number and type of sellers and buyers in
market X X
% of volume traded by largest market participants
X
Cereal storage capacity (metric tons) X Veterinary services (yes/no, fees) X Access to credit/financing (yes/no,
interest rate) X
Market associations (yes/no) X Conduct Key catchment areas X Alternative catchment areas X Market participant price expectations
($/unit at x time) X
Market participant margin expectations (at x time)
X
Commercial stocking (metric tons) X Large buyer purchasing plans (kgs/
metric tons and when) X X
Government purchasing and selling plans (kgs/MT and when)
Performance Consumer prices for key commodities ($/unit)
X
Wholesale prices for key commodities ($/unit)
X
Farmgate prices for key commodities ($/unit)
X
Terms of trade ($ animal/$grain) X Margins and distribution shares (% share
to participants) X X
Seasonality of supply (annual variation) X Seasonal variation in prices of key
commodities (maximum difference, coefficient of variation)
X X
Seasonal variation in supplies of key commodities
X
Commodity quality measures X X Spatial distribution of key commodities X X Seasonal variation in terms of trade X
Course – Markets Assessment and Analysis Lesson 3 – Market Indicators
Learners’ Notes 22
Indicator Updated regularly or Monitored
Updated infrequently/ Knowledge Base
(maximum difference, coefficient of variation)
Market Center Food Security Proxies Indicators Signs of distress
Distress sellers – ethnic/wealth group, origin, gender
X
Number and type of distress sellers X Number and type of buyers X Indicator animals – number of breeders X Variety of commodities for sale X Quality of commodities sold X Size of transactions (kgs/MT/numbers) X
Course – Markets Assessment and Analysis Lesson 3 – Market Indicators
Learners’ Notes 23
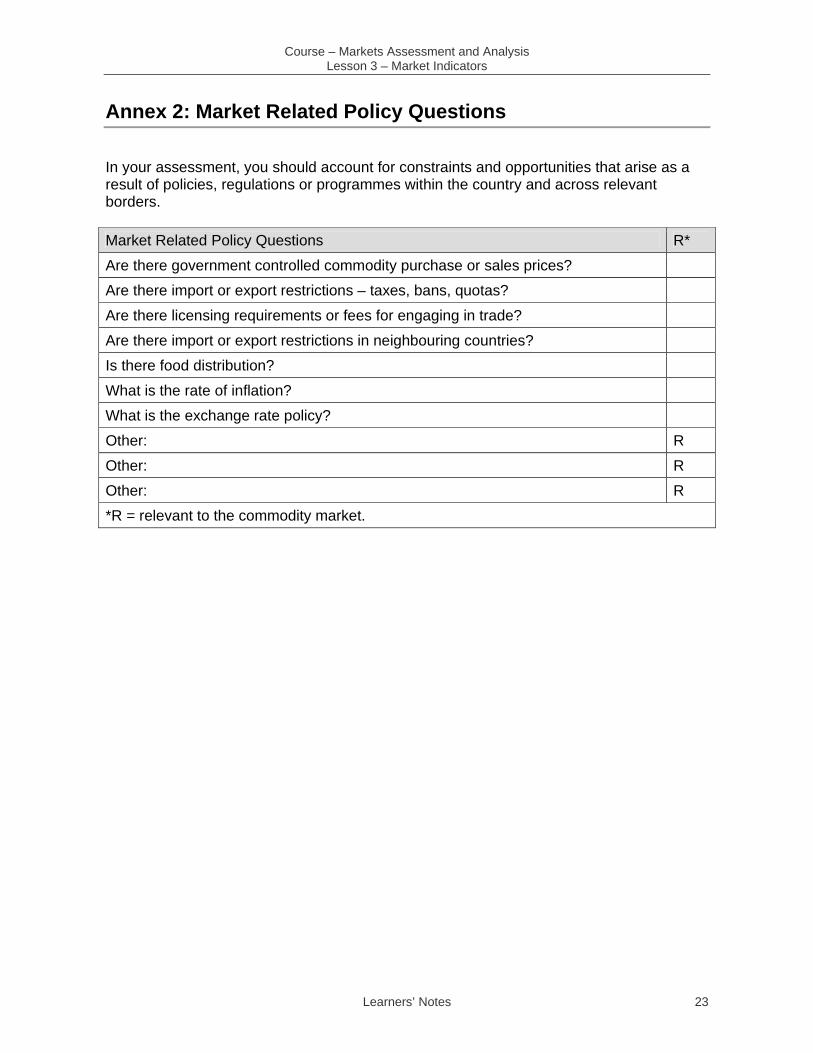
Annex 2: Market Related Policy Questions
In your assessment, you should account for constraints and opportunities that arise as a result of policies, regulations or programmes within the country and across relevant borders. Market Related Policy Questions R*
Are there government controlled commodity purchase or sales prices? Are there import or export restrictions – taxes, bans, quotas?
Are there licensing requirements or fees for engaging in trade?
Are there import or export restrictions in neighbouring countries? Is there food distribution?
What is the rate of inflation? What is the exchange rate policy?
Other: R
Other: R Other: R *R = relevant to the commodity market.
Course – Markets Assessment and Analysis Lesson 3 – Market Indicators
Learners’ Notes 24
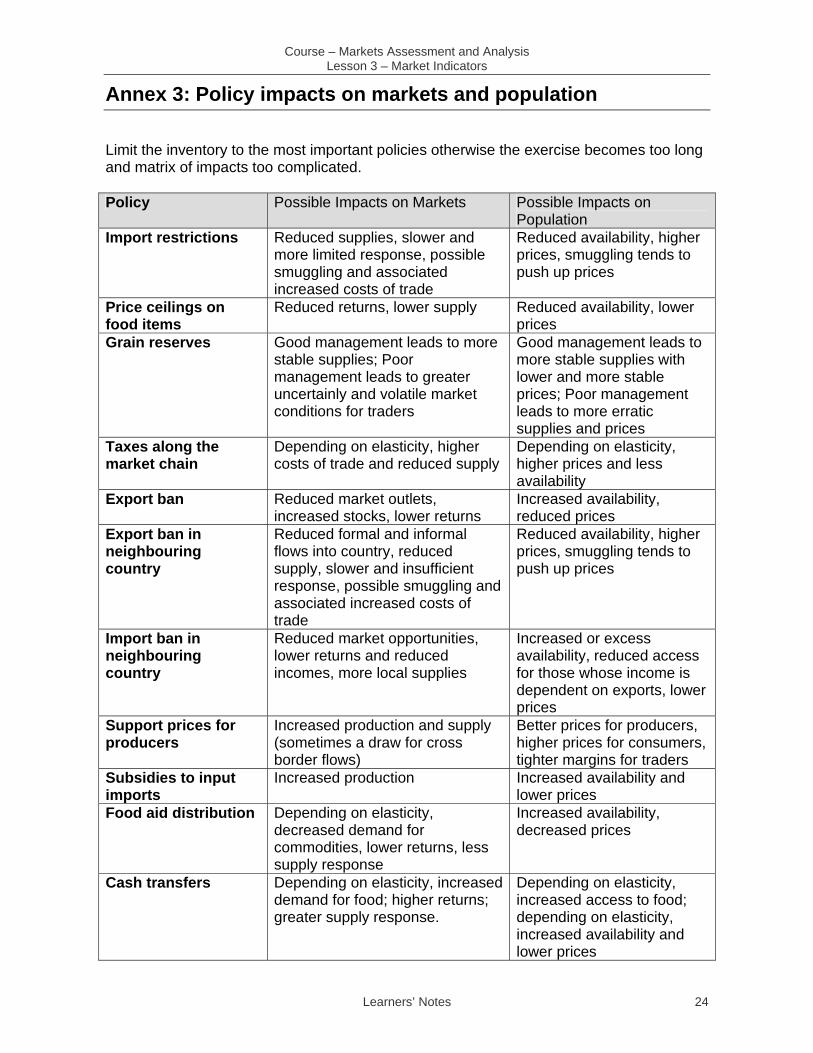
Annex 3: Policy impacts on markets and population
Limit the inventory to the most important policies otherwise the exercise becomes too long and matrix of impacts too complicated. Policy Possible Impacts on Markets Possible Impacts on
Population Import restrictions Reduced supplies, slower and
more limited response, possible smuggling and associated increased costs of trade
Reduced availability, higher prices, smuggling tends to push up prices
Price ceilings on food items
Reduced returns, lower supply Reduced availability, lower prices
Grain reserves Good management leads to more stable supplies; Poor management leads to greater uncertainly and volatile market conditions for traders
Good management leads to more stable supplies with lower and more stable prices; Poor management leads to more erratic supplies and prices
Taxes along the market chain
Depending on elasticity, higher costs of trade and reduced supply
Depending on elasticity, higher prices and less availability
Export ban Reduced market outlets, increased stocks, lower returns
Increased availability, reduced prices
Export ban in neighbouring country
Reduced formal and informal flows into country, reduced supply, slower and insufficient response, possible smuggling and associated increased costs of trade
Reduced availability, higher prices, smuggling tends to push up prices
Import ban in neighbouring country
Reduced market opportunities, lower returns and reduced incomes, more local supplies
Increased or excess availability, reduced access for those whose income is dependent on exports, lower prices
Support prices for producers
Increased production and supply (sometimes a draw for cross border flows)
Better prices for producers, higher prices for consumers, tighter margins for traders
Subsidies to input imports
Increased production Increased availability and lower prices
Food aid distribution Depending on elasticity, decreased demand for commodities, lower returns, less supply response
Increased availability, decreased prices
Cash transfers Depending on elasticity, increased demand for food; higher returns; greater supply response.
Depending on elasticity, increased access to food; depending on elasticity, increased availability and lower prices
Course – Markets Assessment and Analysis Lesson 3 – Market Indicators
Learners’ Notes 25
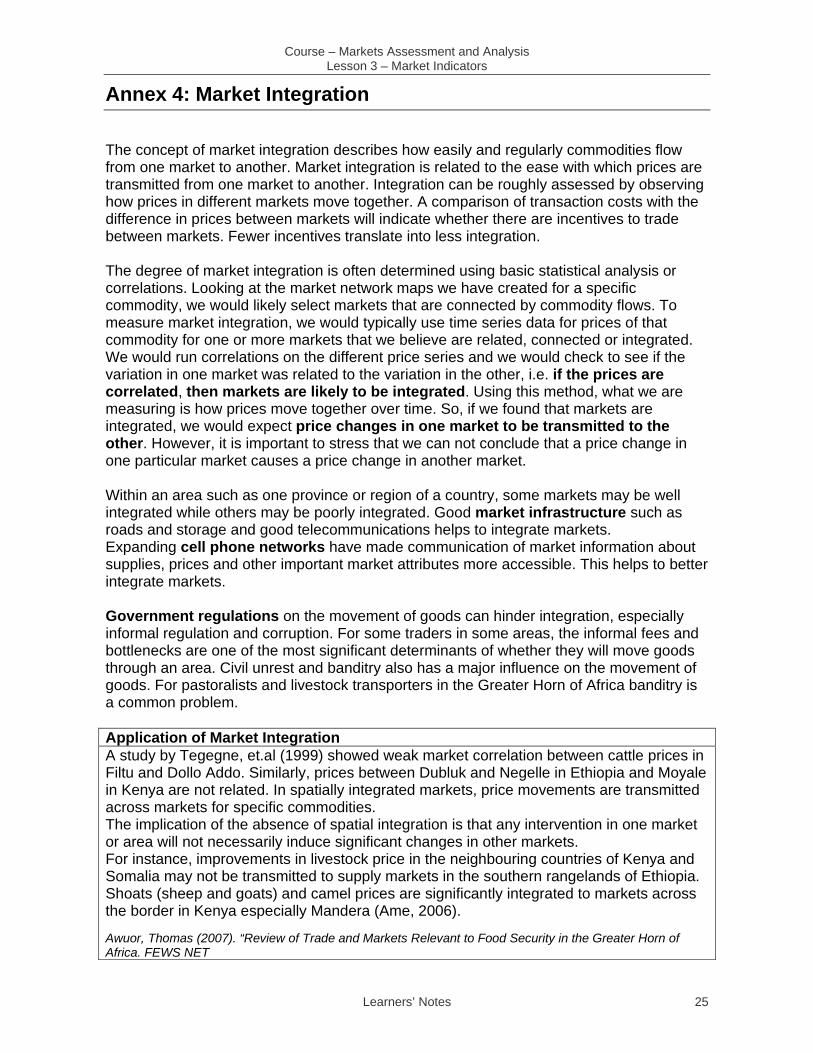
Annex 4: Market Integration
The concept of market integration describes how easily and regularly commodities flow from one market to another. Market integration is related to the ease with which prices are transmitted from one market to another. Integration can be roughly assessed by observing how prices in different markets move together. A comparison of transaction costs with the difference in prices between markets will indicate whether there are incentives to trade between markets. Fewer incentives translate into less integration. The degree of market integration is often determined using basic statistical analysis or correlations. Looking at the market network maps we have created for a specific commodity, we would likely select markets that are connected by commodity flows. To measure market integration, we would typically use time series data for prices of that commodity for one or more markets that we believe are related, connected or integrated. We would run correlations on the different price series and we would check to see if the variation in one market was related to the variation in the other, i.e. if the prices are correlated, then markets are likely to be integrated. Using this method, what we are measuring is how prices move together over time. So, if we found that markets are integrated, we would expect price changes in one market to be transmitted to the other. However, it is important to stress that we can not conclude that a price change in one particular market causes a price change in another market. Within an area such as one province or region of a country, some markets may be well integrated while others may be poorly integrated. Good market infrastructure such as roads and storage and good telecommunications helps to integrate markets. Expanding cell phone networks have made communication of market information about supplies, prices and other important market attributes more accessible. This helps to better integrate markets. Government regulations on the movement of goods can hinder integration, especially informal regulation and corruption. For some traders in some areas, the informal fees and bottlenecks are one of the most significant determinants of whether they will move goods through an area. Civil unrest and banditry also has a major influence on the movement of goods. For pastoralists and livestock transporters in the Greater Horn of Africa banditry is a common problem. Application of Market Integration A study by Tegegne, et.al (1999) showed weak market correlation between cattle prices in Filtu and Dollo Addo. Similarly, prices between Dubluk and Negelle in Ethiopia and Moyale in Kenya are not related. In spatially integrated markets, price movements are transmitted across markets for specific commodities. The implication of the absence of spatial integration is that any intervention in one market or area will not necessarily induce significant changes in other markets. For instance, improvements in livestock price in the neighbouring countries of Kenya and Somalia may not be transmitted to supply markets in the southern rangelands of Ethiopia. Shoats (sheep and goats) and camel prices are significantly integrated to markets across the border in Kenya especially Mandera (Ame, 2006). Awuor, Thomas (2007). “Review of Trade and Markets Relevant to Food Security in the Greater Horn of Africa. FEWS NET

Course – Markets Assessment and Analysis Lesson 3 – Market Indicators
Learners’ Notes 26
Annex 5: Parity Pricing
Parity pricing is used to compare prices across borders. Parity price analysis is a standard method of equating (or comparing) prices in one place with those in another, typically across international borders. There are two types of parity prices: import parity and export parity. Parity pricing refers to making prices of a commodity in one location equivalent to the same commodity in another location, usually in a different country. It accounts for the difference in prices of a given commodity across distances or across borders. Import parity price is the value of a commodity bought from another country in a location within the country (usually the port of entry). It can help to determine whether importing a particular commodity is cheaper or more expensive than producing and procuring it within the country at a given location within the country. Import parity prices are measured as the Cost, Insurance and Freight (CIF) price. Export parity price is the value of a commodity sold at a specific location in a foreign country but valued at a specific location in the country from which it originated. It measures whether a country’s exports are competitive with the same commodity produced in another country. Exports are valued as Free on Board (FOB) price. Which parity price applies to which situation depends on which side of the transaction you stand or whose incentives you want to consider. An importer is interested in the import parity price and this will serve as an indicator of whether it is worth it to buy the commodity, pay for shipping, handling and local transport costs. An exporter is interested in the export parity price and this will serve as an indicator of whether their commodity is competitive with the same type of commodity located in a market across the border. Once all costs associated with moving the commodity to that foreign market are deducted from the price at the foreign location, is there a price difference remaining? Example of the Use of Parity Pricing Consider cotton being exported from Ouagadougou, Burkina Faso to Liverpool, England. In the eyes of an importer in Liverpool, the import parity price of the same cotton is the local price of cotton in Ouagadougou plus all transport and insurance costs to ship the cotton to Liverpool plus unloading charges at the port. However, from Burkina Faso’s point of view, it is more useful to calculate the export parity price valued at Ouagadougou, because we want to compare it with other cotton prices in Liverpool and see if our export price is competitive, after adjusting for shipping costs. Also we want to compare it with local prices and determine whether there is an incentive to export cotton to Liverpool or not. For the cotton to be competitively priced, an importer, after paying shipping costs, must find it cheaper or equivalently priced when comparing it to alternative cotton imports prices in Liverpool. Also, if the export parity price in Ouagadougou is higher than the local price of cotton then it is worthwhile exporting to Liverpool, otherwise we might as well sell the cotton locally. FEWS NET (2007) “Calculating Parity Prices.” Market Guidance No 2.

Course – Markets Assessment and Analysis Lesson 3 – Market Indicators
Learners’ Notes 27
There are standard formulas for calculating parity prices. CIF and FOB prices are available for a number of major ports or trade hubs. Large-scale and commercial traders frequently use these prices in making purchase and sales decisions. The South Africa Futures Exchange (SAFEX) regularly reports parity prices relevant to South African trade. Elements of CIF (Cost Insurance Freight) and FOB (Free on Board) Item Element CIF Includes:
FOB cost at point of export Freight charges to point of import Insurance charges Unloading from ship to pier at port Excludes: Import duties and subsidies Port charges at port of entry for taxes, handling, storage, agents’ fees, and the like
FOB Includes: All costs to get goods on board – but still in harbor of exporting country: Local marketing and transport costs Local port charges including taxes, storage, loading, fumigation, agents’ fees and the like Export taxes and subsidies Project boundary price Farm-gate price
Source: William A. Ward, “Calculating Import and Export Parity Prices,” Training material of the Economic Development Institute, CN-3 (Washington D.C.: World Bank, 1977)
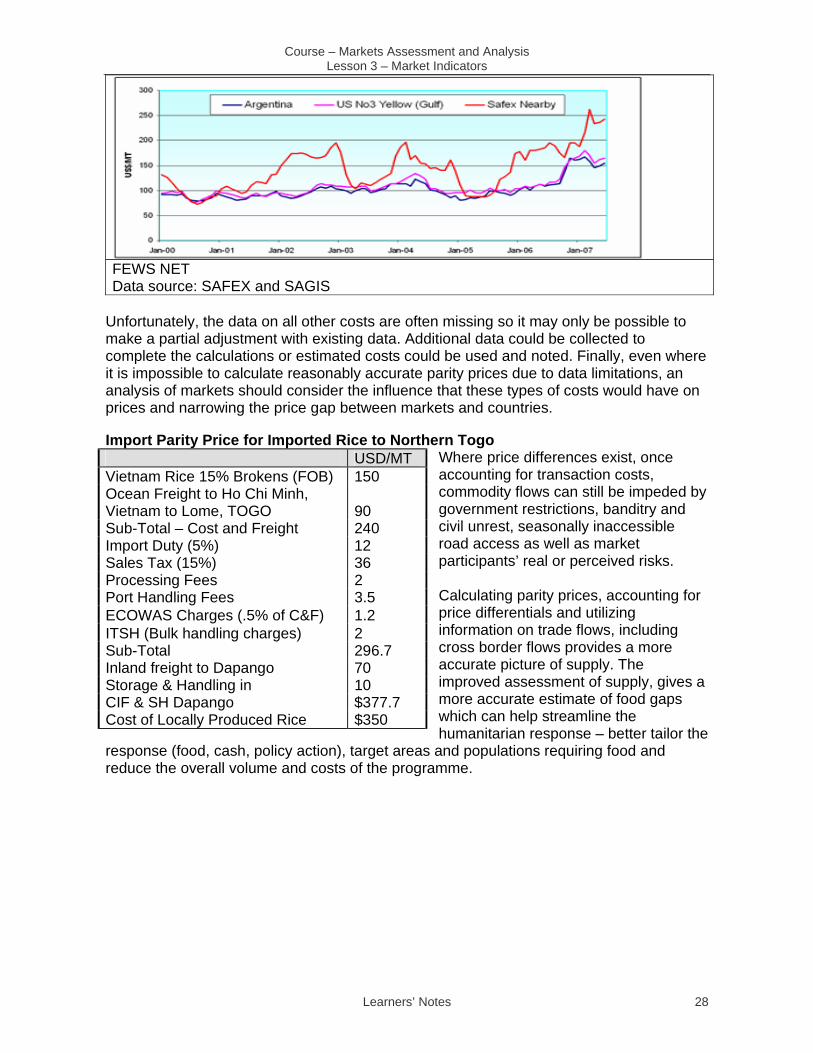
Parity prices for South Africa can be used to evaluate how likely it would be for South African grain to fill a food gap within the region, a country or a particular sub-national region of a country within the region. In some sub-national border regions, local maize from Malawi, Zambia and Tanzania may be more competitive than South African maize. In this case, such local maize flows would reduce somewhat the need for formal and informal cross border flows from South Africa to fill national food gaps. FOB USA and Argentine maize prices compared to white maize SAFEX nearby Jan 2000 – April 2007 International and SAFEX prices The combined effects of high international grain prices as well as limited availability in South Africa have acted to dramatically increase South African domestic prices of maize as indicated by price movements since January on SAFEX. Prices for the nearby contract increased steadily in May and June after having dropped to US$233/MT in April, from a peak of US$261/MT in March. The SAFEX prices are moving in tandem with international prices, which are driven by overall global demand. Rising international prices, and hence import parity, is likely to keep SAFEX prices at much higher levels for most of the marketing year, making South Africa’s maize less competitive when compared to neighboring Malawi, Zambia and Tanzania.
Course – Markets Assessment and Analysis Lesson 3 – Market Indicators
Learners’ Notes 28
FEWS NET Data source: SAFEX and SAGIS
Unfortunately, the data on all other costs are often missing so it may only be possible to make a partial adjustment with existing data. Additional data could be collected to complete the calculations or estimated costs could be used and noted. Finally, even where it is impossible to calculate reasonably accurate parity prices due to data limitations, an analysis of markets should consider the influence that these types of costs would have on prices and narrowing the price gap between markets and countries.
Import Parity Price for Imported Rice to Northern Togo Where price differences exist, once accounting for transaction costs, commodity flows can still be impeded by government restrictions, banditry and civil unrest, seasonally inaccessible road access as well as market participants’ real or perceived risks. Calculating parity prices, accounting for price differentials and utilizing information on trade flows, including cross border flows provides a more accurate picture of supply. The improved assessment of supply, gives a more accurate estimate of food gaps which can help streamline the humanitarian response – better tailor the
response (food, cash, policy action), target areas and populations requiring food and reduce the overall volume and costs of the programme.
USD/MT Vietnam Rice 15% Brokens (FOB) 150 Ocean Freight to Ho Chi Minh, Vietnam to Lome, TOGO 90 Sub-Total – Cost and Freight 240 Import Duty (5%) 12 Sales Tax (15%) 36 Processing Fees 2 Port Handling Fees 3.5 ECOWAS Charges (.5% of C&F) 1.2 ITSH (Bulk handling charges) 2 Sub-Total 296.7 Inland freight to Dapango 70 Storage & Handling in 10 CIF & SH Dapango $377.7 Cost of Locally Produced Rice $350

Course – Markets Assessment and Analysis Lesson 3 – Market Indicators
Learners’ Notes 29
Annex 6: Inflation Scenarios
Let’s look at what happens to the farmer and consumer in the following three scenarios. This provides a good illustration of why it’s important to account for inflation when doing food security analysis of market price behaviour. Scenario 1: Little or no Inflation Farmer Consumer If a farmer sells a kilogram of millet for 100 CFA in October in 2006 and 125 CFA/kg in October of 2007, and there is little of no inflation, s(he) will earn more from the sale of that kilogram of millet in 2007. The farmer will have more income and with that income s(he) will be able to buy more goods and services. So the farmer is better off.
If a consumer buys one kilogram of wheat flour for 15 Rps in December 2006 and one kilogram of wheat flour for 25 Rps in December 2007, and there is very little inflation, it is possible to say that s(he) is worse off in December 2007 compared to December 2006.
Scenario 2: 10% Inflation Farmer Consumer For the farmer, if annual inflation was 10 percent, the farmer is still better off because the price in December 2007 is more than 10 percent higher than in was in December 2006. However, the farmer will have seen some erosion in the purchasing power of his/her income.
For the consumer, if annual inflation was 10 percent, the consumer would still be worse off and wheat flour would have gotten relatively more expensive than other goods and services. S(he) might choose to purchase less wheat flour and maybe more rice, a substitute cereal for wheat, if the price of rice did not rise as much as wheat flour.
Scenario 3: 30% Inflation Farmer Consumer If inflation was 30 percent, the farmer would be worse off because the difference in price from 2006 to 2007 is less than the rate of inflation.
If inflation was 30 percent, wheat flour would be more attractive because it would now be relatively cheaper compared to other goods and services included in the typical consumer basket. The consumer may even purchase more wheat flour and less rice because flour may be relatively cheaper than rice.
Course – Markets Assessment and Analysis Lesson 3 – Market Indicators
Learners’ Notes 30
Annex 7: Presenting Price Data
Although there are a number of ways to present price data, there are standards for graphing price data and price trends. These standards ensure that the information is clear to the user. The following standards clarify what is being measured:
• Always note the units on both the X and Y axis of the graph
• Always note from which market the data was collected (e.g., Tegucigalpa, Mazar e Sharif)
• Always note the type of market/level of the market from which the data is collected (e.g. farmgate, wholesale, retail)
• Prices should be compared to an average, typically a five year average – this allows the user to readily identify anomalies
• A reference year can also be added to provide greater comparability
• Provide an explanation of all calculations – this can be included in a footnote to the graph.
The following standards are used for formatting graphs:
• Present at least one full year of data along the X-axis – this allows the user to readily observe trends. Typically one year is included on the X-axis. Multiple years are used to illustrate long-term trends
• Do not average over different markets and report one average price for a country or subregion – the interpretation of that price will be confusing and may mask important variations within the country or subregion.
• Line graphs are more legible and preferred over bar charts
• Do not crowd the graphs with too many price lines
• Always note the source of the data
• Report on the same commodities over time so that users of the information can keep track of price behaviour over time

Course – Markets Assessment and Analysis Lesson 3 – Market Indicators
Learners’ Notes 31
Annex 8: Market Indicators for Early Warning
Markets Monitoring and Early Warning Questions
Useful Indicators
• What does the supply situation look like within the market catchments – locally, regionally or globally?
• Is there enough food in markets?
• Volume of commodities in the market and other markets within the commodity networks
• Changes in volumes over time
• What is happening to food stocks? • Volume of commodities in public and private stocks
• Flows – direction and magnitude
• Are livestock prices abnormally low and declining, is this anomalous and will this trend continue?
• Are cereal prices abnormally high and rising, is this anomalous and will this trend continue?
• What are the implications for pastoralists?
• Current and average livestock prices • Current and average cereal prices • Current and average terms of trade
• How will demand respond to increasing food prices?
• Elasticities of demand • Prices of substitute commodities • Relative prices • Wage rates
• How will supply respond to the increasing food prices?
• Elasticities of supply • Relative prices in different markets • Stocks • Marketing costs and margins • Market integration • Parity prices
• What are prices likely to be next month, later in the season?
• Prices trends • Expectations of market participants
• Are wage rates and employment opportunities declining, is this abnormal and will this trend continue?
• What do we expect the employment situation to look like in a month, later in season, etc?
• Current and average wage rates • Unemployment rates • Current and expected performance of
markets as sources of employment
• Have there been any important events or changes locally or within the region that could affect the market like:
• Price or exchange rate policies • Fuel and transport costs • Civil unrest • New businesses that may compete for
food (e.g., poultry for grain as feed) • Institutional purchases that may
compete for food (e.g., strategic grain reserves, WFP)

Course – Markets Assessment and Analysis Lesson 3 – Market Indicators
Learners’ Notes 32
Annex 9: Market Indicators for Emergency Impact Assessment
Markets Monitoring and Emergencies Useful Indicators • What is the damage to market related
infrastructure? • Number and percentage of roads
and bridges open and in reasonable condition
• Number of vehicles inoperable • Current and previous transport
routes • Number of warehouses, storage
facilities damaged and operable/inoperable and capacity
• Number of agro-processing facilities (slaughter houses, mills) operable/inoperable and capacity
• Market-related services operable/inoperable
• What are the losses in terms of commodity and stock?
• Type and number of livestock lost • Type and quantity of commodities
lost • Type and quantity of stocks of
commodities lost • Type and quantity of seed lost • Type and quantity of inputs lost
• Which populations are most affected? • Number and impacts to households • Number and impacts to traders • Number and impacts to transporters • Number and impacts to other related
businesses
• What has happened to the supply of food security relevant commodities, including inputs?
• Have purchasing and selling behaviors and strategies changed and how?
• Number of markets open/functioning • Types and volumes of commodities
available • Current catchment for supplies of
different commodities • Change in the number and volume
of commodities available • Market participant expectation of
future trends

Course – Markets Assessment and Analysis Lesson 3 – Market Indicators
Learners’ Notes 33
Markets Monitoring and Emergencies Useful Indicators • How are markets functioning? • How have markets been changing? • Are commodities affordable? • Are poor consumers buying different
types of commodities? • What has happened to employment
opportunities • What are the major needs and constraints
facing different market participants (traders, transporters)?
• When will markets recover? • Are current humanitarian responses
affecting markets and market participants?
• Are coping strategies of the different market participants helping or hindering the response and recovery?
• Number of markets open/functioning • Types and numbers of sellers and
buyers • Change in the type and number of
sellers and buyers • Types and volumes of commodities
in the market • Change in the types and volumes of
commodities in the market • Quality of commodities • Commodity prices • Variation in prices • Spatial variation in prices • Costs (time and financial) of
transport • Commodity margins • Variation in margins • Wage rate • Employment rates • Expectations and impressions of
market participants • Expectations and impressions of
local government staff • Portion of households’ food derived
from the market and change over time
• Timeline for market recovery
• If civil insecurity has been an issue, is it improving or deteriorating and how?
• Number and frequency of incidents • Transport delays • Informal fees and movement
restrictions • Movement of people and
commodities
• What are the expectations for recovery? • What is the expected timeframe for
rehabilitation of certain elements – infrastructure, storage, stocks, herds
• Timeline for the shock or stress factors
• Timeline for rehabilitation of warehouses, storage facilities, market stalls, cold storage
• Timeline for reconstituting stocks of different commodities
• Timeline for next harvest(s)
• What is the current humanitarian response?
• Programme type and coverage (population and area)
Course – Markets Assessment and Analysis Lesson 3 – Market Indicators
Learners’ Notes 34
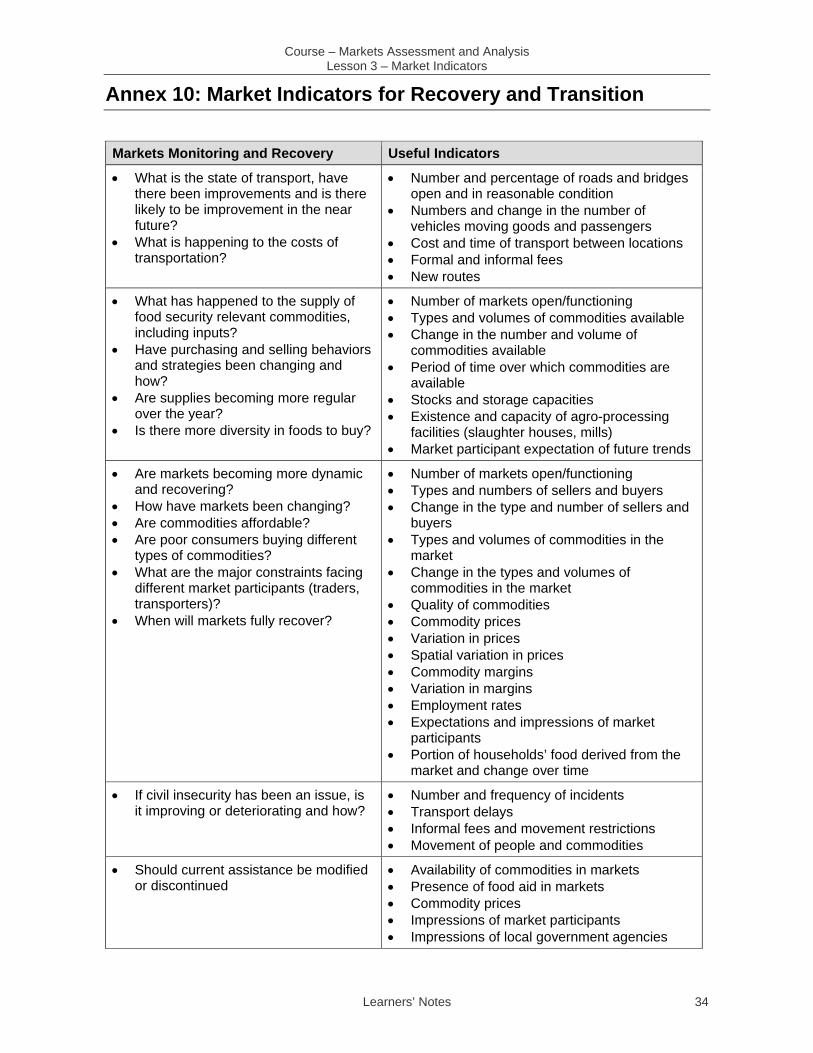
Annex 10: Market Indicators for Recovery and Transition
Markets Monitoring and Recovery Useful Indicators
• What is the state of transport, have there been improvements and is there likely to be improvement in the near future?
• What is happening to the costs of transportation?
• Number and percentage of roads and bridges open and in reasonable condition
• Numbers and change in the number of vehicles moving goods and passengers
• Cost and time of transport between locations • Formal and informal fees • New routes
• What has happened to the supply of food security relevant commodities, including inputs?
• Have purchasing and selling behaviors and strategies been changing and how?
• Are supplies becoming more regular over the year?
• Is there more diversity in foods to buy?
• Number of markets open/functioning • Types and volumes of commodities available • Change in the number and volume of
commodities available • Period of time over which commodities are
available • Stocks and storage capacities • Existence and capacity of agro-processing
facilities (slaughter houses, mills) • Market participant expectation of future trends
• Are markets becoming more dynamic and recovering?
• How have markets been changing? • Are commodities affordable? • Are poor consumers buying different
types of commodities? • What are the major constraints facing
different market participants (traders, transporters)?
• When will markets fully recover?
• Number of markets open/functioning • Types and numbers of sellers and buyers • Change in the type and number of sellers and
buyers • Types and volumes of commodities in the
market • Change in the types and volumes of
commodities in the market • Quality of commodities • Commodity prices • Variation in prices • Spatial variation in prices • Commodity margins • Variation in margins • Employment rates • Expectations and impressions of market
participants • Portion of households’ food derived from the
market and change over time
• If civil insecurity has been an issue, is it improving or deteriorating and how?
• Number and frequency of incidents • Transport delays • Informal fees and movement restrictions • Movement of people and commodities
• Should current assistance be modified or discontinued
• Availability of commodities in markets • Presence of food aid in markets • Commodity prices • Impressions of market participants • Impressions of local government agencies