Embed Size (px)
Citation preview

Agricultural policies in developing countriesMarketing and stabilization, subsidies, and policy reform
Governments throughout the developing worldwant to provide the poor with an adequate dietand to promote a more productive and efficientagricultural sector. But, as Chapter 4 has shown,their general economic policies, as well as taxes onfarm outputs, tend to create a bias against agricul-ture. A reexamination of development strategiesand of the excessive taxation of farm outputsshould be high on the agenda for policy reform.
At the same time, it is important to review theprice stabilization, consumer subsidy, and inputsubsidy programs through which governments tryto offset the bias against agricultural producers andto assist low-income groups. Because the net bene-fits of these types of programs are low in practiceas will be brought out in this chapterthey need tobe redesigned or reduced considerably in size. Theresources thus saved can be used for more produc-tive purposes, including the many useful servicesthat governments provide in agriculture. WorldBank experience indicates that agricultural invest-ment, when carefully designed and implemented,is no less productive than investment in other sec-tors. The rate of return can be, and has been, veryhigh. The benefits from agricultural investmentsare sensitive, however, to the policy environmentwithin which private markets operate. The typesof reform discussed in Chapter 4 and in this chap-ter are important in improving that environment.Many countries have recognized the interdepen-dence between projects and policies and have un-dertaken significant reforms. The trend towardpolicy reform in developing countries is reviewedat the end of this chapter.
Marketing and stabilization
Governments seeking ways to influence producerand consumer prices often establish public sector
marketing agencies. Usually, the intent is to assistagricultural producers by preventing "monopolis-tic" private traders from exploiting them. But, inpractice, marketing is an intrinsically difficult taskfor public agencies to perform well. This sectionlooks at the performance of these agencies.
Public sector marketing
The form, legal status, and range of functions car-ried out by public agencies vary from country tocountry. In India, public corporations at both thenational and state levels buy and distribute food.In Mexico, a large state monopoly controls im-ports, domestic procurement, and the distributionof a wide range of agricultural goods. In contrast tothose organizations dealing in a variety of com-modities, many marketing agencieswith or with-out monopoly positionshandle only one com-modity. Statutory monopolies, or marketingboards, are commonly used to control the pur-chase and export of individual crops, both in Af-rica and elsewhere.
Governments often justify their involvement inmarketing with the argument that the private sec-tor is inefficient and can be monopolized by a smallnumber of traders. There is little evidence that thisis generally true. Various studies have comparedthe efficiency of private and public sector market-ing. In Kenya, the public sector charged 15 to 20percent more for marketing maize and beans thandid the private sector. Other studies have com-pared seasonal price changes in private marketswith the cost of storage, and price differences be-tween regions with the cost of transport. Datafrom Ghana and Nigeria, for instance, revealedseasonal price rises that appeared to be close to thecost of storage, which suggests that private traderswere not able to develop monopoly powers. Price
85
movements for goods traded in free markets inWest African countries also support the proposi-tion that efficient marketing channels help bindmarkets together.
In contrast, numerous studies have indicatedthat public sector marketing agencies can be rela-tively inefficient. Staffing is one problem. Keymanagers are often chosen for political reasons.Even if the top management is competent, it isoften pressured into expanding staff for politicalreasons. Flexibility in staffing is often lacking.Competence and morale often deteriorate. Finan-cial problems also are common. Funds may be in-adequate or released at the wrong time. Publicagencies also often have unrealistic and inconsis-tent mandates to generate government revenue,provide cheap food, and create employment.
Perhaps more important, public marketing agen-cies find it hard to handle the sheer complexity ofmarkets, especially in areas dominated bysmaliholders. The agencies have to buy smallamounts of food from tens of thousands, even mil-lions, of widely dispersed farmers in places wherecommunications are poor and where existing localmarkets vary from place to place and changequickly. Whereas farmers want to sell a bewilder-ing variety of maize or millet of different origins,freshness, or fine shadings of taste and quality,each at a different price, state-organized systemsusually offer only one or two prices for each grain.Some offer only one purchase price throughoutthe year and for all locations.
As complex centrally controlled systems areopen to corruption, it is difficult for public agenciesto adopt the differentiated pricing policies whichare needed to promote efficient trade. But the costsof not doing so can be great. For example, when anagency offers a single price for all grades of a crop,farmers want to sell to it only their lowest qualitygrade. When the agency is in charge of exportingthe crop, as in the case of the rice marketing boardin Guyana, the low quality of its supplies discour-ages foreign buyers.
In most of sub-Saharan Africa, public sector mar-keting agencies have a legal monopoly over tradefor a wide range of commodities, although thegrowth of parallel markets has limited their influ-ence. Even when there is no legal monopoly, in-adequately differentiated and inflexible prices un-dermine private sector trading; so do unrealistictrading margins. Private traders have beencrowded out in many countries, from Colombiaand Peru to Kenya and the Philippines.
Marketing problems are less severe when public
86
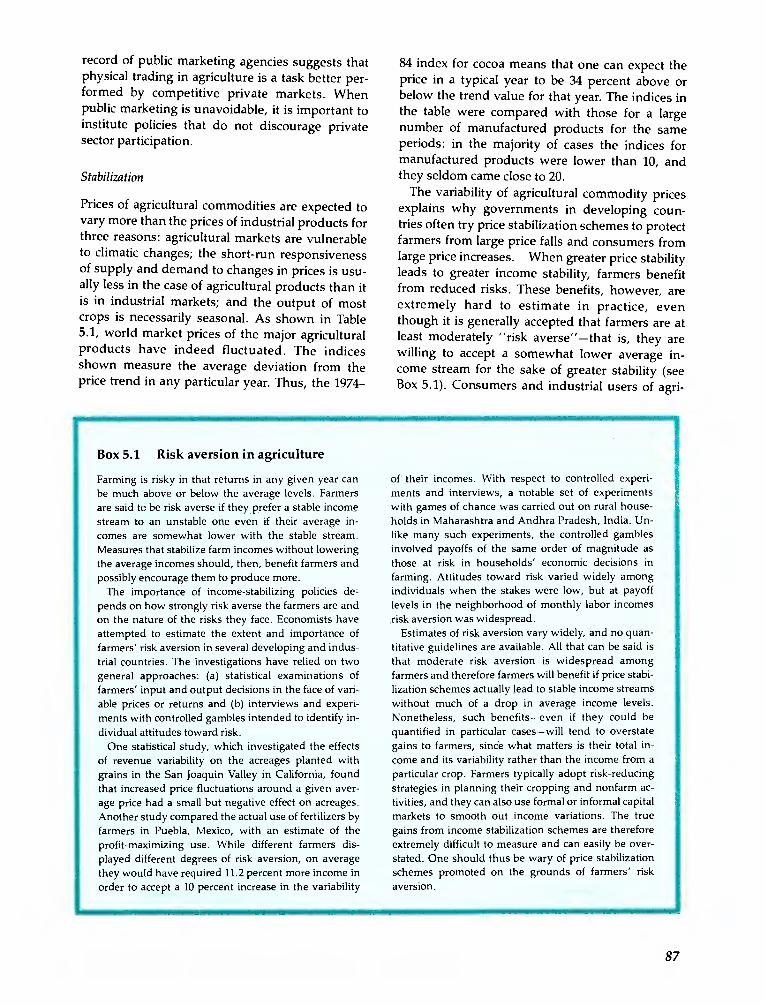
Table 5.1 Price instability indices, 1964-84
Note: Index =
Ii fp_p\21,
where P and P are actual and exponential trend values, respectively,and N is the length of the period. Prices are mainly from the Londonand New York markets, and they are deflated by the manufacturingunit value (MUV) index (1984 = 100).Source: MacBean and Nguyen, "Commodity Price Instability" (back.ground paper).
marketing agencies are not subsidized or protectedby legal monopolies. The government of Indone-sia, for instance, encourages public estates to buysmallholder crops in order to guarantee farmers a"fair" price. In some cases the public estates co-exist with private markets and influence theirprices through competition. In many other coun-tries (such as Sri Lanka in the case of rice) thepublic sector has been able to coexist and competewith the private sector. In both Indonesia and SriLanka, the private sector has proved more efficientand has increased its share of the market despitethe subsidies that the public sector entities directlyor indirectly receive.
Although they are often inefficient and costly,public marketing agencies nonetheless can provideuseful services. Some export marketing boardshave helped increase exports by exercising qualitycontrol, arranging shipping, and providing pro-ducers with technical advice and information. It isnecessary to note, however, that these services donot require monopoly trading powers. Private ex-porters' or producers' associations could performthe same functions more efficiently.
Governments have an important role to play inencouraging efficient markets. They can assistcompetition, but creating public monopolies to off-set the threat of private ones does not do this. The
International price
Commodity 1964-84 1974 -84
Sugar 90.8 51.5Cocoa 37.3 34.1Rice 33.0 21.9Coffee 32.0 37.7Palm kernels 27.5 32.5Wheat 24.3 16.9Tea 21.7 23.6Jute 21.2 26.8Soybeans 20.8 9.9Beef 16.7 11.3Corn 16.6 15.6Rubber 16.1 14.0Sorghum 15.6 13.6Cotton 14.3 10.7
record of public marketing agencies suggests thatphysical trading in agriculture is a task better per-formed by competitive private markets. Whenpublic marketing is unavoidable, it is important toinstitute policies that do not discourage privatesector participation.
Stabilization
Prices of agricultural commodities are expected tovary more than the prices of industrial products forthree reasons: agricultural markets are vulnerableto climatic changes; the short-run responsivenessof supply and demand to changes in prices is usu-ally less in the case of agricultural products than itis in industrial markets; and the output of mostcrops is necessarily seasonal. As shown in Table5.1, world market prices of the major agriculturalproducts have indeed fluctuated. The indicesshown measure the average deviation from theprice trend in any particular year. Thus, the 1974-
84 index for cocoa means that one can expect theprice in a typical year to be 34 percent above orbelow the trend value for that year. The indices inthe table were compared with those for a largenumber of manufactured products for the sameperiods: in the majority of cases the indices formanufactured products were lower than 10, andthey seldom came close to 20.
The variability of agricultural commodity pricesexplains why governments in developing coun-tries often try price stabilization schemes to protectfarmers from large price falls and consumers fromlarge price increases. When greater price stabilityleads to greater income stability, farmers benefitfrom reduced risks. These benefits, however, areextremely hard to estimate in practice, eventhough it is generally accepted that farmers are atleast moderately "risk averse' 'that is, they arewilling to accept a somewhat lower average in-come stream for the sake of greater stability (seeBox 5.1). Consumers and industrial users of agri-
Box 5.1 Risk aversion in agriculture
Farming is risky in that returns in any given year canbe much above or below the average levels. Farmersare said to be risk averse if they prefer a stable incomestream to an unstable one even if their average in-comes are somewhat lower with the stable stream.Measures that stabilize farm incomes without loweringthe average incomes should, then, benefit farmers andpossibly encourage them to produce more.
The importance of income-stabilizing policies de-pends on how strongly risk averse the farmers are andon the nature of the risks they face. Economists haveattempted to estimate the extent and importance offarmers' risk aversion in several developing and indus-trial countries. The investigations have relied on twogeneral approaches: (a) statistical examinations offarmers' input and output decisions in the face of vari-able prices or returns and (b) interviews and experi-ments with controlled gambles intended to identify in-dividual attitudes toward risk.
One statistical study, which investigated the effectsof revenue variability on the acreages planted withgrains in the San Joaquin Valley in California, foundthat increased price fluctuations around a given aver-age price had a small but negative effect on acreages.Another study compared the actual use of fertilizers byfarmers in Puebla, Mexico, with an estimate of theprofit-maximizing use. While different farmers dis-played different degrees of risk aversion, on averagethey would have required 11.2 percent more income inorder to accept a 10 percent increase in the variability
of their incomes. With respect to controlled experi-ments and interviews, a notable set of experimentswith games of chance was carried out on rural house-holds in Maharashtra and Andhra Pradesh, India. Un-like many such experiments, the controlled gamblesinvolved payoffs of the same order of magnitude asthose at risk in households' economic decisions infarming. Attitudes toward risk varied widely amongindividuals when the stakes were low, but at payofflevels in the neighborhood of monthly labor incomesrisk aversion was widespread.
Estimates of risk aversion vary widely, and no quan-titative guidelines are available. All that can be said isthat moderate risk aversion is widespread amongfarmers and therefore farmers will benefit if price stabi-lization schemes actually lead to stable income streamswithout much of a drop in average income levels.Nonetheless, such benefitseven if they could bequantified in particular caseswill tend to overstategains to farmers, since what matters is their total in-come and its variability rather than the income from aparticular crop. Farmers typically adopt risk-reducingstrategies in planning their cropping and nonfarm ac-tivities, and they can also use formal or informal capitalmarkets to smooth out income variations. The truegains from income stabilization schemes are thereforeextremely difficult to measure and can easily be over-stated. One should thus be wary of price stabilizationschemes promoted on the grounds of farmers' riskaversion.
87
cultural raw materials can also be similarly riskaverse.
But it is possible to overstate the benefits of stabi-lization. Farmers, for example, can lose rather thangain if incomes fluctuate because of variations incrop yields and outputsstable prices can then de-stabilize incomes. It is also possible that, on aver-age, the unit costs of raw materials for an agro-industry will be less if prices fluctuate than if theyare stable. Moreover, farmers, consumers, traders,and industrial users can reduce the risks they faceby diversifying their activities, by using capitalmarkets, by storing products, and by sharing risksthrough purchase and sales contracts.
Stabilization is a particularly complex task forany government to undertake, and its costs can bevery high. The mechanisms and costs of price sta-bilization depend on whether the commodity isinternationally traded. The discussion below isconfined to traded goods.
FOOD CROPS. Stabilization of the prices ofstaplessuch as wheat, rice, and maizeis a majorconcern in many developing countries, where thepoor spend a large proportion of their income onthese foods. In many cases these staples are im-ported. What will happen if unrestricted privateforeign trade is permitted without any border mea-sures, and how can stabilization measures be in-troduced?
In the absence of trade duties and quotas, do-mestic prices are determined by world prices at thecountry border, the exchange rate, and domesticmarketing margins. Private traders can and do im-port and store. Private markets can also managerisks in other ways:
Farmers can adapt their cropping patterns,crop choices, and input uses to reduce the risks ofincome fluctuations; consumers can adapt theirconsumption patterns by substituting differentitems of food; agro-industries can smooth out costfluctuations by using the capital market and bystoring their inputs.
International futures markets can be used tohedge risks, and options markets can be used toprovide insurance. These special types ofmarketsexplained in Box 7.2 in Chapter 7arelimited at present, but their growth would be pro-moted if developing countries were willing to usethem.
An unregulated system can, of course, causefluctuations in the availability of foreign exchange,and the need to make large outlays for imports inperiods of high world prices cannot be ruled out.
88
Governments can reduce such risks by holdinggreater amounts of foreign exchange reserves, byusing international capital markets, or by using theCompensatory Financing Facility (CFF) of the In-ternational Monetary Fund (see Chapter 7).
The use of these mechanisms will not, of course,make domestic prices more stable than interna-tional prices. If greater stability is sought, tradeinterventions become necessary. Thus, import tar-iffs can be used to keep domestic prices higher inperiods of low prices, and import subsidies or re-bates can be used to keep domestic prices lowerwhen world prices are high. Such a scheme is allthat would be necessary for a traded good; no pub-lic buffer stocks would be required. It is importantto note that while these schemes might be simplerand less costly to operate than buffer stocks, theyare not without cost. As seen in Chapter 4, tradeinterventions involve efficiency losses which canbecome large as tariffs and rebates are increased.
In the case of food, however, developing coun-tries typically do not follow schemes of this sort.Instead of using import tariffs or rebates, govern-ments establish trade monopolies; instead of rely-ing on private storage, they run public bufferstocks. In some countries (Brazil, for example) spe-cialized agencies operate buffer stocks, while inothers (Mexico and India, for example) the stabili-zation function is combined with other functionsin particular, the provision of consumer subsidiesin urban areas.
Practices vary in other ways too. In many SouthAsian and Latin American countries, imports areused sparingly to add to stocks, while more liberalpolicies are followed elsewhere, as in Indonesia.For any given size of buffer stock, the choice be-tween domestic procurement and imports is criti-cally important in controlling costs. For example,in the case of India, great savings might be possi-ble by increasing the use of trade, as discussed inBox 5.2.
The chief costs involved in a buffer stock opera-tion are the costs of storage facilities and interestcharges. Because of inefficiencies in public opera-tions, the multiplicity of objectives that publicagencies may be required to pursue, and the factthat governments often seek degrees of stabiliza-tion that necessarily entail losses, public agenciesoften need subsidiesboth direct cash subsidiesand indirect subsidies in the form of low interestrates on loans (see Box 5.2).
Subsidization of public buffer stock operationscrowds out private storage activities and leads tomuch larger public stocksand higher coststhan
Box 5.2 Food-grain buffer stocks and price stabilization in India
The last two decades have witnessed a marked turn-around in India's food-grain sector. In the mid-1960sIndia's food-grain economy was in severe crisis, andthe country was heavily dependent on imports ofwheat, which were financed primarily through the P.L.480 food assistance program. Since then the situationhas gradually improved, and impressive increases infood output have been brought about by a combinationof large investments in irrigation, introduction of high-yielding grain varieties, and increases in farm prices.In addition to its efforts to increase food-grain output,the government has tried to ensure the availability offood grains to low-income consumers at stable subsi-dized prices.
To do this the Indian government, through the FoodCorporation of India (FCI) and other state agencies,runs one of the largest food distribution systems in theworld. Typically, the government purchases a part ofthe domestic marketed surplus of grain, monopolizesexternal trade, adds to or depletes existing bufferstocks, and sells the resulting supply through special"fair price shops." In a normal year the governmentsells about 10 percent of the total grain consumption;the figure rises to about 15 percent in a drought year.The system has succeeded in providing greater pricestability for consumers than would have existed other-wise.
Despite the benefits to producers and to those con-sumers who have access to fair price shops, the costs ofrunning the system have been a source of continualconcern. In the 1960s and early 1970s, when India wasa substantial grain importer, the food distribution sys-tem operated with relatively low buffer stocks in orderto moderate import needs. In recent years the size and
therefore the costs of holding buffer stocks have in-creased dramatically. India is currently reported to beholding more than 30 million tons of grain as bufferstocks, equal to more than two years of sales from thefair price shop system. The large buffer stocks haveaccumulated not necessarily because of a conscious de-cision to hold stocks at this level, but as an unintendedeffect of other factors. The growth in food-grain outputhas outstripped growth in demand because the gov-ernment has repeatedly raised the procurement price.
A study conducted by the Birla Institute of ScientificResearch in India as early as 1977-78, when the bufferstock was about 12 million tons, showed that the totalsubsidy to the FCI was Rs6.75 billion (about 44 percentof total sales). Of this, Rs5.66 billion represented directcash subsidies, about 60 percent of which was in-tended to cover the costs of buffer stock operations.Owing to the increase in the size of the buffer stock,the direct cash subsidies grew to about Rsll billion in1984-85.
The rising costs of buffer stock operations have led toa search for measures to improve the cost effectivenessof the system. A study by the International Food PolicyResearch Institute, reviewing the options prior to 1983,suggested that the same objectives of the wheat pro-gram could be met at about a third of the actual costsby increasing the reliance on international trade. Amore liberal import policy would have allowed drasticreductions in the size of the buffer stock needed tomeet the same stabilization objectives. While factorsother than storage costs are relevant in deciding on thesize of the buffer stock, this study indicates the impor-tance of examining the increased use of internationaltrade as an alternative to large domestic buffer stocks.
otherwise would occur. Especially when theagency is also responsible for subsidized food dis-tribution in urban areas, the subsidies can be verylarge. They can also vary with fluctuations in do-mestic harvests and in international prices. This isone reason why public agencies can be forced toprocure food at less than market prices; this natu-rally leads to restrictions on private internal trade.These policies defeat the objective of assisting do-mestic farmers. Restrictions on internal tradewhich have been practiced not only in Africa butalso in China and Indialead, like restrictions oninternational trade, to higher instability in prices.Three additional problems that tend to arise fre-quently are:
As distinct from pure price stabilization, gov-ernments also try to guarantee a floor price for
farmers. It is extremely difficult to judge how floorprices are to be set. Usually, references are made tothe cost of production, but this varies at the marginwith the production level; the question becomeshow much domestic production is desirable. Mis-takes occur frequently. By setting procurementprices too high, the public agency may end upbuying massive stocks, as happened recently inIndia (with wheat) and Brazil (with maize).
Since public agencies can receive subsidies,considerations of profitability do not determine thedifference between floor and ceiling prices. Floorand ceiling pricesand a public agency's ability toimplement themvary in practice from season toseason because of conflicting pressures from differ-ent interest groups, fluctuations in the budgetarysubsidies available, and changes in the trade and
89
exchange rate policies of the country. The netresult can be greater instability in domestic prices.A comparison of annual domestic and world pricemovements for the 1967-81 period for grain inthirty-seven developing countries indicated thatdomestic prices were not significantly more stablethan world prices in many cases.
With sufficient subsidization, complete pricestability is feasible, and it is not uncommon forgovernments to maintain the same consumer pricethroughout the year. This can be enormously ex-pensive, not only in terms of budgetary costs butalso in terms of the distortions introduced in pro-duction and consumption patterns.
The objectives of stabilizing food prices and pro-viding farmers with floor price guarantees presenthard choices for any developing country. Whenguaranteed prices are set too high and stabilizationis carried too far, governments in developing coun-tries are likely to end up imposing higher costs onthe economy than world price instability in itselfwould. Inefficient implementation of policies ag-gravates the problem. Greater priority should begiven to moderating stabilization and producersupport objectives, to bringing about stability andpredictability of the public policy regime, and toencouraging private sector operations.
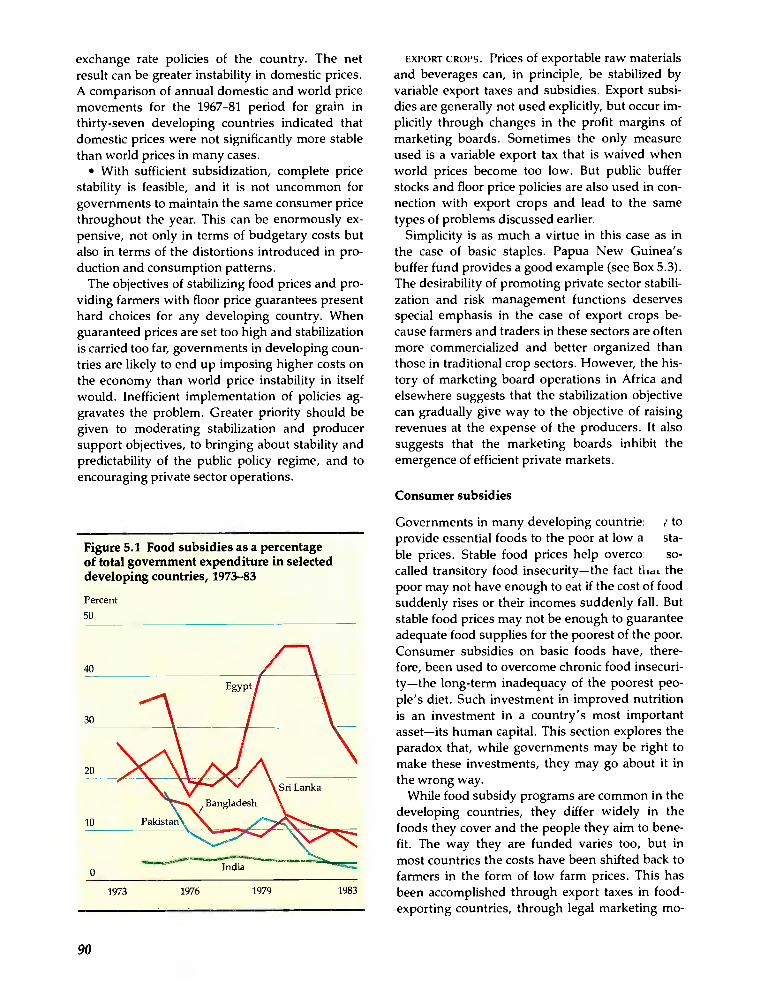
Figure 5.1 Food subsidies as a percentageof total government expenditure in selecteddeveloping countries, 1973-83
Percent50
90
EXPORT CROPS. Prices of exportable raw materialsand beverages can, in principle, be stabilized byvariable export taxes and subsidies. Export subsi-dies are generally not used explicitly, but occur im-plicitly through changes in the profit margins ofmarketing boards. Sometimes the only measureused is a variable export tax that is waived whenworld prices become too low. But public bufferstocks and floor price policies are also used in con-nection with export crops and lead to the sametypes of problems discussed earlier.
Simplicity is as much a virtue in this case as inthe case of basic staples. Papua New Guinea'sbuffer fund provides a good example (see Box 5.3).The desirability of promoting private sector stabili-zation and risk management functions deservesspecial emphasis in the case of export crops be-cause farmers and traders in these sectors are oftenmore commercialized and better organized thanthose in traditional crop sectors. However, the his-tory of marketing board operations in Africa andelsewhere suggests that the stabilization objectivecan gradually give way to the objective of raisingrevenues at the expense of the producers. It alsosuggests that the marketing boards inhibit theemergence of efficient private markets.
Consumer subsidies
Governments in many developing countrie ' toprovide essential foods to the poor at low a sta-ble prices. Stable food prices help overco so-called transitory food insecuritythe fact tlLaL thepoor may not have enough to eat if the cost of foodsuddenly rises or their incomes suddenly fall. Butstable food prices may not be enough to guaranteeadequate food supplies for the poorest of the poor.Consumer subsidies on basic foods have, there-fore, been used to overcome chronic food insecuri-tythe long-term inadequacy of the poorest peo-ple's diet. Such investment in improved nutritionis an investment in a country's most importantassetits human capital. This section explores theparadox that, while governments may be right tomake these investments, they may go about it inthe wrong way.
While food subsidy programs are common in thedeveloping countries, they differ widely in thefoods they cover and the people they aim to bene-fit. The way they are funded varies too, but inmost countries the costs have been shifted back tofarmers in the form of low farm prices. This hasbeen accomplished through export taxes in food-exporting countries, through legal marketing mo-
1973 1976 1979 1983
Box 5.3 Papua New Guinea's buffer fund
Until 1977 the government of Papua New Guinea paidfarmers who grew three main export cropscopra, cof-fee, and cocoaa price based upon their costs of pro-duction. Official agencies worked out a price thatwould generate a return to smallholders at least equalto the minimum rural wage and adopted it as the offi-cial support price. The stabilization scheme for coprahas operated on this basis since its inception. But thegovernment has changed the cocoa and coffee schemesand plans to change the one for copra soon.
Two problems caused the government to rethink itscocoa policy. First, world prices remained far aboveminimum prices and it became apparent that thoughthe farmers had a guaranteed minimum price, it wasrarely effective; the scheme in effect taxed them bydepressing the average price they received. Second,the cost of production proved to be a dubious criterionfor setting the support price because the cost varieswidely among farms and because such a system inter-feres too greatly with market signals. If the floor pricewere set low, it would discourage the efficient devel-opment of the industry; if it were set too high, thegovernment would run into financing problems andend up supporting an industry of uneconomicallylarge size. The government therefore decided to gearthe price-stabilization scheme more closely to worldprices. This was done by shifting the target price froma level based on the cost of production to a ten-yearmoving average of world prices, adjusted for inflation.A new program was set up in which farmers received asubsidy or had to pay a tax equal to half the differencebetween the ten-year average and the world price. Pro-
nopolies which pay low prices for domesticallyproduced food crops, and through sales at lowprices of imported food.
As seen in Chapter 4, these measures depressfood production and can be very costly if main-tained over long periods. An alternative is to shiftthe burden of food subsidies to the general tax-payer. Governments can then raise farm prices anduse budget revenues to subsidize consumer prices.However, when the difference between the highproducer price and the low consumer price be-comes sufficiently large, it is difficult to prevent thesubsidized commodity from being sold back to thegovernment at the higher producer price. In thiscase, subsidies may be needed on processed com-modities. This is not always feasible. Even when itis, efficiency losses will still be implicit in consumersubsidy programs. While these losses may be morewidely dispersed throughout the economy, they
ducer price fluctuations thus split the difference be-tween fast-changing world prices and slower changesin the moving average.
This scheme has three advantages. First, since theCocoa Board regulates the price only by taxing or sub-sidizing the export price, it does not need to get di-rectly involved in the buying or selling of the crop. Thesubsidies and taxes are passed on through private trad-ers. Second, it avoids some of the fiscal and monetarydrawbacks of other schemes. The buffer fund based onthe tax subsidy system is self-financing, so it does notdestabilize the government's spending plans. Third,the cocoa program does not require physical stockpil-ing.
The Coffee Industry Board operates its buffer fundsomewhat differently because it has an additional roleto fulfill. Papua New Guinea is a member of the Inter-national Coffee Organization (ICO) and must controlexports to ICO consumer countries in accordance withthe ICO's quota system. If domestic production ex-ceeds Papua New Guinea's quota (plus any sales tonon-ICO consumer countries), the difference is held indomestic stocks financed by the fund. The fund, there-fore, needs sufficient resources to finance stockholdingfor several years. If funds get too low, no subsidies arepaid whatever the world price. Otherwise, the coffeescheme is similar to that for cocoa: whenever the worldprice falls below 90 percent of its ten-year average, asubsidy is paid equal to half the difference between thetwo prices, and whenever the price rises above its ten-year average, a tax is levied equal to half the difference.
do not disappearespecially when, as shown inFigure 5.1, consumer subsidy programs accountfor large shares of government expenditures.
Food subsidy programs have other costs. Officialpricing systems usually respond slowly, if at all, tochanging market conditions. Price changes, whichhappen continuously in free markets, usually re-quire complicated bureaucratic procedures andconsultations. Sudden changes in market condi-tions can result in rapid increases in budgetarycosts. The high world prices of 1972-74 had a dra-matic impact upon the food subsidy budgets ofBangladesh, Korea, Morocco, Pakistan, Sri Lanka,and Tanzania. The stability of official prices wasachieved at the cost of instability elsewhere: in thefiscal deficit or in the balance of payments as thesubsidy burdens shifted to other activities compet-ing for foreign exchange.
Some of the costs of food subsidy programs be-
91
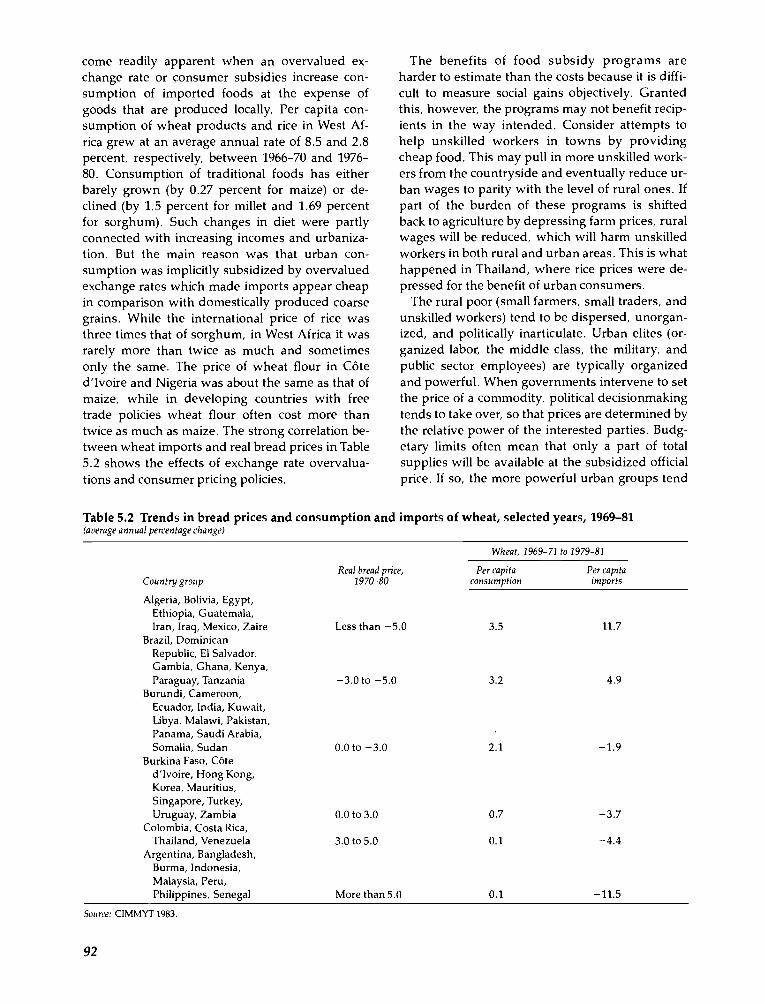
come readily apparent when an overvalued ex-change rate or consumer subsidies increase con-sumption of imported foods at the expense ofgoods that are produced locally. Per capita con-sumption of wheat products and rice in West Af-rica grew at an average annual rate of 8.5 and 2.8percent, respectively, between 1966-70 and 1976-80. Consumption of traditional foods has eitherbarely grown (by 0.27 percent for maize) or de-clined (by 1.5 percent for millet and 1.69 percentfor sorghum). Such changes in diet were partlyconnected with increasing incomes and urbaniza-tion. But the main reason was that urban con-sumption was implicitly subsidized by overvaluedexchange rates which made imports appear cheapin comparison with domestically produced coarsegrains. While the international price of rice wasthree times that of sorghum, in West Africa it wasrarely more than twice as much and sometimesonly the same. The price of wheat flour in Côted'Ivoire and Nigeria was about the same as that ofmaize, while in developing countries with freetrade policies wheat flour often cost more thantwice as much as maize. The strong correlation be-tween wheat imports and real bread prices in Table5.2 shows the effects of exchange rate overvalua-tions and consumer pricing policies.
Table 5.2 Trends in bread prices and consumption and imports of wheat, selected years, 1969-81
Source: CIMMYT 1983.
92
The benefits of food subsidy programs areharder to estimate than the costs because it is diffi-cult to measure social gains objectively. Grantedthis, however, the programs may not benefit recip-ients in the way intended. Consider attempts tohelp unskilled workers in towns by providingcheap food. This may pull in more unskilled work-ers from the countryside and eventually reduce ur-ban wages to parity with the level of rural ones. Ifpart of the burden of these programs is shiftedback to agriculture by depressing farm prices, ruralwages will be reduced, which will harm unskilledworkers in both rural and urban areas. This is whathappened in Thailand, where rice prices were de-pressed for the benefit of urban consumers.
The rural poor (small farmers, small traders, andunskilled workers) tend to be dispersed, unorgan-ized, and politically inarticulate. Urban elites (or-ganized labor, the middle class, the military, andpublic sector employees) are typically organizedand powerful. When governments intervene to setthe price of a commodity, political decisionmakingtends to take over, so that prices are determined bythe relative power of the interested parties. Budg-etary limits often mean that only a part of totalsupplies will be available at the subsidized officialprice. If so, the more powerful urban groups tend
(average annual percentage change)
Count ry groupReal bread price,
1970-80
Wheat, 1969-71 to 1979-81
Per capitaconsumption
Per capitaimports
Algeria, Bolivia, Egypt,Ethiopia, Guatemala,Iran, Iraq, Mexico, Zaire Less than -5.0 3.5 11.7
Brazil, DominicanRepublic, El Salvador,Gambia, Ghana, Kenya,Paraguay, Tanzania -3.0 to -5.0 3.2 4.9
Burundi, Cameroon,Ecuador, India, Kuwait,Libya, Malawi, Pakistan,Panama, Saudi Arabia,Somalia, Sudan 0.0 to -3.0 2.1 -1.9
Burkina Faso, Côted'Ivoire, Hong Kong,Korea, Mauritius,Singapore, Turkey,Uruguay, Zambia 0.0 to 3.0 0.7 -3.7
Colombia, Costa Rica,Thailand, Venezuela 3.0 to 5.0 0.1 -4.4
Argentina, Bangladesh,Burma, Indonesia,Malaysia, Peru,Philippines, Senegal More than 5.0 0.1 -11.5
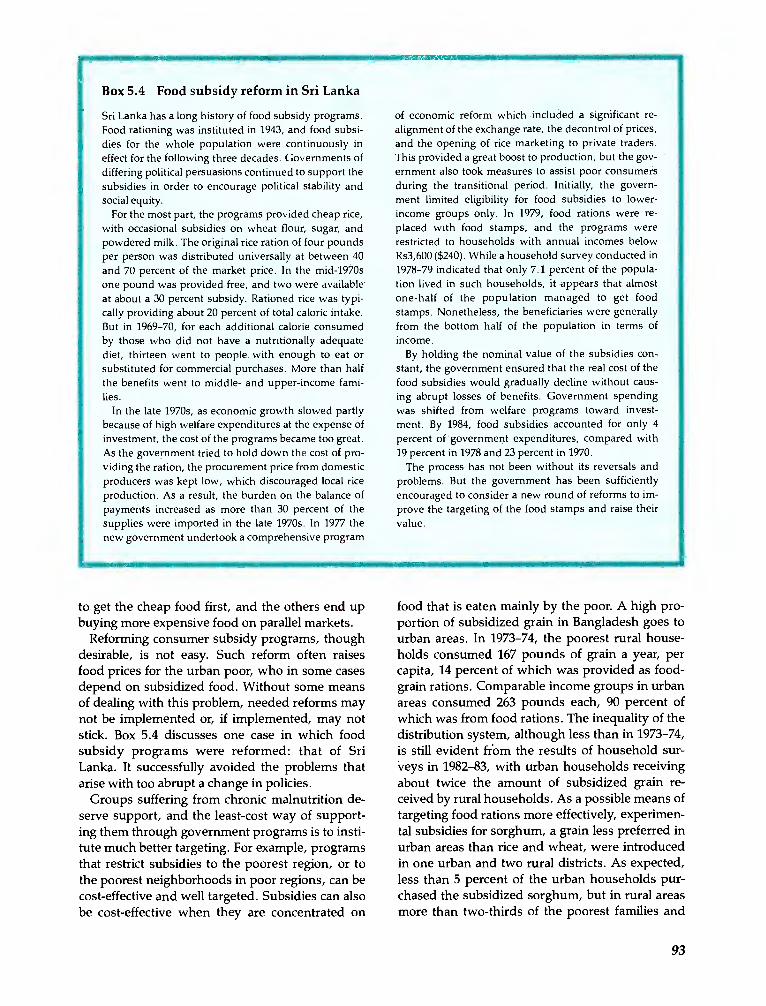
Box 5.4 Food subsidy reform in Sri Lanka
Sri Lanka has a long history of food subsidy programs.Food rationing was instituted in 1943, and food subsi-dies for the whole population were continuously ineffect for the following three decades. Governments ofdiffering political persuasions continued to support thesubsidies in order to encourage political stability andsocial equity.
For the most part, the programs provided cheap rice,with occasional subsidies on wheat flour, sugar, andpowdered milk. The original rice ration of four poundsper person was distributed universally at between 40and 70 percent of the market price. In the mid-1970sone pound was provided free, and two were availableat about a 30 percent subsidy. Rationed rice was typi-cally providing about 20 percent of total caloric intake.But in [969-70, for each additional calorie consumedby those who did not have a nutritionally adequatediet, thirteen went to people with enough to eat orsubstituted for commercial purchases. More than halfthe benefits went to middle- and upper-income fami-lies.
In the late 1970s, as economic growth slowed partlybecause of high welfare expenditures at the expense ofinvestment, the cost of the programs became too great.As the government tried to hold down the cost of pro-viding the ration, the procurement price from domesticproducers was kept low, which discouraged local riceproduction. As a result, the burden on the balance ofpayments increased as more than 30 percent of thesupplies were imported in the late 1970s. In 1977 thenew government undertook a comprehensive program
of economic reform which included a significant re-alignment of the exchange rate, the decontrol of prices,and the opening of rice marketing to private traders.This provided a great boost to production, but the gov-ernment also took measures to assist poor consumersduring the transitional period. Initially, the govern-ment limited eligibility for food subsidies to lower-income groups only. In 1979, food rations were re-placed with food stamps, and the programs wererestricted to households with annual incomes belowRs3,600 ($240). While a household survey conducted in1978-79 indicated that only 7.1 percent of the popula-tion lived in such households, it appears that almostone-half of the population managed to get foodstamps. Nonetheless, the beneficiaries were generallyfrom the bottom half of the population in terms ofincome.
By holding the nominal value of the subsidies con-stant, the government ensured that the real cost of thefood subsidies would gradually decline without caus-ing abrupt losses of benefits. Government spendingwas shifted from welfare programs toward invest-ment. By 1984, food subsidies accounted for only 4percent of government expenditures, compared with19 percent in 1978 and 23 percent in 1970.
The process has not been without its reversals andproblems. But the government has been sufficientlyencouraged to consider a new round of reforms to im-prove the targeting of the food stamps and raise theirvalue.
to get the cheap food first, and the others end upbuying more expensive food on parallel markets.
Reforming consumer subsidy programs, thoughdesirable, is not easy. Such reform often raisesfood prices for the urban poor, who in some casesdepend on subsidized food. Without some meansof dealing with this problem, needed reforms maynot be implemented or, if implemented, may notstick. Box 5.4 discusses one case in which foodsubsidy programs were reformed: that of SriLanka. It successfully avoided the problems thatarise with too abrupt a change in policies.
Groups suffering from chronic malnutrition de-serve support, and the least-cost way of support-ing them through government programs is to insti-tute much better targeting. For example, programsthat restrict subsidies to the poorest region, or tothe poorest neighborhoods in poor regions, can becost-effective and well targeted. Subsidies can alsobe cost-effective when they are concentrated on
food that is eaten mainly by the poor. A high pro-portion of subsidized grain in Bangladesh goes tourban areas. In 1973-74, the poorest rural house-holds consumed 167 pounds of grain a year, percapita, 14 percent of which was provided as food-grain rations. Comparable income groups in urbanareas consumed 263 pounds each, 90 percent ofwhich was from food rations. The inequality of thedistribution system, although less than in 1973-74,is still evident from the results of household sur-veys in 1982-83, with urban households receivingabout twice the amount of subsidized grain re-ceived by rural households. As a possible means oftargeting food rations more effectively, experimen-tal subsidies for sorghum, a grain less preferred inurban areas than rice and wheat, were introducedin one urban and two rural districts. As expected,less than 5 percent of the urban households pur-chased the subsidized sorghum, but in rural areasmore than two-thirds of the poorest families and
93

more than half of the lower-middle-income house-holds bought it.
In Brazil, subsidies on cassava are likely to bemore effective in helping the poor than subsidieson rice, bread, or maize. One study shows that adollar of subsidy for cassava would generate 60C inbenefits to low-income groups compared with 40Cfor maize, 23C for rice, and 18C for bread. Whilesubsidies for sorghum or cassava may be a cost-effective way of helping the poor, they raise somepotential problems. Many of the poorest people'sfoods are also used for animal feed. Subsidies in-tended to lower food costs for the poor may alsolower production costs for livestock, and this, ineffect, subsidizes the rich. Diversion of low-costfood to livestock feed has been a problem in bothEgypt and Zimbabwe. Even if it happens on asmall scale only, it is hard to generate net benefitsfrom broadly based food subsidies once the admin-istrative and distortionary costs of raising the nec-essary revenue are fully accounted for.
Many of these problems do not arise if subsidiesare narrowly targeted to support nutritionally vul-nerable groups, such as pregnant and nursingwomen, the very young, the sick, the very old, orthe handicapped. Many governments have pro-vided incentives for such schemes by offering tax
94
Box 5.5 Targeting economic assistance in Tamil Nadu, India
A successful project for helping nutritionally vulnera-ble children and mothers is now under way in TamilNadu in South India. A survey carried out by the stategovernment in the early 1970s showed that half of ruralfamilies consumed less than 80 percent of their dailycaloric needs. Approximately 50 percent of childrenbetween one and four years of age were classified asmalnourished; 45-50 percent of child deaths were adirect consequence of malnutrition. The cost of treat-ing nutrition-related diseases was around $5.5 milliona year, or nearly one-third of the annual state expendi-ture for medical services. The government set out toimprove this situation, especially for children underthree years old. By 1980, twenty-five nutrition andfeeding programs were operating at a total Cost of $8.8million. But their impact was less than it could havebeen, because they were not sufficiently targeted andwere not monitored properly.
In 1980 the government initiated a five-year projectto combat and prevent malnutrition and to promotehealth. It provides nutrition and health care for chil-dren six to thirty-six months of age and for pregnantand lactating women. A special team of local commu-
advantages to nongovernment organizations. Di-rect government spending on well-defined targetgroups is also justified. The World Bank is sup-porting one such effort in Tamil Nadu, India, andthe results look promising (see Box 5.5).
Producer support programs
Much of the growth in agricultural production inmany developing countries is attributable to theexpansion in irrigation (see Chapter 1). Between1950 and 1983 the area under irrigation in develop-ing countries more than doubled. Even though therate of growth has slowed, about 3.2 million hect-ares are still being brought under irrigation eachyear, with Asia accounting for more than 40 per-cent of the growth. In parallel with this growth inirrigation, but not solely due to it, the use of suchmodern inputs as chemical fertilizers and machin-ery has also grown rapidly.
To bring about increased use of these inputs andof credit, governments in developing countrieshave generally followed a policy of subsidizingfarm inputs. Increasing production has not beenthe only objectiveimproving the distribution ofincome in rural areas has also been important. Butinput and credit subsidy programs have run into
nity nutrition workers was trained to take the programinto their villages, and they are supported in theirwork by women's working groups, averaging twenty-five women in each village. Children are weighed ev-ery month to determine how fast they are gainingweight. Those who are gaining weight too slowly areenrolled in a special ninety-day program in which theyare fed daily in community centers. Their mothers arecounseled on how to recognize early signs of malnutri-tion and what to do about it. Severely malnourishedchildren receive double rations. Complementaryhealth services are also provided. Prenatal health careis routinely available to pregnant women; mothers inspecial need get extra food to take home. Nutrition andhealth education are a crucial part of the project. Thisapproach, by employing a sensitive but practicalgrowth surveillance system to identify children whoare nutritionally at risk, allows supplementary feedingto be highly selective and short-termtwo featuresthat enhance cost effectiveness and avoid long-termdependence on food assistance.
The project is now working in 9,000 villages of TamilNadu, benefiting around one million children and
many problems, including the large cost to thebudget. This raises the question of whether itwould not be better to eliminate or greatly moder-ate subsidies and use the resources thus saved forother purposes, such as reducing taxes on farmoutputs. The main problems and issues that tendto arise in practice with input and credit subsidiesare reviewed below.
Fertilizer subsidies
In many countries subsidies cover the whole rangeof inputsfrom plows to pesticides. But fertilizersubsidies are very common. Rates of subsidy forfertilizers in the early 1980s were rarely below 30percent of delivered cost and were in some cases80 to 90 percent (in Nigeria, for example). Rates of50 to 70 percent are common. In Saudi Arabia andVenezuela, farmers pay half the ex-factory orlanded cost; urea is sold at 56 percent below cost inSri Lanka and at 60 percent below cost in Gambia.
There has always been some skepticism aboutthe usefulness of subsidies on fertilizers (or otherinputs). Until about the mid-1970s, it was com-monly thought that, while there might be somejustification for temporary subsidies, longer-termsubsidies would result in nonoptimal input use
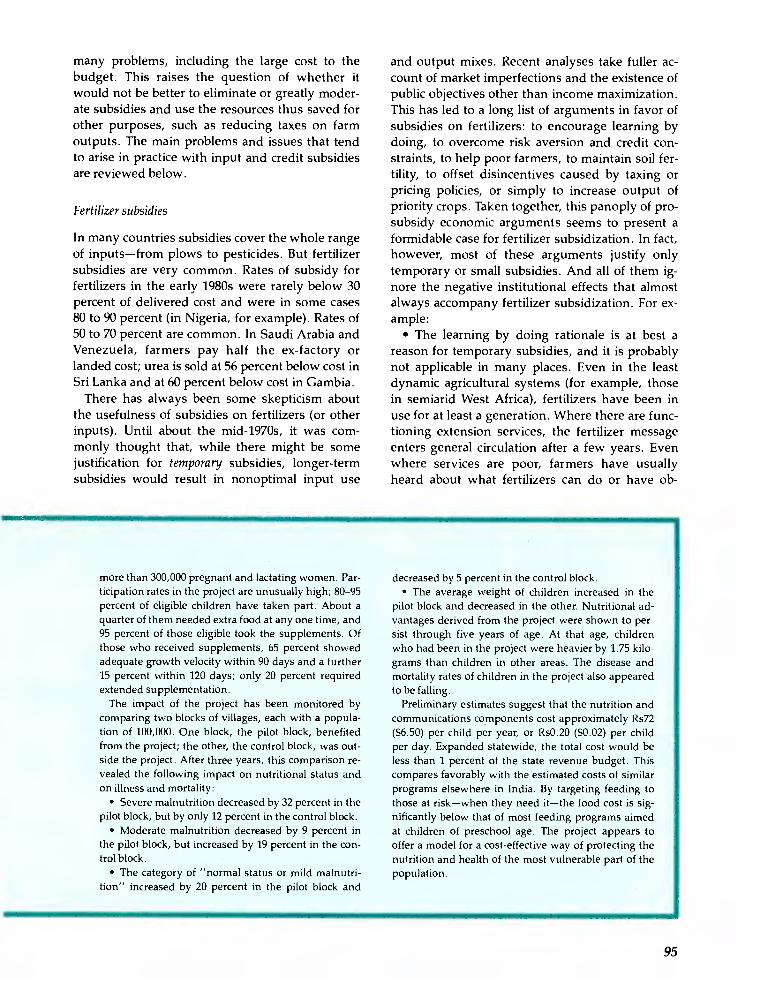
more than 300,000 pregnant and lactating women. Par-ticipation rates in the project are unusually high; 80-95percent of eligible children have taken part. About aquarter of them needed extra food at any one time, and95 percent of those eligible took the supplements. Ofthose who received supplements, 65 percent showedadequate growth velocity within 90 days and a further15 percent within 120 days; only 20 percent requiredextended supplementation.
The impact of the project has been monitored bycomparing two blocks of villages, each with a popula-tion of 100,000. One block, the pilot block, benefitedfrom the project; the other, the control block, was out-side the project. After three years, this comparison re-vealed the following impact on nutritional status andon illness and mortality:
Severe malnutrition decreased by 32 percent in thepilot block, but by only 12 percent in the control block.
Moderate malnutrition decreased by 9 percent inthe pilot block, but increased by 19 percent in the con-trol block.
The category of "normal status or mild malnutri-tion" increased by 20 percent in the pilot block and
and output mixes. Recent analyses take fuller ac-count of market imperfections and the existence ofpublic objectives other than income maximization.This has led to a long list of arguments in favor ofsubsidies on fertilizers: to encourage learning bydoing, to overcome risk aversion and credit con-straints, to help poor farmers, to maintain soil fer-tility, to offset disincentives caused by taxing orpricing policies, or simply to increase output ofpriority crops. Taken together, this panoply of pro-subsidy economic arguments seems to present aformidable case for fertilizer subsidization. In fact,however, most of these arguments justify onlytemporary or small subsidies. And all of them ig-nore the negative institutional effects that almostalways accompany fertilizer subsidization. For ex-ample:
The learning by doing rationale is at best areason for temporary subsidies, and it is probablynot applicable in many places. Even in the leastdynamic agricultural systems (for example, thosein semiarid West Africa), fertilizers have been inuse for at least a generation. Where there are func-tioning extension services, the fertilizer messageenters general circulation after a few years. Evenwhere services are poor, farmers have usuallyheard about what fertilizers can do or have ob-
decreased by 5 percent in the control block.The average weight of children increased in the
pilot block and decreased in the other. Nutritional ad-vantages derived from the project were shown to per-sist through five years of age. At that age, childrenwho had been in the project were heavier by 1.75 kilo-grams than children in other areas. The disease andmortality rates of children in the project also appearedto be falling.
Preliminary estimates suggest that the nutrition andcommunications components cost approximately Rs72($6.50) per child per year, or RsO.20 ($0.02) per childper day. Expanded statewide, the total cost would beless than 1 percent of the state revenue budget. Thiscompares favorably with the estimated costs of similarprograms elsewhere in India. By targeting feeding tothose at riskwhen they need itthe food cost is sig-nificantly below that of most feeding programs aimedat children of preschool age. The project appears tooffer a model for a cost-effective way of protecting thenutrition and health of the most vulnerable part of thepopulation.
95

served their effects on nearby farms.Risk aversion, which leads farmers to use less
than profit-maximizing levels of fertilizers, mayjustify a little subsidization in some regions but notmuch. Moreover, fertilizer use need not involvesubstantial increases in risk; for example, farmersapply top dressings of urea only after they are surethe crop is established. The impact of risk aver-sion, judged by the difference between how muchfertilizer should be used and actual levels of use, issmall. A World Bank study suggests that evenwhen farmers are strongly risk averse, their fertil-izer use will be at most 15 percent less than itwould be if they were trying to maximize profits.
Credit constraints arise out of capital marketimperfections such as inadequate informationflows, high transaction costs, and requirements forcollateral. As a general rule it is better to eliminatethe source of a problem than to compensate for it.The long-term solution for imperfection in ruralcredit markets lies in improving the operation ofcredit markets, not in subsidizing other inputs.
The income distribution argument involvesmany empirical questions concerning the nature ofdemand for fertilizers across households classifiedby income level and the adequacy and equity ofthe rationing systems that often accompany subsi-dized input distribution. A study of fertilizer use inSenegal revealed that the benefits of subsidizationwent mostly to better-off farmersthose in better-watered areas. This is true more generally: thosefarmers benefiting most from irrigation also benefitmost from fertilizer subsidies, and they often tendto be better-off farmers.
The soil-enrichment and conservation argu-ments in favor of fertilizer subsidies do not standup under close analysis. There may be a case for atemporary subsidy where population growth hasaccelerated and farmers may not learn about fertil-izers fast enough to prevent severe damage to soilquality. But in the most vulnerable areasthesemiarid tropicswhat is most often needed is theadoption of less expensive and better adapted or-ganic fertilizers and the use of moisture-retainingmethods, such as ridging to prevent rainfall run-off. Neither of these is encouraged by the existenceof fertilizer subsidies, and such subsidies actuallydiscourage the use of organic fertilizers. Moreover,there is some evidence that sustained use of chem-ical fertilizers can actually reduce fertility. InBurkina Faso, for example, sorghum yields de-clined after seven years of chemical fertilization, asa result of soil acidification, potassium deficiencies,and aluminum toxicity. Only by combining large
96
applications of animal manure with chemical fertil-izers was soil fertility maintained or improved.
Apart from the foregoing considerations, specialarguments are often put forward to encourage fer-tilizer subsidy policies. It is often thought that fer-tilizer subsidies are needed as a part of a fiscalpackage to minimize the efficiency cost of raising agiven amount of revenue from farmers. If a gov-ernment wants to tax smaliholders and the onlyfeasible method is a tax on their marketed surplus,the best way to raise a given amount of revenuemay sometimes involve subsidizing fertilizers toboost production and the volume of marketed sur-plus. Such an argument needs to be treated withcaution. First, the revenue targets should be exam-ined carefully rather than taken for granted. Sec-ond, the subsidy and tax rates may change radi-cally over time, so that rapid policy changes will berequired. Third, it assumes that subsidizing fertil-izers can offset the negative production responseto low producer pricesan assumption that isquestionable at best. Even when a subsidy can bejustified in special cases, the large and indiscrimi-nate subsidies often seen in practice are not war-ranted.
Fertilizer subsidies are typically providedthrough public distribution systems. Apart fromthe inefficiencies that may be entailed in these sys-tems, the distribution policies discourage potentialprivate suppliers, such as traders, shopkeepers,transporters, local artisans, and large farmers. Themost significant long-term cost of subsidy pro-grams may indeed lie in the obstacles they put inthe way of private suppliers, whose services areessential to transforming backward farm econo-mies. Some of the problems that arise with publicmonopolies of fertilizer distribution are:
Fertilizers marketed by the public sector oftenarrive too late to be used to maximum effect. Thereasons for late delivery vary from country tocountry, but some are often inherent in public sec-tor marketing itself. The agency involved may notknow what its budget is until relatively late in thecrop cycle. Where there is a central tenderingagency for all goiernment purchases, the processis time-consuming. Distributing fertilizer in smallquantities to widely dispersed farmers can be ex-tremely demanding. Where the public sector dom-inates the transport system, the task often strainsits capacity.
Government suppliers offer few varieties offertilizer, although particular crops or soils needparticular kinds of nutrient. Governments oftencharge all users the same price, whatever their lo-

cations. They offer very few alternatives in nutri-ent mix. In Cameroon, for example, only threetypes of fertilizer were imported in the early 1980s:ammonium sulfate, NPK 20-10-10, and urea. Butspecific crops and specific regions (soils) havemore finely defined needs. The "shotgun-type"approach nonetheless provides NPK 20-10-10,say, for both coffee and maize, in humid forestzones and semiarid regions. In much of the Sahel,the fertilizer mix most commonly recommendedfor millet and sorghum is based on the availablecotton complex fertilizer. Some indication of thelevel of waste involved in these unrefined ap-proaches is found in a study in Senegal that com-pared optimal nutrient requirements with the stan-dard compound fertilizer. The study indicated thatabout 20 percent of the cost of fertilizer could havebeen saved with no negative effects on physicalproductivity. And this does not take account of thefull gains possible from the use of more variedcombinations of nutrients.
In many cases all of farmers' demand cannotbe met at subsidized prices. This leads to ration-ing. Who gets how much fertilizer then dependson the rationing process. Typically, the allocationprocess favors the bigger farmers and thus negateswhatever equity benefits might otherwise have ac-crued.
The rationing process also leads to erratic fluc-tuations in the actual cost of obtaining fertilizers,and this hinders the learning process. Even whenfarmers do learn the best uses of fertilizers, thefeedback to public agencies is often slow and im-perfect. For example, in Burkina Faso the exten-sion services continue to recommend that com-pound fertilizers devised for cotton also be usedfor millet and sorghum, despite evidence that thelong-term effects on yield are likely to be negative.
The difficulties discussed above also arise in thecase of pesticides. Subsidies on pesticides can radi-cally change the relative profitability of chemical-intensive as opposed to labor-intensive controlprograms for pests. For example, it has beenshown that pests in cotton fields in Egypt can becontrolled by (a) choosing planting times thatavoid peak pest seasons, (b) adding fuel oil to theirrigation water on the preceding crop, (c) hand-picking egg masses from cotton plants, (d) care-fully monitoring insect infestations to guide thetiming and extent of chemical spraying, and (e)burning infested boils at the end of the season.Rice farmers in South China have also reducedtheir use of pesticides by adopting pest-resistantvarieties, raising insect-eating ducks in paddy
fields, releasing predatory insects and bacterialpathogens, and carefully monitoring pest popula-tions. These techniques substitute labor and otherinputs for chemical inputs. Heavy subsidies onpesticides geared to encouraging pest control canhave costly and unanticipated impacts on thechoice of techniques used to accomplish this goal.Especially in labor-abundant countries, it may beawaste of resources to encourage the substitution ofchemical pesticides for human labor.
Mechanization subsidies
Many developing countries promote agriculturalmechanization. Very large implicit subsidies arisewhen overvalued foreign exchange rates are com-bined with preferential allocation of rationed for-eign exchange for mechanical inputs, a policy pur-sued at one time or another by countries as diverseas Colombia, Egypt, India, and Pakistan. Often,farm machinery receives preferential tariff treat-ment compared with what a uniform revenue tariffon all agricultural and industrial inputs would war-rant. In Colombia in the early 1960s, for example,the 2 percent import duty and the 3 percent salestax on imported tractors were small in relation tothe degree of overvaluation of the currency, whilein Peru the import duty on tractors, at 20 percent,was still lower than the average tariff on importsand far below the percentage by which the cur-rency was realigned in 1967. In some cases agricul-tural income tax provisions provide another sub-sidy by allowing farm machinery to be used as atax shelter. This is most often done via accelerateddepreciation provisions. An extreme example ofsuch a tax shelter is found in the income tax codeof Brazil: it allows for a deduction from farm in-comes of six times the value of the machine in thefirst year, thus generating tax losses wheneverlarge machinery purchases are made. Other farminvestments such as livestock are treated less fa-vorably, and, of course, labor costs enjoy no pref-erential tax treatment at all.
The benefits of subsidies are typically confined tolarge farms and to regions with favorable climatesand good infrastructure. The subsidies provide thewealthy rural population with a competitive ad-vantage at the expense of poorer groups. For ex-ample, in Brazil, as industrialization took place inthe state of São Paulo, labor was drained from ru-ral areas to meet the growing demand for urbanlabor. In the face of rural labor scarcities, the de-gree of mechanization would have been limited bymigration of labor from the northeast. However,
97

the government provided large subsidies in an ef-fort to build a farm machinery industry and elimi-nated payments in kind to labor; this deterred theuse of labor and enabled the southern region tocompete in the production of sugarcane by neu-tralizing the northeast's advantage of lower laborcosts. While sugarcane became profitable in thesouth, resources were diverted from other cropsthat had a higher international value.
There is typically no economic justification formachinery subsidies. This is not to say that mecha-nization cannot be profitableit can be whenwages are high or when the nature of the opera-tion makes it especially advantageous (for exam-ple, irrigation pumps). When it is profitable,farmers can afford iteven small farmers can ben-efit by using machinery rental markets.
Credit subsidies
In almost all developing countries, governmentshave special programs for providing credit tofarmers, generally at low interest rates. Subsidizedcredit programs usually have harmful side effectson financial institutions, rural financial markets,and the wider economy.
Many of the problems encountered in practiceresult from the pursuit of two inconsistent objec-tives: promotion of efficient production and theprovision of income transfers to the poor. As willbe seen below, credit is an ineffective instrumentfor bringing about income transfers to the poor. Asfor the production objective, credit does not byitself promote productivity increasesall it does isprovide opportunities that farmers can take advan-tage of. If less productive opportunities are ex-ploited by farmers before more productive ones,something else is wrongwhich is where attentionshould focus. Credit policy should not be seen asan instrument for offsetting distortions elsewherewhich cause resource misallocations.
Credit policy is often motivated by the belief thatsmall farmers are unable to obtain loans because ofinadequate collateral despite their ability to repay:that is, private credit institutions overestimate therisks of lending to small farmers. If this were so, itwould be quite inappropriate to force lenders tomake such loans at highly subsidized rates. A bet-ter policy would be to subsidize credit institutions,rather than farmers, to induce them to take thehigher risks of lending to small farmers. Thiswould provide an incentive to collect informationabout the previously ignored borrowers and theirinvestment opportunities.
98
Box 5.6 Credit subsidies in Brazil
Credit subsidies and controls have had a great impacton rural financial markets in Brazil. During the 1970sthe level of credit subsidies increased rapidly. This waspartly unintentional, as credit contracts were set innominal terms and actual inflation exceeded projectedrates.
Between 1969 and 1976 the annual value of ruralcredit disbursed increased by four and one-half timesin real terms, while value added in agriculture roughlydoubled. It is not clear that this credit was always usedfor the intended purposes. In fact, since agriculturalcredit in 1975-78 reached levels equal to total valueadded in agriculture, substantial amounts must havebeen diverted to other purposes. The diversion ofcredit is also indicated by many instances in which thetotal area for which farmers got subsidized credit for aparticular crop was larger than the area actually har-vested for that crop. This is all the more remarkablesince only a minority of farmers received any subsi-dized credit at all. The 1975 census indicated that therewere approximately 5 million farms, while in 1976there were only 1.8 million credit contracts, and mostfarmers using credit take more than one contract. TheAssociation of Development Banks estimated that 23percent of agricultural credit was diverted to other pur-poses.
There are doubts about whether any significant netbenefits were obtained from the credit subsidies, evenwithin the small part of agriculture covered by these
INCOME DISTRIBUTION AND CREDIT. Rich farmershave few problems in gaining access to credit. It isthe poor farmers who face credit constraints, espe-cially if they do not have well-established claims totheir land. Even if credit is available to them, itoften seems excessively costly.
It is difficult to channel low-interest credit tolow-income groups. Low interest rates stimulateheavy demand for loans when resources are lim-ited. Excess demand for credit is therefore com-mon (Box 5.6 provides an illustration from Brazil).Some form of rationing has to be introduced, im-plying an increase in the effective cost of creditabove that suggested by the subsidized interestrate. The increase in effective rates can take severalforms. It can be shifted from the lender to the bor-rower by requiring more documentation, extratrips to town, or more queuing. Or it can be re-flected by requiring borrowers to hold compensat-ing balances or to provide extra collateral. Low-income farmers tend to be excluded by the
programs. Since land provides a basis for access tocredit subsidies, land values increased rapidly. Elabo-rate regulations were instituted to limit the diversion ofsubsidized credit. The tying up of entrepreneurial andprofessional time and talent in working through thecredit maze may have been one of the most Importantcosts of these policies.
The problem of credit diversion means that it is ex-ceedingly difficult to assess the impact of credit, posi-tive or negative, on farm activities. There is some evi-dence that excessive mechanization and fertilizer usewere encouraged by the credit subsidies, but there isno clear empirical evidence to suggest that credit subsi-dies have increased production or yields. It is alsodoubtful that the subsidy programs have benefitedlow-income farmers, despite an intended bias in favorof the low-income northeast and smallholders. Thehigher administrative costs of lending to large num-bers of small farmers were a disincentive to the banks.
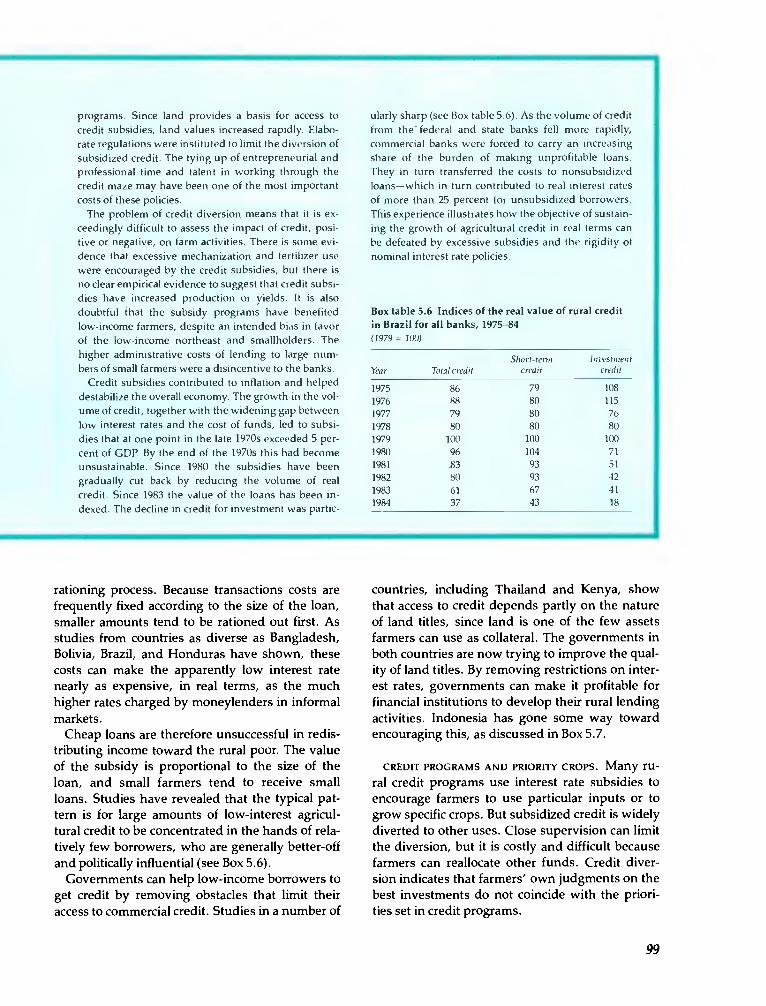
Credit subsidies contributed to inflation and helpeddestabilize the overall economy. The growth in the vol-ume of credit, together with the widening gap betweenlow interest rates and the cost of funds, led to subsi-dies that at one point in the late 1970s exceeded 5 per-cent of GDP. By the end of the 1970s this had becomeunsustainable. Since 1980 the subsidies have beengradually cut back by reducing the volume of realcredit. Since 1983 the value of the loans has been in-dexed. The decline in credit for investment was partic-
rationing process. Because transactions costs arefrequently fixed according to the size of the loan,smaller amounts tend to be rationed out first. Asstudies from countries as diverse as Bangladesh,Bolivia, Brazil, and Honduras have shown, thesecosts can make the apparently low interest ratenearly as expensive, in real terms, as the muchhigher rates charged by moneylenders in informalmarkets.
Cheap loans are therefore unsuccessful in redis-tributing income toward the rural poor. The valueof the subsidy is proportional to the size of theloan, and small farmers tend to receive smallloans. Studies have revealed that the typical pat-tern is for large amounts of low-interest agricul-tural credit to be concentrated in the hands of rela-tively few borrowers, who are generally better-offand politically influential (see Box 5.6).
Governments can help low-income borrowers toget credit by removing obstacles that limit theiraccess to commercial credit. Studies in a number of
ularly sharp (see Box table 5.6). As the volume of creditfrom the federal and state banks fell more rapidly,commercial banks were forced to carry an increasingshare of the burden of making unprofitable loans.They in turn transferred the costs to nonsubsidizedloanswhich in turn contributed to real interest ratesof more than 25 percent for unsubsidized borrowers.This experience illustrates how the objective of sustain-ing the growth of agricultural credit in real terms canbe defeated by excessive subsidies and the rigidity ofnominal interest rate policies.
Box table 5.6 Indices of the real value of rural creditin Brazil for all banks, 1975-84
countries, including Thailand and Kenya, showthat access to credit depends partly on the natureof land titles, since land is one of the few assetsfarmers can use as collateral. The governments inboth countries are now trying to improve the qual-ity of land titles. By removing restrictions on inter-est rates, governments can make it profitable forfinancial institutions to develop their rural lendingactivities. Indonesia has gone some way towardencouraging this, as discussed in Box 5.7.
CREDIT PROGRAMS AND PRIORITY CROPS. Many ru-
ral credit programs use interest rate subsidies toencourage farmers to use particular inputs or togrow specific crops. But subsidized credit is widelydiverted to other uses. Close supervision can limitthe diversion, but it is costly and difficult becausefarmers can reallocate other funds. Credit diver-sion indicates that farmers' own judgments on thebest investments do not coincide with the priori-ties set in credit programs.
99
(1979= lOW
Year Total creditShort-term
creditluz'estment
credit
1975 86 79 108
1976 88 80 115
1977 79 80 76
1978 80 80 80
1979 100 100 100
1980 96 104 71
1981 83 93 51
1982 80 93 42
1983 61 67 41
1984 37 43 18
Even if the diversion of credit could be con-trolled, credit subsidies may not be efficient waysto promote particular crops or techniques. Many ofthe benefits are offset by poor service and delays orwide swings in the availability of credit. By tyingcredit to particular inputs or crops, the programscan distort farmers' business decisions. If credit is
subsidized to fund the purchase of tractors, pre-mature mechanization can be encouraged.
When the policy environment is congenial andthe technologies profitable, the private sector per-forms well in providing inputs and credit. As mod-
ern technology spread through the Philippines,sales of farm inputs became more lucrative and
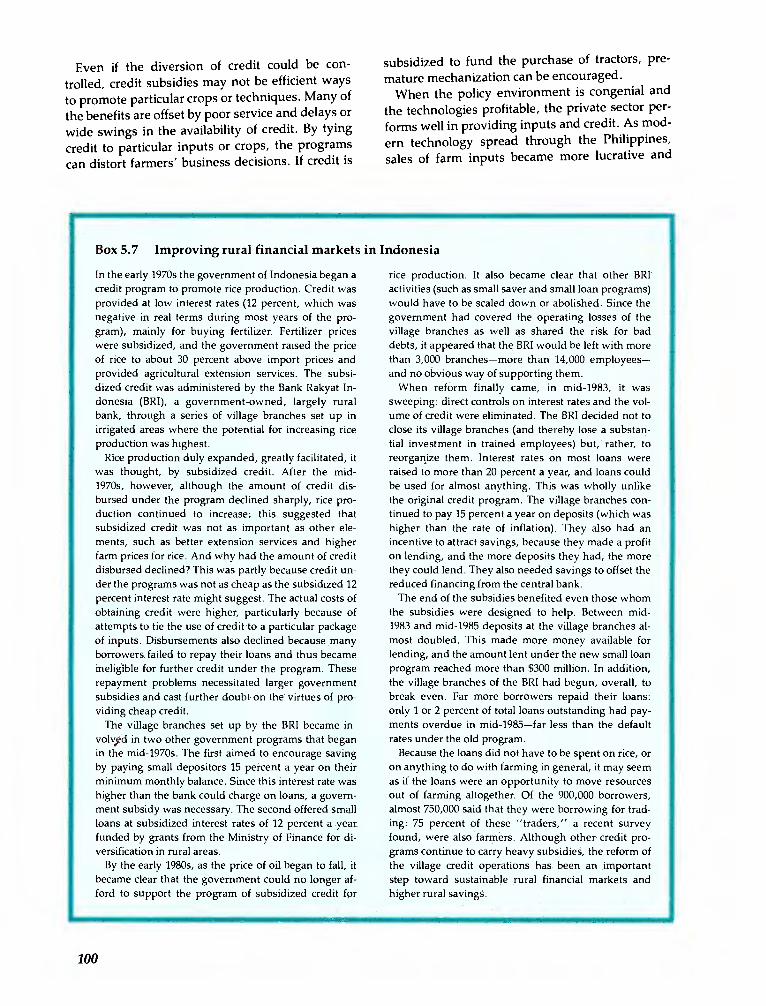
Box 5.7 Improving rural financial markets in Indonesia
In the early 1970s the government of Indonesia began acredit program to promote rice production. Credit wasprovided at low interest rates (12 percent, which wasnegative in real terms during most years of the pro-gram), mainly for buying fertilizer. Fertilizer priceswere subsidized, and the government raised the priceof rice to about 30 percent above import prices andprovided agricultural extension services. The subsi-dized credit was administered by the Bank Rakyat In-donesia (BRI), a government-owned, largely ruralbank, through a series of village branches set up inirrigated areas where the potential for increasing riceproduction was highest.
Rice production duly expanded, greatly facilitated, itwas thought, by subsidized credit. After the mid-1970s, however, although the amount of credit dis-bursed under the program declined sharply, rice pro-duction continued to increase; this suggested thatsubsidized credit was not as important as other ele-ments, such as better extension services and higherfarm prices for rice. And why had the amount of creditdisbursed declined? This was partly because credit un-der the programs was not as cheap as the subsidized 12percent interest rate might suggest. The actual costs ofobtaining credit were higher, particularly because ofattempts to tie the use of credit to a particular packageof inputs. Disbursements also declined because manyborrowers failed to repay their loans and thus becameinejigible for further credit under the program. Theserepayment problems necessitated larger governmentsubsidies and cast further doubt on the virtues of pro-viding cheap credit.
The village branches set up by the BRI became in-volvd in two other government programs that beganin the mid-1970s. The first aimed to encourage savingby paying small depositors 15 percent a year on theirminimum monthly balance. Since this interest rate washigher than the bank could charge on loans, a govern-ment subsidy was necessary. The second offered smallloans at subsidized interest rates of 12 percent a yearfunded by grants from the Ministry of Finance for di-versification in rural areas.
By the early 1980s, as the price of oil began to fall, itbecame clear that the government could no longer af-ford to support the program of subsidized credit for
rice production. It also became clear that other BRIactivities (such as small saver and small loan programs)would have to be scaled down or abolished. Since thegovernment had covered the operating losses of thevillage branches as well as shared the risk for baddebts, it appeared that the BRI would be left with morethan 3,000 branchesmore than 14,000 employeesand no obvious way of supporting them.
When reform finally came, in mid-1983, it wassweeping: direct controls on interest rates and the vol-ume of credit were eliminated. The BRI decided not toclose its village branches (and thereby lose a substan-tial investment in trained employees) but, rather, toreorganize them. Interest rates on most loans wereraised to more than 20 percent a year, and loans couldbe used for almost anything. This was wholly unlikethe original credit program. The village branches con-tinued to pay 15 percent a year on deposits (which washigher than the rate of inflation). They also had anincentive to attract savings, because they made a profiton lending, and the more deposits they had, the morethey could lend. They also needed savings to offset thereduced financing from the central bank.
The end of the subsidies benefited even those whomthe subsidies were designed to help. Between mid-1983 and mid-1985 deposits at the village branches al-most doubled. This made more money available forlending, and the amount lent under the new small loanprogram reached more than $300 million. In addition,the village branches of the BRI had begun, overall, tobreak even. Far more borrowers repaid their loans:only 1 or 2 percent of total loans outstanding had pay-ments overdue in mid-1985far less than the defaultrates under the old program.
Because the loans did not have to be spent on rice, oron anything to do with farming in general, it may seemas if the loans were an opportunity to move resourcesout of farming altogether. Of the 900,000 borrowers,almost 750,000 said that they were borrowing for trad-ing: 75 percent of these "traders," a recent surveyfound, were also farmers. Although other credit pro-grams continue to carry heavy subsidies, the reform ofthe village credit operations has been an importantstep toward sustainable rural financial markets andhigher rural savings.
100
attracted new entrants into the farm implementbusiness. This was not hampered by credit con-straints. Most of the new entrants were farmers,and they used credit to attract customers. Theycompeted profitably with formal credit schemes byoffering quick decisions and agreements adaptedto local circumstances. Some of these farmers evenallowed repayment in kind. In addition to tailoringrepayment terms to customer needs, they mini-mized the risk of default by taking the advice oflocal farmers in assessing credit risks, by takingstrict measures against defaulters, and by offeringcustomers a reliable and mutually profitable busi-ness association that was likely to yield additionalbenefits in the future. Repayment rates to villagebankers were much higher than to official lendinginstitutions, even though the same groups offarmers borrowed from both sources of credit.
EFFECTS ON FINANCIAL MARKETS. Subsidizedcredit affects both rural financial markets and thefiscal system. Where financial institutions are re-quired to allocate a fixed share of their lendingfunds to certain priority borrowers or sectors, thecost of the implicit subsidy must be recovered byincreasing the margins between the institution'scost of funds and its lending rates elsewhere. Bor-rowers who do not have priority will receive lesscredit and pay more for it, and depositors will getlower interest rates.
Fixing nominal interest rates for long periods oftimethe custom in most countriesmeans thatthe real interest rate varies with inflation. As thereal interest rate falls (or rises), rationing and col-lateral adjustments vary in ways that make it diffi-cult to judge how the effective cost of obtainingcredit varies to match supply and demand. Thus,governments lose control of the very instrumentthat they seek to use in meeting their credit policyobjectives. Furthermore, depending on themethod of financing used, attempts to increase thevolume of rural credit in real terms in periods ofinflation can add substantially to the rate of infla-tion or lead to very high real interest rates in othermarkets. Rural credit reforms should be combinedwith general financial sector reforms, and muchgreater emphasis should be given to flexible andmarket-related interest rates.
Subsidized credit operations also make it diffi-cult to encourage rural savings by increasing de-posit rates. Higher deposit rates increase the bud-get costs of the subsidy program. Also, a borrowertaking out a low-interest rate loan can simply de-posit the proceeds to earn a profit. Thus, credit
subsidies often go hand in hand with lower de-posit rates. The effects on rural savings can be veryimportant. If interest rates are below the rate ofinflation, savings rates are affected negatively.Some have argued that a negative interest ratedoes not deter rural savings because they believethat these savings do not respond sharply tohigher interest rates. But in India, where ruralbranches were opened primarily to disburse agri-cultural loans, deposits were so substantial owingto the availability of generally positive interestrates that some authorities were concerned aboutthe drain of funds from rural areas. The responsein India has also been repeated in many othercountries which have improved incentives to ruralsavings. In Japan, deposits taken since the early1920s by agricultural cooperatives have beengreater than the agricultural loans financed by thecooperatives and have contributed to the privatecapital flows discussed in Box 4.9 in Chapter 4.Savings in rural households rose rapidly in post-war Japan as rural incomes increased. Similarly, inKorea, interest rates on loans and deposits almostdoubled after 1965, resulting in real rates of morethan 8 percent. Average savings in farm house-holds rose rapidly by the mid-1970s. Sharply re-sponsive savings have been features of the re-formed village credit units established in Indonesia(see Box 5.7) and savings and loan programs devel-oped by coffee cooperatives in Kenya.
Program-specific incen five systems
Subsidies and taxes of various types often form apart of the packages of measures that governmentstake to promote the development of particular ar-eas and crops. Typically, these incentive systemsare designed to help achieve the immediate objec-tives of development programs: for example, toattract farmer participation and to induce farmersto choose inputs, crops, and other practices whichare judged necessary for their success.
A crucial aspect of the success of a promotionalprogram is its continued financial and economicviability after the initial period of years so that pub-lic assistance can be withdrawn or substantially re-duced. This requires not only that the farmers,traders, and others involved with program activi-ties start off with the right practices, but also thatthey have the incentive to revise their decisions ascircumstances change. And for long-term viability,the special incentives initially introduced need tobe gradually withdrawn. If a government agencyremains involved for a long period of time, it must
101

emphasize flexibility in decisionmaking and takeaccount of the broader ramifications of the variousmeasures taken to assist program participants.
TREE CROP DEVELOPMENT. Development pro-grams for tree crops illustrate some of the prob-lems that arise with heavily subsidized programs.Many governments encourage farmers to adoptnew tree crop varieties and modern technology byestablishing special agencies which set targets forthe amount of land to be replanted or newlyplanted with the crops. The agencies sometimesdemonstrate the new varieties or techniques forlimited areas and time. Where they do so, they donot disrupt markets, especially if beneficiaries re-pay the input costs. These projects can demon-strate the high returns of recommended activitiesto both farmers and potential suppliers of inputsand credit. They stimulate, rather than crowd out,the private sector.
But agencies can also intervene for the worse,especially if crop development activities are notlimited in time or coverage. Incentive systems in-troduced through the programs can have perverseeffects both within program areas and outside, and
102
Box 5.8 Rubber replanting programs in Thailand
For twenty-five years the government of Thailand hassupported schemes to encourage farmers to replantrubber trees. The main elements of this policy havebeen grants to farmers to cover about half the costs ofreplanting with high-yielding clonal varieties, a cess(tax) collected on exports of rubber to finance the re-planting program, and a separate export tax to raiserevenue for the government budget. Replanting grantsare disbursed over a six-year period under the supervi-sion of a replanting agency to make sure farmers fol-low recommended practices.
The replanting program in Thailand has two aims: toreplant large areas of low-yielding rubber with modernhigh-yielding varieties and to make farmers aware ofimproved technology. After a slow and somewhatshaky start in the 1960s, about a half million hectaresabout 50 percent of the total rubber areahad beenreplanted by the early 1980s. The substantial replant-ing assistance encourages farmers to enter the programdespite the cess and the export tax. The replantingagency has successfully overcome many of the prob-lems of implementation that have plagued efforts inother countries. Appraisals show satisfactory eco-nomic rates of return. The program, which is beingsupported by the World Bank, can be counted as an
decisions on such key matters as the choice of cropand technique of production can become inflexibleand hard to change.
The types of issues that need to be considered indesigning program-specific incentive systems fortree crops can be quite subtle. Box 5.8 provides anillustration with reference to the rubber replantingprograms in Thailand.
IRRIGATION AND COST RECOVERY. While expan-sions in public irrigation have been a majorachievement in developing countries during thepast few decades, the benefits from irrigation haveoften been less than they might have been becauseof poor maintenance and operations. In somecountriessuch as Egypt and Pakistanreha-bilitation projects have become a higher prioritythan expansions into new areas. Excessive use ofwater has in some cases contributed to waterlog-ging and salinization. In Peru, for example, 25 per-cent of the 800,000 hectares developed for irriga-tion in the Costa area have salinity problems.
Charging farmers for the water they use can in-crease the benefits of irrigation. If they have to payfor the actual amounts they use, they would use
example of successful public sector intervention.Programs of this type can, however, have adverse
side effects unless carefully designed. The efficiency ofrubber farming is determined not just by the varietiesof trees but also by the quality of the tapping. Low-intensity, good-quality tapping and costly mainte-nance are required to extend the productive life of thetrees and to increase the total output before replantingbecomes necessary. However, cost recovery measuresand pricing policies affect the choice of technique: thecess and the export tax tend to discourage output,while substantial replanting grants may inducefarmers to adopt high-intensity tapping and poormaintenance practices. If so, advantages of the tech-niques that the government wants to promote wouldbe reduced, yields would be lower, and productivelives would be shorter than anticipated.
The scheme may also discourage putting new landunder rubber cultivation. Farmers who plant new landare not eligible for grants, although they still bear theburden of the cess and export tax. New planting wasthe primary factor behind the growth in rubber outputuntil recent years, when the accelerated replantingprogram became more significant. The decline in therate of new planting may have been related to an ear-
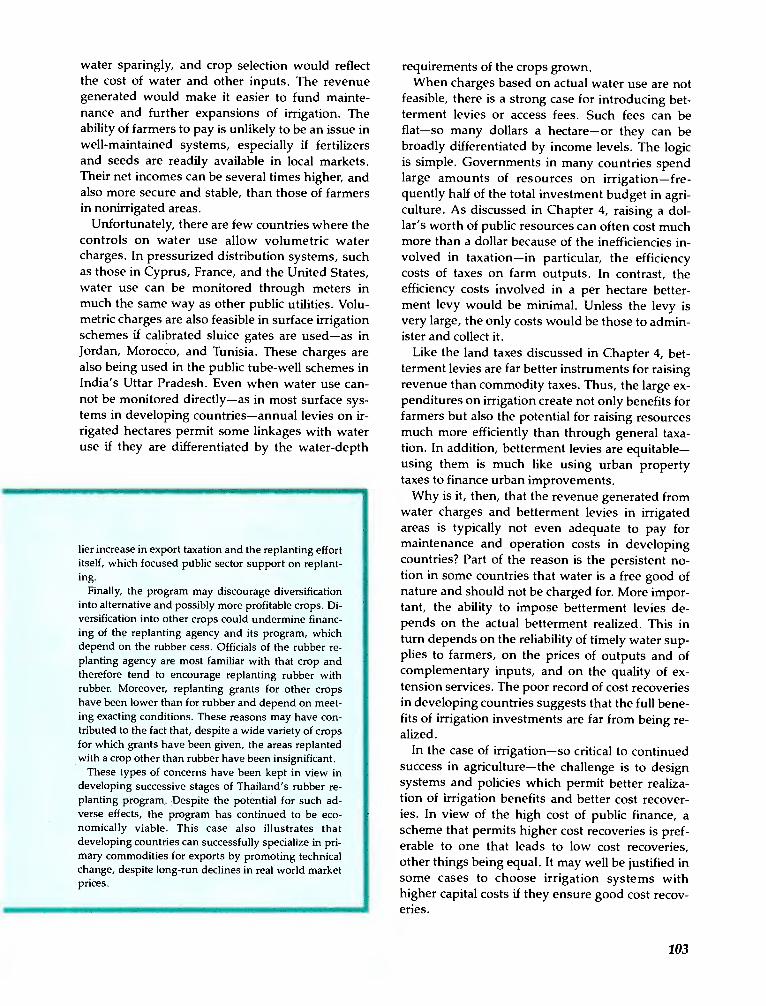
water sparingly, and crop selection would reflectthe cost of water and other inputs. The revenuegenerated would make it easier to fund mainte-nance and further expansions of irrigation. Theability of farmers to pay is unlikely to be an issue inwell-maintained systems, especially if fertilizersand seeds are readily available in local markets.Their net incomes can be several times higher, andalso more secure and stable, than those of farmersin nonirrigated areas.
Unfortunately, there are few countries where thecontrols on water use allow volumetric watercharges. In pressurized distribution systems, suchas those in Cyprus, France, and the United States,water use can be monitored through meters inmuch the same way as other public utilities. Volu-metric charges are also feasible in surface irrigationschemes if calibrated sluice gates are usedas inJordan, Morocco, and Tunisia. These charges arealso being used in the public tube-well schemes inIndia's Uttar Pradesh. Even when water use can-not be monitored directlyas in most surface sys-tems in developing countriesannual levies on ir-rigated hectares permit some linkages with wateruse if they are differentiated by the water-depth
her increase in export taxation and the replanting effortitself, which focused public sector support on replant-ing.
Finally, the program may discourage diversificationinto alternative and possibly more profitable crops. Di-versification into other crops could undermine financ-ing of the replanting agency and its program, whichdepend on the rubber cess. Officials of the rubber re-planting agency are most familiar with that crop andtherefore tend to encourage replanting rubber withrubber. Moreover, replanting grants for other cropshave been lower than for rubber and depend on meet-ing exacting conditions. These reasons may have con-tributed to the fact that, despite a wide variety of cropsfor which grants have been given, the areas replantedwith a crop other than rubber have been insignificant.
These types of concerns have been kept in view indeveloping successive stages of Thailand's rubber re-planting program. Despite the potential for such ad-verse effects, the program has continued to be eco-nomically viable. This case also illustrates thatdeveloping countries can successfully specialize in pri-mary commodities for exports by promoting technicalchange, despite long-run declines in real world marketprices.
requirements of the crops grown.When charges based on actual water use are not
feasible, there is a strong case for introducing bet-terment levies or access fees. Such fees can beflatso many dollars a hectareor they can bebroadly differentiated by income levels. The logicis simple. Governments in many countries spendlarge amounts of resources on irrigationfre-quently half of the total investment budget in agri-culture. As discussed in Chapter 4, raising a dol-lar's worth of public resources can often cost muchmore than a dollar because of the inefficiencies in-volved in taxationin particular, the efficiencycosts of taxes on farm outputs. In contrast, theefficiency costs involved in a per hectare better-ment levy would be minimal. Unless the levy isvery large, the only costs would be those to admin-ister and collect it.
Like the land taxes discussed in Chapter 4, bet-terment levies are far better instruments for raisingrevenue than commodity taxes. Thus, the large ex-penditures on irrigation create not only benefits forfarmers but also the potential for raising resourcesmuch more efficiently than through general taxa-tion. In addition, betterment levies are equitableusing them is much like using urban propertytaxes to finance urban improvements.
Why is it, then, that the revenue generated fromwater charges and betterment levies in irrigatedareas is typically not even adequate to pay formaintenance and operation costs in developingcountries? Part of the reason is the persistent no-tion in some countries that water is a free good ofnature and should not be charged for. More impor-tant, the ability to impose betterment levies de-pends on the actual betterment realized. This inturn depends on the reliability of timely water sup-plies to farmers, on the prices of outputs and ofcomplementary inputs, and on the quality of ex-tension services. The poor record of cost recoveriesin developing countries suggests that the full bene-fits of irrigation investments are far from being re-alized.
In the case of irrigationso critical to continuedsuccess in agriculturethe challenge is to designsystems and policies which permit better realiza-tion of irrigation benefits and better cost recover-ies. In view of the high cost of public finance, ascheme that permits higher cost recoveries is pref-erable to one that leads to low cost recoveries,other things being equal. It may well be justified insome cases to choose irrigation systems withhigher capital costs if they ensure good cost recov-eries.
103

Policy reforms
This chapter and Chapter 4 have highlighted manyof the difficulties that inappropriate pricing, trade,and macroeconomic policies create for agriculture.Some of the important lessons are:
Macroeconomic policies can introduce a se-vere bias against agriculture. Exchange rates andthe general pattern of prices and taxes need to treatthe different sectors of the economy in an even-handed manner.
Consumer price subsidy policies are expensiveand often do not benefit low-income groups asmuch as intended, whereas they benefit middle-and upper-income groups to a considerable de-gree. Consumer subsidies can be effective only ifthey are restricted to the lowest-income groupsand if their costs are controlled at levels that mostdeveloping countries can afford without having toresort to highly distortionary or inflationary meansof financing them.
Input subsidies are not an effective method foroffsetting the adverse effects of low output prices,nor are they appropriate instruments for redistrib-uting income, since most of the subsidies accrue tothe larger and better-off farmers.
While governments have played an importantrole in agriculture through expenditures on activi-ties which the private sector does not have theincentive to provide, their role in providing asound environment for private markets should notbe underestimated. Although significant progresshas been made in a few countries, other govern-ments could do more by eliminating parastatal mo-nopolies and by improving the legal and institu-tional framework required for the functioning ofcompetitive private markets.
The above list is not new: many governments indeveloping countries recognize the need for re-form, and several have begun to implement reformprograms. The experience of the past decade hasbegun to dispel the pessimistic notion that positivereform is impossible because of political con-straints. There have been strikingone might sayrevolutionaryreforms, and there have been oth-ers of a less sweeping nature that have had signifi-cant positive effects nonetheless.
Policy reform in China
The most far-reaching agricultural reforms of thepast decade have been undertaken in the People'sRepublic of China. Because of the scope of the re-forms, which touch all aspects of the organization
104
of agricultural production, pricing and marketingof farm products, and allocation of labor betweenfarm and nonfarm activities, it is appropriate toconsider the reforms and their effects in some de-tail.
Before 1955, farming in China was carried out onsome 100 million family farms averaging slightlyless than one hectare each. Between 1955 and 1958,the agricultural organization was transformed firstinto cooperatives and then into some 55,000 com-munes, and direct planning and procurement con-trols were introduced. Sown area, output, andprocurement targets became the main instrumentsof policy. There were some successes: the develop-ment and diffusion of modern seed varieties (espe-cially high-yielding dwarf rice, hybrid maize, andhybrid sorghum); a two-thirds increase in irrigatedland and an even greater increase in the share ofland irrigated with water supplied from pumps;and the development of a modern and large chem-ical fertilizer industry.
Nonetheless, agriculture contributed only mod-estly to the growth of the economy during 1958-77, which itself was modest. The main reasonswere the haste with which the commune systemwas created, the emphasis on egalitarianism in thedistribution of rewards within accounting units,the prohibition of private grain sales, the restric-tions on internal trade, and the promotion of self-sufficiency in staple foods at the provincial level.
In the mid-1970s, per capita output of grain wasno greater than two decades earlier. The produc-tion of soybeans in 1975-77 was 30 percent belowthe 1965-66 output, and per capita cotton produc-tion was a quarter lower than in 1965-66. The slowgrowth of farm output, combined with the strictcontrols over the nonfarm activities of farm peo-ple, led to near stagnation in farm incomes. By1977-78, the average rural real income was, at best,only slightly above the level of 1955-57. By 1978,China was no longer self-sufficient in grain andhad to import grain to supply about 40 percent ofits urban population.
The reforms which began in 1979 were designedto improve incentives for farm people and to re-duce the intervention of the planning officials.Some elements of reform were instituted from thegrass-roots level rather than from the top-levelgovernment. The first major step was to increasefarm prices by between 25 and 40 percent in 1979,the first significant adjustment in farm prices intwelve years. The multitiered price system thatwas set up provided better prices, increased pro-duction, and boosted marketing through state
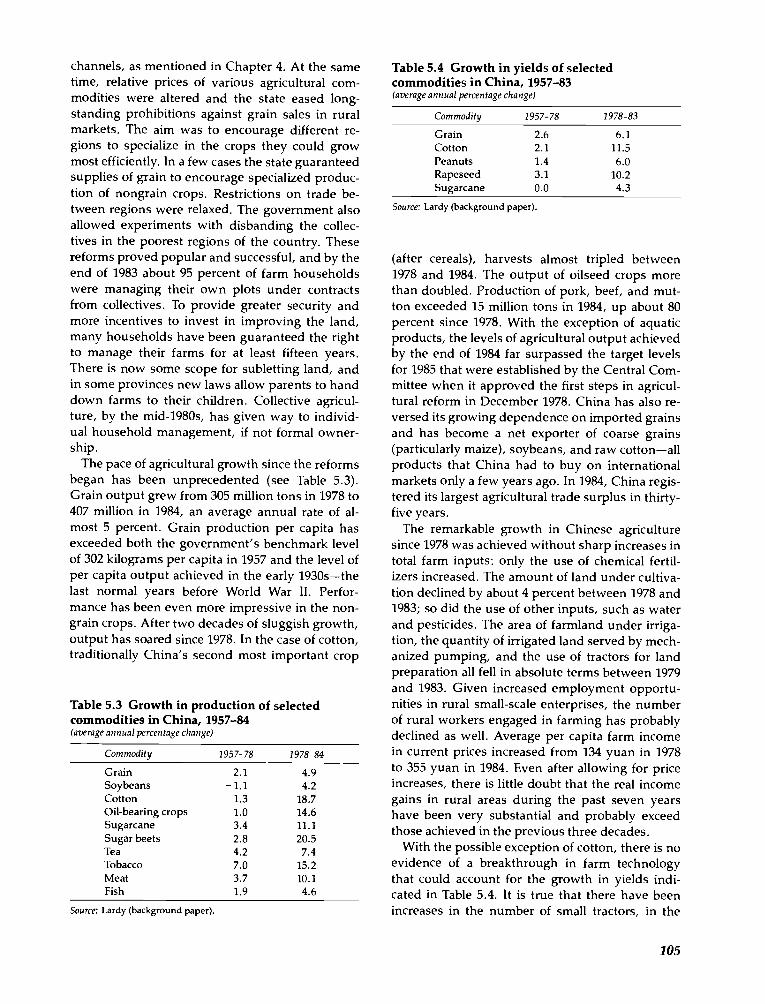
channels, as mentioned in Chapter 4. At the sametime, relative prices of various agricultural com-modities were altered and the state eased long-standing prohibitions against grain sales in ruralmarkets. The aim was to encourage different re-gions to specialize in the crops they could growmost efficiently. In a few cases the state guaranteedsupplies of grain to encourage specialized produc-tion of nongrain crops. Restrictions on trade be-tween regions were relaxed. The government alsoallowed experiments with disbanding the collec-tives in the poorest regions of the country. Thesereforms proved popular and successful, and by theend of 1983 about 95 percent of farm householdswere managing their own plots under contractsfrom collectives. To provide greater security andmore incentives to invest in improving the land,many households have been guaranteed the rightto manage their farms for at least fifteen years.There is now some scope for subletting land, andin some provinces new laws allow parents to handdown farms to their children. Collective agricul-ture, by the mid-1980s, has given way to individ-ual household management, if not formal owner-ship.
The pace of agricultural growth since the reformsbegan has been unprecedented (see Table 5.3).Grain output grew from 305 million tons in 1978 to407 million in 1984, an average annual rate of al-most 5 percent. Grain production per capita hasexceeded both the government's benchmark levelof 302 kilograms per capita in 1957 and the level ofper capita output achieved in the early 1930s-thelast normal years before World War II. Perfor-mance has been even more impressive in the non-grain crops. After two decades of sluggish growth,output has soared since 1978. In the case of cotton,traditionally China's second most important crop
Table 5.3 Growth in production of selectedcommodities in China, 1957-84
Source: Lardy (background paper).
Table 5.4 Growth in yields of selectedcommodities in China, 1957-83
Source: Lardy (background paper).
(after cereals), harvests almost tripled between1978 and 1984. The output of oilseed crops morethan doubled. Production of pork, beef, and mut-ton exceeded 15 million tons in 1984, up about 80percent since 1978. With the exception of aquaticproducts, the levels of agricultural output achievedby the end of 1984 far surpassed the target levelsfor 1985 that were established by the Central Com-mittee when it approved the first steps in agricul-tural reform in December 1978. China has also re-versed its growing dependence on imported grainsand has become a net exporter of coarse grains(particularly maize), soybeans, and raw cotton-allproducts that China had to buy on internationalmarkets only a few years ago. In 1984, China regis-tered its largest agricultural trade surplus in thirty-five years.
The remarkable growth in Chinese agriculturesince 1978 was achieved without sharp increases intotal farm inputs: only the use of chemical fertil-izers increased. The amount of land under cultiva-tion declined by about 4 percent between 1978 and1983; so did the use of other inputs, such as waterand pesticides. The area of farmland under irriga-tion, the quantity of irrigated land served by mech-anized pumping, and the use of tractors for landpreparation all fell in absolute terms between 1979and 1983. Given increased employment opportu-nities in rural small-scale enterprises, the numberof rural workers engaged in farming has probablydeclined as well. Average per capita farm incomein current prices increased from 134 yuan in 1978to 355 yuan in 1984. Even after allowing for priceincreases, there is little doubt that the real incomegains in rural areas during the past seven yearshave been very substantial and probably exceedthose achieved in the previous three decades.
With the possible exception of cotton, there is noevidence of a breakthrough in farm technologythat could account for the growth in yields indi-cated in Table 5.4. It is true that there have beenincreases in the number of small tractors, in the
105
(average annual percentage change)
Commodity 1957-78 1978 -84
Grain 2.1 4.9Soybeans -1.1 4.2Cotton 1.3 18.7Oil-bearing crops 1.0 14.6Sugarcane 3.4 11.1Sugar beets 2.8 20.5Tea 4.2 7.4Tobacco 7.0 15.2Meat 3.7 10.1Fish 1.9 4.6
(average annual percentage change)
Commodity 1957-78 1978-83
Grain 2.6 6.1Cotton 2.1 11.5Peanuts 1.4 6.0Rapeseed 3.1 10.2Sugarcane 0.0 4.3
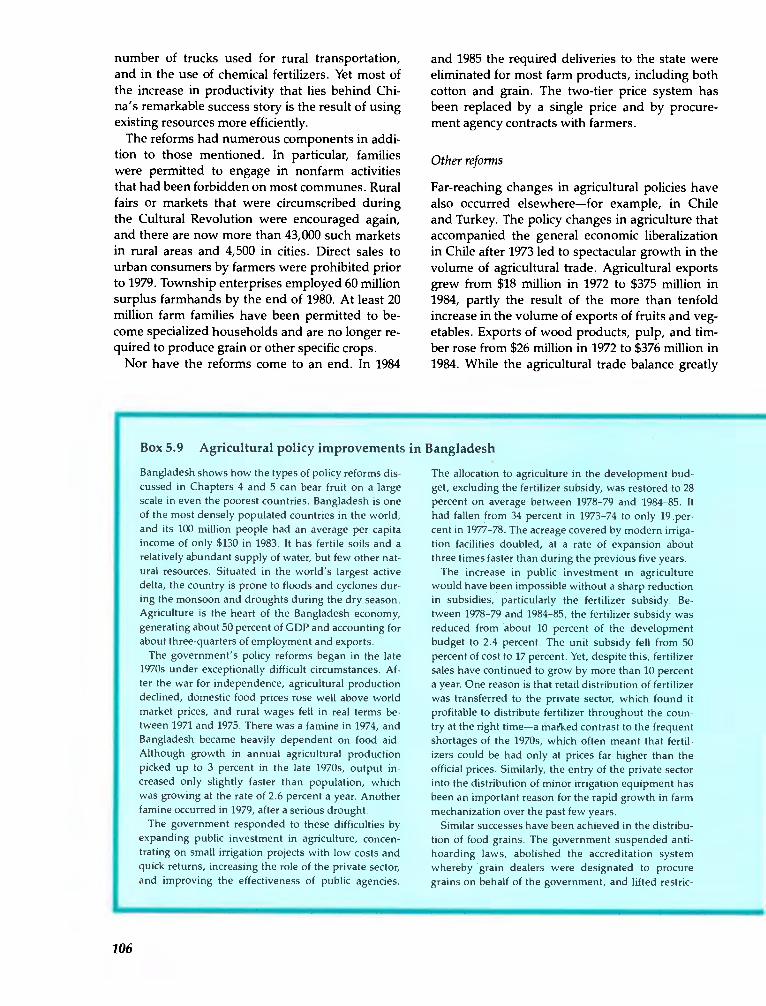
number of trucks used for rural transportation,and in the use of chemical fertilizers. Yet most ofthe increase in productivity that lies behind Chi-na's remarkable success story is the result of usingexisting resources more efficiently.
The reforms had numerous components in addi-tion to those mentioned. In particular, familieswere permitted to engage in rtonfarm activitiesthat had been forbidden on most communes. Ruralfairs or markets that were circumscribed duringthe Cultural Revolution were encouraged again,and there are now more than 43,000 such marketsin rural areas and 4,500 in cities. Direct sales tourban consumers by farmers were prohibited priorto 1979. Township enterprises employed 60 millionsurplus farmhands by the end of 1980. At least 20million farm families have been permitted to be-come specialized households and are no longer re-quired to produce grain or other specific crops.
Nor have the reforms come to an end. In 1984
and 1985 the required deliveries to the state wereeliminated for most farm products, including bothcotton and grain. The two-tier price system hasbeen replaced by a single price and by procure-ment agency contracts with farmers.
Other reforms
Far-reaching changes in agricultural policies havealso occurred elsewherefor example, in Chileand Turkey. The policy changes in agriculture thataccompanied the general economic liberalizationin Chile after 1973 led to spectacular growth in thevolume of agricultural trade. Agricultural exportsgrew from $18 million in 1972 to $375 million in1984, partly the result of the more than tenfoldincrease in the volume of exports of fruits and veg-etables. Exports of wood products, pulp, and tim-ber rose from $26 million in 1972 to $376 million in1984. While the agricultural trade balance greatly
Box 5.9 Agricultural policy improvements in Bangladesh
Bangladesh shows how the types of policy reforms dis-cussed in Chapters 4 and 5 can bear fruit on a largescale in even the poorest countries. Bangladesh is oneof the most densely populated countries in the world,and its 100 million people had an average per capitaincome of only $130 in 1983. It has fertile soils and arelatively abundant supply of water, but few other nat-ural resources. Situated in the world's largest activedelta, the country is prone to floods and cyclones dur-ing the monsoon and droughts during the dry season.Agriculture is the heart of the Bangladesh economy,generating about 50 percent of GDP and accounting forabout three-quarters of employment and exports.
The government's policy reforms began in the late1970s under exceptionally difficult circumstances. Af-ter the war for independence, agricultural productiondeclined, domestic food prices rose well above worldmarket prices, and rural wages fell in real terms be-tween 1971 and 1975. There was a famine in 1974, andBangladesh became heavily dependent on food aid.Although growth in annual agricultural productionpicked up to 3 percent in the late 1970s, output in-creased only slightly faster than population, whichwas growing at the rate of 2.6 percent a year. Anotherfamine occurred in 1979, after a serious drought.
The government responded to these difficulties byexpanding public investment in agriculture, concen-trating on small irrigation projects with low costs andquick returns, increasing the role of the private sector,and improving the effectiveness of public agencies.
The allocation to agriculture in the development bud-get, excluding the fertilizer subsidy, was restored to 28percent on average between 1978-79 and 1984-85. Ithad fallen from 34 percent in 1973-74 to only 19 per-cent in 1977-78. The acreage covered by modern irriga-tion facilities doubled, at a rate of expansion aboutthree times faster than during the previous five years.
The increase in public investment in agriculturewould have been impossible without a sharp reductionin subsidies, particularly the fertilizer subsidy. Be-tween 1978-79 and 1984-85, the fertilizer subsidy wasreduced from about 10 percent of the developmentbudget to 2.4 percent. The unit subsidy fell from 50percent of cost to 17 percent. Yet, despite this, fertilizersales have continued to grow by more than 10 percenta year. One reason is that retail distribution of fertilizerwas transferred to the private sector, which found itprofitable to distribute fertilizer throughout the coun-try at the right timea marked contrast to the frequentshortages of the 1970s, which often meant that fertil-izers could be had only at prices far higher than theofficial prices. Similarly, the entry of the private sectorinto the distribution of minor irrigation equipment hasbeen an important reason for the rapid growth in farmmechanization over the past few years.
Similar successes have been achieved in the distribu-tion of food grains. The government suspended anti-hoarding laws, abolished the accreditation systemwhereby grain dealers were designated to procuregrains on behalf of the government, and lifted restric-
106

improved, imports of foodespecially wheat, rice,and maizealso increased during the 1970s. How-ever, as a result of better exchange rate policies, thedomestic production of cereals grew by about 48percent between 1982 and 1984 and imports de-clined significantly.
The reforms in Turkey are much more recent. Aspart of the general reforms adopted by the govern-ment in 1980, input subsidies and production pricesupports were reduced and credit subsidies cur-tailed, The real exchange rate was significantly in-creased, with assurance that the new level wouldbe maintained, Exports were encouraged. Whilethe growth of agricultural GDP was low in 1981,due in part to oil shortages and poor weather, itsoon recovered to an annual rate of about 3.0 per-cent in 1982 and 1983 and 3.7 percent in 1984. Agri-cultural exports, by contrast, responded immedi-ately, growing at an annual rate of 17.7 percent in1980 and 1981. The annual rate of growth of the
value of exports dropped sharply thereafter, owingto the fall in world commodity prices, but the in-crease in agro-industrial exports partially compen-sated for this decline. Broader reforms within agri-culture, which began in 1984, have already led tomore liberal policies for the parastatals.
Substantial policy reforms have also been under-taken in Bangladesh, as discussed in Box 5.9. Themain elements in the policy shift were a sharp re-duction in the subsidies on fertilizers (which ac-counted for as much as 10 percent of the develop-ment budget in 1979); an increase in, andredirection of, spending on the infrastructure toemphasize small-scale irrigation, drainage, andflood control facilities; the liberalization of market-ing (with retail distribution of fertilizer privatized);the elimination or reduction of export taxes onmany agricultural products; and the adoption of amore realistic exchange rate policy.
Serious reform efforts can also be seen through-
tions that prevented the private sector from importingfood grains. The private sector now handles about 85percent of the internal marketing of grains. Aided bythe construction of adequate storage facilities, the pri-vate sector has been particularly effective in limitingtemporary increases in food-grain prices between har-vests. The reduction of subsidies to urban consumersenabled the government to expand rural investmentand relief programs rapidly, providing food-for-workand nutrition schemes for the poor. The investmentshave provided rural jobs equivalent to the full-timeemployment of close to I million landless laborers andhave been used to maintain roads, canals, and em-bankrnents, which are essential to agricultural growth.
The government combined its reduction of subsidiesand expansion of rural assistance schemes with moreappropriate exchange rate policies and the provision ofexport incentives. It reduced or abolished export taxeson jute, tea, shrimp, and other agricultural exports,which helped to sustain growth in agricultural exports.As a result:
Agricultural production has grown at about 3.5percent a year.
Agriculture has directly or indirectly generatedmost of the growth in employment, and rural wage,shave risen about 15 percent more than food-grainprices.
The adoption of high-yielding varieties has in-creased, fertilizer consumption has grown by morethan 10 percent a year, and irrigation, drainage, and
flood control facilities now cover nearly one-quarter ofthe cultivated area, as compared with less than 10 per-cent in the early 1970s.
Agriculture has become more resilient to naturaldisasters. In four of the past five years, the grain crophas set new records, despite bad monsoons, floods,and drought.
Food-grain imports, though still high, have fallenas a proportion of total consumption, and Bangladeshis now less dependent on food aid. A large and grow-ing proportion of such aid, currently about 50 percent,goes to finance programs specially aimed at helpingthe rural poor.
Farmers have diversified away from rice to wheat.Wheat is grown during the dry season between ricecrops, when fields would otherwise lie fallow; it is lessexpensive to produce and is better nutritionally. Overthe past decade production of wheat has risen fromalmost nothing to nearly 10 percent of total food-grainproduction. Consumption has increased from about 10percent to nearly 20 percent of total grain consump-tion.
Exports have increased and become more diverse.Jute exporters have won a higher world market share,despite slumping prices and declining demand. Ex-ports of other agricultural commodities, such asshrimp, tea, and leather, have grown by more than 10percent a year and now account for 30 percent of totalexports, compared with about 15 percent in the early1970s.
107
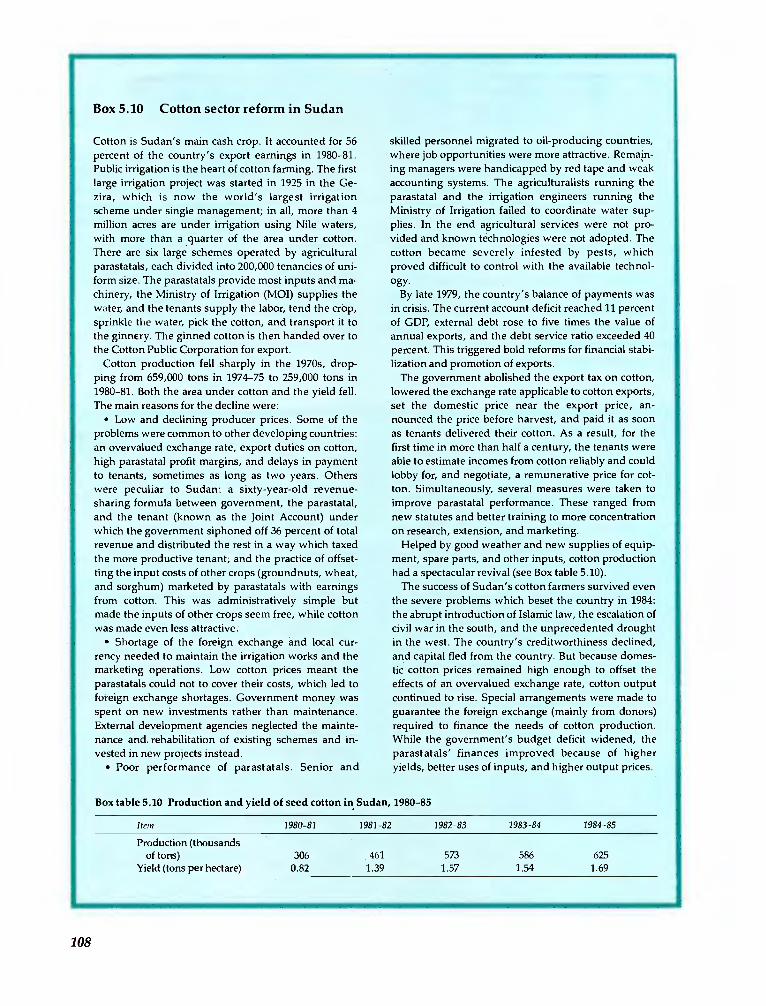
Box 5.10 Cotton sector reform in Sudan
Cotton is Sudan's main cash crop. It accounted for 56percent of the country's export earnings in 1980-81.Public irrigation is the heart of cotton farming. The firstlarge irrigation project was started in 1925 in the Ge-zira, which is now the world's largest irrigationscheme under single management; in all, more than 4million acres are under irrigation using Nile waters,with more than a quarter of the area under cotton.There are six large schemes operated by agriculturalparastatals, each divided into 200,000 tenancies of uni-form size. The parastatals provide most inputs and ma-chinery, the Ministry of Irrigation (MO!) supplies thewater, and the tenants supply the labor, tend the crop,sprinkle the water, pick the cotton, and transport it tothe ginnery. The ginned cotton is then handed over tothe Cotton Public Corporation for export.
Cotton production fell sharply in the 1970s, drop-ping from 659,000 tons in 1974-75 to 259,000 tons in1980-81. Both the area under cotton and the yield fell.The main reasons for the decline were:
Low and declining producer prices. Some of theproblems were common to other developing countries:an overvalued exchange rate, export duties on cotton,high parastatal profit margins, and delays in paymentto tenants, sometimes as long as two years. Otherswere peculiar to Sudan: a sixty-year-old revenue-sharing formula between government, the parastatal,and the tenant (known as the Joint Account) underwhich the government siphoned off 36 percent of totalrevenue and distributed the rest in a way which taxedthe more productive tenant; and the practice of offset-ting the input costs of other crops (groundnuts, wheat,and sorghum) marketed by parastatals with earningsfrom cotton. This was administratively simple butmade the inputs of other crops seem free, while cottonwas made even less attractive.
Shortage of the foreign exchange and local cur-rency needed to maintain the irrigation works and themarketing operations. Low cotton prices meant theparastatals could not to cover their costs, which led toforeign exchange shortages. Government money wasspent on new investments rather than maintenance.External development agencies neglected the mainte-nance and. rehabilitation of existing schemes and in-vested in new projects instead.
Poor performance of parastatals. Senior and
skilled personnel migrated to oil-producing countries,where job opportunities were more attractive. RemaIn-ing managers were handicapped by red tape and weakaccounting systems. The agriculturalists running theparastatal and the irrigation engineers running theMinistry of Irrigation failed to coordinate water sup-plies. In the end agricultural services were not pro-vided and known technologies were not adopted. Thecotton became severely infested by pests, whichproved difficult to control with the available technol-ogy.
By late 1979, the country's balance of payments wasin crisis. The current account deficit reached 11 percentof GDP, external debt rose to five times the value ofannual exports, and the debt service ratio exceeded 40percent. This triggered bold reforms for financial stabi-lization and promotion of exports.
The government abolished the export tax on cotton,lowered the exchange rate applicable to cotton exports,set the domestic price near the export price, an-nounced the price before harvest, and paid it as soonas tenants delivered their cotton. As a result, for thefirst time in more than half a century, the tenants wereable to estimate incomes from cotton reliably and couldlobby for, and negotiate, a remunerative price for cot-ton. Simultaneously, several measures were taken toimprove parastatal performance. These ranged fromnew statutes and better training to more concentrationon research, extension, and marketing.
Helped by good weather and new supplies of equip-ment, spare parts, and other inputs, cotton productionhad a spectacular revival (see Box table 5.10).
The success of Sudan's cotton farmers survived eventhe severe problems which beset the country in 1984:the abrupt introduction of Islamic law, the escalation ofcivil war in the south, and the unprecedented droughtin the west. The country's creditworthiness declined,and capital fled from the country. But because domes-tic cotton prices remained high enough to offset theeffects of an overvalued exchange rate, cotton outputcontinued to rise. Special arrangements were made toguarantee the foreign exchange (mainly from donors)required to finance the needs of cotton production.While the government's budget deficit widened, theparastatals' finances improved because of higheryields, better uses of inputs, and higher output prices.
108
Box table 5.10 Production and yield of seed cotton in Sudan, 1980-85
Item 1980-81 1981-82 1982-83 1983-84 1984-85
Production (thousandsof tons)
Yield (tons per hectare)306
0.82461
1.39573
1.57586
1.54625
1.69

out sub-Saharan Africa. The reform of the cottonsector in Sudan illustrates how much can begained by taking small steps despite unfavorabletrends in the overall economy. Sudan's irrigatedfarming sector has been revitalized throughchanges in the relationship between farmers andmanagement in irrigation schemes such as the Ge-zira. This has involved abolishing the export tax oncotton (the major crop in the Gezira scheme), low-ering the nominal exchange rate applied to cottonexports, and announcing producer prices beforethe harvest and paying farmers promptly for theircotton. Cotton production doubled between 1980-81 and 1984-85 (see Box 5.10).
In many other African countries producer pricesfor food have been increased in real terms, and ithas now become more profitable to grow staples tosubstitute efficently for imports. Real producerprices of traditional export crops have also risen.Unskilled workers can earn higher incomes infarming than in wage employmenta radical shiftfrom a decade ago. Consumer food price policiesare also changing in Africa, where urban con-sumption has been heavily subsidized for manydecades. In countries from Madagascar to Maurita-nia and Zambia to Mali, sharp increases in priceshave reversed long-standing subsidy policies.
More competitive marketing arrangements areemerging. In some West African countries, exportmarketing parastatals have either disappeared (forinstance, for groundnuts in Mali) or have been ex-posed to competition. In Somalia the monopoly ofparastatals in maize, sorghum, and importedfoods has been eliminated. Madagascar has liberal-ized domestic rice marketing, and Zaire has elimi-nated its food marketing parastatals. The tendencyis not universal, and there are cases where market-ing controls have been made more, rather than
less, extensive in recent years. But the trend is to-ward more open marketing arrangements andprice policies that are more favorable for agricul-tural growth.
Policy reforms in the pricing of fertilizers are alsonoteworthy. Following the early years of theGreen Revolution, few notions took root as deeplyas the notion that fertilizers need to be subsidizedto encourage rapid technological change. Yet, re-cently many of the East Asian countries have aban-doned fertilizer subsidies; such subsidies are de-clining in Bangladesh and Pakistan. They havebeen cut back sharply in Benin, Burkina Faso,Mali, Niger, Senegal, and Togo. The subsidizationof fertilizers and other inputs seems to be in clearretreat throughout the developing world.
These examples illustrate the numerous reformsthat have been undertaken or are under consider-ation in developing countries. Whether sweepingin scope or restricted to particular aspects of sec-toral policies, the reforms illustrate that politicalinstitutions can have the capacity and the commit-ment to devise and carry out significant policychanges. This was also evident in the case of SriLanka's reform of its long-entrenched consumersubsidy program for rice, as discussed in Box 5.4.
While this reformist trend also illustrates thescope there is in developing countries for doingbetter, one must not lose sight of the policies inindustrial countries which greatly influence the ex-ternal environment. Do policies in industrial coun-tries ease or exacerbate the difficulties faced by de-veloping countries? What domestic objectives arebeing pursued by industrial countries, and canthey be met at lesser cost to themselves and to thedeveloping world? These are the questions dis-cussed in the next chapter.
109


![sole [Read-Only]cle.berkeley.edu/DC_SOLE/sole.pdf · SOLE . HorLL R . Examples of Policies Health Care Reform • Taxes • Subsidies Financial Regulatory Reform • Insurance Capital](https://img.dokumen.tips/doc/110x75/5fabc4cb348980287c12b6ae/sole-read-onlycle-sole-horll-r-examples-of-policies-health-care-reform-a.jpg)