Embed Size (px)
Citation preview

M A R K E T B E AT
U.S. Retail Sector: The Worst Is Likely Over
After a challenging 2020, retail market conditions improved in the first quarter of 2021. As the quarter unfolded, government stimulus payments were distributed and vaccinations accelerated, shoppers became more active and the retail sector began to improve. Net absorption registered at -740,000 sf—by far the smallest negative absorption recorded since the pandemic first began and leasing activity while down slightly at 25 million square feet (msf) was above the Q2 2020 low. Retail vacancy rose just 10 basis points (bps) from the prior quarter to 7.3%.
As we look ahead, a strong rebound scenario for the retail sector is starting to form. In fact, the e-commerce surge that occurred during the lockdowns last year is already starting to backtrack to reflect more normalcy. Online sales as a percentage of core retail sales jumped from 17.0% in 2019 to nearly 25.0% at the peak of last year (mid-2020). Although e-commerce likely made permanent gains as households moved up the online shopping learning curve, it is also worth noting that since peaking last summer, the share of online sales has come down and dipped back below 22.0% in Q1 2021.
The strong trends in recent retail sales data confirms this shift back to brick and mortar. Total U.S. retail sales soared 9.8% month-over-month in March 2021—the second largest one-month increase recorded, only surpassed by the surge in May 2020 as COVID-19 lockdowns came off. Total first quarter 2021 retail sales increased at an astonishing 34.7% annual rate (AR) led by apparel stores (+42% AR), furniture (+52%) and sporting goods (+55%). Moreover, after observing a record 15,000 store closures in 2020, it is expected that new store openings will exceed store closures in 2021. We are tracking 11,700 new stores that will open in 2021 which will be the most in three years.
It is likely the strong consumer spending pattern we are just now starting to observe will continue throughout 2021. As we’ve noted in past publications, there is a tremendous pent-up demand
7.3%Vacancy Rate
-740KNet Absorption, SF
$20.57Asking Rent, PSF
ECONOMIC INDICATORSQ1 2021
15.2M
12-Mo. Forecast
Retail Employment
143.4MTotal Nonfarm Employment
6.0%Unemployment Rate
12-Mo. Forecast
YoY Chg
YoY Chg
OVERALL VACANCY & ASKING RENT
5.5%
6.0%
6.5%
7.0%
7.5%
$18.50
$19.50
$20.50
$21.50
2018 2019 2020 Q1 2021
Rent, $ PSF/NNN Vacancy Rate
SPACE DEMAND / DELIVERIES
-40
-20
0
20
40
2018 2019 2020 Q1 2021
MSF
Net Absorption, SF Construction Completions, SF
U.S. NATIONALShopping Center Q1 2021
10.7MUnder Construction
Source: U.S. Bueau of Labor Statistics, U.S. Department of Commerce
14.3%Retail Sales Growth (Q1)
Source: CoStar, Cushman & Wakefield Research

M A R K E T B E AT
cushmanwakefield.com | 2
Outlook
• 2021 will be a year of recovery for retail real estate and shopping centers as the national economy drives activity. The retail sector recovery is likely to be uneven and will take time to complete.
• For the first time since the pandemic began, we can clearly see that better days lie ahead.
U.S. NATIONAL Shopping Center Q1 2021
3%
6%
9%
12%
2008
2009
2010
2011
2012
2013
2014
2015
2016
2017
2018
2019
2020
2021
Recession Shopping CenterPower & Regional Neighborhood & CommunityStrip
dynamic that has been building throughout this pandemic. Estimates show there is nearly $2.6 trillion in excess savings beyond the norm. Middle-and-higher income households, in particular, have built up strong wealth and savings during this pandemic. Thus, certain segments of the retail sector could be supercharged on the other side of the pandemic, including high-end restaurants, food halls, grocery stores, entertainment, home improvement, electronics, and experiential concepts. In general, any type of experiential retail that people can’t buy online is poised for growth.
The supply side of the equation should also help the fundamentals firm up more quickly. Construction deliveries declined in the first quarter of 2021, continuing the trend of the previous several years. Deliveries totaled 1.9 msf in the first quarter of 2021—the lowest of the past decade.
-15-10
-505
101520
2016
2017
2018
2019
2020
Q1
2021
MSF
SHOPPING CENTER NET ABSORPTION
10% 12% 10% 6%17% 18% 17% 18%
47% 53% 45% 48%
27% 18% 28% 28%
Shopping CenterTotal
Power Center Neighborhood &Community
Strip
Northeast Midwest South West
LEASING ACTIVITY BY REGION & TYPE, % OF TOTAL Q1 2021
VACANCY RATE BY TYPE Q1 2021
Source: CoStar, Cushman & Wakefield Research

M A R K E T B E AT M A R K E T B E AT
cushmanwakefield.com | 3
U.S. NATIONAL Net Absorption Q1 2021
Net Absorption
U.S. Shopping Center Markets Q1 2020 Q2 2020 Q3 2020 Q4 2020 Q1 2021p
Akron, OH -167,513 152,538 -165,096 16,241 -65,671
Albany, NY -76,845 45,542 -100,209 -106,165 -80,938
Albuquerque, NM -130,351 -99,801 30,740 74,957 -143,252
Atlanta, GA 227,795 -148,258 -486,243 274,329 -131,409
Austin, TX 262,310 -39,545 -140,205 -100,205 134,764
Bakersfield, CA 22,986 16,179 1,767 133,590 -25,936
Baltimore, MD -379,117 -44,280 -368,180 -55,661 -10,734
Birmingham, AL 7,967 -78,046 26,074 178,372 14,987
Boise, ID -16,878 -4,227 -76,526 -33,194 79,436
Boston, MA -135,112 -259,708 41,030 17,528 -79,340
Boulder, CO 160,535 -91,167 -52,133 -57,909 -41,222
Buffalo, NY -18,012 -59,702 -739,023 -193,903 71,116
Charleston, SC -90,460 -31,802 -405,284 -91,508 -8,904
Charlotte, NC -74,308 -103,317 -456,097 197,808 112,369
Chicago, IL 163,093 -120,271 49,456 437,551 374,612
Cincinnati, OH 48,927 -9,271 75,751 -52,986 -57,402
Cleveland, OH -85,266 -131,721 -200,194 -435,233 -149,391
Colorado Springs, CO -23,414 -42,027 -185,368 67,114 57,490
Columbia, SC -74,340 -74,326 -182,527 84,541 -141,676
Columbus, OH -131,050 -283,952 -86,261 43,592 279,385
Dallas/Ft. Worth, TX -253,759 -843,858 -1,235,352 -644,433 -384,856
Dayton, OH -189,614 -143,344 -27,771 -84,903 -12,288
Denver, CO -108,979 -145,366 -423,851 -148,758 -133,071
Des Moines, IA -120,850 -106,033 26,148 -175,369 79,569
Detroit, MI -50,140 -76,982 -552,402 -278,693 9,648
East Bay, CA 19,593 -7,026 -179,871 808 -62,267
El Paso, TX 132,476 -67,989 -139,186 50,948 96,730
Fort Lauderdale, FL -111,224 -108,127 -374,263 -59,293 116,238
Fort Myers/Naples, FL -80,126 -101,251 175,964 171,790 75,776
Grand Rapids, MI -25,821 -8,995 -83,004 -13,396 -7,559
Greensboro, NC -41,888 74,386 -1,724 76,390 -82,791
Greenville, SC -45,665 -85,882 -58,041 12,749 -80,242
Hartford, CT 7,095 -127,403 -276,362 6,933 188,106
Hawaii 5,641 -115,072 23,021 -104,658 -11,070
Houston, TX 163,882 -883,061 14,982 413,112 102,646
Indianapolis, IN -99,354 117,393 281,654 -168,671 -91,743
Inland Empire, CA -228,310 -276,766 -93,670 26,126 109,654
Jacksonville, FL 148,808 171,767 -157,930 -286,988 372,935
Kansas City, MO 57,818 -22,591 -266,317 -267,415 -24,329
Knoxville, TN -41,945 -58,295 -162,397 -63,437 162,923
Lansing, MI 0 47,927 52,071 -31,824 -400,760
Las Vegas, NV -289,767 -19,366 98,101 222,940 52,009
Net Absorption
U.S. Shopping Center Markets Q1 2020 Q2 2020 Q3 2020 Q4 2020 Q1 2021p
Los Angeles, CA -48,475 -76,533 -213,993 -379,383 -206,617
Louisville, KY 343,025 -145,887 -180,272 18,879 -68,285
Memphis, TN -39,290 -104,922 -116,388 72,569 104,535
Miami, FL 162,350 -96,323 -39,409 38,095 31,573
Milwaukee, WI -47,907 -11,706 -54,693 44,647 -141,729
Minneapolis, MN -16,117 -199,892 -323,003 -239,086 24,725
Montgomery, AL -107,452 16,966 -36,096 73,010 30,082
Nashville, TN -20,953 -158,519 -37,524 -196,686 113,372
New Haven, CT -21,733 37,345 -151,751 -5,068 127,808
New Orleans, LA 28,709 -61,302 -265,694 91,067 -177,212
New York City Metro, NY 61,592 -62,432 -502,349 -248,724 -183,394
Norfolk, VA -378,934 -97,515 84,194 -14,286 26,683
Northwest Arkansas -71,095 11,839 -32,673 -3,623 104,503
Oklahoma City, OK 97,331 -186,672 -70,670 54,604 -145,173
Omaha, NE -32,863 23,699 -83,418 -204,950 97,945
Orange County, CA -60,088 34,421 -337,688 31,376 -223,756
Orlando, FL -113,585 -147,250 64,182 -59,566 245,302
Palm Beach, FL 72,761 -109,324 -240,178 10,615 19,836
Philadelphia, PA -375,574 55,996 -990,544 -60,057 -56,823
Phoenix, AZ 201,711 -158,763 40,051 -21,632 432,691
Pittsburgh, PA -56,432 -117,610 -91,758 -99,241 29,852
Portland, OR -172,922 -155,155 -122,755 -28,292 -113,597
Providence, RI 5,366 -375,944 -317,822 -151,012 -965
Raleigh/Durham, NC -69,620 74,446 -161,509 -103,160 92,941
Reno, NV 147,271 -20,487 -69,219 5,062 -11,009
Richmond, VA 50,152 4,401 -32,950 7,477 77,225
Rochester, NY -51,427 -112,051 -391,150 35,390 -235,623
Sacramento, CA 103,168 86,669 -41,633 -89,296 19,659
Saint Louis, MO 163,621 -305,422 58,746 -28,593 -165,224
Salt Lake City, UT 29,542 125,818 -135,255 -213,241 250,222
San Antonio, TX -148,688 97,165 -180,866 37,821 -124,859
San Diego, CA -59,399 -171,518 -365,050 -87,071 -298,246
San Francisco, CA -67,760 -19,996 -163,972 -80,616 -136,900
San Jose, CA -65,699 -132,286 -122,228 220,103 -1,932
Sarasota, FL -72,972 -435 -78,407 68,971 -36,978
Seattle, WA 89,717 40,180 -279,500 155,111 -314,420
Tampa, FL -43,491 11,539 -38,417 87,307 -63,654
Tucson, AZ -39,531 34,872 -50,853 53,201 55,289
Tulsa, OK 79,903 -159,283 56,628 31,586 154,944
Washington, DC -8,233 -144,401 -249,752 -117,758 -332,675
Net Absorption U.S. Shopping Center Markets Q1 2020 Q2 2020 Q3 2020 Q4 2020 Q1 2021pUnited States -2,215,207 -6,869,368 -13,044,366 -2,241,633 -736,342Northeast -661,082 -975,967 -3,519,938 -804,319 -220,201
Midwest -533,040 -1,078,623 -1,298,333 -1,439,088 -250,212
South -587,007 -3,430,689 -5,435,540 200,832 546,089
West -434,078 -1,384,089 -2,790,555 -199,058 -812,018
M A R K E T B E AT M A R K E T B E AT
cushmanwakefield.com | 4
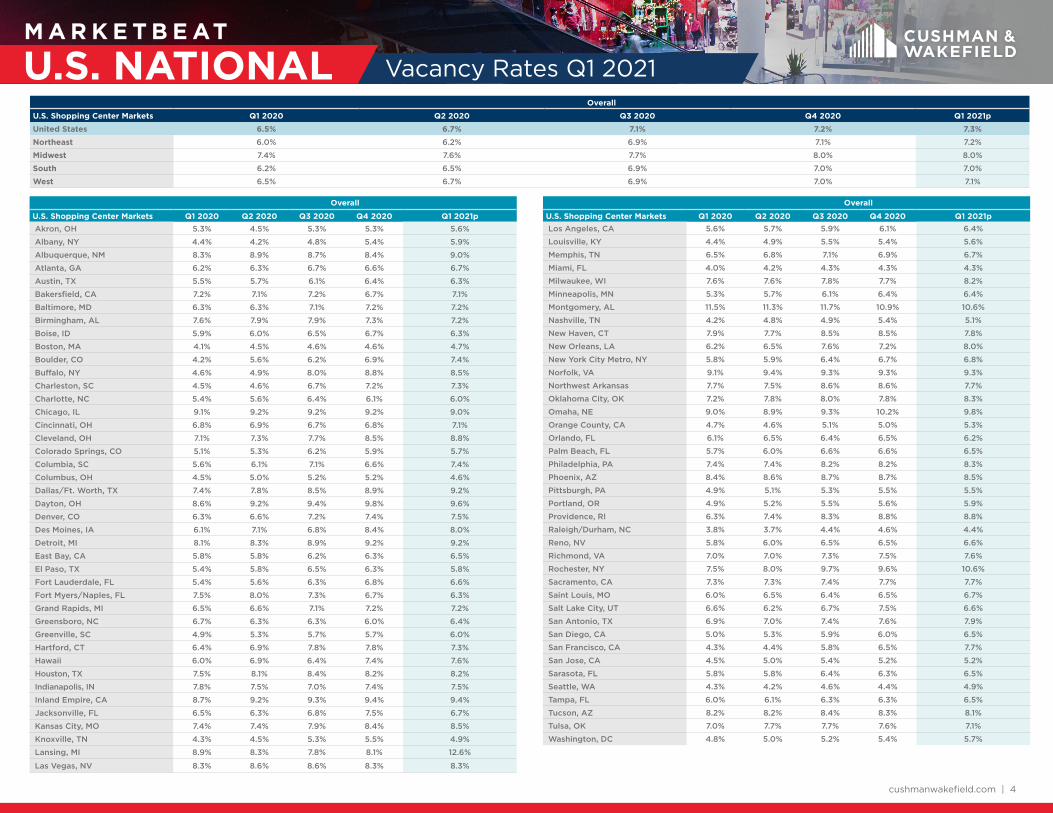
U.S. NATIONAL Vacancy Rates Q1 2021
Overall
U.S. Shopping Center Markets Q1 2020 Q2 2020 Q3 2020 Q4 2020 Q1 2021pAkron, OH 5.3% 4.5% 5.3% 5.3% 5.6%
Albany, NY 4.4% 4.2% 4.8% 5.4% 5.9%
Albuquerque, NM 8.3% 8.9% 8.7% 8.4% 9.0%
Atlanta, GA 6.2% 6.3% 6.7% 6.6% 6.7%
Austin, TX 5.5% 5.7% 6.1% 6.4% 6.3%
Bakersfield, CA 7.2% 7.1% 7.2% 6.7% 7.1%
Baltimore, MD 6.3% 6.3% 7.1% 7.2% 7.2%
Birmingham, AL 7.6% 7.9% 7.9% 7.3% 7.2%
Boise, ID 5.9% 6.0% 6.5% 6.7% 6.3%
Boston, MA 4.1% 4.5% 4.6% 4.6% 4.7%
Boulder, CO 4.2% 5.6% 6.2% 6.9% 7.4%
Buffalo, NY 4.6% 4.9% 8.0% 8.8% 8.5%
Charleston, SC 4.5% 4.6% 6.7% 7.2% 7.3%
Charlotte, NC 5.4% 5.6% 6.4% 6.1% 6.0%
Chicago, IL 9.1% 9.2% 9.2% 9.2% 9.0%
Cincinnati, OH 6.8% 6.9% 6.7% 6.8% 7.1%
Cleveland, OH 7.1% 7.3% 7.7% 8.5% 8.8%
Colorado Springs, CO 5.1% 5.3% 6.2% 5.9% 5.7%
Columbia, SC 5.6% 6.1% 7.1% 6.6% 7.4%
Columbus, OH 4.5% 5.0% 5.2% 5.2% 4.6%
Dallas/Ft. Worth, TX 7.4% 7.8% 8.5% 8.9% 9.2%
Dayton, OH 8.6% 9.2% 9.4% 9.8% 9.6%
Denver, CO 6.3% 6.6% 7.2% 7.4% 7.5%
Des Moines, IA 6.1% 7.1% 6.8% 8.4% 8.0%
Detroit, MI 8.1% 8.3% 8.9% 9.2% 9.2%
East Bay, CA 5.8% 5.8% 6.2% 6.3% 6.5%
El Paso, TX 5.4% 5.8% 6.5% 6.3% 5.8%
Fort Lauderdale, FL 5.4% 5.6% 6.3% 6.8% 6.6%
Fort Myers/Naples, FL 7.5% 8.0% 7.3% 6.7% 6.3%
Grand Rapids, MI 6.5% 6.6% 7.1% 7.2% 7.2%
Greensboro, NC 6.7% 6.3% 6.3% 6.0% 6.4%
Greenville, SC 4.9% 5.3% 5.7% 5.7% 6.0%
Hartford, CT 6.4% 6.9% 7.8% 7.8% 7.3%
Hawaii 6.0% 6.9% 6.4% 7.4% 7.6%
Houston, TX 7.5% 8.1% 8.4% 8.2% 8.2%
Indianapolis, IN 7.8% 7.5% 7.0% 7.4% 7.5%
Inland Empire, CA 8.7% 9.2% 9.3% 9.4% 9.4%
Jacksonville, FL 6.5% 6.3% 6.8% 7.5% 6.7%
Kansas City, MO 7.4% 7.4% 7.9% 8.4% 8.5%
Knoxville, TN 4.3% 4.5% 5.3% 5.5% 4.9%
Lansing, MI 8.9% 8.3% 7.8% 8.1% 12.6%
Las Vegas, NV 8.3% 8.6% 8.6% 8.3% 8.3%
Overall
U.S. Shopping Center Markets Q1 2020 Q2 2020 Q3 2020 Q4 2020 Q1 2021pLos Angeles, CA 5.6% 5.7% 5.9% 6.1% 6.4%
Louisville, KY 4.4% 4.9% 5.5% 5.4% 5.6%
Memphis, TN 6.5% 6.8% 7.1% 6.9% 6.7%
Miami, FL 4.0% 4.2% 4.3% 4.3% 4.3%
Milwaukee, WI 7.6% 7.6% 7.8% 7.7% 8.2%
Minneapolis, MN 5.3% 5.7% 6.1% 6.4% 6.4%
Montgomery, AL 11.5% 11.3% 11.7% 10.9% 10.6%
Nashville, TN 4.2% 4.8% 4.9% 5.4% 5.1%
New Haven, CT 7.9% 7.7% 8.5% 8.5% 7.8%
New Orleans, LA 6.2% 6.5% 7.6% 7.2% 8.0%
New York City Metro, NY 5.8% 5.9% 6.4% 6.7% 6.8%
Norfolk, VA 9.1% 9.4% 9.3% 9.3% 9.3%
Northwest Arkansas 7.7% 7.5% 8.6% 8.6% 7.7%
Oklahoma City, OK 7.2% 7.8% 8.0% 7.8% 8.3%
Omaha, NE 9.0% 8.9% 9.3% 10.2% 9.8%
Orange County, CA 4.7% 4.6% 5.1% 5.0% 5.3%
Orlando, FL 6.1% 6.5% 6.4% 6.5% 6.2%
Palm Beach, FL 5.7% 6.0% 6.6% 6.6% 6.5%
Philadelphia, PA 7.4% 7.4% 8.2% 8.2% 8.3%
Phoenix, AZ 8.4% 8.6% 8.7% 8.7% 8.5%
Pittsburgh, PA 4.9% 5.1% 5.3% 5.5% 5.5%
Portland, OR 4.9% 5.2% 5.5% 5.6% 5.9%
Providence, RI 6.3% 7.4% 8.3% 8.8% 8.8%
Raleigh/Durham, NC 3.8% 3.7% 4.4% 4.6% 4.4%
Reno, NV 5.8% 6.0% 6.5% 6.5% 6.6%
Richmond, VA 7.0% 7.0% 7.3% 7.5% 7.6%
Rochester, NY 7.5% 8.0% 9.7% 9.6% 10.6%
Sacramento, CA 7.3% 7.3% 7.4% 7.7% 7.7%
Saint Louis, MO 6.0% 6.5% 6.4% 6.5% 6.7%
Salt Lake City, UT 6.6% 6.2% 6.7% 7.5% 6.6%
San Antonio, TX 6.9% 7.0% 7.4% 7.6% 7.9%
San Diego, CA 5.0% 5.3% 5.9% 6.0% 6.5%
San Francisco, CA 4.3% 4.4% 5.8% 6.5% 7.7%
San Jose, CA 4.5% 5.0% 5.4% 5.2% 5.2%
Sarasota, FL 5.8% 5.8% 6.4% 6.3% 6.5%
Seattle, WA 4.3% 4.2% 4.6% 4.4% 4.9%
Tampa, FL 6.0% 6.1% 6.3% 6.3% 6.5%
Tucson, AZ 8.2% 8.2% 8.4% 8.3% 8.1%
Tulsa, OK 7.0% 7.7% 7.7% 7.6% 7.1%
Washington, DC 4.8% 5.0% 5.2% 5.4% 5.7%
Overall
U.S. Shopping Center Markets Q1 2020 Q2 2020 Q3 2020 Q4 2020 Q1 2021p
United States 6.5% 6.7% 7.1% 7.2% 7.3%
Northeast 6.0% 6.2% 6.9% 7.1% 7.2%
Midwest 7.4% 7.6% 7.7% 8.0% 8.0%
South 6.2% 6.5% 6.9% 7.0% 7.0%
West 6.5% 6.7% 6.9% 7.0% 7.1%

M A R K E T B E AT M A R K E T B E AT
cushmanwakefield.com | 5
U.S. NATIONAL Asking Rents Q1 2021
Overall (All Classes)
U.S. Shopping Center Markets Q1 2020 Q2 2020 Q3 2020 Q4 2020 Q1 2021p
Akron, OH $12.51 $12.66 $12.40 $12.46 $12.88
Albany, NY $15.05 $14.90 $15.01 $15.04 $15.35
Albuquerque, NM $16.44 $16.46 $16.43 $16.40 $16.45
Atlanta, GA $17.23 $17.31 $17.38 $17.60 $17.92
Austin, TX $25.50 $25.58 $25.47 $25.47 $25.54
Bakersfield, CA $18.38 $18.40 $18.44 $18.48 $18.56
Baltimore, MD $23.13 $23.08 $23.04 $22.77 $22.88
Birmingham, AL $13.62 $13.78 $13.81 $13.85 $14.06
Boise, ID $14.93 $14.97 $14.96 $14.96 $15.09
Boston, MA $22.24 $21.99 $21.55 $21.32 $21.15
Boulder, CO $22.27 $22.14 $22.16 $22.05 $22.28
Buffalo, NY $12.53 $12.57 $12.57 $12.61 $12.75
Charleston, SC $18.17 $18.25 $18.26 $18.33 $18.36
Charlotte, NC $20.02 $20.51 $20.73 $20.84 $21.00
Chicago, IL $18.47 $18.41 $18.28 $18.25 $18.31
Cincinnati, OH $13.17 $13.26 $13.16 $13.22 $13.45
Cleveland, OH $14.60 $14.71 $14.63 $14.68 $14.81
Colorado Springs, CO $17.58 $17.46 $17.74 $17.63 $17.68
Columbia, SC $14.12 $14.38 $14.76 $14.62 $15.39
Columbus, OH $16.56 $16.59 $16.50 $16.64 $16.44
Dallas/Ft. Worth, TX $19.28 $19.38 $19.40 $19.42 $19.50
Dayton, OH $12.23 $12.49 $12.51 $12.63 $12.66
Denver, CO $22.23 $22.32 $22.19 $22.18 $22.17
Des Moines, IA $13.02 $13.01 $13.04 $12.96 $12.94
Detroit, MI $16.36 $16.39 $16.26 $16.19 $16.15
East Bay, CA $32.55 $32.63 $32.33 $32.42 $32.53
El Paso, TX $14.98 $14.98 $14.90 $14.90 $14.96
Fort Lauderdale, FL $25.57 $25.66 $25.53 $25.12 $25.45
Fort Myers/Naples, FL $16.47 $16.54 $16.56 $16.65 $16.78
Grand Rapids, MI $12.47 $12.45 $12.42 $12.53 $12.67
Greensboro, NC $12.59 $12.48 $12.41 $12.25 $12.53
Greenville, SC $14.28 $14.62 $14.76 $14.57 $14.97
Hartford, CT $17.79 $17.85 $17.82 $17.91 $17.92
Hawaii $44.75 $44.67 $44.66 $44.83 $44.30
Houston, TX $20.14 $20.05 $19.96 $19.99 $19.95
Indianapolis, IN $15.47 $15.49 $15.52 $15.72 $15.86
Inland Empire, CA $22.31 $22.42 $22.40 $22.37 $22.61
Jacksonville, FL $18.49 $18.62 $18.79 $19.21 $19.33
Kansas City, MO $15.87 $15.82 $15.72 $15.76 $15.54
Knoxville, TN $14.60 $14.78 $14.84 $14.93 $14.98
Lansing, MI $12.31 $12.38 $12.37 $12.29 $13.08
Las Vegas, NV $21.75 $21.84 $21.93 $21.88 $22.19
Overall (All Classes)
U.S. Shopping Center Markets Q1 2020 Q2 2020 Q3 2020 Q4 2020 Q1 2021pLos Angeles, CA $30.88 $30.81 $30.60 $30.45 $30.31
Louisville, KY $14.50 $14.38 $14.50 $14.73 $14.73
Memphis, TN $14.58 $14.71 $14.41 $14.51 $14.53
Miami, FL $32.96 $32.52 $32.63 $32.69 $32.55
Milwaukee, WI $14.19 $14.36 $14.34 $14.47 $14.54
Minneapolis, MN $17.19 $17.37 $17.47 $17.57 $18.25
Montgomery, AL $12.28 $12.29 $12.35 $12.47 $12.40
Nashville, TN $21.68 $21.81 $22.43 $22.80 $23.12
New Haven, CT $16.72 $16.55 $16.38 $16.36 $16.24
New Orleans, LA $16.00 $16.34 $16.30 $16.21 $16.42
New York City Metro, NY $32.98 $32.99 $32.79 $32.10 $31.90
Norfolk, VA $17.31 $17.31 $17.31 $17.52 $17.91
Northwest Arkansas $15.13 $15.23 $15.30 $15.34 $15.37
Oklahoma City, OK $14.64 $14.78 $14.77 $14.64 $14.53
Omaha, NE $13.71 $13.83 $13.86 $13.86 $13.99
Orange County, CA $32.62 $32.57 $32.30 $32.16 $31.84
Orlando, FL $21.88 $22.02 $21.97 $22.17 $22.27
Palm Beach, FL $26.61 $26.86 $27.20 $27.43 $27.40
Philadelphia, PA $19.71 $19.88 $19.85 $19.95 $20.18
Phoenix, AZ $18.83 $18.82 $18.84 $18.88 $19.14
Pittsburgh, PA $15.01 $15.15 $15.15 $15.12 $15.68
Portland, OR $24.05 $24.16 $24.51 $24.65 $24.92
Providence, RI $17.15 $17.55 $17.97 $18.34 $17.98
Raleigh/Durham, NC $20.69 $20.69 $21.21 $21.51 $21.42
Reno, NV $19.46 $19.49 $19.46 $19.50 $19.59
Richmond, VA $18.20 $18.38 $18.51 $18.76 $18.88
Rochester, NY $13.60 $13.61 $13.60 $13.62 $13.84
Sacramento, CA $21.61 $21.45 $21.51 $21.50 $21.58
Saint Louis, MO $15.57 $15.52 $15.41 $15.30 $15.20
Salt Lake City, UT $19.76 $19.90 $20.26 $20.44 $20.63
San Antonio, TX $18.86 $19.00 $18.98 $19.19 $19.29
San Diego, CA $29.85 $29.89 $29.91 $29.74 $30.09
San Francisco, CA $43.93 $43.85 $43.33 $42.75 $42.15
San Jose, CA $37.96 $38.04 $37.79 $38.23 $38.39
Sarasota, FL $18.68 $18.82 $18.83 $18.89 $18.90
Seattle, WA $26.27 $26.35 $26.46 $26.58 $27.07
Tampa, FL $19.24 $19.36 $19.67 $19.69 $19.77
Tucson, AZ $16.86 $17.00 $17.25 $17.28 $17.34
Tulsa, OK $12.52 $12.60 $12.65 $12.88 $13.22
Washington, DC $29.36 $29.31 $29.14 $29.26 $28.93
U.S. Shopping Center Markets Q1 2020 Q2 2020 Q3 2020 Q4 2020 Q1 2021pUnited States $20.34 $20.39 $20.39 $20.43 $20.57
Northeast $21.48 $21.45 $21.14 $21.04 $21.13
Midwest $16.11 $16.14 $16.05 $16.03 $16.07
South $19.79 $19.86 $19.90 $20.05 $20.16
West $24.01 $24.06 $24.12 $24.18 $24.41

M A R K E T B E AT M A R K E T B E AT
cushmanwakefield.com | 6
U.S. NATIONAL Inventory Q1 2021U.S. Shopping Center Markets Inventory Deliveries YTD 2021 Under Construction
as of Q1 2021pUnited States 4,209,707,109 1,917,127 10,715,903
Northeast 510,795,461 174,624 1,116,393
Midwest 811,037,403 15,654 453,402
South 1,716,753,865 1,064,972 6,157,083
West 1,171,120,380 661,877 2,989,025
Overall
U.S. Shopping Center Markets Inventory Deliveries YTD 2021 Under Construction as of Q1 2021p
Akron, OH 18,695,302 0 0
Albany, NY 16,609,847 0 0
Albuquerque, NM 20,694,100 0 35,254
Atlanta, GA 166,750,843 36,000 1,266,571
Austin, TX 50,353,707 125,056 168,331
Bakersfield, CA 13,608,386 27,155 6,346
Baltimore, MD 57,495,636 11,593 77,000
Birmingham, AL 28,815,198 51,100
Boise, ID 16,929,873 13,750 346,870
Boston, MA 72,296,271 48,050 368,850
Boulder, CO 8,530,588 0 0
Buffalo, NY 24,329,750 0 32,184
Charleston, SC 19,639,805 15,176 17,028
Charlotte, NC 60,836,010 88,035 57,786
Chicago, IL 197,317,914 6,700 98,687
Cincinnati, OH 44,885,274 63,305 28,525
Cleveland, OH 55,156,291 0 28,000
Colorado Springs, CO 21,162,741 8,000 73,720
Columbia, SC 18,025,421 0 0
Columbus, OH 51,679,753 14,938 0
Dallas/Ft. Worth, TX 192,709,469 183,845 708,974
Dayton, OH 20,886,359 (56,000) 0
Denver, CO 74,677,709 0 82,520
Des Moines, IA 11,045,948 35,688 0
Detroit, MI 95,893,339 0 117,498
East Bay, CA 48,179,512 15,681 69,906
El Paso, TX 21,013,759 0 90,555
Fort Lauderdale, FL 53,437,409 4,200 127,650
Fort Myers/Naples, FL 22,635,860 2,790 0
Grand Rapids, MI 17,608,443 0 0
Greensboro, NC 19,782,991 0 0
Greenville, SC 24,906,312 0 0
Hartford, CT 28,131,148 35,484 113,369
Hawaii 12,874,845 19,000 0
Houston, TX 190,374,771 158,073 676,084
Indianapolis, IN 50,805,180 0 7,200
Inland Empire, CA 113,994,035 186,540 297,345
Jacksonville, FL 44,635,360 18,400 237,992
Kansas City, MO 53,413,978 11,200 21,640
Knoxville, TN 23,514,535 10,000 41,745
Lansing, MI 8,927,932 0 0
Las Vegas, NV 66,479,557 45,900 68,289
Overall
U.S. Shopping Center Markets Inventory Deliveries YTD 2021 Under Construction as of Q1 2021p
Los Angeles, CA 162,897,945 145,480 357,607
Louisville, KY 30,666,024 7,000 0
Memphis, TN 37,684,018 0 302,298
Miami, FL 51,770,808 53,782 496,276
Milwaukee, WI 29,725,720 0 0
Minneapolis, MN 64,830,750 (62,006) 0
Montgomery, AL 9,107,862 0 0
Nashville, TN 39,326,513 0 116,987
New Haven, CT 19,614,240 4,500 0
New Orleans, LA 23,311,901 4,600 0
New York City Metro, NY 120,669,705 21,505 255,400
Norfolk, VA 49,676,776 6,000 55,020
Northwest Arkansas 7,500,778 36,250 0
Oklahoma City, OK 33,559,026 11,828 57,135
Omaha, NE 21,979,385 1,829 96,382
Orange County, CA 79,964,484 3,000 52,568
Orlando, FL 65,769,261 66,392 253,690
Palm Beach, FL 38,664,221 0 352,476
Philadelphia, PA 123,363,866 65,085 158,090
Phoenix, AZ 138,408,739 77,449 403,219
Pittsburgh, PA 49,216,220 0 100,000
Portland, OR 48,105,374 19,700 132,339
Providence, RI 33,273,339 0 0
Raleigh/Durham, NC 38,188,932 7,800 33,065
Reno, NV 14,794,441 10,431 110,143
Richmond, VA 36,035,367 96,200 61,592
Rochester, NY 23,291,075 0 88,500
Sacramento, CA 59,978,075 56,313 263,939
Saint Louis, MO 68,185,835 0 55,470
Salt Lake City, UT 27,843,907 0 239,774
San Antonio, TX 56,402,635 49,225 144,802
San Diego, CA 67,315,646 14,843 147,600
San Francisco, CA 11,742,644 0 0
San Jose, CA 36,133,745 0 106,136
Sarasota, FL 21,000,959 0 60,088
Seattle, WA 65,919,246 0 136,555
Tampa, FL 69,325,873 31,760 107,671
Tucson, AZ 27,325,762 6,807 1,760
Tulsa, OK 25,003,289 37,050 0
Washington, DC 122,391,562 15,745 652,302

About Cushman & Wakefield
Cushman & Wakefield (NYSE: CWK) is a leading global real estate services firm that delivers exceptional value for real estate occupiers and owners. Cushman & Wakefield is among the largest real estate services firms with approximately 50,000 employees in 400 offices and 60 countries. In 2020, the firm had revenue of $7.8 billion across core services of property, facilities and project management, leasing, capital markets, valuation and other services. To learn more, visit www.cushmanwakefield.com or follow @CushWake on Twitter.
©2021 Cushman & Wakefield. All rights reserved. The information contained within this report is gathered from multiple sources believed to be reliable. The information may contain errors or omissions and is presented without any warranty or representations as to its accuracy.
p = preliminary
Our statistical coverage includes community/neighborhood, power/regional, and strip centers. It does not include malls, outlet centers, theme retail centers, airport retail or freestanding retail product. Methodolgy Cushman & Wakefield’s quarterly estimates are derived from a variety of data sources, including our own proprietary database as well as data from reliable third-party data sources. The market statistics are calculated from a base shopping center inventory comprised of properties deemed ot be competitive in the respective local market. The inventory is subject to revisions due to resampling. Vacant space is defined as space that is available immediately or imminently after the end of the quarter. The figures provided for the current quarter are preliminary and all information contained in this report is subject to correction of errors and revisions based on the receipt of additional pertinent data.
Ken McCarthy Economist / Retail Lead, Global Research [email protected]