Embed Size (px)
Citation preview

ST. JOHN’S, NLOFFICE Q3 2016
MARKETBEAT
Economic Indicators
Market Indicators
Overall Net Absorption/Overall Asking Rent
4Q TRAILING AVERAGE
Overall Vacancy
cushmanwakefield.com
EconomyIn the provincial budget that was presented last spring, the
finance minister indicated there would be a “supplemental
budget” in the fall which would contain additional measures to
battle the deficit; currently estimated at $1.8 billion. It was
widely anticipated that this budget would announce further cost
cutting in the form of lay-offs, as tax and fee increases were
presented in the spring budget. However, both the finance
minister and the Premier of Newfoundland & Labrador are now
referring to a “fiscal update” – which begs the question as to
whether there will be additional actions taken or if there will be a
continuation of the consultation processes that are currently
underway.
There is some hope that the recent increase in the price of oil will
allow for a reduction in the additional gas tax of 16.5 cents a litre
that was imposed in the spring budget.
Market OverviewThe downtown office market continued its decline from the fairly
recent days of near 0% vacancy and sharply rising rental rates.
Sublease space continues to come on the market – with an
entire floor occupied by Seadrill located at Fortis Place, a
downtown class A property, being the latest casualty of the
downturn in the oil industry.
The much anticipated expansion of Scotia Centre at 235 Water
Street was completed this quarter – adding almost 30,000
square feet (sf) of class A office and retail space to the
downtown market. Central class A vacancy now sits at 13.3%,
with sublease space comprising nearly a third of what is
available overall. Vacancy in the overall St. John’s market is up
nearly two full percentage points from last quarter to 15.7%.
Face rental rates are holding in the new buildings, but are
softening in class C buildings in the North region and class B
buildings in the East West areas.
OutlookNegotiations for leases by some larger tenants are nearing
completion, which will result in stronger absorption figures next
quarter; particularly for new and nearly new space in the east
end area of the city near the airport. In addition, there are some
confirmed and rumoured office tenants in the market with
requirements of 5,000-10,000 sf that are actively looking to
relocate.
This optimism is tempered somewhat as there are additional
large vacancies anticipated to come on the market in the
downtown, with both the English School Board and Suncor
announcing their intention to relocate.
Q3 15 Q3 1612-Month Forecast
St. John’s Employment 116k 118.5k
St. John’s Unemployment 6.3% 6.7 %
Canada Unemployment 7.0% 7.0%
Q3 15 Q3 1612-Month Forecast
Overall Vacancy 12.8% 15.7%
Net Absorption (sf) (15,252) (35,847)
Under Construction (sf) 141,600 158,000
Average Asking Rent* $34.79 $35.19
0%
2%
4%
6%
8%
10%
12%
14%
16%
18%
2010 2011 2012 2013 2014 2015 Q3 2016
ST. JOHN’S OFFICE
Historical Average = 7.0%
$10
$20
$30
$40
-100,000
-50,000
0
50,000
100,000
150,000
200,000
2010 2011 2012 2013 2014 2015 Q3 2016
Net Absorption, SF Asking Rent, $ PSF
*Rental rates reflect gross asking $psf/year

ST. JOHN’S, NLOFFICE Q3 2016
MARKETBEAT
Cushman & Wakefield
49 Elizabeth Avenue, Suite 302
P.O. Box 1135
St. John’s, NL A1C 5M5
www.cushmanwakefield.com
For more information, contact:
Joanne Earle,
Research/Commercial Sales &
Leasing
Tel: +1 709 576 3777
About Cushman & WakefieldCushman & Wakefield is a leading global real estate services firm that helps clients transform the way people work, shop, and live.
The firm’s 43,000 employees in more than 60 countries provide deep local and global insights that create significant value for
occupiers and investors around the world. Cushman & Wakefield is among the largest commercial real estate services firms with
revenue of $5 billion across core services of agency leasing, asset services, capital markets, facility services (C&W Services), global
occupier services, investment & asset management (DTZ Investors), project & development services, tenant representation, and
valuation & advisory. To learn more, visit www.cushmanwakefield.com or follow @CushWake on Twitter.
Copyright © 2016 Cushman & Wakefield. All rights reserved. The information contained within this report is gathered from multiple
sources considered to be reliable. The information may contain errors or omissions and is presented without any warranty or
representations as to its accuracy.
SUBMARKETTOTAL BLDGS
INVENTORY (SF)
SUBLET VACANT
(SF)
DIRECT VACANT
(SF)
OVERALL VACANCY RATE
CURRENT NET ABSORPTION
(SF)
YTDOVERALL NET
ABSORPTION (SF)
UNDER CNSTR (SF)
OVERALL AVERAGE
ASKING RENT (ALL CLASSES)*
OVERALL AVERAGE
ASKING RENT (CLASS A)*
Downtown 14 1,664,965 60,303 233,770 17.7% (20,487) (39,774) 0 $ 42.07 $ 45.97
Central 10 355,354 0 44,082 12.4% 2,321 1,375 0 $25.93 n/a
North 25 728,440 23,848 94,606 16.3% (18,015) (15,500) 90,000 $ 29.24 n/a
East & West 24 937,672 12,969 108,041 12.9% 334 (10,541) 54,000 $ 29.32 n/a
“ST. JOHN’S TOTALS 73 3,686,431 97,120 480,499 15.7% (35,847) (64,440) 144,000 $ 35.19 $ 45.97
Key Lease Transactions Q3 2016
PROPERTY SF TENANT TRANSACTION TYPE SUBMARKET
238 Torbay Road 4,500 Coldwell Banker ProCo Lease East/West
Key Sales Transactions Q3 2016
PROPERTY SF SELLER/BUYER PRICE / $PSF SUBMARKET
238 Torbay Road 9,000 Steers Insurance/WLH Holdings $ 1,600,000 /$177 East/West
SUMMARY BY CLASSTOTAL BLDGS
INVENTORY (SF)SUBLET
VACANT (SF)DIRECT
VACANT (SF)
OVERALL VACANCY
RATE
CURRENT NETABSORPTION
(SF)
YTD OVERALL NET
ABSORPTION (SF)
UNDER CNSTR (SF)
YTDCNSTR
COMPLETIONS (SF)
AVERAGE ASKING RENT
OVERALL*
Class A 6 963,765 40,250 88,401 13.3% (17,844) (7,074) 54,000 28,792 $ 45.97
Class B 36 1,605,070 44,397 178,176 13.9% (16,644) (42,915) 90,000 0 $ 33.97
Class C 31 1,117,596 12,473 213,922 20.3% (1,359) (14,451) 0 0 $ 26.19
*Rental rates reflect gross asking $psf/year
*Rental rates reflect gross asking $psf/year
Cushman Wakefield Atlantic Greater St. John's Office Market Survey
3rd Quarter - September 2016(709) 576-3777
Q3 2016 Downtown Central North East/West TOTAL MARKET
Area (Square Feet) 1,664,965 355,354 728,440 937,672 3,686,431
Direct Vacant Space (Square Feet) 233,770 44,082 94,606 108,041 480,499
Sublet Space (Square Feet) 60,303 0 23,848 12,969 97,120
Total Vacancy 294,073 44,082 118,454 121,010 577,619
Total Vacancy Rate 17.7% 12.4% 16.3% 12.9% 15.7%
Direct Vacancy Rate 14.0% 12.4% 13.0% 11.5% 13.0%
Occupied Space (including sublet) 1,431,195 311,272 633,834 829,631 3,205,932
Occupied Space (excluding sublet) 1,370,892 311,272 609,986 816,662 3,108,812
New Supply Q3 28,792 0 0 0 28,792
New Supply YTD 28,792 0 0 0 28,792
Weighted Average Rent $26.47 $15.57 $18.60 $17.88 $21.89
Weighted Average CAM/Taxes $15.59 $10.36 $10.64 $11.45 $13.30
Gross Rent $42.07 $25.93 $29.24 $29.32 $35.19
3 Month Absorption (sublet as occupied) 1,884 2,321 -3,015 -4,131 -2,941
YTD Absorption (sublet included with occupied) -47,610 1,375 -2,500 -17,006 -65,741
3 month Absorption (sublet as vacant) -20,487 2,321 -18,015 334 -35,847
YTD Absorption (sublet as vacant) -39,774 1,375 -15,500 -10,541 -64,440
Demand Factor 0.13% 0.75% -0.47% -0.50% -0.09%
Q2 2016 Downtown Central North East/West TOTAL MARKET
Area (Square Feet) 1,636,173 355,354 721,870 937,672 3,651,069
Direct Vacant Space (Square Feet) 206,862 46,403 85,021 103,910 442,196
Sublet Space (Square Feet) 37,932 0 8,848 17,434 64,214
Total Vacancy 244,794 46,403 93,869 121,344 506,410
Total Vacancy Rate 15.0% 13.1% 13.0% 12.9% 13.9%
Direct Vacancy Rate 12.6% 13.1% 11.8% 11.1% 12.1%
Occupied Space (including sublet) 1,429,311 308,951 636,849 833,762 3,208,873
Occupied Space (excluding sublet) 1,391,379 308,951 628,001 816,328 3,144,659
New Supply Q2 0 0 0 0 0
New Supply YTD 0 0 0 0 0
Weighted Average Rent $26.00 $15.57 $18.79 $18.68 $21.87
Weighted Average CAM/Taxes $15.56 $10.36 $10.65 $11.43 $13.27
Gross Rent $41.56 $25.93 $29.44 $30.11 $35.14
3 Month Absorption (sublet as occupied) -34,641 494 1,942 -12,875 -45,080
YTD Absorption (sublet included with occupied) -49,494 -946 515 -12,875 -62,800
3 month Absorption (sublet as vacant) -6,934 494 -457 -10,875 -17,772
YTD Absorption (sublet as vacant) -19,287 -946 2,515 -10,875 -28,593
Demand Factor -2.37% 0.16% 0.31% -1.52% -1.39%
Q1 2016 Downtown Central North East/West TOTAL MARKET
Area (Square Feet) 1,636,173 355,354 721,870 937,672 3,651,069
Direct Vacant Space (Square Feet) 172,221 46,897 86,963 91,035 397,116
Sublet Space (Square Feet) 65,639 0 6,449 19,434 91,522
Total Vacancy 237,860 46,897 93,412 110,469 488,638
Total Vacancy Rate 14.5% 13.2% 12.9% 11.8% 13.4%
Direct Vacancy Rate 10.5% 13.2% 12.0% 9.7% 10.9%
Occupied Space (including sublet) 1,463,952 308,457 634,907 846,637 3,253,953
Occupied Space (excluding sublet) 1,398,313 308,457 628,458 827,203 3,162,431
New Supply Q1 0 0 0 0 0
New Supply YTD 0 0 0 0 0
Weighted Average Net Rent $26.11 $15.57 $18.79 $18.82 $21.96
Weighted Average CAM/Taxes $15.53 $10.36 $10.66 $10.88 $13.13
Weighted Average Gross Rent $41.64 $25.93 $29.45 $29.70 $35.09
3 Month Absorption (sublet as occupied) -14,853 -1,440 -1,427 0 -17,720
YTD Absorption (sublet included with occupied) -14,853 -1,440 -1,427 0 -17,720
3 month Absorption (sublet as vacant) -12,353 -1,440 2,972 0 -10,821
YTD Absorption (sublet as vacant) -12,353 -1,440 2,972 0 -10,821
Demand Factor -1.00% -0.46% -0.22% 0.00% -0.54%
Q4 2015 Downtown Central North East/West TOTAL MARKET
Area (Square Feet) 1,625,244 352,628 721,870 937,672 3,637,414
Direct Vacant Space (Square Feet) 157,488 45,457 85,536 91,035 379,516
Sublet Space (Square Feet) 68,139 0 10,848 19,434 98,421
Total Vacancy 225,627 45,457 96,384 110,469 477,937
Total Vacancy Rate 13.9% 12.9% 13.4% 11.8% 13.1%
Direct Vacancy Rate 9.7% 12.9% 11.8% 9.7% 10.4%
Occupied Space (including sublet) 1,467,756 307,171 636,334 846,637 3,257,898
Occupied Space (excluding sublet) 1,399,617 307,171 625,486 827,203 3,159,477
New Supply Q4 0 0 0 35,000 35,000
New Supply YTD 0 0 44,000 35,000 79,000
Weighted Average Rent $26.05 $16.00 $18.68 $18.29 $21.81
Weighted Average CAM/Taxes $14.65 $10.17 $10.46 $10.14 $12.51
Gross Rent $40.71 $26.17 $29.14 $28.43 $34.32
3 Month Absorption (sublet as occupied) -21,068 12,959 -9,214 33,243 15,920
YTD Absorption (sublet included with occupied) -55,467 -3,480 2,458 45,342 -11,147
3 month Absorption (sublet as vacant) -21,068 12,959 -9,214 28,693 11,370
YTD Absorption (sublet as vacant) -98,292 -3,480 -8,390 26,637 -83,525
Demand Factor -1.42% 4.40% -1.43% 4.09% 0.49%
The information contained herein was obtained from sources deemed reliable, and while thought to be correct, is not guaranteed by Cushman Wakefield Atlantic.
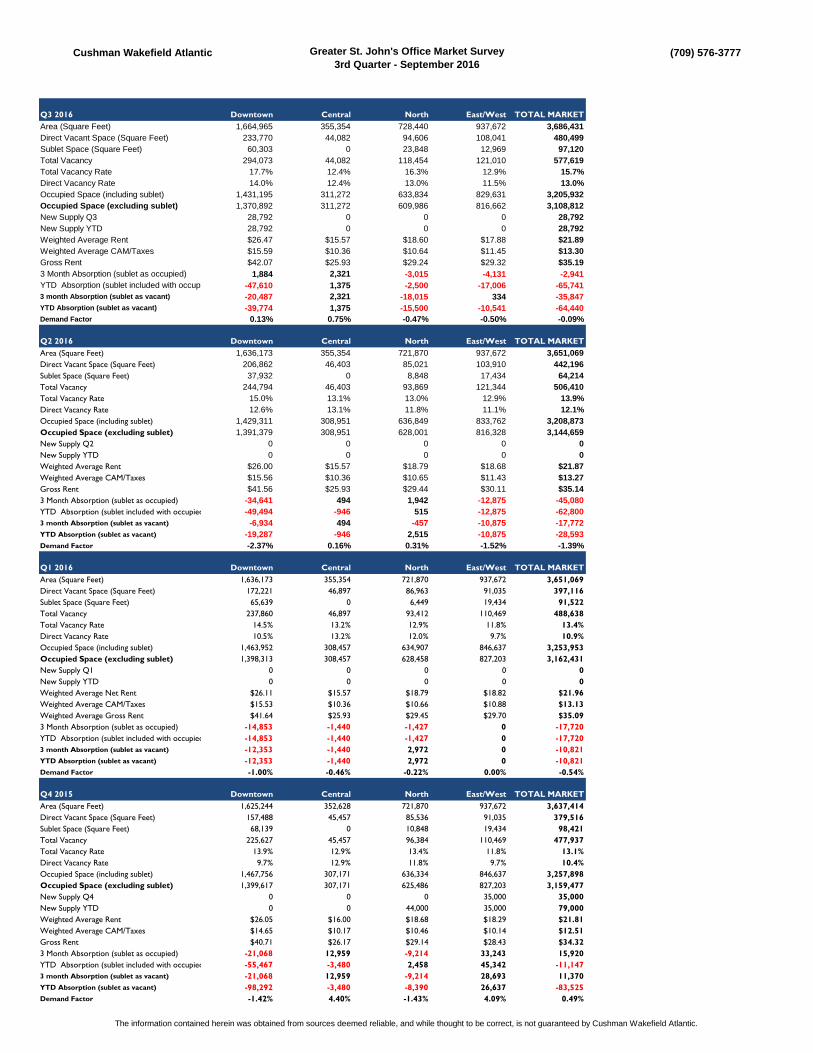
Greater St. John's Office Market Survey
3rd Quarter - September 2016
$1.00
$11.00
$21.00
$31.00
$41.00
$51.00
Class A Class B Class C
$28.38 $21.30
$16.48
$17.60
$12.67
$9.71
Net Rent & Operating Costs
per sq.ft.
Building Class
3rd Quarter 2016 Net Rent & Operating Costs
St. John's, NL
Net Rent Operating Costs
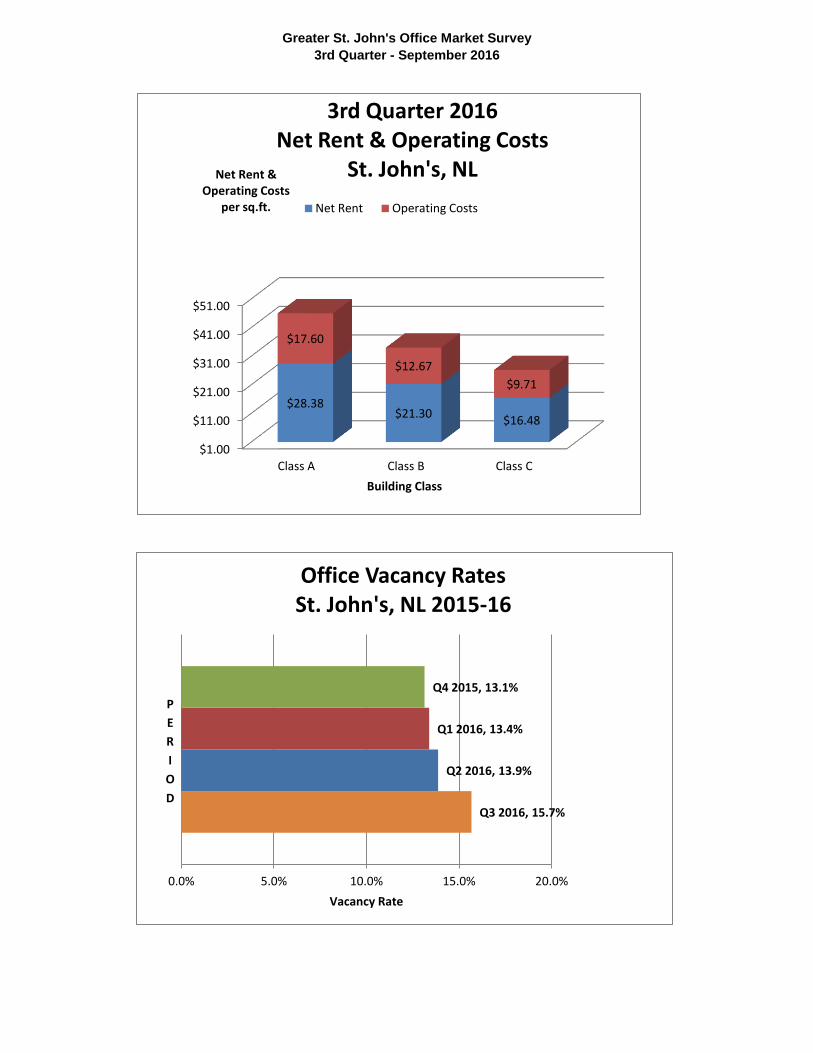
Q3 2016, 15.7%
Q2 2016, 13.9%
Q1 2016, 13.4%
Q4 2015, 13.1%
0.0% 5.0% 10.0% 15.0% 20.0%
Vacancy Rate
P
E
R
I
O
D
Office Vacancy Rates St. John's, NL 2015-16

CUSHMAN WAKEFIELD ATLANTIC Greater St. John's Office Market Survey
3rd Quarter - September 2016
DOWNTOWN
(709) 576-3777
Downtown Class "A"
Building Address Class Year G.L.A.
Direct
Vacant
Direct
Vac% Net Rent Oper. Costs Gross Rent
Sublease
Space (sf)
Total
Vacant
Space (sf)
Direct
Occupied
Space (sf)
Overall
Occupied
Space (sf)
Direct
Absorption
Overall
Absorption New Supply
Baine Johnston Centre 10 Fort William Place A 1987 97,778 0 0.0% $24.00 $14.50 $38.50 0 0 97,778 97,778 4,527 4,527 0
Cabot Place 1 100 New Gower Street A 1987 132,815 1,250 0.9% $23.00 $18.49 $41.49 0 1,250 131,565 131,565 0 0 0
III Fifty One 351 Water Street A 2014 181,792 0 0.0% $34.50 $19.34 $53.84 0 0 181,792 181,792 0 0 0
Fortis Place 5 Springdale Street A 2014 143,562 40,620 28.3% $28.00 $20.13 $48.13 34,701 75,321 102,942 68,241 0 -16,822 0
Scotia Centre 235 Water Street A 1987 219,648 46,531 21.2% $32.50 $17.61 $50.11 0 46,531 173,117 173,117 0 0 28,792
Fort William Building Factory Lane A 1981 188,170 0 0.0% $24.00 $14.95 $38.95 5,549 5,549 188,170 182,621 0 -5,549 0
Current Quarter 963,765 88,401 9.2% $28.38 $17.60 $45.97 40,250 128,651 875,364 835,114 4,527 -17,844 28,792
2nd Quarter 2016 934,973 64,136 6.9% $28.25 $17.60 $45.85 17,879 82,015 870,837 852,958 -9,090 10,770
1st Quarter 2016 934,973 55,046 5.9% $28.25 $17.55 $45.79 37,739 92,785 879,927 842,188 0 0 0
4th Quarter 2015 924,044 55,046 6.0% $28.15 $15.75 $43.90 37,739 92,785 868,998 831,259 -5,047 -5,047 0
3rd Quarter 2015 924,044 49,999 5.4% $29.36 $15.75 $45.11 37,739 87,738 874,045 836,306 -2,240 -2,240 0
2nd Quarter 2015 924,044 40,667 4.8% $29.36 $15.75 $45.11 37,739 85,505 879,238 838,539 -5,094 -25,905 0
YTD -4,563 -7,074 28,792
Downtown Class "B"
Building Address Class Year G.L.A.
Direct
Vacant
Direct
Vac% Net Rent Oper. Costs Gross Rent
Sublease
Space (sf)
Total
Vacant
Space (sf)
Direct
Occupied
Space (sf)
Overall
Occupied
Space (sf)
Direct
Absorption
Overall
Absorption New Supply
Atlantic Place 215 Water Street B 1974 342,930 27,636 0 $24.00 $11.50 $35.50 3,213 30,849 315,294 312,081 0 0 0
TD Place 140 Water Street B 1982 93,129 8,778 0 $27.00 $18.87 $45.87 11,493 20,271 84,351 72,858 -2,643 -2,643 0
Fortis Building 139 Water Street B 1969/1991 82,325 57,156 69.4% $27.00 $18.73 $45.73 0 57,156 25,169 25,169 0 0 0
Current Quarter 518,384 93,570 18.1% $25.02 $13.97 $38.99 14,706 108,276 424,814 410,108 -2,643 -2,643 0
2nd Quarter 2016 518,384 90,927 17.5% $23.86 $13.97 $37.83 14,706 105,633 427,457 412,751 -12,067 -12,067 0
1st Quarter 2016 518,384 78,860 15.2% $23.86 $13.97 $37.83 14,706 93,566 439,524 424,818 -4,085 -4,085 0
4th Quarter 2015 518,384 74,775 14.4% $23.86 $13.97 $37.83 14,706 89,481 443,609 428,903 -13,321 -13,321 0
3rd Quarter 2015 518,384 61,454 11.9% $24.18 $13.97 $38.15 14,706 76,160 456,930 442,224 -9,932 -18,100 0
2nd Quarter 2015 518,384 51,522 9.9% $24.18 $13.97 $38.15 6,538 58,060 466,862 460,324 11,853 11,853 0
YTD -18,795 -18,795 0
Downtown Class "C"
Building Address Class Year G.L.A.
Direct
Vacant
Direct
Vac% Net Rent Oper. Costs Gross Rent
Sublease
Space (sf)
Total
Vacant
Space (sf)
Direct
Occupied
Space (sf)
Overall
Occupied
Space (sf)
Direct
Absorption
Overall
Absorption New Supply
Bowring Downtown Centre 277-281 Water Street C 1960 36,000 2,580 7.2% $15.00 $13.00 $28.00 0 2,580 33,420 33,420 0 0 0
Eclipse Building 354 Water Street C 1960 66,000 10,457 15.8% $25.00 $9.51 $32.50 0 10,457 55,543 55,543 0 0 0
430 - 434 Water Street 430 - 434 Water Street C 1966 22,250 7,847 35.3% $15.50 $9.20 $24.70 5,347 13,194 14,403 9,056 0 0 0
Cormack Building 2 Steers Cove Road C 1983 38,419 10,768 28.0% $24.00 $10.00 $34.00 0 10,768 27,651 27,651 0 0 0
152 Water Street 152 Water Street C 1956 20,147 20,147 100.0% $15.00 $3.75 $21.00 20,147 0 0 0 0 0
Current Quarter 182,816 51,799 16.8% $23.23 $9.86 $33.09 5,347 57,146 131,017 125,670 0 0 0
2nd Quarter 2016 182,816 51,799 16.8% $23.23 $9.86 $33.09 5,347 57,146 131,017 125,670 -13,484 -5,637
1st Quarter 2016 182,816 38,315 16.8% $23.23 $9.86 $33.09 13,194 51,509 144,501 131,307 -10,768 -8,268 0
4th Quarter 2015 182,816 27,667 16.8% $23.23 $9.86 $33.09 15,694 43,361 155,149 139,455 -2,700 -2,700 0
3rd Quarter 2015 182,816 24,967 16.8% $23.23 $9.86 $33.09 15,694 40,661 157,849 142,155 0 0 0
2nd Quarter 2015 182,816 30,690 16.8% $23.23 $9.86 $33.09 15,694 46,384 152,126 136,432 0 0 0
YTD -24,252 -13,905 0
Downtown Market Totals
Total Class A Class B Class C
Area (Square Feet): 1,664,965 963,765 518,384 182,816
Direct Vacant (Sq. Ft.): 233,770 88,401 93,570 51,799
Sublet Vacant Space (Sq. Ft.): 60,303 40,250 14,706 5,347
Total Vacancy : 294,073 128,651 108,276 57,146
Direct Vacancy Rate (%): 14.0% 9.2% 18.1% 28.3%
Total Vacancy Rate (Percent): 17.7% 13.3% 20.9% 31.3%
Occupied Space (Sq. Ft.) (inc.sublet): 1,431,195 875,364 424,814 131,017
Occupancy Rate (%): (inc.sublet) 86.0% 90.8% 81.9% 71.7%
Occupied Space (exc.sublet) 1,370,892 835,114 410,108 125,670
Occupancy Rate % (exc. Sublet) 82.3% 86.7% 79.1% 68.7%
Weighted Average Net Asking Rent $26.47 $28.38 $25.02 $23.23
Weighted Average CAM $15.59 $17.60 $13.97 $9.86
Gross Rent $42.07 $45.97 $38.99 $33.09
New Supply (Current Quarter) 28,792 28,792 0 0
New Supply (YTD) 28,792 28,792 0 0
3 Month Absorption (excluding Sublet) 1,884 4,527 -2,643 0
YTD Absorption (excluding Sublet) -47,610 -4,563 -18,795 -24,252
3 month Absorption (including Sublet) -20,487 -17,844 -2,643 0
YTD Absorption (including Sublet) -39,774 -7,074 -18,795 -13,905
Demand Factor 0.13% 0.5% -0.6% 0.0%
The information contained herein was obtained from sources deemed reliable and while thought to be correct, is not guaranteed by Cushman Wakefield Atlantic.

Cushman Wakefield Atlantic Greater St. John's Office Market Survey
3rd Quarter - September 2016
CENTRAL
(709) 576-3777
Class "B"
Building Address Class Year G.L.A.
Direct
Vacant Direct Vac% Net Rent Oper. Costs Gross Rent
Sublease
Space (sf)
Total
Vacant
Space (sf)
Direct
Occupied
Space (sf)
Overall
Occupied
Space (sf)
Direct
Absorption
Overall
Absorption New Supply
Beothuk Building 20 Crosbie Place B 1978 40,565 0 0.0% $15.36 $12.75 $28.11 0 0 40,565 40,565 0 0 0
Paramount Bldg 34 Harvey Road B 1960 39,008 1,440 3.7% $18.00 $14.43 $32.43 0 1,440 37,568 37,568 0 0 0
Current Quarter 79,573 1,440 1.8% $16.65 $13.57 $30.23 0 1,440 78,133 78,133 0 0 0
2nd Quarter 2016 79,573 1,440 1.8% $16.65 $13.57 $30.23 0 1,440 78,133 78,133 0 0 0
1st Quarter 2016 79,573 1,440 1.8% $16.65 $13.57 $30.23 0 1,440 78,133 78,133 -1,440 -1,440 0
4th Quarter 2015 79,573 0 0.0% $17.96 $12.84 $30.80 0 0 79,573 79,573 290 290 0
3rd Quarter 2015 79,573 290 0.4% $17.96 $12.84 $30.80 0 290 79,283 79,283 0 0 0
2nd Quarter 2015 79,573 290 0.4% $17.96 $12.84 $30.80 0 290 79,283 79,283 0 0 0
*Remove fr Survey Q1 2014
YTD -1,440 -1,440 0
Class "C"
Building Address Class Year G.L.A.
Direct
Vacant Direct Vac% Net Rent Oper. Costs Gross Rent
Sublease
Space (sf)
Total
Vacant
Space (sf)
Direct
Occupied
Space (sf)
Overall
Occupied
Space (sf)
Direct
Absorption
Overall
Absorption New Supply
Kenmount Business Centre Bldg 66 Kenmount Road C 1976 41,455 18,642 45.0% $20.00 $9.00 $29.00 0 18,642 22,813 22,813 0 0 0
Crosbie Building 1 Crosbie Place C 1966 26,726 0 0.0% $15.21 $9.91 $25.12 0 0 26,726 26,726 2,321 2,321 0
251 Empire Avenue 251 Empire Avenue C 1981 26,000 0 0.0% $20.00 $11.00 $31.00 0 0 26,000 26,000 0 0 0
Bonaventure Place 95 Bonaventure Avenue C 1970 28,700 0 0.0% $19.50 $5.50 $25.00 0 0 28,700 28,700 0 0 0
Viking Building 136 Crosbie Road C 1972 69,000 0 0.0% $14.00 $11.59 $25.59 0 0 69,000 69,000 0 0 0
The Belvedere 57 Margaret's Place C 20,000 20,000 100.0% $8.00 0 20,000 0 0 0 0 0
20 Cordage Place 20 Cordage Place C 1975 38,000 0 0.0% $10.62 $6.43 $17.05 0 0 38,000 38,000 0 0 0
50 Mundy Pond Road 50 Mundy Pond Road C 1974 25,900 4,000 15.4% $14.00 0 4,000 21,900 21,900 0 0 0
Current Quarter 275,781 42,642 15.5% $15.26 $9.25 $24.50 0 42,642 233,139 233,139 2,321 2,321 0
2nd Quarter 2016 275,781 44,963 16.3% $15.26 $9.25 $24.50 0 44,963 230,818 230,818 494 494 0
1st Quarter 2016 275,781 45,457 16.5% $15.26 $9.25 $24.50 0 45,457 230,324 230,324 0 0 0
4th Quarter 2015 273,055 45,457 16.6% $15.43 $9.24 $24.67 0 45,457 227,598 227,598 12,669 12,669 0
3rd Quarter 2015 273,055 58,126 21.3% $15.43 $9.13 $24.56 0 58,126 214,929 214,929 -5,520 -5,520 0
2nd Quarter 2015 273,055 52,606 19.3% $15.34 $9.32 $24.66 0 52,606 220,449 220,449 -12,626 -12,626 0
YTD 2,815 2,815 0
Central Market Totals
Total Class A Class B Class C
Area (Square Feet): 355,354 0 79,573 275,781
Direct Vacant (Sq Ft): 44,082 0 1,440 42,642
Sublet Vacant Space (Sq Ft): 0 0 0 0
Total Vacancy : 44,082 0 1,440 42,642
Total Vacancy Rate (%): 12.4% N/A 1.8% 15.5%
Direct Vacancy Rate (%): 12.4% N/A 1.8% 15.5%
Occupied Space (Sq. Ft.) (inc.sublet): 311,272 0 78,133 233,139
Occupancy Rate (%): (inc.sublet) 87.6% N/A 98.2% 84.5%
Occupied Space (exc.sublet) 311,272 0 78,133 233,139
Occupancy Rate % (exc. Sublet) 87.6% N/A 98.2% 84.5%
Weighted Average Net Rent $15.57 N/A $16.65 $15.26
Weighted Average CAM $10.36 N/A $13.57 $9.25
Gross Rent $25.93 N/A $30.23 $24.50
New Supply (Current Quarter) 0 N/A 0 0
New Supply (YTD) 0 N/A 0 0
3 Month Absorption (including sublet) 2,321 N/A 0 2,321
YTD Absorption (including sublet) 1,375 N/A -1,440 2,815
3 month Absorption (exc.sublet) 2,321 N/A 0 2,321
YTD Absorption (exc. Sublet) 1,375 N/A -1,440 2,815
Demand Factor 0.75% N/A 0.00% 1.01%
The information contained herein was obtained from sources deemed reliable and while thought to be correct, is not guaranteed by Cushman Wakefield Atlantic.

CUSHMAN WAKEFIELD ATLANTIC Greater St. John's Office Market Survey
3rd Quarter - September 2016
NORTH
(709) 576-3777
Class "B"
Building Address Class Year G.L.A. Direct Vacant Direct Vac% Net Rent 2014 Assess Prop. Tax Oper. Costs Gross Rent
Sublease
Space (sf)
Total Vacant
Space (sf)
Direct
Occupied
Space (sf)
Overall
Occupied
Space (sf)
Direct
Absorption
Overall
Absorption New Supply
Investors Group Building 33 Pippy Place B 1986 26,332 10,460 39.7% $15.48 $3,500,000.00 $3.17 $11.05 $26.53 0 10,460 15,872 15,872 0 0 0
Ultramar Building 39-41 Pippy Place B 1984 23,000 0 0.0% $16.00 $3,000,000.00 $10.00 $26.00 0 0 23,000 23,000 0 0 0
Robinson Blackmore Building 36 Austin Street B 1989 37,000 0 0.0% $12.00 $3,900,000.00 $6.00 $18.00 0 0 37,000 37,000 0 0 0
Wedgewood Building 85 Thorburn Street B 18,692 0 0.0% $13.00 $2,000,000.00 $8.00 $21.00 0 0 18,692 18,692 0 0 0
The Office Pavillion 44 Austin Street B 1990 24,678 0 0.0% $17.25 $3,800,000.00 $4.92 $8.95 $26.20 0 0 24,678 24,678 0 0 0
North Atlantic Building 29-31 Pippy Place B 1976 43,737 11,899 27.2% $4,500,000.00 $25.00 0 11,899 31,838 31,838 0 0 0
Bristol Court I 145 Kelsey Drive A- 2011 30,000 0 0.0% $23.50 $7,300,000.00 $2.80 $14.96 $38.46 0 0 30,000 30,000 0 0 0
Bristol Court - II 141 Kelsey Drive A- 2012 30,000 0 0.0% $24.50 $7,300,000.00 $2.80 $14.96 $39.46 0 0 30,000 30,000 0 0 0
Bristol Court III* 131 Kelsey Drive A- 2014 30,000 0 0.0% $22.50 $7,300,000.00 $2.80 $14.96 $37.17 15,000 15,000 30,000 15,000 0 -15,000 0
Bristol Court - V 125 Kelsey Drive A- 2013 30,000 0 0.0% $24.50 $7,300,000.00 $2.80 $14.96 $39.46 0 0 30,000 30,000 0 0 0
Bristol Court - IV 121 Kelsey Drive A- 2015 30,000 0 0.0% $24.50 $7,300,000.00 $2.80 $14.96 4,469 4,469 30,000 25,531 0 0 0
79 Mews Place 79 Mews Place B+ 2013 15,000 0 0.0% $22.50 $2,700,000.00 $5.33 $9.25 $31.75 0 0 15,000 15,000 0 0 0
Services Canada Building 40 Mews Place A- 2011 22,622 0 0.0% $23.50 $5,000,000.00 $5.79 $29.29 0 0 22,622 22,622 0 0 0
Former FPI Building 70 O'Leary Avenue B 36,000 0 0.0% $20.00 $7,100,000.00 $6.26 $15.26 $35.26 0 0 36,000 36,000 0 0 0
Current Quarter 397,061 22,359 5.6% $19.99 $11.82 $31.81 19,469 41,828 374,702 355,233 0 -15,000 0
2nd Quarter 2016 397,061 22,359 5.6% $19.99 $11.82 $31.81 4,469 26,828 374,702 370,233 1,942 1,942 0
1st Quarter 2016 397,061 24,301 6.1% $19.99 $11.82 $31.81 4,469 28,770 372,760 368,291 340 340 0
4th Quarter 2015 397,061 24,641 6.2% $19.91 $11.82 $31.73 4,469 29,110 372,420 367,951 -1,214 -1,214 0
3rd Quarter 2015 397,061 23,427 5.9% $19.91 $11.98 $31.89 4,469 27,896 373,634 369,165 0 0 0
2nd Quarter 2015 397,061 23,427 5.9% $19.91 $11.98 $31.89 4,469 27,896 373,634 369,165 -4,052 -8,521 0
YTD 2,282 -12,718 0
Class "C"
Building Address Class Year G.L.A. Direct Vacant Direct Vac% Net Rent 2014 Assess Prop. Tax Oper. Costs Gross Rent
Sublease
Space (sf)
Total Vacant
Space (sf)
Direct
Occupied
Space (sf)
Overall
Occupied
Space (sf)
Direct
Absorption
Overall
Absorption New Supply
Icon Building 187 Kenmount Road C 1972 28,675 0 0.0% $17.00 $5,328,700.00 $5.52 $14.87 $31.87 4,379 4,379 28,675 24,296 0 0 0
McDonald Building 74 O'Leary Avenue C 19,000 2,567 13.5% $19.00 $1,500,000.00 $1.99 $6.00 0 2,567 16,433 16,433 0 0 0
90 O'Leary Avenue 90 O'Leary Avenue C 1979 23,800 700 2.9% $2,500,000.00 $15.00 0 700 23,100 23,100 0 0 0
5 -7 Mews Place 5-7 Mews Place C 25,000 0 0.0% $3,880,000.00 $26.00 0 0 25,000 25,000 0 0 0
5 Hallett Crescent 5 Hallett Crescent C 2015 20,570 18,070 87.8% $14.00 $1,450,000.00 $9.99 $26.00 0 18,070 2,500 2,500 0 0 0
Telelink Bldg 5-7 Pippy Place C 2014(reno) 36,000 13,098 36.4% $20.00 $4,300,000.00 $6.50 $26.50 0 13,098 22,902 22,902 485 485 0
Tara Place 25-31 Peet Street C 1982 48,000 8,820 $13.00 $2,800,000.00 $5.00 $18.00 0 8,820 39,180 39,180 0 0 0
Metro Place 261 Kenmount Road C 22,000 3,500 15.9% $14.00 $2,695,200.00 $3.40 $10.00 $24.00 0 3,500 18,500 18,500 -3,500 -3,500 0
Eastlink Building 17 Duffy Place C 16,000 16,000 100.0% $15.00 $1,700,000.00 $2.68 $10.00 $25.00 0 16,000 0 0 0 0 0
38 Duffy Place 38 Duffy Place C 2014 15,374 9,492 61.7% $20.00 $2,500,000.00 $4.10 $11.10 $31.10 0 9,492 5,882 5,882 0 0 0
81 Kenmount Road 81 Kenmount Road C 1969/1991 76,960 0 0.0% $10,200,000.00 $22.25 0 0 76,960 76,960 0 0 0
Current Quarter 331,379 72,247 21.8% $16.22 $8.61 $24.83 4,379 76,626 259,132 254,753 -3,015 -3,015 0
2nd Quarter2016 324,809 62,662 19.3% $16.66 $8.57 $25.22 4,379 67,041 262,147 257,768 0 -2,399 0
1st Quarter 2016 324,809 62,662 19.3% $16.66 $8.61 $25.27 1,980 64,642 262,147 260,167 -1,767 2,632 0
4th Quarter 2015 324,809 60,895 18.7% $16.50 $7.53 $24.03 6,379 67,274 263,914 257,535 -8,000 -8,000 0
3rd Quarter 2015 324,809 52,895 16.3% $16.50 $7.53 $24.03 6,379 59,274 271,914 265,535 -10,500 -10,500 0
2nd Quarter 2015 324,809 42,395 13.1% $16.50 $7.49 $23.99 6,379 48,774 282,414 276,035 5,000 5,000 14,000
YTD -4,782 -2,782 0
North Market Totals
Total Class B Class C
Area (Square Feet): 728,440 397,061 331,379
Direct Vacant (Sq. Ft.): 94,606 22,359 72,247
Sublet Vacant Space (Sq. Ft.): 23,848 19,469 4,379
Total Vacancy : 118,454 41,828 76,626
Direct Vacancy Rate (%): 13.0% 5.6% 21.8%
Total Vacancy Rate (Percent): 16.3% 10.5% 23.1%
Occupied Space (Sq. Ft.) (inc.sublet): 633,834 374,702 259,132
Occupancy Rate (%): (inc.sublet) 87.0% 94.4% 78.2%
Occupied Space (exc.sublet) 609,986 355,233 254,753
Occupancy Rate % (exc. Sublet) 83.7% 89.5% 76.9%
Weighted Average Net Asking Rent $18.60 $19.99 $16.22
Weighted Average CAM $10.64 $11.82 $8.61
Gross Rent $29.24 $31.81 $24.83
New Supply (Current Quarter) 0 0 0
New Supply (YTD) 0 0 0
3 Month Absorption (including sublet) -3,015 0 -3,015
YTD Absorption (including sublet) -2,500 2,282 -4,782
3 month Absorption (exc.sublet) -18,015 -15,000 -3,015
YTD Absorption (exc. Sublet) -15,500 -12,718 -2,782
Demand Factor -0.47% 0.00% -1.15%
The information contained herein was obtained from sources deemed reliable, and while thought to be correct, is not guaranteed by Cushman Wakefield Atlantic.

CUSHMAN WAKEFIELD ATLANTIC Greater St. John's Office Market Survey
3rd Quarter - September 2016
EAST WEST
(709) 576-3777
Class "B"
Building Address Class Year G.L.A. Direct Vacant Direct Vac% Net Rent 2014 Assess Prop. Tax Oper. Costs Gross Rent
Sublease
Space (sf)
Total Vacant
Space (sf)
Direct
Occupied
Space (sf)
Overall
Occupied
Space (sf)
Direct
Absorption
Overall
Absorption New Supply
570 Newfoundland Drive 570 Newfoundland Drive B 20,767 0 0.0% $20.00 $3,950,000.00 $3.00 $9.33 $29.33 0 0 20,767 20,767 0 0 0
Prince Charles Building 120 Torbay Road B 38,509 1,483 3.9% $14.00 $5,400,000.00 $8.50 $22.50 1,800 3,283 37,026 35,226 0 0 0
Bally Rou Place 280 Torbay Road B 52,691 0 0.0% $14.00 $8.50 $22.50 3,460 3460 52,691 49,231 0 0 0
Terrace on the Square 8-10 Rowan Street B 39,175 7,491 19.1% $16.00 $9,900,000.00 $2.94 $16.00 0 7491 31,684 31,684 0 0 0
Dorset Building 6 Mt. Carson Ave., B 1995 26,622 2,378 8.9% $18.00 $9.41 $27.41 0 2,378 24,244 24,244 0 0 0
251 East White Hills Road 251 East White Hills Road B 30,175 0 0.0% $19.00 $3,900,000.00 $3.25 $7.40 $26.40 3,562 3562 30,175 26,613 0 -3,562 0
29-57 Major's Path 29-57 Major's Path B 53,480 0 0.0% $26.27 0 0 53,480 53,480 0 0 0
Crosbie Group Building 80 Hebron Way B+ 2015 30,000 6,500 21.7% $26.00 $11.00 0 6500 23,500 23,500 0 0 0
Cabox Building* 45 Hebron Way B+ 2015 35,000 9,200 26.3% $26.00 $11.00 0 9200 25,800 25,800 0 0 0
MCP Building* 45 Major's Path B 2013 20,760 0 0.0% $20.00 $9.60 $29.60 0 0 20,760 20,760 0 0 0
120 Stavanger Drive 120 Stavanger Drive B 20,896 0 0.0% $20.00 $4,000,000.00 $8.00 $28.00 1,400 1,400 20,896 19,496 0 -1,400 0
Glencoe Building 132 Glencoe Drive B 36,489 0 0.0% $16.25 0 0 36,489 36,489 0 0 0
Allied Building 397 Stavanger Drive B 2009 13,000 0 0.0% $22.00 $1,919,000.00 0 13,000 13,000 0 0 0
PHB Group Building Airport Road B 2011 18,000 2,512 14.0% $22.00 $2,526,000.00 0 2,512 15,488 15,488 0 9,427 0
4 Olympic Drive 4 Olympic Drive, Mt Pearl B 2015 11,000 5,500 50.0% $18.95 0 5,500 5,500 5,500 0 0 0
International Place 15 International Place A- 2013 44,592 15,743 35.3% $28.00 $12,900,000.00 $7.29 $12.81 $40.81 0 15,743 28,849 28,849 0 0 0
Tower Corporate Campus Waterford Bridge Road B 118,896 10,000 8.4% $18.00 $26,000,000.00 $5.21 $15.90 $33.90 0 10,000 108,896 108,896 -3,466 -3,466 0
Current Quarter 610,052 60,807 10.0% $19.34 $11.74 $31.08 10,222 71,029 549,245 539,023 -3,466 999 0
2nd Quarter 2016 610,052 57,341 9.4% $20.63 $11.74 $32.37 14,687 72,028 552,711 538,024 -12,961 -10,961
1st Quarter 2016 610,052 44,380 7.3% $20.84 $10.89 $31.73 16,687 61,067 565,672 548,985 0 0 0
4th Quarter 2015 610,052 44,380 7.3% $20.77 $10.82 $31.59 16,687 61,067 565,672 548,985 33,243 28,693
3rd Quarter 2015 575,052 42,623 7.4% $20.65 $10.82 $31.48 12,137 54,760 532,429 520,292 23,500 23,500
2nd Quarter 2015 524,292 36,123 6.9% $20.34 $10.89 $31.23 12,137 48,260 488,169 476,032 -1,709 -13,846
YTD -16,427 -9,962 0
* Add to survey Q4 2015
Class "C"
Building Address Class Year G.L.A. Direct Vacant Direct Vac% Net Rent 2014 Assess Prop. Tax Oper. Costs Gross Rent
Sublease
Space (sf)
Total Vacant
Space (sf)
Direct
Occupied
Space (sf)
Overall
Occupied
Space (sf)
Direct
Absorption
Overall
Absorption New Supply
N.A.P.E. Building 330 Portugal Cove Road C 22,000 0 0.0% $11.00 $5.00 $16.00 0 0 22,000 22,000 0 0 0
Elizabeth Business Centre 49-55 Elizabeth Avenue C 24,215 886 3.7% $16.50 $2,300,000.00 $2.39 $11.50 $28.00 0 886 23,329 23,329 0 0 0
Regatta Plaza - Phase II 80 Elizabeth Avenue C 38,000 4,590 12.1% $18.00 $5,800,000.00 $12.32 $30.32 2,747 7,337 33,410 30,663 -2,785 -2,785 0
Robert Charles Anthony Building 35 Blackmarsh Road C 27,275 0 0.0% $14.50 $3,575,000.00 $11.00 $25.50 0 0 27,275 27,275 0 0 0
15 Dundee Avenue 15 Dundee Ave C 21,098 21,098 100.0% $16.00 $9.04 $25.04 0 21,098 0 0 0 0 0
Mount Pearl Square 760 Topsail Road C 148,532 20,660 13.9% $13.80 $1.52 $11.65 $25.45 0 20,660 127,872 127,872 0 0 0
Fmr Home Hardware 689 Topsail Road C 46,500 0 0.0% $20.00 0 0 46,500 46,500 2,120 2,120 0
Current Quarter 327,620 47,234 14.4% $15.38 $10.95 $26.33 2,747 49,981 280,386 277,639 -665 -665 0
2nd Quarter 2016 327,620 46,569 14.2% $15.38 $10.91 $26.28 2,747 49,316 281,051 278,304 86 86 0
1st Quarter 2016 327,620 46,655 14.2% $15.38 $10.86 $26.24 2,747 49,402 280,965 278,218 0 0 0
4th Quarter 2015 327,620 46,655 14.2% $14.07 $9.15 $23.22 2,747 49,402 280,965 278,218 0 0 0
3rd Quarter 2015 327,620 46,655 14.2% $14.07 $9.15 $23.22 2,747 49,402 280,965 278,218 -2,392 -2,392 0
2nd Quarter 2015 327,620 44,263 13.5% $14.07 $9.01 $23.09 2,747 47,010 283,357 280,610 -15,161 -17,908 0
YTD -579 -579 0
East/West Market Totals
Total Class B Class C
Area (Square Feet): 937,672 610,052 327,620
Direct Vacant (Sq. Ft.): 108,041 60,807 47,234
Sublet Vacant Space (Sq. Ft.): 12,969 10,222 2,747
Total Vacancy : 121,010 71,029 49,981
Direct Vacancy Rate (%): 11.5% 10.0% 14.4%
Total Vacancy Rate (Percent): 12.9% 11.6% 15.3%
Occupied Space (Sq. Ft.) (inc.sublet): 829,631 549,245 280,386
Occupancy Rate (%): (inc.sublet) 88.5% 90.0% 85.6%
Occupied Space (exc.sublet) 816,662 539,023 277,639
Occupancy Rate % (exc. Sublet) 87.1% 88.4% 84.7%
Weighted Average Net Asking Rent $17.88 $19.34 $15.38
Weighted Average CAM $11.45 $11.74 $10.95
Gross Rent $29.32 $31.08 $26.33
New Supply (Current Quarter) 0 0 0
New Supply (YTD) 0 0 0
3 Month Absorption (including sublet) -4,131 -3,466 -665
YTD Absorption (including sublet) -17,006 -16,427 -579
3 month Absorption (exc.sublet) 334 999 -665
YTD Absorption (exc. Sublet) -10,541 -9,962 -579
Demand Factor -0.5% -0.6% -0.2%
The information contained herein was obtained from sources deemed reliable and while thought to be correct, is not guaranteed by Cushman Wakefield Atlantic.