Embed Size (px)
Citation preview


2
MARKET WATCH NPL
Executive Summary.
Banks’ NPL scenario
NPL transactions
and pipeline
76 Bn€reduction of banks’ Gross
Bad Loans from the start
of 2017 (-37%)
+1000 bpsbanks’ Gross Bad Loans
coverage due to IFRS9
52%of secured Gross NPLs in banks'
balance sheets (31% in 2010)
83 Bn€NPL transactions expected in FY 2018(+17% vs 2017)
22 Bn€estimated market value
of 2018 transactions
+900 bps / +200 bpsprice increase of mixed and
secured portfolios respectively
Big Picture on Italy
252 Bn€total Gross Bad Loans as
of July 2018
53%of the NPL transactions (expected 191 Bn€ from 2015 to end of 2018) is managed by 6 servicers
New aggregationof small servicing players could be pushed to enhance collection performance
The shift
on credit servicing
Strategic re-organizationof servicing operators is ongoing
105 Bn€increase in managed assets
that Italian servicers will
receive in 2018
Strategic mergersof small servicers into bigger
entities might happen to enhance
performance in collection

3
MARKET WATCH NPL
Italy has 252 Bn€ of Gross NPLs to manage. Of these, 127 Bn€ is the amount in banks' balance sheets at July 2018.
Italy Gross Bad Loan at July 2018
NPL transactionsfrom 2015 to July 2018 (only primary market)
Recovery
5
Bank Gross Bad Loans at July 2018
127 130 252
Total Gross Bad Loan in Italy - Bn€
Highlights
o 127 Bn€ is the amount of Gross Bad Loans in bank balance sheetso 130 Bn€ is the amount of NPL transactions (only primary market) from 2015 to July 2018o 5 Bn€ is the estimated recoveries related on NPLs portfolioso 252 Bn€ is the net balance of NPL transactions, net secondary market and recoveries, plus Bank Gross Bad Loans and it represents the total NPL portfolios to
be managed
Sources: Banca IFIS internal estimation based on Banca IFIS NPL Market Database and Bank of Italy data

4
MARKET WATCH NPL Sources: Banca IFIS NPL Market Database
Dimension makes the difference in achieving servicingperformance.
191 Bn€
NPL Transactions: NPL deals closed from 2015 to 2018 (including 2018 pipeline) Bn€, Percentages
o Top 6 Servicers manage around 53% of the total NPL market assets generated from 2015 to 2018
o Collection/recovery activity requests relevant IT investment
o Small players could merge into bigger entities to survive in the market
Highlights

BANKS’ NPLSCENARIO

6
MARKET WATCH NPL Sources: Banca d’Italia, based on Statistical Database
Banks' NPEs reduced by 66 Bn€ from Q1 2017 to Q1 2018 due to ECB supervision and increasing disposal of bigger NPL portfolios.
12 13 21 18 12 14 12 10 10 7 7 6 6 5 5
127 125 123 120 117 116 104 99 94 9153 58
76 94 11313 15
1515
1778
107
125
156
184 201 197 198 199 201 203192
173167 164157
194
237
283
327341 334 331 330 325 326
302
278266 260
2010 2011 2012 2013 2014 2015 Q1 2016 Q2 2016 Q3 2016 Q4 2016 Q1 2017 Q2 2017 Q3 2017 Q4 2017 Q1 2018
Past Due Unlikely to Pay Watchlist Restructured Bad Loans
Bank NPE - Bn€
Highlights
o Q1 2018 NPE stock in bank balance sheets decreased of 20% respect to the same period of 2017
o The same trend has been registered in both NPL (-19%) and UTP (-22%) category
Classification of impaired Loans updated in 2015 -20%
7
MARKET WATCH NPL
78 107 125 156 184 201 197 198 199 201 203 192 173 167 164 132 127 109 0,0%
2,0%
4,0%
6,0%
8,0%
10,0%
12,0%
14,0%
0,0
50,0
100,0
150,0
200,0
FY2010
FY2011
FY2012
FY2013
FY2014
FY2015
Q12016
Q22016
Q32016
Q42016
Q12017
Q22017
Q32017
Q42017
Q12018
Q22018
Jul2018
Est2018
Bank Gross Bad Loans % Bank Gross Bad Loans/Total Asset
68,5%
40,0%
45,0%
50,0%
55,0%
60,0%
65,0%
70,0%
FY2010
FY2011
FY2012
FY2013
FY2014
FY2015
Q12016
Q22016
Q32016
Q42016
Q12017
Q22017
Q32017
Q42017
Q12018
Q22018
Jul2018
Est2018
Sources: Banca d’Italia, based on Statistical Database; Forecast: Banca IFIS internal analysis
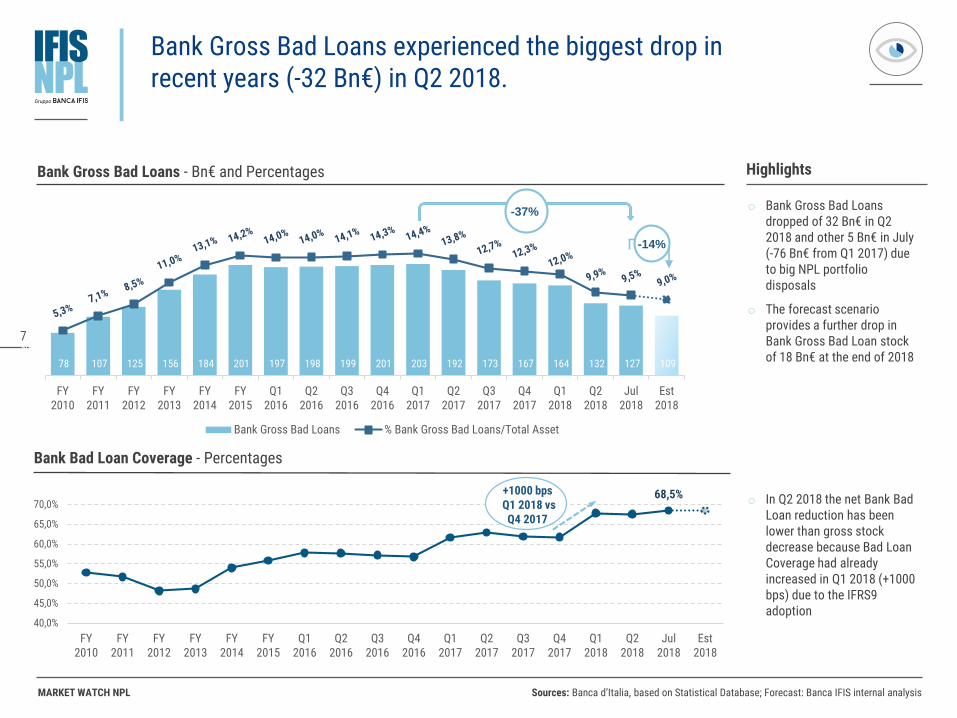
Bank Gross Bad Loans experienced the biggest drop in recent years (-32 Bn€) in Q2 2018.
o Bank Gross Bad Loans dropped of 32 Bn€ in Q2 2018 and other 5 Bn€ in July (-76 Bn€ from Q1 2017) due to big NPL portfolio disposals
o The forecast scenario provides a further drop in Bank Gross Bad Loan stock of 18 Bn€ at the end of 2018
Bank Bad Loan Coverage - Percentages
o In Q2 2018 the net Bank BadLoan reduction has beenlower than gross stock decrease because Bad Loan Coverage had already increased in Q1 2018 (+1000 bps) due to the IFRS9 adoption
Highlights
+1000 bpsQ1 2018 vs Q4 2017
Bank Gross Bad Loans - Bn€ and Percentages
-14%
-37%

8
MARKET WATCH NPL Sources: Banca d’Italia, based on Statistical Database
o Starting from Q2 2017 bothindividual and corporate portfolios are decreasing
o However, the reduction is still more intense for Corporate Bad Loans
Highlights
52%: the share of secured Gross NPLs in banks' balance sheets is the highest since 2010.
Bank Gross Bad Loans - Bn€
Bank Gross Bad Loans - Percentage changes vs previous period
o During the crisis the secured share has increased at a higher pace than unsecured (from 2010 to Q4 2016: +267% vs 113%)
o In contrast, the rate of decrease of secured share from Q4 2016 has been lower than the unsecured component (-2,3% vs -31%)
53 75 86 99 104 112 112 113 112 113 108 106 94 79 7824
3239
5779
89 85 85 87 88 95 8679 88 86
78
107125
156184
201 197 198 199 201 203 192173 167 164
FY2010
FY2011
FY2012
FY2013
FY2014
FY2015
Q12016
Q22016
Q32016
Q42016
Q12017
Q22017
Q32017
Q42017
Q12018
Unsecured Secured
Q2 2018 vs
Q1 2018
-17%
-21%-40%-30%-20%-10%
0%10%20%30%40%
FY2010
FY2011
FY2012
FY2013
FY2014
FY2015
Q12016
Q22016
Q32016
Q42016
Q12017
Q22017
Q32017
Q42017
Q12018
Q22018
% var Bad Loan Individual % var Bad Loan Corporate

9
MARKET WATCH NPL Sources: Banca d’Italia, based on Statistical Database; EBA
Highlights
Italy has the strongest reduction in NPL ratio amongst other European countries.
European Bank NPL ratios - Percentages
o The corporate Bank NPL ratio is 4 p.p. higher than totalratio
o In March 2018 the reduction of Italian NPL ratio was among the highest, but it remains well above the European average
o EU NPL ratio is 7 p.p. lower than the Italian one at Q1 2018
EU Mar-17: 4,8%
Bank Gross Bad Loan/Total Asset by debtor type - Percentages
9,9%
5,9%
14,3%
0,0%2,0%4,0%6,0%8,0%
10,0%12,0%14,0%16,0%18,0%
H12010
H22010
H12011
H22011
H12012
H22012
H12013
H22013
H12014
H22014
H12015
H22015
Q12016
Q22016
Q32016
Q42016
Q12017
Q22017
Q32017
Q42017
Q12018
Q22018
NPL Ratio NPL Individual NPL Corporate
15%
10%
5%
40%
45%
50%
0%
EEGB LU
-27,1%
FINO SESK DKHUPT PLROSIIT ESBG IECYGR NLAT FR LV BE DEMTLT CZHR
Mar-18
Mar-17
EU Mar-18: 3,9%

NPL TRANSACTIONS AND PIPELINE

11
MARKET WATCH NPL
19,1 17,3
71,2
43,3
40,1
19,1 17,3
71,2
83,4
2015 2016 2017 2018
Pipeline
Actual
Sources: Banca IFIS NPL Market Database – Press releases and news
2018 NPL transactions are expected to reach 83 Bn€ (+17% vs 2017).
Highlights
o The 2018 NPL transactions are expected to amount to 83 Bn€, +17% vs 2017 due to major deal disposal on secured portfolios
o Already finalized transactions including more significant deals:
- 10,8 Bn€ of NPL disposallinked to Banca Intesa Sanpaolo and Intrumstrategic agreement on servicing platform (Tersia)
- 9,0 Bn€ of NPL (other 9,0 Bn€ UTPs are excludedfrom graph) transferred to SGA
# Deals
Included 24,1 Bn€of MPS disposal based
on the transferdate of the portfolio
to the SPV.
NPL Transactions - Bn€
43 50 644440
12
MARKET WATCH NPL Sources: Banca IFIS NPL Market Database – Press releases and news and Banca IFIS internal estimation
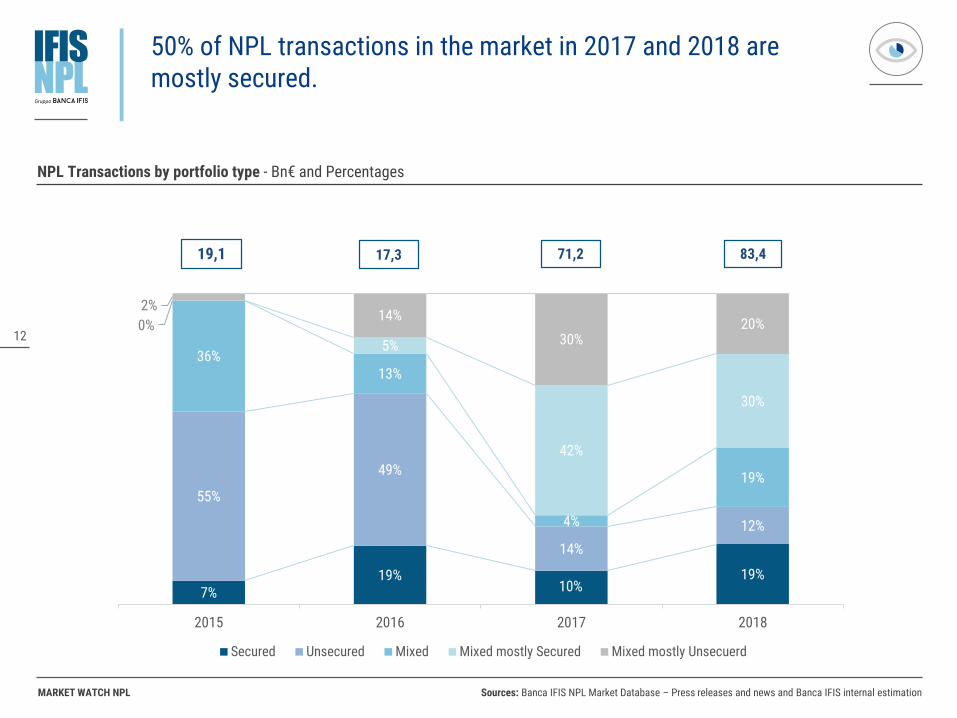
50% of NPL transactions in the market in 2017 and 2018 are mostly secured.
19,1 71,2 83,417,3
NPL Transactions by portfolio type - Bn€ and Percentages
7%19%
11%19%
55%
49%
14%
12%
36%13%
4%
19%
0%
5%
42%
30%
2%14%
30%20%
2015 2016 2017 2018
Secured Unsecured Mixed Mixed mostly Secured Mixed mostly Unsecuerd
10%
13
MARKET WATCH NPL Sources: Banca IFIS NPL Market Database – Press releases and news - Prices and market value based on Banca IFIS internal estimation
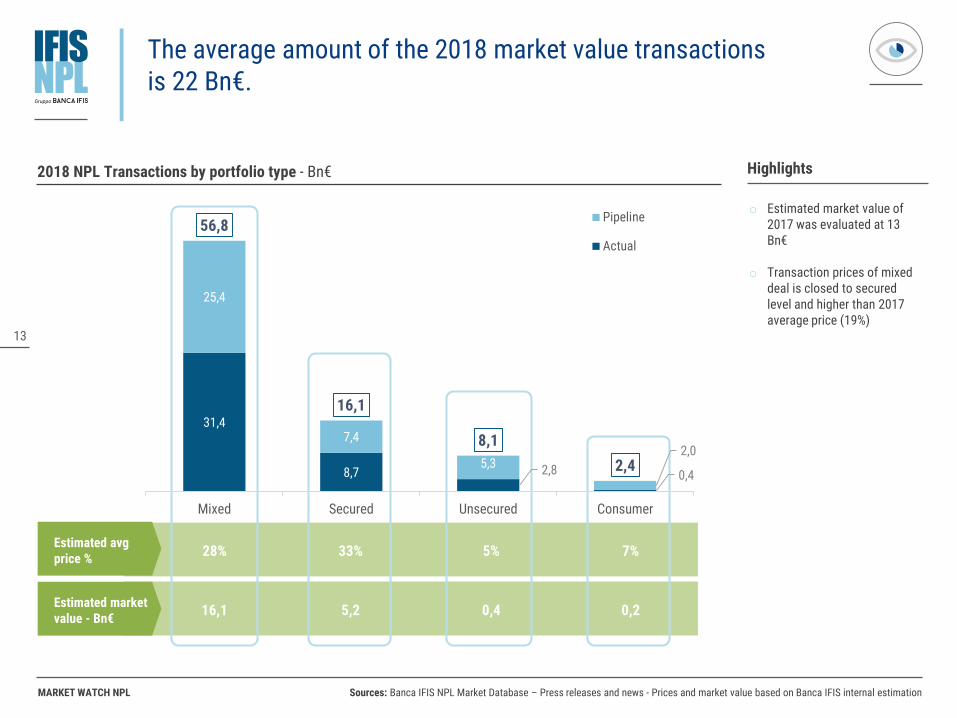
The average amount of the 2018 market value transactions is 22 Bn€.
Highlights
Estimated avgprice %
Estimated marketvalue - Bn€
o Estimated market value of 2017 was evaluated at 13 Bn€
o Transaction prices of mixed deal is closed to secured level and higher than 2017 average price (19%)
28% 33% 5% 7%
16,1 5,2 0,4 0,2
2018 NPL Transactions by portfolio type - Bn€
31,4
8,7 2,8 0,4
25,4
7,4
5,3 2,0
56,8
16,1
8,1
2,4
Mixed Secured Unsecured Consumer
Pipeline
Actual

14
MARKET WATCH NPL Sources: Banca IFIS NPL Market Database – Press releases and news
Transaction prices of mixed deals are closed to secured level and higher than 2017 average price (28% vs 19%).
19%
31%
5%
10%
28%
33%
5%7%
Mixed Secured Unsecured Consumer
2017 2018
+9
+2
0
-3
NPL Transactions: Estimated avg prices - %

15
MARKET WATCH NPL Sources: Banca IFIS NPL Market Database – Press releases and news
43,3 Bn€ of NPLs have already been sold in 2018. Of these, 13,4 Bn€ are GACS-related.
2018 Actual - NPL Transactions details - Bn€
Big deals (73%)
Seller Bn€ GBV Servicer Buyer
Intesa Sanpaolo 10.800 Tersia Lindorf-Intrum - CarVal
Banca Pop di Vicenza, Veneto Banca 9.000 SGA SGA
Banco BPM 5.100 Prelios Confidential
UBI 2.749 Prelios Confidential
Creval 1.600 Cerved Confidential
Creval 245 n.a. Algebris
Creval 222 Credito Fondiario Credito Fondiario
Unicredit 1.627 Banca IFIS Banca IFIS
Unicredit 204 MBCredit Solution MBCredit Solution
Unicredit 60 n.a. Confidential
Sicilcassa 1.700 Zenith Service SpA MB Finance
Cassa Centrale Banca 1.397 Guber Banca Varde, Barclays, Guber Banca
Iccrea Banca 1.050 Prelios Confidential
Banco Desio e Popolare di Spoleto 1.000 Cerved Confidential
Banco di Sardegna 900 Prelios Confidential
Credit Agricole 700 PAM Valerie SPV
CR Asti, Biverbanca 697 Prelios Confidential
BIM 601 Prelios Attestor Value Master Fund
Other minus TRX 3.694 Other Other
43,3
13,4
29,9
Actual2018
Deal withGACS
DealwithoutGACS

16
MARKET WATCH NPL Sources: Banca IFIS NPL Market Database – Press releases and news
40 Bn€ are in the pipeline, of which 25 next to closure and 9,4 Bn€ GACS-related.
2018 Pipeline - NPL Transactions details - Bn€
Seller Project name Ongoing On plan Announced Bn€ GBV
Banco BPM Ace 3,5 - - 3,5
Banco BPM Platform Disposal - - 4,5 4,5
Credit Agricole Poppy 6,0 - - 6,0
Unicredit Milano 0,8 - - 0,8
Unicredit Sandokan II - - 2,0 2,0
Unicredit n.a. 0,5 - - 0,5
Monte dei Paschi di Siena Merlino 2,6 - - 2,6
Christofferson Robb; Bayview n.a. - - 2,0 2,0
Gruppo Delta Arkade 2,0 - - 2,0
BPER n.a. 1,8 - - 1,8
Intesa Sanpaolo Luce 0,3 - - 0,3
Intesa Sanpaolo Rep 1,4 - - 1,4
UBI n.a. - 1,5 - 1,5
REV Gestione Crediti n.a. - 1,5 - 1,5
Carige Isabella 1,4 - - 1,4
Cariparma n.a. - 1,0 - 1,0
Banche Popolari - Luzzatti spa n.a. 0,9 - - 0,9
Banca Popolare di Bari - Luzzatti spa n.a. 0,8 - - 0,8
Hypo Alpe Adria Bank Terzo - - 0,8 0,8
Banco Desio n.a. - 0,5 - 0,5
Confidential and Other minus n.a. 3,1 - 1,3 4,4
25,0 4,5 10,6 40,1
-
40,1
9,4
30,7
Pipeline2018
GACSrequested
DealwithoutGACS

17
MARKET WATCH NPL
o n.a.
o n.a.
o n.a.
o Carige
o Intesa Sanpaolo
o MPS
o Veneto Banks
o Credit Agricole
Sources: Banca IFIS NPL Market Database – Press releases and news
In 2018 12,3 Bn€ of UTPs will be sold, almost entirely composed by assets of Veneto Banks and MPS.
SELLER GBVBUYER
0,5
0,3
2,1
Pipeline
Actualo SGA
o Bain Capital Credit
9,0
0,5
UTP Transactions2018 12,3
UTP Transactions - Bn€

THE SHIFT ON CREDIT SERVICING

19
MARKET WATCH NPL
TERSIA
Sources: Banca IFIS internal estimation based on financial statements, Company business plans and Banca IFIS NPL Market Database - Press releases and news
The strong growth of the NPL transaction market led to a strategic re-organization of servicing operators.
*FBS Closing expected in October, subject to BoI authorization. Transactions will include 7,0 Bn€ managed by FBS and a proprietary portfolio of NPL 1,28 Bn€
AUMBn€
76
25
42
13
9
12 88
53
45
23
27
3
10
11 20
New AUMBn€
AUMend year
Bn€
8 1 9
*
2017 2018 Estimate
Transformational Project from a Banking to a Sevicing Group to be more specialized on servicing business (Core), with banking subsidiary
Long-term servicing partnerships: • Acquisition of MPS servicing platform (with
Quaestio) • La Scala (Joint Venture)
Tersia: merger of ISP'NPL recovery operations and all of Intrum's Italian operations
With FBS acquisition, Banca IFIS can offera comprehensive range of solutions for all asset classes of the NPL market
Specialization on secured asset class managing more than 70% of GACS and leveraging on real estate experience
Obtained the banking license to diversify and facilitate future growth targeting SMEs
KEY ACTIONS
A dinamyc player that operates as an independent servicer as well as a direct investor in portfolios of NPLs and UTPs
STRATEGY
INTEGRATION
PARTNERSHIP
DIVERSIFICATION
SPECIALIZATION
TRANSFORMATION
TRANSFORMATION
BUSINESS MODEL EVOLUTION
4141n.a.
DIVERSIFICATION

20
MARKET WATCH NPL
Fewer servicers will manage the largest Italian NPL deals.
Sources: Banca IFIS NPL Market Database – Press releases and news
Big Deals 2015 - 2018 ServicersSize - Bn€
MPS
Unicredit (Fino)
Banche venete
14,1
8,0
3,4
9,0
Cerved (Juliet)
SGA
14,3
Phoenix Asset Management S.p.A.
BMPPrelios
5,1
UBI 2,7
DoBank
Intesa Sanpaolo 10,8 Tersia

21
MARKET WATCH NPL
General statement
This publication is edited by Banca IFIS.
The information contained herein, obtained from sources believed to be reliable by Banca IFIS,
are not necessarily complete, and their accuracy cannot be guaranteed.
This publication is provided merely for purposes of illustration and information and
does not in any way represent financial and investment advice.