Embed Size (px)
Citation preview
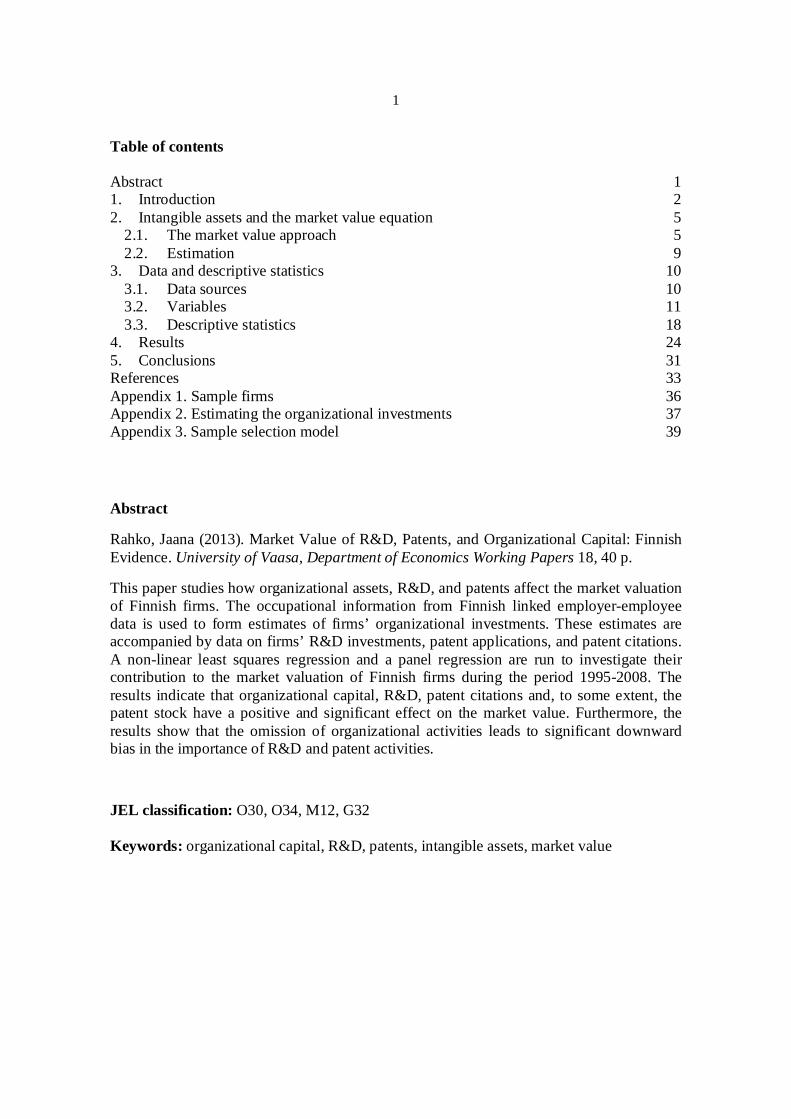
1
Table of contents Abstract 1 1. Introduction 2 2. Intangible assets and the market value equation 5
2.1. The market value approach 5 2.2. Estimation 9
3. Data and descriptive statistics 10 3.1. Data sources 10 3.2. Variables 11 3.3. Descriptive statistics 18
4. Results 24 5. Conclusions 31 References 33 Appendix 1. Sample firms 36 Appendix 2. Estimating the organizational investments 37 Appendix 3. Sample selection model 39
Abstract
Rahko, Jaana (2013). Market Value of R&D, Patents, and Organizational Capital: Finnish Evidence. University of Vaasa, Department of Economics Working Papers 18, 40 p.
This paper studies how organizational assets, R&D, and patents affect the market valuation of Finnish firms. The occupational information from Finnish linked employer-employee data is used to form estimates of firms’ organizational investments. These estimates are accompanied by data on firms’ R&D investments, patent applications, and patent citations. A non-linear least squares regression and a panel regression are run to investigate their contribution to the market valuation of Finnish firms during the period 1995-2008. The results indicate that organizational capital, R&D, patent citations and, to some extent, the patent stock have a positive and significant effect on the market value. Furthermore, the results show that the omission of organizational activities leads to significant downward bias in the importance of R&D and patent activities.
JEL classification: O30, O34, M12, G32
Keywords: organizational capital, R&D, patents, intangible assets, market value

2
1. Introduction
The performance of firms has become increasingly dependent on knowledge and other
intangible assets. These assets include, for example, research and development (R&D),
patents, brands, customer relationships, software, and organizational capital. Despite their
importance, intangible assets are not fully considered in our current accounting system and
we have few systematic ways to value them. These intangibles are one likely reason why
we so often observe that the publicly listed firms have much higher market values than their
book values would suggest. We will examine the relationship between intangibles and firm
performance by studying the effect of organizational capital, patents, and R&D on firms’
market valuation using data on publicly listed Finnish firms. This paper contributes to the
current literature by using Finnish linked employer-employee data (LEED) to measure
organizational investments and combining this dataset with data on patents and firm-
reported R&D expenditures.
Data on patents and R&D expenditures and their effect on the firm’s market value
have been studied for a long time (for example by Griliches (1981), Megna and Klock
(1993), Chan et al. (2001), and Hall et al. (2007)). These studies are often concentrated in
the manufacturing sector because non-manufacturing firms are not as often engaged in
R&D or patenting activities. However, these firms can be very active in other types of
intangible capital production, such as building brands and organizational competence.
Furthermore, organizational and marketing competences have become increasingly
important in all industries, and therefore, it is essential to be able to evaluate their
contribution to firm performance. Organizational investments and firm’s market value have
not been studied as extensively as R&D, but the few existing studies, for example

3
Brynjolfsson et al. (2002), Lev and Radhakrishnan (2003), Hulten and Hao (2008), and
Piekkola (2013), find that organizational investments contribute significantly to the market
value. Piekkola (2013) has studied the market value of intangible investments in Finnish
listed firms using LEED-based data; however, the patent variables or firm-reported R&D
expenditure data were not included. Patent variables are also absent from the other above-
mentioned studies. The present study contributes to the literature by including these
variables as well as organizational investments.
The empirical part of this paper uses the information on firms’ employee
composition and compensation provided in LEED to construct estimates of firms’
organizational capital. Organizational and marketing capital includes brands, firm-specific
human capital and the efficiency of organizational structures, such as the competence of
managers and human resource workers. Management work, hiring consultants, educating
the employees, and marketing and sales expenditures aim for long-lasting improvements in
the firm performance and should therefore be considered as an investment. We will
estimate a firm’s organizational and marketing investments by using the number of
managers and marketing personnel in the firm and their wages. This expenditure-based
approach developed by Görzig et al. (2010) (later GPR) is analogous to country-level
estimates presented previously by Corrado et al. (2005). Here, the focus is on the firm’s
own account production of organizational capital. The approach uses the employees’ wages
and the cost structure of consulting and market research services available in the economy
to estimate the capital and intermediate costs that are also associated with organizational
and marketing investments (GPR 2010).
Research and development expenditures are an input of innovation activity and
investments that also aim to improve firm performance in the future. At the output side of

4
innovation activities are patent applications. A granted patent gives its holder monopoly
power, facilitates the sales of technology, and offers protection in infringement cases.
Patents and accumulated R&D are valuable assets and therefore should contribute to a
firm’s market value. Nevertheless, patent-based measures have some limitations because
not all inventions are patentable, and patents are not the only way to utilize inventions.
Furthermore, the value distribution of patents is highly skewed. Some patents are highly
valuable, whereas others have no commercial application at all. Because these properties
depend to a large extent on the industry, it is clear that different industries can have very
different propensities to patent (Czarnitzki et al. 2006; Levin et al. 1987). To mitigate the
above-mentioned problems, the analysis in this paper will include forward patent citations
to control for the quality of a firm’s patent stock, as has been done in previous studies (Hall
et al. 2005; Harhoff et al. 1999; Trajtenberg 1990).
In this study, we will use Tobin’s q as a measure of a firm’s market valuation
(Griliches 1981; Hall et al. 2007). A firm’s market value is the value that the financial
markets place on the firm’s tangible and intangible assets. If we assume that capital markets
are efficient, the market value should also be equal to the present value of discounted future
payouts and, hence, be closely related to the future profits. R&D and organizational
investments should increase firm productivity and profitability over a longer time period
but the time lag may be difficult to predict (Griliches 1981; Hall et al. 2007). The market
value is a forward-looking measure of firm performance and should capture the increase in
future profitability without a lag. Hence, we should observe a positive association between
the intangible capital and a firm’s market value.
5
The remainder of this paper is organized as follows. The next section presents the
econometric methods. The third section describes the data and the main variables, the
fourth section presents the empirical results, and the fifth section concludes the paper.
2. Intangible assets and the market value equation
2.1. The market value approach
This section presents the market value model, which has been frequently used to study the
value of intangible assets. We want to study the effect of intangible capital on firm
performance, which we can do by studying the market value or alternatively by studying
the firm’s profits or total factor productivity. A profit- or productivity-based analysis has its
advantages but in the context of intangible assets, such analyses also have some
weaknesses. R&D as well as organizational investments aim to increase the firm
productivity in the future and over a long time period, but this time lag may be long and
uncertain (Griliches 1981; Hall et al. 2007). Furthermore, measuring the returns to
investments in intangibles requires careful attention to the timing and measurement of other
inputs, which in itself may be intangible (Hall 2000). The market value approach, however,
enables a forward-looking evaluation of firm performance and avoids the problem with the
timing of productivity effects.1
The market value model was initially introduced by Griliches (1981) to analyze the
economic value of R&D and patents. In this model, the firm is considered to be a bundle of
assets. These assets can include tangible capital, such as plants and equipment, knowledge
1 For results on the productivity effects of patents, see Bloom and Van Reenen (2002). For results
on other intangible assets and productivity, see Ilmakunnas and Piekkola (2010), who use a LEED-
based measurement of intangibles.
6
assets, such as patents and R&D, brands, customer relationships, software, and
organizational competence. The aim is to measure the effect of each of those assets on the
market value, which makes this approach comparable to hedonic price models. The model
relies on the assumption that financial markets are efficient and that the market value equals
the present value of discounted future dividends. It is well known that anomalies occur in
financial markets and that investors are not always rational. Thus, our market value model
should be applied with these limitations in mind.
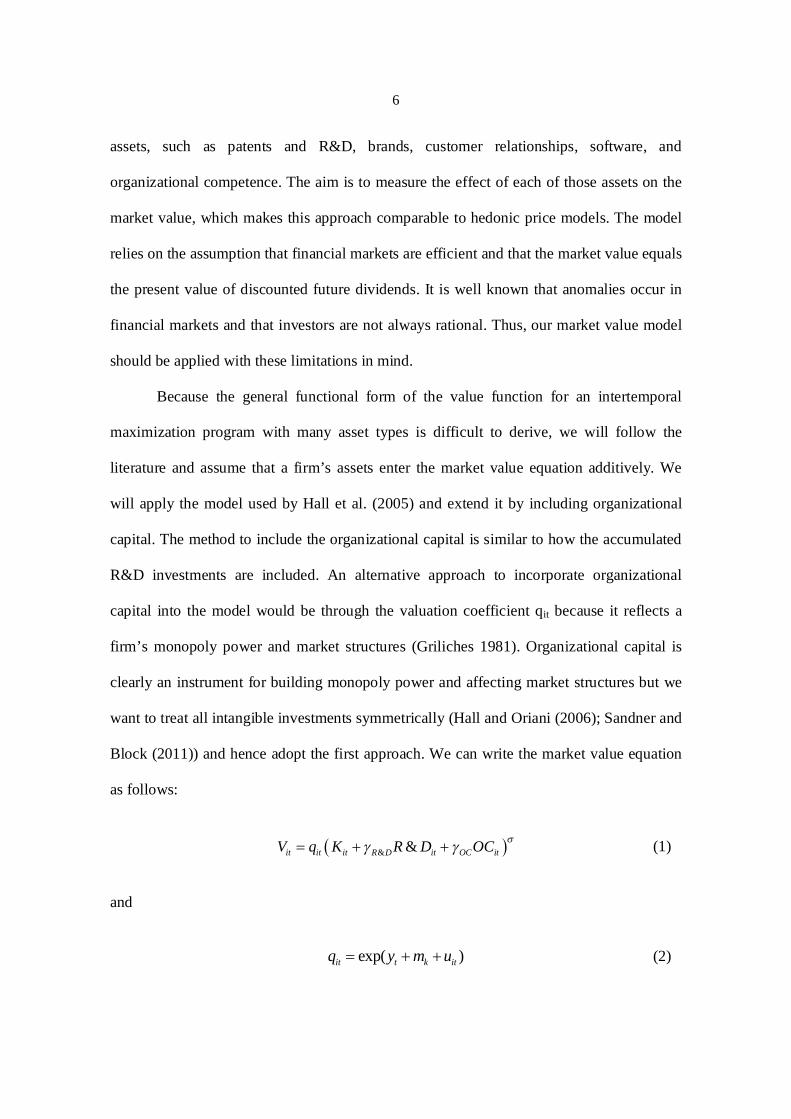
Because the general functional form of the value function for an intertemporal
maximization program with many asset types is difficult to derive, we will follow the
literature and assume that a firm’s assets enter the market value equation additively. We
will apply the model used by Hall et al. (2005) and extend it by including organizational
capital. The method to include the organizational capital is similar to how the accumulated
R&D investments are included. An alternative approach to incorporate organizational
capital into the model would be through the valuation coefficient qit because it reflects a
firm’s monopoly power and market structures (Griliches 1981). Organizational capital is
clearly an instrument for building monopoly power and affecting market structures but we
want to treat all intangible investments symmetrically (Hall and Oriani (2006); Sandner and
Block (2011)) and hence adopt the first approach. We can write the market value equation
as follows:
& &it it it R D it OC itV q K R D OC (1)
and
exp( )it t k itq y m u (2)

7
In equation 1, Vit is the market value of the firm i at time t, and Kit is the tangible assets of
the firm. The organizational and R&D assets are represented by OCit and R&Dit,
respectively. The current valuation coefficient qit includes year (yt) and industry (mk) effects
as well as individual disturbance (uit). We could also model the valuation coefficient to
capture other factors that affect the valuation multiplicatively. measures the returns to
scale. When =1, there are constant returns to scale, and R&D and OC are the shadow
values of the ratios of R&D assets to tangible assets and organizational assets to tangible
assets, respectively (Hall and Oriani 2006). The shadow values show the contribution of
intangible capital to the firm’s market value when the firm spends one additional unit on
intangible capital. The shadow values are an equilibrium outcome in the financial markets
reflecting firms’ investments and investors’ expectations of future cash flows, and the
shadow values should not be given a structural interpretation. Furthermore, the shadow
values are also not necessarily constant over time, although for convenience, we will not
allow them to vary in our analysis.
Next, after taking the logarithm of equation 1 and subtracting the logarithm of Kit
from both sides, we can write the equation as
&&log log 1 log log 1it it it
it it R D OCit it it
V R D OCq KK K K
(3)
Equation 2 includes the log of Tobin’s q on the left-hand side and the total physical assets
and intangible capital intensities with respect to total assets on the right-hand side. The next
step is to modify the model to include patents and patent citations following the example of
Hall et al. (2005) and Hall et al. (2007). This formulation includes patent applications as an

8
output and quality indicator of the R&D stock and the patent citations as a quality indicator
of the patent stock. The estimable equation is given by
&
log log 1 log
&log 1&
itit it
it
it it it itR D PAT CIT OC it
it it it it
V q KK
R D PAT CIT OCK R D PAT K
(4)
The equation is extended with a set of control variables, which enter through the current
valuation coefficient. We include year dummies to control for possible time trends and 12
industry dummies to control for industry-specific heterogeneity as well as dummies for no
R&D and no patents. Some listed firms have reported zero R&D investments or applied for
no patents, in which case the patent-intensity and citation-intensity variables are coded as
zero. Firms that have chosen not to report their R&D expenditures are dropped from the
sample. Furthermore, the no patent dummy is included because if we observe that a firm
has no patent applications, it does not follow that the firm has not made any inventions
(Sandner and Block 2011). The innovations in some industries may not meet the
patentability requirements, and some firms may choose not to patent their inventions. These
firms may find it more profitable to utilize their innovations through trade secrecy or lead
time. Observing no patents may therefore be a result of a strategic decision or an industry
characteristic.
The firms are categorized into industry classes using Standard Industrial
Classification (SIC) codes at their one-digit level except for software and manufacturing
industries, where greater detail was needed. This approach results in 12 industry categories,
such as electronics, paper industry, software, trade, and services. The industry classes and
their characteristics are presented in Table 3.

9
2.2. Estimation
In the early literature, equation (4) was typically simplified with a logarithmic
approximation. The approximation would lead to a simple estimation and analysis, but the
approximation is not preferable because it becomes inaccurate as the ratio of intangible
assets to total assets grows. Table 1 below shows that the intangible assets make up a
notable share of capital also in the Finnish firms. Therefore, the equation should be
estimated using non-linear least squares estimation (NLS). Because the model is non-linear,
the estimated coefficients cannot be compared in a straightforward manner. Therefore, in
addition to the coefficients, it is necessary to calculate the elasticity of Tobin’s q with
respect to the regressors. The elasticities facilitate the interpretation of the coefficients also
because the variables are measured in different units.
NLS estimation does not consider the unobserved firm-specific heterogeneity.
However, a part of the heterogeneity is accounted for by using industry and year controls.
For robustness, we also estimate the model by using OLS and panel models to test the
importance of firm-specific effects. The non-linear least squares estimation is nevertheless
the preferred estimation strategy because the firms’ tangible and intangible capital stocks
are part of a long-term strategy and change only slowly over time. In this case, the
intangible capital intensities are likely to be highly correlated with firm-specific effects
(Hall et al. 2005). Moreover, the main aim of the study is to examine the impact of
intangibles across firms, thus justifying the pooled regression.
Another problem for the estimation is that reporting the R&D expenditures is not
compulsory, and there are many firms who choose not to report their R&D investments.
Reporting R&D is therefore an endogenous variable, which may cause a sample selection

10
bias. Furthermore, some of the firms that report R&D expenses do so with interruptions and
their R&D histories are fragmented. Hall and Oriani (2006) and Toivanen et al. (2002)
discuss the issue of sample selection more closely and conclude that it does not appear to
form a significant bias. As a robustness check, we also account for the sample selection by
estimating the model with the Heckman two-step estimator, where the first step is a probit
estimation on whether the firm reports R&D. The second step is to estimate the market
value model including the inverse Mill’s ratio as an explanatory variable. The results are
reported in the appendix and show that the coefficient of the inverse Mill’s ratio is not
significant and the choice of R&D reporting does not appear to cause bias to the results.
3. Data and descriptive statistics
3.1. Data sources
The empirical analysis in this paper is based on market value, patent, and balance sheet
data. The estimates of organizational capital stock are computed using the Finnish linked
employer-employee data (LEED), which is obtained from the Confederation of Finnish
Industries. LEED covers 8.3 million person-year observations and over 56 thousand firm-
year observations for the 1995-2008 period. The data include a rich set of variables
covering compensation, education, and occupation in the business sector. The occupational
classification is specific to the data from the Confederation of Finnish Industries, and the
classification is available for all employees in the firms considered here.
The R&D expenditure, consolidated balance sheet, and market value data come
from Thomson Reuters Worldscope. The variables used here are firm’s total assets, R&D

11
expenditure, total debt, sales, and market value, which are measured at the end of each year.
The financial variables have been deflated to real 2000 prices using the Ameco database.
Patent and citation data are formed using the EPO PATSTAT database. In this
study, the analysis includes the firm’s patent applications to the European Patent Office
(EPO). EPO patents are a good indicator for R&D quality because they are found to be
more valuable than national patents (Deng 2007). Our patent variable includes all patent
applications, although only granted patents could be used as well. The use of patent
applications is supported by the fact that the information about the applications is made
available more quickly. The use of EPO patent applications is also eased by the databases
that the OECD maintains. The OECD Citations database contains information on all
European patent applications and the citations these applications receive during the search
in the patent office.
Despite using patent applications to the EPO, the value distribution of patents is
highly skewed. The literature has typically used forward patent citation counts to control
for patent quality. Our measure of citation counts includes all forward citations that the
EPO patents receive within 3 years after the applications are published.
3.2. Variables
The dependent variable in the market value equation is the natural logarithm of Tobin’s q.
Tobin’s q is defined as the ratio of a firm’s market value to its book value. The book value
of the firm is the total value of its assets reported on the balance sheet. The market value is
the stock market value of the firm at the end of the year plus the market value of its debt.
The market value of a firm’s debt is difficult to obtain and therefore we follow the previous

12
literature and use the nominal value of long-term and short-term debt instead (Hall et al.
2007).
Organizational competence and marketing activities are important determinants of
firm performance. Management work and hiring consultants are expenditures that aim at
establishing efficient organizational structures, strategies, and working methods in the firm.
Firm-specific human capital can be created, for example, by educating the employees,
whereas marketing and sales expenditures create and strengthen a firm’s brands and
customer relationships. Educating employees, hiring managers, or building up brands are
costly activities from which the rewards materialize over a long time period. These
expenditures reduce a firm’s current profits in order to increase the value of the firm and its
profits in the future in a similar way as investments in tangible capital. Therefore,
expenditure on intangible assets should qualify as an investment and receive the same
treatment as tangible investments (Corrado et al. 2005; Corrado et al. 2009; Görzig et al.
2010). The lack of visibility and verifiability of intangible assets explains why these
investments are often difficult to measure and why they usually do not enter the official
balance sheets. We follow the approach of GPR (2010) and use the linked employer-
employee data to estimate the intangible investment within the firm.
Our estimate of organizational investments includes both marketing and
management investments. The linked employer-employee data include information on
employees’ occupation and wages. By assuming that 20% of the marketing and
management personnel’s work goes into forming intangible assets, we can use their wage
costs to estimate the organizational investment within the firm (Corrado et al. 2005;
Corrado et al. 2009; Görzig et al. 2010). In addition to the wage costs, we also evaluate the
capital and intermediate costs that are related to the intangible investments. These

13
additional costs are estimated based on the cost structure of consultancy and business
service firms (Nace 74) that produce organizational and marketing services in the market.
The methodology to estimate the organizational investments is elaborated further in
Appendix 2 and in GPR (2010).
The final organizational investment data have a few short gaps because of data
issues. However, counting the organizational capital stock requires uninterrupted
investment data series, and hence the missing observations are treated with interpolation,
when the gap in the investment data is not longer than 3 years. In addition to the
interpolation over gaps, no other correction measures are conducted. Once the
organizational investments have been estimated, we can form the organizational capital
stocks. Because the employer-employee data are not available for a long time period, the
initial capital stocks must also be estimated. The starting values at the beginning of the
observation period are estimated by using the investments in the first observation year. The
formula for initial capital stock is shown below.
00
investstock ii
OCOCg
(5)
In estimating the initial capital stock, we assume a constant depreciation rate ( ) and a
constant investment growth rate (g) prior to the observation period. However, the choice of
depreciation and growth rate is not obvious. Different approaches have been used to
estimate the depreciation rate of R&D, and while the intangible assets are typically found to
depreciate faster than the tangible assets, the estimates for example for R&D depreciation
can vary from 0 to 40% (Hall 2005). Furthermore, Awano et al. 2010 find that the benefit
lives of other types of intangibles are shorter than the benefit life of R&D. The recent

14
literature has typically assumed a depreciation rate of 15% for R&D (Hall et al. 2005; Hall
et al. 2007), and we will follow this convention. For organizational capital, we assume a
depreciation rate of 20%, except for the service industry, where the depreciation rate is set
to 25% because firms in service industry are more intensive in branding and other
marketing investments that have been shown to depreciate faster (Awano et al. 2010;
Corrado et al. 2005; Görzig et al. 2010). The prior growth rate (g) is assumed to be 8%,
which follows the literature on the estimation of initial R&D stocks. However, it should be
noted that the main results are not sensitive to small changes in the assumed growth and
depreciation rates.
After the initial values are calculated, the organizational capital stock can be
formed. The organizational capital stock is formed as follows:
, 1(1 )stock stock investit i t itOC OC OC (6)
The companies in the Helsinki stock exchange have increased their business activities
abroad during the observation period, but the organizational capital estimates are formed on
the basis of Finnish employer-employee data. Hence, the organizational capital estimates
do not cover similar offshore investments. However, it is not clear how the offshoring of
business activities should affect the management and marketing personnel in the home
country. There is evidence (Becker et al. 2009; Head and Ries 2002) that the offshoring of
business activities may actually increase the skill intensity of work in the home country,
particularly if some activities are offshored to low-income countries. In any case, it appears
likely that a major share of organizational investments is performed at the headquarters and

15
is therefore included in our estimate and the offshore investments are only adding noise to
our estimate.
The firm’s R&D capital stock cannot be directly obtained from the firm’s balance
sheet but the income statements often include annual R&D expenses. These expenses are
capitalized to compute the R&D stock. Counting the R&D stock using equation (7) requires
that the starting value of the R&D stock is estimated in the same way as the starting value
of the organizational capital stock (5). The initial value is counted using the R&D
expenditure in the first year and assuming that the investments have grown 8% annually
(Sandner and Block 2011). The depreciation rate is set to 15% to allow an easy comparison
to earlier studies, although small changes in the R&D depreciation or growth rate do not
alter the main results significantly.
, 1& (1 ) & &stock stock investit i t itR D R D R D (7)
To allow the calculation of R&D stock, the short gaps in the R&D expenditure histories are
treated with interpolation when the gaps are not longer than 3 years. No other corrections
are made.
The EPO patent data start at 1978. However, the last 18 months are incomplete
because the European Patent Office publishes the applications with some time lag.
Furthermore, the use of patent citations as quality indicator limits the available time period.
In this study, the forward citations are counted from 3 years after the patent application is
published. Observing citations over a longer time period would improve the accuracy of the
quality control but only at the cost of a smaller sample.

16
Some patents have several applicants, which is considered by applying fractional
counting to the data. The economic value is assumed to be uniformly distributed, meaning
that if a patent has two applicants, one half of the patent is allocated to each applicant. If
there are three applicants, each is allocated one third of the patent, and so on.
The initial value of the patent stock does not need to be estimated because the patent
data start from 1978, and the forming of the patent stock is simple once we know the
depreciation rate. The previous literature uses the same depreciation rate for both R&D and
patents, and the same approach is adopted here. The patent stock is formed according to the
declining balance formula with a depreciation rate of 15%. The patent flow indicates the
number of patent applications filed by the firm during year t.
, 1PAT (1 ) PAT PATstock stock flowit i t it (8)
Using the patent stock as a quality indicator for R&D is not unproblematic because patents
are not the only way to utilize inventions, and the value distribution of patents is very
skewed (Harhoff et al. 2003). Some patents are highly valuable, whereas others have no
commercial application at all. Therefore, it is important to use some indicator of a patent’s
value. These indicators include forward and backward citations, patent renewals, patent
family size, opposition (Harhoff et al. 2003; van Zeebroeck 2011), and even patent filing
strategies (van Zeebroeck and Van Pottelsberghe de la Potterie 2011). All these indicators
could be used as a control for the patent value, but here we will use the forward citations,
which have been found to be a significant factor explaining the firms’ market value (Hall et
al. 2005; Hall et al. 2007).

17
After the publication of a patent application, this patent application may be
referenced by other patent applicants if the later invention is based on or related to the
earlier invention. Moreover, the patent office conducts a search during the patent-granting
procedure and may add relevant citations to the application. Consequently, if a patent
receives many citations, it is likely that the underlying invention is important and of high
quality. Therefore, citations can be seen as an indicator of patent value. Counting the
number of citations to a firm’s patents tells us about the quality and economic value of a
firm’s knowledge stock (Hall et al. 2005; Harhoff et al. 1999; Trajtenberg 1990).
We will assume that the value of the patent when it is applied is proxied by the
number of citations it will receive. The value will then depreciate over time. The citations
emerge over a long time period which can stretch to decades in some cases (Hall et al.
2005; Hall et al. 2007). Computing a complete citation stock for all the patents in this study
is not possible. Alternative approaches are to use methods to correct for the truncation of
the data or to use the number of citations received within a shorter time period. Here, we
will use citations received within 3 years of publication because this time frame allows us
to use recent data and is long enough to observe a notable amount of citations (Marco 2007;
Metha et al. 2010). Another difficulty with the citations is that the patents may be applied
in several countries, which leads to several publications, which may be cited in subsequent
applications. This problem can be solved by using information about patent families. We
can consider the citations that the patent receives globally, in Europe, or nationally, or we
can consider all the citations that the same patent family receives. Here, we will consider all
citations, which the patent application filed at the European Patent Office receives either as

18
a European (EP) or an international (WO) patent publication.2 The citation stock is formed
in the same way as the patent stock (9). The depreciation rate is again set to 15%. The
citation flow is the number of citations that the firm’s patent applications filed in year t will
receive within 3 years after publication of the patent applications.
, 1CIT (1 ) CIT CITstock stock flowit i t it (9)
In the market value estimation, the intangible capital stocks are used as ratios. R&D and
OC assets are divided by the book value of a firm’s total assets. The patent stock is divided
by the accumulated R&D stock and the citation stock is divided by the patent stock because
the ratios are used as a quality measure for the R&D and patent stock, respectively. The
citation stock includes also self-citations, which come from a patent application filed by the
same company or its subsidiary. Previous studies (Bessen 2008; Hall et al. 2005) have
found that self-citations are even more valuable than other citations, particularly for small
firms, and therefore self-citations do not need to be excluded.
3.3. Descriptive statistics
The market value and balance sheet data consist of 122 listed firms in the Helsinki stock
exchange at the end of 2011. 90 of those firms have reported R&D investments after 1995.
For 71 firms, we observe both the firm-reported R&D and the OC stock, which gives 519
firm-year observations for the years 1995-2008.3 The data end in 2008 because we need
2 Patent applications filed at the European Patent Office may also be filed internationally under the
Patent Cooperation Treaty (PCT). Later patent applications may cite either of these publications. 3 For the rest of the firms, the employer-employee data could not be linked reliably. The exact list of
firms included in the sample can be found in Appendix 1.

19
time to observe the forward citations. The sample firms cover over 84% of the total market
capitalization of the Helsinki stock exchange in 2008. Thus, the sample provides a
comprehensive picture of the largest Finnish firms.
Table 1 presents some descriptive statistics of the key variables in the final data.
Market value, turnover, and other financial figures have been deflated to real 2000 prices
using the GDP deflator and are expressed in millions of euros. The average real market
value of the sample firms is 3.4 billion Euros. The R&D assets are on average 21% of the
total assets. The firms’ investments in organizational assets are considerably lower than
their investments in R&D. The organizational assets are on average 2.4% of the total assets,
but there is much variation. The variation is also high for the patent and citation variables.
For 15% of the observations, there are no patent applications, whereas the largest patent
stock includes over 4000 patents and the largest citation stock includes over 5000 citations.
The observations with no patent applications are indicated with a dummy variable, and the
ratio of citation stock to patent stock is recorded as zero. The descriptive statistics for the
ratio of citations to patents are computed conditional on a non-zero patent stock.
Table 2 reports the correlations between the main variables. The statistically
significant correlations are shown with asterisks. The intangible assets are positively
correlated with Tobin’s q, although the correlation with the patents-R&D ratio is not
significant. OC and R&D intensities are negatively correlated with the total assets. This
result shows that the smaller listed firms invest relatively more in intangibles. The inverse
relation between intangible capital and firm size holds also for the whole LEED data, where
all firms with a turnover above 1.5 million euros are included (in 2000 €).

20
Table 1. Descriptive statistics
Variable Mean SD Min Median Max Market capitalization 3255.8 16651.2 0.645 343.3 222980.6 Tobins's q 1.279 1.159 0.305 0.937 14.8 Total assets 2511.3 4879.3 5.940 442.5 33640.5 R&D stock 324.4 1623.0 0 51.3 18085.4 R&D stock/Assets 0.210 0.348 0 0.094 4.372 Patent stock 110.8 533.9 0 9.602 4758.5 Patent stock/Assets 0.052 0.107 0 0.012 0.695 Patent stock/R&D stock 0.267 0.318 0 0.159 2.085 Citation stock 127.1 679.1 0 5.397 5352.1 Citation stock/Patent stock 0.607 0.492 0 0.530 3.398 OC stock 20.745 38.616 0 6.259 318.8 OC stock/Assets 0.028 0.042 0 0.014 0.383 No R&D (dummy) 0.029 0.168 0 0 1 No patent (dummy) 0.152 0.360 0 0 1 Notes. 519 obs. Financial variables are in millions of Euros, in year 2000 real prices. Patent stock/ R&D stock is reported as patents per million Euros in R&D stock
Table 2. Correlation matrix
1. 2. 3. 4. 5. 1. Tobin's q
2. Total assets 0.126* 3. R&D stock/assets 0.218* -0.120*
4. Patent stock/R&D stock 0.086 -0.017 -0.029 5. Citation stock/Patent stock 0.200* 0.221* 0.058 0.196*
6. OC stock/Assets 0.153* -0.240* 0.275* -0.048 -0.142* Notes. 519 obs. * p<0.05
Table 3 compares the firm characteristics of R&D reporters to those firms that do not report
their R&D expenditures but for whom we can still compute the organizational capital stock.
The table shows that while concentrating on firms that report R&D expenditure, we are
excluding some of the smaller firms in the stock exchange. The firms that report R&D
expenditures are typically manufacturing or software firms. The firms who do not report
R&D are often engaged in the service, trade, finance, or transportation sector. The firms

21
that do not report R&D have been growing faster than the sample firms, and despite
reporting no R&D, over 40% of these firms have filed patent applications. Patents indicate
that they are indeed active in R&D, although they do not report their research expenditures.
Furthermore, these firms are slightly more intensive in organizational capital than R&D
reporters.
Table 3. Firm characteristics for R&D reporters and others
Reporting R&D Not reporting R&D Variable Mean SD Mean SD Market capitalization 3255.8 16651.2 384.5 1084.0 Tobins's q 1.279 1.159 1.352 2.955 Total assets 2511.3 4879.3 1189.1 4740.6 Sales 2486.6 5292.8 601.1 1350.9 Sales growth 0.057 0.206 0.123 0.345 Debt 682.3 1350.3 176.2 845.5 Debt leverage 0.257 0.165 0.220 0.168 Investments / Assets 0.012 0.220 0.062 0.207 Patent stock 110.8 533.9 1.349 6.116 Patent stock/Assets 0.052 0.107 0.017 0.059 Citation stock 127.1 679.1 0.780 3.835 Citation stock/Patent stock 0.607 0.492 0.782 2.039 OC stock 20.745 38.616 11.322 20.429 OC stock/Assets 0.028 0.042 0.037 0.042 No patent (dummy) 0.152 0.360 0.576 0.495 Notes. Reporting R&D group includes 519 observation for which we observe organizational and R&D investments. Not reporting R&D group includes 401 observations for which we observe organizational but not R&D investments.
Table 4 below presents the industry classification and some summary information for the
industries. Because we concentrate only on the firms that report R&D expenditures, some
industries are missing or are thinly presented in our sample. Machinery, electronics, and
software are the biggest industry categories in our sample. There are clear differences in the
intangible capital intensities and Tobin’s q across industries. On average, Tobin’s q is the
highest in electronics, manufacturing of controlling and other instruments, and software
22
firms. Those firms have also an above-average R&D intensity. Tobin’s q is the lowest in
food and paper industries, which are also less intensive in intangible investments. The
organizational capital intensity is by far the highest in the manufacturing of controlling and
other instruments industry, while the lowest intensity is found in the paper industry, which
is very intensive in tangible capital. Otherwise, organizational capital is quite evenly
distributed across industries.

23
Table 4. Industry characteristics
Industry Obs Percent Tobin's q Total assets
R&D stock/ Total assets
OC stock/ Total assets
Patent stock / R&D stock
Citation stock / Patent stock
Food and kindred products 42 8.09 0.739 409.400 0.075 0.018 0.114 0.962 Chemicals 32 6.17 1.221 1190.148 0.244 0.039 0.595 0.543 Paper and allied products 45 8.67 0.738 10307.930 0.025 0.005 0.204 0.658 Metal industries 53 10.21 0.964 2052.317 0.070 0.012 0.273 0.363 Machinery and computer equipment 85 16.38 1.185 1352.198 0.145 0.027 0.371 0.432 Electronics and components 54 10.40 2.125 4832.054 0.405 0.013 0.166 0.802 Measuring, analyzing, and controlling instruments 21 4.05 1.804 109.913 0.560 0.145 0.246 0.484 Rubber and miscellaneous plastic products 28 5.39 1.458 723.008 0.103 0.013 0.400 0.542 Transportation, communications & utilities 22 4.24 1.153 8365.156 0.029 0.011 0.433 0.690 Software 54 10.40 1.778 134.307 0.700 0.054 0.231 0.738 Trade and services 17 3.28 0.782 847.062 0.032 0.026 0.070 0.344 Other industries 66 12.72 1.216 1080.791 0.081 0.025 0.156 0.744 Total 519 100 1.279 2511.267 0.210 0.028 0.267 0.607
Notes. Financial variables are in millions of Euros, in year 2000 real prices. Patent stock/ R&D stock is reported as patents per million Euros in R&D stock

24
4. Results
This section presents the results from the estimation of the market value equation. The
dependent variable is the same, log of Tobin’s q, in all models. Table 5 presents the results
from the basic non-linear least squares (NLS) models. Because of the model’s non-linearity
and the differing units of measurement, the interpretation of the coefficients is not
straightforward, and it is more informative to examine the mean elasticities. These
elasticities are reported at the end of Table 5. The panel estimation, which also considers
the unobserved firm-specific effects, is presented in Table 6 together with the ordinary least
squares regression results.
The first column in Table 5 shows the results from the baseline model (model 0)
excluding all the intangibles. Model 1 in Table 5 is estimated with knowledge capital and
includes R&D, patent, and citation variables as well as dummies for years and industries.
The model is estimated with the sample for which the organizational capital can also be
calculated. Specification 2 also includes the organizational capital. The third model
excludes the patent variables and includes only R&D and organizational capital.
The results in the second column of Table 5 show that the knowledge assets can
explain a significant part of the variation in Tobin’s q. The adjusted R-squared increases
from 0.288 to 0.328 when the knowledge assets are included. The companies with higher
intangible capital intensities have a higher market valuation. The R&D stock and patent
citations are positively and significantly related to the market value of firms. The ratio of
patent stock to R&D stock has an insignificant yet positive coefficient. Model 1 in Table 5
is comparable to the models presented in the previous literature (Hall et al. 2005; Hall et al.
2007). Although our sample contains smaller firms on average compared to previous

25
studies and the industry composition in the Helsinki stock exchange is somewhat different,
the results from the first model are in line with earlier results. The elasticity of Tobin’s q
with respect to the patent intensity is not significant, which is also in line with previous
studies that have found that the cited patents are more strongly related to the market value.
However, when model 1 is estimated with a larger sample and over a longer time period,
1988-2008 (model 1B. in Table 7), we note that also the patent variable becomes
statistically significant.
Specifications 2 and 3 in Table 5 also include the organizational capital intensity
variable. The results show that organizational capital is positively related to higher Tobin’s
q, and the elasticity of Tobin’s q with respect to organizational capital intensity is
approximately 11%. Based on these results, organizational capital has a larger effect on
firms’ market value than R&D and patents. Moreover, the inclusion of organizational
capital raises the elasticities of R&D and patents by almost 2%, while the citation elasticity
is now lower. This effect remains even when we extend the model with more control
variables (see columns 3 and 4 in Table 7). The omission of organizational capital would
cause us to significantly underestimate the importance of R&D and patents and
overestimate the impact of patent citations. Furthermore, the inclusion of organizational
capital increases the adjusted R-squared from 0.328 to 0.360.

26
Table 5. Results from NLS regression
Dependent variable: 0. 1. 2. 3. log Tobin’s q
Constant -0.768*** -0.534 -1.374*** -1.807***
(0.361) (0.381) (0.386) (0.392)
log Total Assets 0.025 0.006 0.040** 0.068***
(0.017) (0.017) (0.017) (0.018)
R&D/Assets 0.227* 0.420** 0.417*** (0.123) (0.165) (0.144)
Patents/R&D 0.167 0.288** (0.109) (0.126)
Citations/Patents 0.280*** 0.248** (0.107) (0.103)
OC/Assets 7.376*** 6.030*** (2.225) (1.871)
No R&D 0.322** 0.284* 0.222 (0.156) (0.168) (0.165)
No patent 0.014 -0.033 (0.103) (0.101)
Adj. R-squared 0.288 0.328 0.360 0.327 Observations 519 519 519 519
Elasticities R&D/Assets
0.036** 0.053*** 0.063*** (0,018) (0.018) (0.018)
Patents/R&D 0.033 0.050** (0.021) (0.020)
Citations/Patents 0.107*** 0.087*** (0.034) (0.031)
OC/Assets 0.120*** 0.117*** (0.027) (0.028)
Notes. All equations include full set of year and industry dummies. Robust standard errors in parenthesis. Reference year: 2008. Reference industry class: Other industries. * p<0.10, ** p<0.05, *** p<0.01
Table 6 below presents the results from the ordinary least squares estimation and panel
models. Models 1-3, which were estimated with NLS, are now estimated with OLS, fixed
effect, and random effect estimation. Of the two panel models, the random effect model is
consistent and efficient if the firm-specific effects are uncorrelated with other right-hand
27
side variables. To test this assumption, we run the Hausman specification test (Hausman
1978). The Hausman test results show that the differences between fixed effect and random
effect models are significant, and hence we should reject the random effect model in favor
of the fixed effect model. However, as noted earlier, the intangibles are strategic
investments that are expected to change only slowly over time and that are thus heavily
correlated with the firm fixed effects. Particularly the organizational practices are usually
very persistent. In fixed effect estimation, the organizational capital intensity is likely to be
highly correlated with its individual effects, which may explain the result.
OLS results in Table 6 show highly significant coefficients for every intangible
asset type. After controlling for firm-specific effects, R&D, and citation intensities remain
significant both in fixed and random effect models, whereas organizational capital, due to
its persistency, is significant only in the random effect model. The patent intensity variable
is not significant in any of the models that consider firm-specific effects.
To check the robustness of the results, models 1 and 3 are estimated with a larger
sample. The larger sample can be obtained by extending the time period when we drop
either the patent variables or the organizational capital from the model. Models 1B and 3B
in Table 7 present the results from these models. Model 1B is estimated for knowledge
capital for the years 1988-2008, and model 3B is estimated for R&D and organizational
capital for the years 1995-2011. The results again show a positive and significant
relationship between intangible capital intensities and market value. The relationship even
appears slightly stronger for R&D and organizational capital.

28
Table 6. Results from the panel models
OLS* Fixed Effects Random Effects Dependent variable:
1. 2. 3. 1. 2. 3. 1. 2. 3. log Tobin’s q
Constant -0.121 -0.717** -0.844** -0.501 -1.193 -1.165 0.128 -0.516 -0.359 (0.335) (0.362) (0.350) (1.211) (1.370) (1.333) (0.574) (0.617) (0.597)
log Total Assets -0.019 0.007 0.021 0.001 0.032 0.039 -0.028 0.000 -0.001 (0.015) (0.017) (0.017) (0.059) (0.066) (0.065) (0.028) (0.030) (0.029)
R&D/Assets 0.422*** 0.392*** 0.435*** 0.208** 0.207** 0.181* 0.230*** 0.218*** 0.206** (0.097) (0.084) (0.095) (0.098) (0.098) (0.098) (0.084) (0.084) (0.084)
Patents/R&D 0.247*** 0.262*** 0.090 0.111 0.047 0.066 (0.072) (0.071) (0.154) (0.156) (0.113) (0.112)
Citations/Patents 0.172** 0.181** 0.229*** 0.227*** 0.212*** 0.210*** (0.075) (0.072) (0.071) (0.071) (0.064) (0.063)
OC/Assets 2.691*** 2.573*** 1.662 1.773 2.540** 2.495**
(0.749) (0.737) (1.538) (1.546) (0.995) (1.005)
No R&D 0.332* 0.287 0.221 0.477* 0.481* 0.516*** 0.245 0.203 0.227 (0.184) (0.182) (0.186) (0.259) (0.259) (0.189) (0.170) (0.168) (0.147)
No patent 0.034 0.070 0.333*** 0.332*** 0.225** 0.229**
(0.090) (0.090) (0.110) (0.110) (0.096) (0.095) Adj. R-squared 0.184 0.220 0.181 0.149 0.172 0.142 0.177 0.215 0.188 Observations 519 519 519 519 519 519 519 519 519 Hausman test 41.87 41.82 36.95
p-value (0.002) (0.002) (0.003) Notes. All equations include full set of year dummies. Reference year: 2008. * p<0.10, ** p<0.05, *** p<0.01 * Robust standard errors in parenthesis, Standard errors in parenthesis

29
Table 7. Results from regressions with larger sample and more control variables
Dependent variable: 1B. 3B. 1C. 2C. log Tobin’s q
Constant 0.152 -1.706*** 0.067 -0.744*
(0.372) (0.329) (0.396) (0.395)
log Total Assets -0.030* 0.062*** -0.014 0.017 (0.017) (0.015) (0.016) (0.016)
R&D/Assets 0.537*** 0.405*** 0.371* 0.615** (0.125) (0.105) (0.209) (0.279)
Patents/R&D 0.210** 0.143 0.263** (0.087) (0.098) (0.118)
Citations/Patents 0.207** 0.298*** 0.284*** (0.093) (0.106) (0.106)
OC/Assets 6.345*** 6.808***
(1.396) (2.078)
No R&D -0.002 0.220 0.332** 0.298* (0.154) (0.151) (0.155) (0.165)
No patent 0.019 0.025 -0.010
(0.087) (0.101) (0.098)
Debt leverage -0.667*** -0.550***
(0.175) (0.176)
Sales growth 0.481*** 0.472***
(0.173) (0.174)
Investments / Total Assets 0.056 0.137
(0.199) (0.199) Adj. R-squared 0.373 0.317 0.396 0.426 Observations 717 719 516 516
Elasticities R&D/Assets
0.088*** 0.064*** 0.054** 0.072*** (0.016) (0.014) (0.026) (0.026)
Patents/R&D 0.034*** 0.027 0.044** (0.013) (0.017) (0.018)
Citations/Patents 0.073*** 0.109*** 0.095*** (0.028) (0.032) (0.030)
OC/Assets 0.123*** 0.107***
(0.021) (0.024) Notes. All equations include full set of year and industry dummies. Robust standard errors in parenthesis. Reference year: 2008. Reference industry class: Other industries. * p<0.10, ** p<0.05, *** p<0.01

30
The last two columns in Table 7 show models 1 and 2 extended with additional control
variables, which may affect the market value systematically. The control variables include
the ratio of net investments to total assets, the growth of sales as a control for future growth
prospects, and debt leverage. Adding more control variables does not change the main
results, if anything, additional controls strengthen the relationship between the intangibles
and the market value.
Further robustness checks were conducted by estimating the model in smaller
subsamples. The sample was divided into manufacturing and non-manufacturing companies
and into large and small companies based on their sales. The smaller firms are more
intensive in R&D and OC but not in patents. The intangible capital intensity also varies
more in the smaller firms than in the larger firms. When the market value model is
estimated, the results show that the market value reacts more strongly to the R&D intensity
in small companies but the patent variables do not have significant effects. For the larger
firms, both patent citations and R&D are statistically significant in explaining the market
value. The elasticity of Tobin’s q with respect to organizational capital is similar both for
large and small firms, although it is slightly higher for large firms.
The manufacturing firms are by far the largest group, and the results for them mirror
the aggregate results. The variation of intangible capital intensity among the non-
manufacturing firms is large because the software industry is very R&D intensive, whereas
the other firms invest relatively little in R&D. For organizational capital, there are no large
differences between the manufacturing industry and the other industries, except again for
software firms, which invest more in organizational capital. The market value of non-
manufacturing companies is positively related to high R&D intensity but the patent
variables have no or even a slightly negative relation to the market value. The

31
organizational capital is a significant factor explaining the market value in every industry,
and particularly so in the software and other service firms.
5. Conclusions
This study has investigated the relationship between intangible capital and the stock market
valuation of Finnish firms using R&D expenditures, patent applications, and organizational
investment data. While the market value of R&D and patents has been frequently analyzed,
organizational assets have been absent from these studies. At the same time, the existing
studies that do consider organizational capital (for example Lev and Radhakrishnan (2005),
Brynjolfsson et al. (2002), Joshi and Hanssens (2010), and Piekkola (2013)) do not include
patent variables in their analysis. In this paper, we complement patent and R&D
expenditure data by using a rich Finnish linked employer-employee dataset to create
estimates of firms’ organizational assets. We follow the approach presented in Görzig et al.
(2010) and estimated firms’ organizational investments using the wage costs of managers
and marketing personnel.
Our results show that organizational assets, R&D, and patent citations are
significantly associated with a higher market value. Including all intangible assets into the
market value model raises the adjusted R-squared from 0.288 to 0.360. The estimates for
the elasticity of Tobin’s q with respect to organizational capital intensity are in the range of
10-12%, which is somewhat higher than the estimated R&D elasticity of Tobin’s q.
Previous studies with US and European data have shown that R&D assets and patent
citations are significant factors explaining the market value of firms. The results obtained in
this study confirm these results for the Finnish data with, on average, smaller firms.
Financial markets value R&D assets and patent citations, but the plain patent counts are
32
significant in only some of the model specifications. Our estimate of the elasticity of
Tobin’s q with respect to R&D intensity varies from 4% to 9%. The estimated citation
elasticity is also quite high, close to 10% in most model specifications. Moreover, the
results indicate that it is important that we do not fail to include the organizational capital in
the market value model because the omission of organizational capital would cause us to
significantly underestimate the importance of R&D and patents and overestimate the
impact of patent citations.
The results are robust after adding control variables and estimating the model for a
longer time period. The panel estimation shows that after considering the unobserved firm-
specific effects, the R&D, citation, and in random effects models also the organizational-
capital intensity can still explain a significant amount of variation in Tobin’s q. Our results
have shown that investments in management and marketing have a positive relation to the
firm’s market value, and this relation is even stronger than that of research and
development investments
33
References
Awano, G., M. Franklin, J. Haskel and Z. Kastrinaki. 2010. Measuring Investment in Intangible Assets in the UK: Results from a New Survey. Economic & Labour Market Review 4, no 7: 66-71.
Becker, S., K. Ekholm and M.-A. Muendler. 2009. Offshoring and the Onshore Composition of Tasks and Skills. IAW Discussion Papers 55.
Bessen, J. 2008. The Value of U.S. Patents by Owner and Patent Characteristics. Research Policy 37: 932-45.
Brynjolfsson, E., L.M. Hitt and S. Yang. 2002. Intangible Assets: Computers and Organizational Capital. Brookings Papers on Economic Activity 1: 137-81.
Chan, L.K.C., J. Lakonishok and T. Sougiannis. 2001. The Stock Market Valuation of Research and Development Expenditure. The Journal of Finance 56: 2431-56.
Corrado, C., C. Hulten and D. Sichel. 2005. Measuring Capital and Technology: An Expanded Framework. National Bureau of Economic Research. In Studies in Income and Wealth, eds Corrado, C, Haltiwanger, J and Sichel, D, 11-45. Chicago: University Chicago Press.
Corrado, C., C. Hulten and D. Sichel. 2009. Intangible Capital and U.S. Economic Growth. The Review of Income and Wealth 55, no 3: 661-85.
Czarnitzki, D., B.H. Hall and R. Oriani. 2006. Market Valuation of Us and European Intellectual Property. In The Management of Intellectual Property, eds Bosworth, D and Webster, E, 111-31: Edward Elgar Publishing.
Deng, Y. 2007. Private Value of European Patents. European Economic Review: 1785-812.
EPO. 2011. Patstat - EPO Worldwide Statistical Database, October 2011.
Griliches, Z. 1981. Market Value, R&D and Patents. Economic Letters 7: 183-87.
Görzig, B., H. Piekkola and R. Riley. 2010. Production of Intangible Investment and Growth: Methodology in Innodrive. Innodrive working paper No. 1.
Hall, B.H. 2000. Innovation and Market Value. In Productivity, Innovation and Economic Performance, eds Barrell, R, Mason, G and O'mahony, M: Cambridge University Press.
Hall, B.H. 2005. Measuring Returns to R&D: The Depreciation Problem. Annales D'Économie et de Statistique 79/80.
Hall, B.H., A. Jaffe and M. Trajtenberg. 2005. Market Value and Patent Citations. Rand Journal of Economics 36, no 1: 16-38.

34
Hall, B.H. and R. Oriani. 2006. Does the Market Value R&D Investment by European Firms? Evidence from a Panel of Manufacturing Firms in France, Germany, and Italy. International Journal of Industrial Organization 24, no 5: 971-93.
Hall, B.H., G. Thoma and S. Torrisi. 2007. The Market Value of Patents and R&D: Evidence from European Firms. NBER Working Paper no. 13426.
Harhoff, D., F. Narin, F.M. Scherer and K. Vopel. 1999. Citation Frequency and the Value of Patented Innovation. Review of Economics and Statistics 81, no 3: 511-15.
Harhoff, D., F.M. Scherer and K. Vopel. 2003. Citations, Family Size, Opposition and the Value of Patent Rigths - Evidence from Germany. Research Policy 32, no 8: 1343-63.
Hausman, J.A. 1978. Specification Tests in Econometrics. Econometrica 46: 1251-72.
Head, K. and J. Ries. 2002. Offshore Production and Skill Upgrading by Japanese Manufacturing Firms. Journal of International Economics 58, no 1: 81-105.
Hulten, C. and X. Hao. 2008. What Is Company Really Worth? Intangible Capital and the "Market to Book Value" Puzzle. NBER Working Paper 14548.
Lev, B. and S. Radhakrishnan. 2003. The Measurement of Firm-Specific Organization Capital. NBER Working Paper 9581.
Lev, B. and S. Radhakrishnan. 2005. The Valuation of Organization Capital. In Measuring Capital in the New Economy Nber Studies in Income and Wealth eds Corrado, C, Haltiwanger, J and Sichel, D, 73-99. Chicago and London: University of Chicago Press.
Levin, R.C., A.K. Klevorick, R.R. Nelson and S.G. Winter. 1987. Appropriating the Returns from Industrial R&D. Brookings Papers on Economic Activity 3: 783-832.
Marco, A.C. 2007. The Dynamics of Patent Citations. Economics Letters 94, no 2: 290-96.
Megna, P. and M. Klock. 1993. The Impact of Intangible Capital on Tobin's Q in the Semiconductor Industry. The American Economic Review 83, no 2: 265-69.
Metha, A., M. Rysman and T. Simcoe. 2010. Identifying the Age Profile of Patent Citations: New Estimates of Knowledge Diffusion. Journal of Applied Econometrics 25, no 7: 1179-204.
OECD. 2013. OECD Citations Database, January 2013.
Piekkola, H. 2013. Intangible Investment and Market Value. Presented in Finnish Economic Association XXXV Annual Meeting 14.2.2013: Unpublished working paper.

35
Sandner, P.G. and J. Block. 2011. The Market Value of R&D, Patents and Trademarks. Research Policy 40, no 7.
Toivanen, O., P. Stoneman and D. Bosworth. 2002. Innovation and the Market Value of Uk Firms, 1989-1995. Oxford Bulletin of Economics and Statistics 64, no 1: 39-61.
Trajtenberg, M. 1990. A Penny for Your Quotes: Patent Citations and the Value of Innovations. The RAND Journal of Economics 21: 172-87.
van Zeebroeck, N. 2011. The Puzzle of Patent Value Indicators. Economics of Innovation & New Technology 20, no 1: 33-62.
van Zeebroeck, N. and B. Van Pottelsberghe de la Potterie. 2011. Filing Strategies and Patent Value. Economics of Innovation and New Technology 20, no 6: 539-61.
36
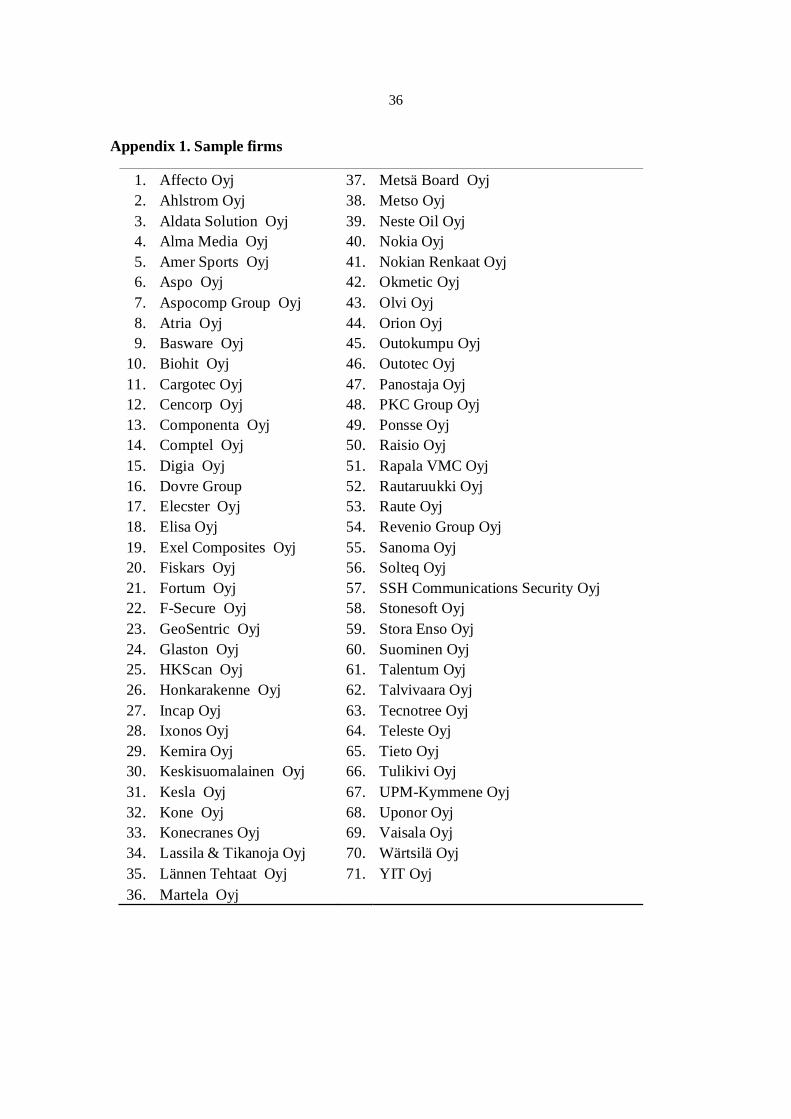
Appendix 1. Sample firms
1. Affecto Oyj 37. Metsä Board Oyj 2. Ahlstrom Oyj 38. Metso Oyj 3. Aldata Solution Oyj 39. Neste Oil Oyj 4. Alma Media Oyj 40. Nokia Oyj 5. Amer Sports Oyj 41. Nokian Renkaat Oyj 6. Aspo Oyj 42. Okmetic Oyj 7. Aspocomp Group Oyj 43. Olvi Oyj 8. Atria Oyj 44. Orion Oyj 9. Basware Oyj 45. Outokumpu Oyj
10. Biohit Oyj 46. Outotec Oyj 11. Cargotec Oyj 47. Panostaja Oyj 12. Cencorp Oyj 48. PKC Group Oyj 13. Componenta Oyj 49. Ponsse Oyj 14. Comptel Oyj 50. Raisio Oyj 15. Digia Oyj 51. Rapala VMC Oyj 16. Dovre Group 52. Rautaruukki Oyj 17. Elecster Oyj 53. Raute Oyj 18. Elisa Oyj 54. Revenio Group Oyj 19. Exel Composites Oyj 55. Sanoma Oyj 20. Fiskars Oyj 56. Solteq Oyj 21. Fortum Oyj 57. SSH Communications Security Oyj 22. F-Secure Oyj 58. Stonesoft Oyj 23. GeoSentric Oyj 59. Stora Enso Oyj 24. Glaston Oyj 60. Suominen Oyj 25. HKScan Oyj 61. Talentum Oyj 26. Honkarakenne Oyj 62. Talvivaara Oyj 27. Incap Oyj 63. Tecnotree Oyj 28. Ixonos Oyj 64. Teleste Oyj 29. Kemira Oyj 65. Tieto Oyj 30. Keskisuomalainen Oyj 66. Tulikivi Oyj 31. Kesla Oyj 67. UPM-Kymmene Oyj 32. Kone Oyj 68. Uponor Oyj 33. Konecranes Oyj 69. Vaisala Oyj 34. Lassila & Tikanoja Oyj 70. Wärtsilä Oyj 35. Lännen Tehtaat Oyj 71. YIT Oyj 36. Martela Oyj

37
Appendix 2. Estimating the organizational investments
Corrado et al. (2005) divide intangible assets into three categories: computerized
information, scientific and creative property, and economic competencies. In the center of
economic competencies is organizational capital which includes the competence of
management and human resources, brands and marketing competencies as well as
organizational structure.
GPR (2010) describe in detail the method to estimate the own-account production of
organizational capital. The authors present both an expenditure-based and a performance-
based approach to estimate intangible investments. In this paper, we use the expenditure-
based approach. This method assesses the labor input in organizational activities using
linked employer-employee data (LEED) and input and output tables to obtain intermediate
and capital input in intangible capital production. The LEED data comes from the
Confederation of Finnish Industries and covers 8.3 million person-year and over 56
thousand firm-year observations for the years 1995-2008. The data contain detailed
information about employees’ occupations, education, and wages in the private sector. The
occupational classification, which is central for the estimation method, is available for all of
the firms’ employees.
GPR (2010) count as organizational occupations the following categories:
management, marketing, superior positions in financial administration, and in the service
sector also the superior jobs in administration. In the LEED data, approximately 6% of the
employees are reported to work in these occupations. Following this methodology, it is
assumed that 20% of organizational workers’ time is engaged in the production of
intangible capital. There is substantial uncertainty about this assumption but nevertheless it
38
is the best estimate suggested by Corrado et al. (2005) and GPR (2010). Based on this
assumption, 20% of organizational workers’ wages should be counted as intangible
investment. The employee compensation is evaluated based on monthly salaries and the
average social security tax over the period.
In difference to Corrado et al., the GPR approach calculates the total production
costs of new intangible capital, which requires also the evaluation of the intermediate and
capital costs that are related to the intangible capital-related work. These costs consist of
conventional inputs needed to produce the services such as electricity or office space. The
evaluation of these additional costs is conducted using the cost structure of firms who
produce and sell comparable intangible goods in the market. The organizational and
marketing activities within firms in all industries are assumed to have the same cost
structure as the EU average in the business service sector (Nace 74 “Other business
activities”). The cost structure indicates the magnitude by which the wage costs need to be
multiplied to account for intermediate and capital costs. An external rate of return of 4%,
presenting the market interest rate, is applied to the use of tangible capital. Multiplied with
the net capital stock, this calculation yields the interest part of the user costs. Counting
these additional costs results in a combined multiplier of 35% with which the wage costs
are multiplied to obtain the investment flows in organizational capital.
This methodology estimates only the own-account production of intangibles, and it
remains unclear how these investments are related to the purchased intangibles. GPR
(2010) argue that at least based on the UK businesses included in the Annual Business
Inquiry, the purchases of intangible goods are complementary to firms’ own-account
production. The authors report that, while there is some variation across intangible capital
categories, for example the purchase of advertising services is positively correlated with

39
intra-firm expenditures on marketing across firms in all industries. These findings suggest
that the organizational capital estimates provide reasonable indicators of total
organizational investments across firms.
Appendix 3. Sample selection model
The probability of a firm reporting R&D is explained by the firm’s log sales, the industry
R&D intensity (sum of industry R&D expenditures divided by industry total sales), the
firm’s capital intensity (total assets divided by sales), and year dummies.

40
Table 8. Sample selection model
Observations 1542 Number reporting R&D 832 Share reporting R&D 53.96%
Probit for reporting R&D:
log Sales 0.309*** (0.020)
Industry R&D intensity 22.702*** (1.618)
Capital intensity 0.001* (0.000)
Pseudo R-squared 0.240 Observations 1542
NLS Regression: Dependent variable: 1D. log Tobin’s q
Constant -0.434 (0.700)
log Total Assets -0.022 (0.030)
R&D/Assets 0.464*** (0.139)
Patents/R&D 0.200** (0.086)
Citations/Patents 0.202** (0.093)
No R&D -0.047 (0.152)
No patent 0.014 (0.086)
Mill's ratio 0.070 (0.175)
Adj. R-squared 0.370 Observations 714
Notes. * p<0.10, ** p<0.05, *** p<0.01 Equation includes a full set of year and industry dummies. Robust standard errors in parenthesis