Embed Size (px)
Citation preview


M A R K E T U P D AT E
Giving our family of investors many reasons to celebrate
E q u i t yEconomy: India’s economic growth performance
was mixed during the previous month. The IIP growthat 7.1% for July, 2007 continued to lose momentumon account of the higher base of the previous year& slowdown in export of manufactured goods(accounting for 65% of exports). Going ahead, thegrowth is expected to pick up on improved ruraldemand, good monsoon as well as seasonal festivedemand thereby keeping the overall IIP forecast forFY08 at around 9%. The inflation rate for the weekended 8th September, 2007 was at 3.32%, the lowestsince December 2002. This was mainly due to a fallin contribution of food articles to overall inflation dueto a high base effect. The Monsoon for the seasonhas been normal and one can expect another goodyear for the local crops. Rupee continued its upwardmomentum in September showing an appreciation of2.8% over last month due to positive FII inflows(USD6.9bn).
Corporate: The backdrop of Q2FY08performance is not very encouraging with a lowerexport growth in rupee terms, a decline in theindustrial output, deceleration in manufacturingrevenues and a drop in automobile sales. Thesecond quarter earnings will be driven by companiesfrom the telecom, metals, capital goods sectors & IT.
After recording a low of sub-14000 levels in the month of August, the Sensex shot up with a bangsurpassing the previous high. It crossed the 17000 mark in September to close at 17291, registering a gain ofnearly 2000 points or 13% for the month. Due to this, there were good opportunities available for arbitrage.Excessive run-up in few stocks also provided unwinding opportunities of existing arbitrage positions. However,the sharp rally in the markets during the month resulted in huge mark-to-market payments on the shortpositions in stock futures. The month of September saw good rollovers of stock futures positions to theOctober series. Most of our positions were rolled to the next series at good rates. The Sensex has gainedmore than 3500 points from the low of 13779 it made in August without any correction. A small impendingcorrection in the indices can provide good opportunities for unwinding of arbitrage positions early in the month,thus enhancing the returns of the fund. Next few months will see good returns from arbitrage funds.
D e r i v a t i v e s
1
Overall, we expect earnings growth for FY08 to bearound 18%.
Markets: Equity markets continued to rally andthe benchmark index zoomed past 17000 mark withina week of breaching 16000 mark. Nifty also joined &sailed past the coveted 5000 mark. A remarkablemonth ended with gains driven by firm cues from theinternational markets since the 50bps rate cut by theUS Fed Reserve. Sectors such as metals and bankswere the key drivers of the rally as both BSE MetalIndex and BSE Bankex rose 8.8% and 8.4%respectively. FII inflows remained strong and stood atUSD10.9bn (YTD) as compared to USD4.5bn lastyear.
Outlook: The rally in the equity markets aredriven by surge in liquidity during this period andpositive global developments. This is aptly supportedby the growth momentum of the economy andexpectations of stable to downward movement in theinterest rates. We continue to believe that pockets ofopportunities exist across sectors as corporateearnings momentum appears to be strong. Ourportfolio strategy remains bottom-up stock pickingand we advise investors to remain invested with atleast one year perspective.(Source: Bloomberg)

M A R K E T U P D AT E
Giving our family of investors many reasons to celebrate
2
Indicators Current Month Last month M-o-M VariationForex Reserves* USD Bln 235.89 228.84 7.05Credit Off take* -Rs Crs 1,945,650 1,899,686 45964Credit Deposit Ratio * 71.39 70.65WPI Inflation*(%) 3.23 3.94 -0.007110-Year Yield - India* (%) 7.92 7.93 -0.000110-year Yield - USA* (%) 4.57 4.50 0.0007Exchange Rate* USD/INR 39.77 40.90 -1.13Brent Crude per/bbl* 81.66 72.06 9.6Reverse Repo-Daily Avg Rs Crs 18,600.00 31,800.00 (13,200.00)Repo Average-Daily Avg Rs Crs 13,330.00 - 13,330.00
* Data Reported as on month-end, Source RBI, WSS & Bloomberg.
D e b t
Government bond market traded in a range and ended marginally higher than the last month. Gilts rallied at the startof the month on lower US treasury yields and expectation of a cut in the federal fund target rate by the FOMC. Howeveruncertainty on liquidity ahead of the advance tax outflows capped sharp fall in yields. US FOMC cut the federal targetfunds rate by 50 basis points and the discount rate by 50 basis to forestall the adverse effects on the broader economythat might otherwise arise from the disruptions in financial markets and to promote moderate growth over time. TheFOMC also mentioned that it will continue to assess the effects of these and other developments on economic prospectsand will act as needed to foster price stability and sustainable economic growth. Yields on the benchmark 10-year bondfell to a low of 7.82% after the FOMC announcement. However, profit taking and rise in long term US government bondyields on inflation worries led to a gradual rise in the bond yields thereafter. Large MSS announcement and release ofthe second half borrowing calendar also had a negative impact on the market. The RBI announced the borrowingcalendar for the second half which was front loaded with higher issuances in the longer term maturities. The GOI willborrow Rs 25000 crores in the above 15 year segments, Rs 30000 crores in the 10-14 year segment & Rs 4000 croresin the 5-9 year segments in the second half of the FY 2007-08. Long term bond yields rose immediately after theannouncement of the borrowing calendar.
Period of AmountAuction (Rs. Crore) Term of the Security
October 5-12 10,000 10-14 year security for Rs.6,000 crore20-year and above security for Rs. 4,000 crore
October 19-26 8,000 5-9 year security for Rs.4,000 crore15-19 year security for Rs.4,000 crore
November 2-8 8,000 10-14 year security for Rs.5,000 crore20-year and above security for Rs. 3,000 crore
November 16-23 7,000 10-14 year security for Rs.3,000 crore15-19 year security for Rs.4,000 crore
December 7-14 7,000 10-14 year security for Rs.5,000 crore20-year and above security for Rs.2,000 crore
January 4-11 10,000 10-14 year security for Rs.6,000 crore20-year and above security for Rs. 4,000 crore
February 1-8 9,000 10-14 year security for Rs.5,000 crore20-year and above security for Rs. 4,000 crore
Total 59,000Money market rates eased on comfortable liquidity situation. Liquidity situation moderated from the previous month,
but remained comfortable as RBI received average daily bids worth Rs 18600 crores in the reverse repo auctions duringthe month. Call rates remained stable in most part of the month. Three month top rated money market asset ratestraded lower and ended at around at 7.70% as against 8.00% in the last month. Liquidity situation continued to remaincomfortable on aggressive intervention by the RBI in the foreign exchange market.
continued on next page

M A R K E T U P D AT E
Giving our family of investors many reasons to celebrate
Factor: InflationShort Term: Positive — Medium Term: Negative
WPI inflation continued to trend lower and fell to a low of3.23% as against 3.94% in the last month on back of base impact.Primary articles index rose to 226.50 as against 224.5 in the lastmonth. Manufacturing index & Fuel index were in a range.International crude oil prices rose to high of $ 84 during the monthon account of lower crude oil inventories in the US and supplyconcerns. The RBI continued to reiterate its hawkish stance oninflation and mentioned that inflationary pressures couldpotentially persist on account of hardening of internationalcommodity prices, in particular, oil prices. The RBI will maintaina stance of continuous vigil supported by appropriate policyactions to maintain price stability on a sustained basis. Goingforward in the month of October 07, headline inflation is expectedto remain soft and is likely to be in the range of 3.00%-3.50%.(Source: Bloomberg)
Factor: LiquidityShort Term: Positive — Medium Term: Neutral
Domestic liquidity situation moderated as compared to thelast month but continued to remain comfortable on aggressiveintervention by RBI in the foreign exchange market andsystematic cash flows by way of redemptions & coupon flows.Comfortable liquidity was evident as the RBI received averagedaily bids worth Rs 18600 crores during the month. Liquiditysituation continued to remain surplus in spite of advance taxoutflows of approximately Rs 30000 crores. CBLO rates andcall rates remained steady during the month. The RBI intervenedheavily in the foreign exchange market to protect gains in thevalue of the INR. The RBI continued to sterilize the liquidity byaggressive issuance of MSS securities. The RBI issued securitiesworth Rs 30000 crores in the month of September. Going forwardin the month of October 2007, system liquidity is likely to remaincomfortable on account of RBI intervention; however RBI willcontinue to use all possible measures (including CRR hike) tomanage excess liquidity
Factor: Global Interest RatesShort Term: Positive — Medium Term: Positive
US FOMC cut the federal target funds rate by 50 basis pointsand the discount rate by another 50 basis points to forestallthe adverse effects on the broader economy that mightotherwise arise from the disruptions in financial markets andto promote moderate growth over time. The FOMC alsomentioned that it will continue to assess the effects of theseand other developments on economic prospects and will actas needed to foster price stability and sustainable economicgrowth. Long term US treasury yields rose from a low of 4.32%to 4.68% during the month even as the FOMC cut the interestrates on inflation worries. FOMC meet to be held towards theend of the month & credit situation will remain the next keytriggers for the US interest rates. (Source: Bloomberg)
Factor: Monetary PolicyShort Term: Neutral — Medium Term: Neutral
The overall monetary policy stance continues to remainunchanged with a focus on price stability, re-emphasis on creditquality and orderly conditions in financial markets. Liquiditymanagement with a focus on inflation will continue to drive the
monetary policy actions going ahead. The RBI has hiked theMSS limit by Rs 50000 crores to Rs 200000 crores for the FY2007-08 in view of the surplus liquidity situation . We changeour call on a CRR cut by end of this financial year. In fact there isa risk of another CRR hike. This is because of the massive FXinflows and RBI’s attempt to prevent sharp appreciation of INR.The RBI is scheduled to meet for the review of the monetarypolicy at the end of this month. We expect the RBI to maintain astatus quo on interest rates in the impending policy meet
Factor: ForexShort Term: Positive — Medium Term: Neutral
India’s Forex reserves stood at a robust $ 235 billion as on21st September 2007. INR continued to rally in view of theglobal weakness in the USD vis a vis the other currency androbust capital inflows. The INR breached the crucial 40 markagainst the USD and ended at 39.74 as against 40.90 in theprevious month. Much of the capital flows was on account ofFII investments in the booming local stock market. The RBIwas actively seen defending the value of the rupee at everylevel during the month. Net investments by FII during the monthwere USD 4.63 billion in the local stock markets. The INR islikely to remain in the band of 39.75-40.00 during the nextmonth, with the RBI likely to intervene in the market to preventsharp volatility. (Source: Bloomberg)
Outlook: Yields on long term government bonds may rangebound on supply concerns. The Government is scheduled tokick start the second half borrowing with a supply of Rs 18000crores of bonds in the month of September. Along with thescheduled borrowing the RBI will continue to issue MSSsecurities aggressively to suck out access liquidity from thesystem. Threat of RBI action in view of the large capital inflowswill also keep sentiments cautious. The market will also awaitthe review of the monetary policy to be held towards the end ofthe month for further clues on interest rates. However domesticinflation and comfortable liquidity position will remain positivesfor the market. The 10-year benchmark yield is likely to be inthe range of 7.75%-7.95% during the month. Money marketrates are expected to range bound on comfortable liquiditysituation. However any monetary action to suck out excessliquidity may lead to a knee jerk reaction in the money marketrates.
Strategy: The short end of the curve is likely to remain rangebound on back of comfortable liquidity situation. Pressure onmoney market assets may emanate from strong RBI action tosuck out excess liquidity. RBI has been sterilizing the amount ofliquidity injected through FX purchases in an attempt to preventsharp appreciation in the local currency. However sterilizationeither through CRR hike or MSS will be partial and there will benet addition of liquidity in the system. Sentimentally, there is asell off in the market but at the end of the day, there will be moreliquidity. Our strategy will be to focus at the shorter end of thecurve and actively seek deployment opportunities at higher yieldsand take advantage of the inter duration spreads. We will continueto take active trading calls and actively seek deployments athigher rates. Our strategy on long term schemes will be continueto take active duration and spread calls on government bondsand corporate bonds.
D e b tcontd....
3
NAV as on September 28, 2007 :
Growth Plan (Rs.) : 48.0505Dividend Plan (Rs.) : 21.5895
Inception : 1st April, 1995
Fund Manager : Sandip Sabharwal
Investment Objective :To provide optimum capital growth and appreciation.
PORTFOLIO as on September 28, 2007Issuer Market Value % to Rating
(Rs. In Lacs) NAV
Auto 772.53 8.63Maruti Udyog 772.53 8.63
Auto Ancillaries 501.09 5.60Apollo Tyre 501.09 5.60
Banks 318.72 3.56ICICI Bank 318.72 3.56
Beverages 9.34 0.10McDowell India Spirits 9.34 0.10
Cement 689.99 7.71Grasim Industries 689.99 7.71
Construction 506.72 5.66Hindustan Construction Co. 506.72 5.66
Construction Materials 14.37 0.16Simplex Projects 14.37 0.16
Consumer Durables 489.15 5.46Voltas 489.15 5.46
Consumer Non Durable 666.44 7.45Gitanjali Gems 509.81 5.70Hindustan Lever 4.19 0.05Kaveri Seed Company 152.44 1.70
Ferrous Metals 336.62 3.76Steel Authority of India 336.62 3.76
Industrial Capital Goods 1,109.23 12.39Bharat Heavy Electricals 570.12 6.37Bharati Shipyard 539.11 6.02
Non Ferrous Metals 10.96 0.12PPS Hindalco Rights 10.96 0.12
Pesticides 538.56 6.02United Phosphorous 538.56 6.02
Petroleum Products 1.57 0.02Reliance Industries 1.57 0.02
Power 10.51 0.12Power Grid Corp. of India 10.51 0.12
Real Estate Developers 462.89 5.17Peninsula Land 462.89 5.17
Software 985.21 11.01Mphasis BFL 510.28 5.70Satyam Computers Services 474.93 5.31
Telecom-Services 410.73 4.59Reliance Communications 410.73 4.59
Textile Products 535.92 5.99Bombay Rayon Fashions 535.92 5.99
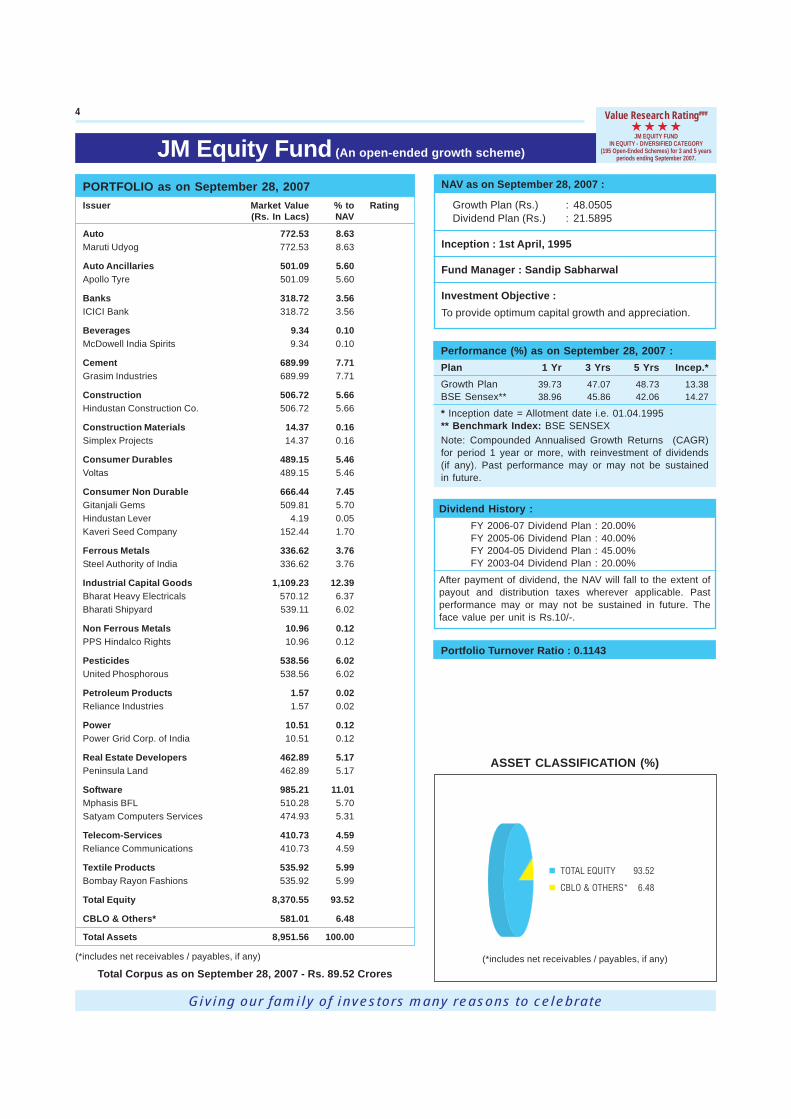
Total Equity 8,370.55 93.52
CBLO & Others* 581.01 6.48
Total Assets 8,951.56 100.00
(*includes net receivables / payables, if any)
Total Corpus as on September 28, 2007 - Rs. 89.52 Crores
Portfolio Turnover Ratio : 0.1143
Performance (%) as on September 28, 2007 :Plan 1 Yr 3 Yrs 5 Yrs Incep.*Growth Plan 39.73 47.07 48.73 13.38BSE Sensex** 38.96 45.86 42.06 14.27
* Inception date = Allotment date i.e. 01.04.1995** Benchmark Index: BSE SENSEXNote: Compounded Annualised Growth Returns (CAGR)for period 1 year or more, with reinvestment of dividends(if any). Past performance may or may not be sustainedin future.
Dividend History :FY 2006-07 Dividend Plan : 20.00%FY 2005-06 Dividend Plan : 40.00%FY 2004-05 Dividend Plan : 45.00%FY 2003-04 Dividend Plan : 20.00%
After payment of dividend, the NAV will fall to the extent ofpayout and distribution taxes wherever applicable. Pastperformance may or may not be sustained in future. Theface value per unit is Rs.10/-.
JM Equity Fund (An open-ended growth scheme)
Giving our family of investors many reasons to celebrate
JM EQUITY FUNDIN EQUITY - DIVERSIFIED CATEGORY
(195 Open-Ended Schemes) for 3 and 5 yearsperiods ending September 2007.
Value Research Rating###
ASSET CLASSIFICATION (%)
(*includes net receivables / payables, if any)
4

JM Balanced Fund (An open-ended balanced scheme)
Giving our family of investors many reasons to celebrate
NAV as on September 28, 2007 :
Growth Plan (Rs.) : 30.2557Dividend Plan (Rs.) : 22.9954
Inception : 1st April, 1995
Fund Manager : Sandeep Neema
Investment Objective :To provide steady current income as well as long termgrowth of capital.
PORTFOLIO as on September 28, 2007Issuer Market Value % to Rating
(Rs. In Lacs) NAV
Auto Ancillaries 68.60 3.02Apollo Tyre 68.60 3.02
Banks 178.71 7.88HDFC Bank 100.49 4.43Industrial Development Bank of India 78.22 3.45
Cement 243.62 10.73Century Textile & Inds. 96.95 4.27Grasim Industries 73.73 3.25India Cements 72.94 3.21
Construction 162.05 7.14Era Constructions (India) 70.87 3.12Kalindee Rail Nirman (Eng) 91.18 4.02
Consumer Non Durables 37.37 1.65Kaveri Seed Company 37.37 1.65
Ferrous Metals 122.70 5.41Monnet Ispat 122.70 5.41
Finance 126.69 5.58Reliance Capital 126.69 5.58
Industrial Capital Goods 251.97 11.10Alstom 139.57 6.15Emco 58.16 2.56McNally Bharat Engineering Co 54.24 2.39
Media 70.88 3.12Deccan Chronicle Holdings 70.88 3.12
Non Ferrous Metals 3.29 0.14PPS Hindalco Rights 3.29 0.14
Petroleum Products 0.32 0.01Reliance Industries 0.32 0.01
Power 2.70 0.12Power Grid Corp. of India 2.70 0.12
Real Estate Developers 90.26 3.98Peninsula Land 90.26 3.98
Software 59.14 2.613i Infotech 59.14 2.61
Textiles & Apparel 46.29 2.04House of Pearl Fashions 46.29 2.04
Total Equity 1,464.59 64.53
Floating Rate Bonds 291.12 12.83Citicorp Finance India 100.53 4.43 AAAIndian Railway Fin. Corp. 80.59 3.55 AAAUnion Bank of India 110.00 4.85 AA+
Total Debt 291.12 12.83
CBLO & Others* 513.64 22.64
Total Assets 2,269.35 100.00
(*includes net receivables / payables, if any)
Total Corpus as on September 28, 2007 - Rs. 22.69 Crores
Portfolio Turnover Ratio : 0.2558
Performance (%) as on September 28, 2007 :Plan 1 Yr 3 Yrs 5 Yrs Incep.*Growth Plan 43.67 38.45 34.40 20.34CBFI ** 26.66 26.36 25.60 NA
* Inception date = Allotment date i.e. 01.04.1995** Benchmark Index:
CRISIL BALANCED FUND INDEXNote: CAGR for period 1 year or more, with reinvestmentof dividends (if any). Past performance may or may notbe sustained in future.
Dividend History :FY 2005-06 Dividend Plan : 19.30%FY 2004-05 Dividend Plan : 25.00%FY 2003-04 Growth Plan : 112.00%
Dividend Plan : 20.00%
After payment of dividend, the NAV will fall to the extentof payout and distribution taxes wherever applicable. Pastperformance may or may not be sustained in future. Theface value per unit is Rs.10/-.
ASSET CLASSIFICATION (%)
(*includes net receivables / payables, if any)
JM BALANCED FUNDIN HYBRID -EQUITY ORIENTED CATEGORY(32 Open-Ended Schemes) for 3 and 5 years
periods ending September 2007.
Value Research Rating###5
NAV as on September 28, 2007 :
Growth Plan (Rs.) : 29.9254Dividend Plan (Rs.) : 25.3159
Inception : 2nd June, 1997
Fund Manager : Asit Bhandarkar
Investment Objective :The primary objective of the Scheme will be to provide capitalappreciation to its Unitholders through judicious deploymentof the corpus of the Scheme in sectors categorized under“basic industry” in the normal parlance and in context of theIndian economy, including but not limited to, energy,petrochemicals, oil & gas, power generation & distributionand electrical equipment suppliers, metals and buildingmaterial. The fund would continue to remain open-ended witha sector focus.
Performance (%) as on September 28, 2007 :Plan 1 3 5 Incep.*
Year Years YearsBasic Fund 79.81 45.01 47.34 39.17BSE BII** 72.83 NA NA NA
* Inception date = Allotment date i.e. 02.06.1997** Benchmark Index: BSE Basic Industries Index ( ) $
Benchmark index has been changed from S&P CNXPetrochemical Index to BSE Basic Industries Index ( )
w.e.f. June 22, 2005Note: CAGR for period 1 year or more, with reinvestment ofdividends (if any). Past performance may or may not besustained in future.$ Refer page no. 7
JM Basic Fund (An open-ended sector scheme)
Portfolio Turnover Ratio : 0.0519
Giving our family of investors many reasons to celebrate
PORTFOLIO as on September 28, 2007Issuer Market Value % to
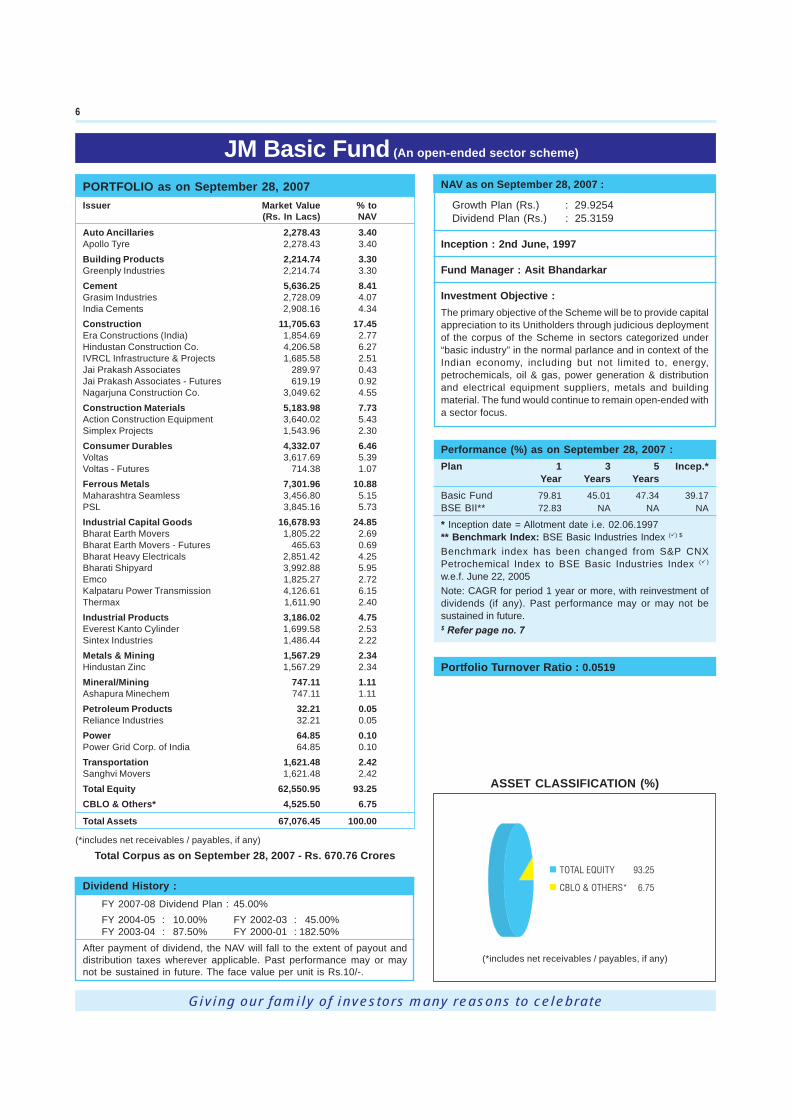
(Rs. In Lacs) NAVAuto Ancillaries 2,278.43 3.40Apollo Tyre 2,278.43 3.40Building Products 2,214.74 3.30Greenply Industries 2,214.74 3.30Cement 5,636.25 8.41Grasim Industries 2,728.09 4.07India Cements 2,908.16 4.34Construction 11,705.63 17.45Era Constructions (India) 1,854.69 2.77Hindustan Construction Co. 4,206.58 6.27IVRCL Infrastructure & Projects 1,685.58 2.51Jai Prakash Associates 289.97 0.43Jai Prakash Associates - Futures 619.19 0.92Nagarjuna Construction Co. 3,049.62 4.55Construction Materials 5,183.98 7.73Action Construction Equipment 3,640.02 5.43Simplex Projects 1,543.96 2.30Consumer Durables 4,332.07 6.46Voltas 3,617.69 5.39Voltas - Futures 714.38 1.07Ferrous Metals 7,301.96 10.88Maharashtra Seamless 3,456.80 5.15PSL 3,845.16 5.73Industrial Capital Goods 16,678.93 24.85Bharat Earth Movers 1,805.22 2.69Bharat Earth Movers - Futures 465.63 0.69Bharat Heavy Electricals 2,851.42 4.25Bharati Shipyard 3,992.88 5.95Emco 1,825.27 2.72Kalpataru Power Transmission 4,126.61 6.15Thermax 1,611.90 2.40Industrial Products 3,186.02 4.75Everest Kanto Cylinder 1,699.58 2.53Sintex Industries 1,486.44 2.22Metals & Mining 1,567.29 2.34Hindustan Zinc 1,567.29 2.34Mineral/Mining 747.11 1.11Ashapura Minechem 747.11 1.11Petroleum Products 32.21 0.05Reliance Industries 32.21 0.05Power 64.85 0.10Power Grid Corp. of India 64.85 0.10Transportation 1,621.48 2.42Sanghvi Movers 1,621.48 2.42Total Equity 62,550.95 93.25CBLO & Others* 4,525.50 6.75
Total Assets 67,076.45 100.00
(*includes net receivables / payables, if any)
Total Corpus as on September 28, 2007 - Rs. 670.76 Crores
ASSET CLASSIFICATION (%)
(*includes net receivables / payables, if any)
Dividend History :FY 2007-08 Dividend Plan : 45.00%FY 2004-05 : 10.00% FY 2002-03 : 45.00%FY 2003-04 : 87.50% FY 2000-01 : 182.50%
After payment of dividend, the NAV will fall to the extent of payout anddistribution taxes wherever applicable. Past performance may or maynot be sustained in future. The face value per unit is Rs.10/-.
6

PORTFOLIO as on September 28, 2007Issuer Market Value % to
(Rs. In Lacs) NAV
Auto 416.68 44.04
Ashok Leyland 68.78 7.27
Escorts India 47.54 5.02
Mahindra & Mahindra 90.24 9.54
Maruti Udyog 109.86 11.61
Tata Motors 100.26 10.60
Auto Ancillaries 360.79 38.12
Amtek Auto Limited 36.14 3.82
Amtek India 79.68 8.42
Apollo Tyre 58.80 6.21
Clutch Auto 40.10 4.24
FIEM Industries 45.74 4.83
MRF 73.32 7.75
Suprajit Engineering 27.01 2.85
Industrial Products 163.47 17.28
Ahmednagar Forgings 43.91 4.64
Ramkrishna Forgings 119.56 12.64
Total Equity 940.94 99.44
CBLO & Others* 5.27 0.56
Total Assets 946.21 100.00
(*includes net receivables / payables, if any)
Total Corpus as on September 28, 2007 - Rs. 9.46 Crores
Performance (%) as on September 28, 2007 :Plan 1 Year 3 Years Incep.*Growth Plan 12.16 29.30 28.14BSE Auto ** -0.63 31.39 31.37
* Inception date = Allotment date i.e. 29.06.2004** Benchmark Index: BSE Auto Sector Index
Note: CAGR for period 1 year or more, with reinvestment ofdividends (if any). Past performance may or may not besustained in future.
NAV as on September 28, 2007 :
Growth Plan (Rs.) : 22.3800Dividend Plan (Rs.) : 17.1489
Inception : 29th June, 2004
Fund Manager : Asit Bhandarkar
Investment Objective :To provide capital appreciation to its unitholders throughjudicious deployment of the corpus of the scheme in the auto &auto ancillary sector.
Portfolio Turnover Ratio : 0.0720
Dividend History :
FY 2005-06Dividend Plan : 45.00%
After payment of dividend, the NAV will fall to the extent of payout anddistribution taxes wherever applicable. Past performance may or maynot be sustained in future. The face value per unit is Rs.10/-.
JM Auto Sector Fund (An open-ended sector fund)
Giving our family of investors many reasons to celebrate
7
ASSET CLASSIFICATION (%)
(*includes net receivables / payables, if any)
$ Disclaimer: BSE Basic Industries Index ( ) : All rights in the BSE Basic Industries Index ( ) vest in BSE. BSE and BSE Basic Industries Index ( ) are trademarks of BSE and are used byJM Financial Asset Management Private Ltd. under license. BSE shall not be liable in any manner whatsoever (including in negligence) for any loss arising to any person whosoever out of use ofor reliance on the BSE Basic Industries Index ( ) by any person.
JM Basic Fund is not sponsored, endorsed, sold or promoted by BSE. BSE makes no representation or warranty, express or implied to the investors in JM Basic Fund or any member of the publicin any manner whatsoever regarding the advisability of investing in securities generally or in JM Basic Fund particularly or the ability of the index to track the sectors represented in the BSE BasicIndustries Index ( ). The relationship of BSE to the JM Financial Asset Management Pvt. Ltd. is in respect of the licensing of use of BSE Basic Industries Index( ) which is determined, composedand calculated by BSE without regard to the JM Financial Asset Management Pvt. Ltd. or JM Basic Fund. BSE has no obligation to take the needs of the investors of JM Basic Fund intoconsideration in determining, composing or calculating the BSE Basic Industries Index ( ) BSE is neither responsible for nor has participated in the determination of the time or price at which theunits under JM Basic Fund are to be issued or in the determination or calculation of the equation by which the units are to be redeemed for the underlying securities. BSE has no obligation or liabilityin connection with the administration, marketing or trading of JM Basic Fund”.
“BSE does not guarantee the accuracy and/or the completeness and/or continuity of BSE Basic Industries Index ( ) or any data included therein and they shall have no liability for any errors,omissions or interruptions therein or change or cessation thereof. BSE makes no warranty, express or implied, as to the results to be obtained by the JM Financial Asset Management Pvt. Ltd.,investors of JM Basic Fund, or any other persons or entities from the use of BSE Basic Industries Index ( ) or any data included therein. BSE makes no express or implied warranties and expresslydisclaims all warranties of merchantability or fitness for a particular purpose or use with respect to BSE Basic Industries Index ( ) or any data included therein. Without limiting any of the foregoing,in no event shall BSE have any liability for any special, punitive, indirect or consequential damages (including lost profits), even if notified of the possibility of such damages”.

JM Healthcare Sector Fund (An open-ended sector fund)
Performance (%) as on September 28, 2007 :Plan 1 Year 3 Years Incep.*Growth Plan 9.05 15.78 18.93BSE Healthcare ** 2.72 13.31 19.21
* Inception date = Allotment date i.e. 29.06.2004** Benchmark Index: BSE Healthcare
Note: CAGR for period 1 year or more, with reinvestment of dividends(if any). Past performance may or may not be sustained in future.
PORTFOLIO as on September 28, 2007Issuer Market Value % to
(Rs. In Lacs) NAV
Pharmaceuticals 688.94 99.35
Aurobindo Pharma 14.13 2.04
Cipla 36.67 5.29
Dishman Pharmaceuticals & Chemicals 90.35 13.03
Glenmark Pharmaceuticals 88.00 12.69
Indoco Remedies 59.18 8.53
Ipca Laboratories 81.36 11.73
Lupin 61.17 8.82
Panacea Biotech 56.02 8.08
Ranbaxy Laboratories 41.25 5.95
Shasun Chemical & Drug 58.39 8.42
Sun Pharmaceuticals Industries 48.24 6.96
Wockhardt Pharma 54.18 7.81
Total Equity 688.94 99.35
CBLO & Others* 4.55 0.65
Total Assets 693.49 100.00
(*includes net receivables / payables, if any)
Total Corpus as on September 28, 2007 - Rs. 6.93 Crores
NAV as on September 28, 2007 :
Growth Plan (Rs.) : 17.5631Dividend Plan (Rs.) : 13.9340
Inception : 29th June, 2004
Fund Manager : Asit Bhandarkar
Investment Objective :To provide capital appreciation to its unitholders throughjudicious deployment of the corpus of the scheme in thehealthcare sector.
Dividend History :
FY 2005-06Dividend Plan : 20.00%
After payment of dividend, the NAV will fall to the extent ofpayout and distribution taxes wherever applicable. Pastperformance may or may not be sustained in future. The facevalue per unit is Rs.10/-.
Portfolio Turnover Ratio : 0.0837
Giving our family of investors many reasons to celebrate
ASSET CLASSIFICATION (%)
(*includes net receivables / payables, if any)
8

Performance (%) as on September 28, 2007 :Plan 1 Year Incep.*Growth Plan 39.02 18.76BSE 200 ** 41.82 42.44* Inception date = Allotment date i.e. 27.07.2005** Benchmark Index: BSE 200 IndexNote: CAGR for period 1 year or more, with reinvestmentof dividends (if any). Past performance may or may notbe sustained in future.
Portfolio Turnover Ratio : 0.0100
JM Emerging Leaders Fund (An open-ended equity oriented growth scheme)
NAV as on September 28, 2007 :
Growth Plan (Rs.) : 14.5283Dividend Plan (Rs.) : 14.5602
Inception : 27th July, 2005
Fund Manager : Sandip Sabharwal
Investment Objective :The primary investment objective of the scheme is to seeklong term capital appreciation from investment in a portfolioof stocks across all market capitalization range. Theportfolio may include those companies operating inemerging sectors of the economy or companies whichexhibit potential to become leaders of tomorrow. However,there can be no assurances that the investment objectivewill be achieved.
(*includes net receivables / payables, if any)
ASSET CLASSIFICATION (%)
Giving our family of investors many reasons to celebrate
PORTFOLIO as on September 28, 2007Issuer Market Value % to
(Rs. In Lacs) NAV
Auto Ancillaries 998.72 3.28Apollo Tyre 998.72 3.28
Cement 1,436.56 4.72Century Textile & Inds. 1,436.56 4.72
Construction 1,309.74 4.30Nagarjuna Construction Co. 1,309.74 4.30
Construction Materials 2,898.67 9.52Action Construction Equipment 1,687.38 5.54Simplex Projects 1,211.29 3.98
Consumer Non Durable 3,878.01 12.74Gitanjali Gems 1,709.76 5.62Hanung Toys & Textiles 1,950.90 6.41Kaveri Seed Company 217.35 0.71
Ferrous Metals 3,305.20 10.85Maharashtra Seamless 1,282.48 4.21PSL 2,022.72 6.64
Industrial Capital Goods 2,765.97 9.09Bharati Shipyard 1,332.83 4.38Emco 1,433.14 4.71
Industrial Products 1,908.14 6.27Sintex Industries 1,908.14 6.27
Media & Entertainment 211.88 0.70Crest Animation Studios 211.88 0.70
Power 31.76 0.10Power Grid Corp. of India 31.76 0.10
Real Estate Developers 1,283.57 4.22Ansal Properties & Infrastructure 1,247.20 4.10Orbit Corporation Detachable warrant 36.37 0.12
Software 1,641.85 5.39Tech Mahindra 1,641.85 5.39
Telecom-Equipment & Accessories 1,520.40 4.99XL Telecom 1,520.40 4.99
Textile Products 2,295.40 7.54Bombay Rayon Fashions 2,295.40 7.54
Transportation 3,814.01 12.52Jet Airways India 1,687.92 5.54Sanghvi Movers 826.00 2.71Spicejet 1,300.09 4.27
Total Equity 29,299.88 96.23
CBLO & Others* 1,144.12 3.77
Total Assets 30,444.00 100.00
(*includes net receivables / payables, if any)
Total Corpus as on September 28, 2007 - Rs. 304.44 Crores
9

Performance (%) as on September 28, 2007 :Plan 1 Month 3 Months 6 Months Incep.*Growth Plan 22.35 17.94 61.07 49.15BSE Finance ** 25.34 23.35 53.24 39.84
* Inception date = Allotment date i.e. 07.12.2006** Benchmark Index: BSE Finance Index ( ) $
Note: Absolute Returns for period less than 1 year. Pastperformance may or may not be sustained in future.
PORTFOLIO as on September 28, 2007Issuer Market Value % to
(Rs. In Lacs) NAVBanking Services 47.97 2.56Indian Bank 47.97 2.56
Banks 1,200.41 64.07Andhra Bank 52.45 2.80Bank of India 124.61 6.65HDFC Bank 71.78 3.83ICICI Bank 146.08 7.80Indian Overseas Bank 79.39 4.24Industrial Development Bank of India 156.45 8.35Kotak Mahindra Bank 147.55 7.87Punjab National Bank 108.51 5.79State Bank of India 155.67 8.31Union Bank 106.18 5.67Yes Bank 51.74 2.76
Finance 372.54 19.87IFCI 49.55 2.64India Infoline 83.83 4.47Infrastructure Development Finance Company 56.42 3.01Mahindra & Mahindra Financial Services 60.80 3.24Reliance Capital 121.94 6.51
Power 67.36 3.59Power Finance Corporation 67.36 3.59
Total Equity 1,688.28 90.09
CBLO & Others* 185.46 9.91
Total Assets 1,873.74 100.00
(*includes net receivables / payables, if any)
Total Corpus as on September 28, 2007 - Rs. 18.74 Crores
JM Financial Services Sector Fund(An open-ended equity oriented sector fund)
NAV as on September 28, 2007 :Growth Plan (Rs.) : 14.9147Dividend Plan (Rs.) : 14.9139
Inception : 7th December, 2006
Fund Manager : Sandeep Neema
Investment Objective :The primary investment objective of the scheme is to investpredominantly in equity & equity related instruments in theBanking / Financial institution / NBFC and housing finance sectorsin India. Accordingly the NAV of the Scheme is linked to the equityperformance of such companies. However, there can be noassurance that the investment objectives of the scheme will berealised. The scheme does not guarantee / indicate any returns.
Giving our family of investors many reasons to celebrate
Portfolio Turnover Ratio : 0.0759
ASSET CLASSIFICATION (%)
(*includes net receivables / payables, if any)
$ DISCLAIMER : BSE Finance Index( ) : JM Financial Services Sector Fund is not sponsored, endorsed, sold or promoted by BSE. BSE makes no representation or warranty, express or impliedto the investors in JM Financial Services Sector Fund or any member of the public in any manner whatsoever regarding the advisability of investing in securities generally or in JM FinancialServices Sector Fund particularly or the ability of the index to track the sectors represented in the BSE Finance Index( ). The relationship of BSE to the JM Financial Asset Management Pvt. Ltd.is in respect of the licensing of use of BSE Finance Index( ) which is determined, composed and calculated by BSE without regard to the JM Financial Asset Management Pvt. Ltd. or JM FinancialServices Sector Fund. BSE has no obligation to take the needs of the investors of JM Financial Services Sector Fund into consideration in determining, composing or calculating the BSE FinanceIndex( ) BSE is neither responsible for nor has participated in the determination of the time or price at which the units under JM Financial Services Sector Fund are to be issued or in thedetermination or calculation of the equation by which the units are to be redeemed for the underlying securities. BSE has no obligation or liability in connection with the administration, marketingor trading of JM Financial Services Sector Fund.
BSE does not guarantee the accuracy and/or the completeness and/or continuity of BSE Finance Index( ) or any data included therein and they shall have no liability for any errors, omissions orinterruptions therein or change or cessation thereof. BSE makes no warranty, express or implied, as to the results to be obtained by the JM Financial Asset Management Pvt. Ltd., investors of JMFinancial Services Sector Fund, or any other persons or entities from the use of BSE Finance Index( ) or any data included therein. BSE makes no express or implied warranties and expresslydisclaims all warranties of merchantability or fitness for a particular purpose or use with respect to BSE Finance Index( ) or any data included therein. Without limiting any of the foregoing, in noevent shall BSE have any liability for any special, punitive, indirect or consequential damages (including lost profits), even if notified of the possibility of such damages.
10

PORTFOLIO as on September 28, 2007Issuer Market Value % to
(Rs. In Lacs) NAV
Power 1.53 0.14Power Grid Corp. of India 1.53 0.14
Software 162.47 14.54Geodesic Information Systems 62.78 5.62
Sasken 26.78 2.40
Tech Mahindra 72.91 6.52
Telecom-Services 937.78 83.90Bharti Airtel 353.24 31.60
Mahanagar Tel. Nigam 37.75 3.38
Reliance Communications 348.30 31.16
Tanla Solutions 75.85 6.79
Tulip IT Services 122.64 10.97
Total Equity 1,101.78 98.58
CBLO & Others* 16.01 1.42
Total Assets 1,117.79 100.00
(*includes net receivables / payables, if any)
Total Corpus as on September 28, 2007 - Rs. 11.18 Crores
Performance (%) as on September 28, 2007 :Plan 1 Month 3 Months 6 Months Incep.*Growth Plan 8.05 9.01 24.76 32.24BSE Telecom ** 11.01 12.54 29.19 36.66
* Inception date = Allotment date i.e. 07.12.2006** Benchmark Index: BSE Telecom Index ( ) $
Note: Absolute Returns for period less than 1 year. Pastperformance may or may not be sustained in future.
Portfolio Turnover Ratio : 0.0221
JM Telecom Sector Fund(An open-ended equity oriented sector fund)
NAV as on September 28, 2007 :Growth Plan (Rs.) : 13.2242Dividend Plan (Rs.) : 13.2250
Inception : 7th December, 2006
Fund Manager : Asit Bhandarkar
Investment Objective :The primary investment objective of the scheme is to investpredominantly in equity & equity related instruments in the TelecomSectors in India. Accordingly the NAV of the Scheme is linked to theequity performance of such companies. However, there can be noassurance that the investment objectives of the scheme will berealised. The scheme does not guarantee / indicate any returns.
Giving our family of investors many reasons to celebrate
$ DISCLAIMER: BSE Telecom Index( ) : JM Telecom Sector Fund is not sponsored, endorsed, sold or promoted by BSE. BSE makes no representation or warranty, express or implied to theinvestors in JM Telecom Sector Fund or any member of the public in any manner whatsoever regarding the advisability of investing in securities generally or in JM Telecom Sector Fund particularlyor the ability of the index to track the sectors represented in the BSE Telecom Index( ). The relationship of BSE to the JM Financial Asset Management Pvt. Ltd. is in respect of the licensing of useof BSE Telecom Index( ) which is determined, composed and calculated by BSE without regard to the JM Financial Asset Management Pvt. Ltd. or JM Telecom Sector Fund. BSE has no obligationto take the needs of the investors of JM Telecom Sector Fund into consideration in determining, composing or calculating the BSE Telecom Index( ). BSE is neither responsible for nor hasparticipated in the determination of the time or price at which the units under JM Telecom Sector Fund are to be issued or in the determination or calculation of the equation by which the units areto be redeemed for the underlying securities. BSE has no obligation or liability in connection with the administration, marketing or trading of JM Telecom Sector Fund.
BSE does not guarantee the accuracy and/or the completeness and/or continuity of BSE Telecom Index( ) or any data included therein and they shall have no liability for any errors, omissions orinterruptions therein or change or cessation thereof. BSE makes no warranty, express or implied, as to the results to be obtained by the JM Financial Asset Management Pvt. Ltd., investors of JMTelecom Sector Fund, or any other persons or entities from the use of BSE Telecom Index( ) or any data included therein. BSE makes no express or implied warranties and expressly disclaimsall warranties of merchantability or fitness for a particular purpose or use with respect to BSE Telecom Index( ) or any data included therein. Without limiting any of the foregoing, in no event shallBSE have any liability for any special, punitive, indirect or consequential damages (including lost profits), even if notified of the possibility of such damages.
ASSET CLASSIFICATION (%)
(*includes net receivables / payables, if any)
11
Giving our family of investors many reasons to celebrate
NAV as on September 28, 2007 :
Growth Plan (Rs.) : 13.9300Dividend Plan (Rs.) : 13.9253
Inception : 7th April, 2006
Fund Manager : Sandeep Neema
Investment Objective :To generate medium to long term capital growth from a portfoliothat is substantially constituted of equity & equity relatedsecurities of companies which could benefit from the structuralchanges brought about by the continuing liberalization ineconomic policies and investments by the Government in thehousing, infrastructure and financial services sectors.
JM HI FI Fund (JM Housing, Infrastructure & Financial Services Fund)(An open ended equity oriented growth fund)
Performance (%) as on September 28, 2007 :Plan 1 Year Incep.*Growth Plan 39.15 25.16S&P ** 40.06 28.82
* Inception date = Allotment date i.e. 07.04.2006** Benchmark Index: S&P CNX Nifty IndexNote: Absolute Returns for period less than 1 year. Pastperformance may or may not be sustained in future.
Portfolio Turnover Ratio : 0.0878
PORTFOLIO as on September 28, 2007Issuer Market Value % to
(Rs. In Lacs) NAV
Banks 547.32 12.93Industrial Development Bank of India 211.21 4.99Punjab National Bank 151.91 3.59Union Bank - Futures 184.20 4.35
Cement 131.29 3.10India Cements 131.29 3.10
Construction 816.49 19.28Era Constructions (India) 136.07 3.21Hindustan Construction Co. 136.95 3.23IVRCL Infrastructure & Projects 72.02 1.70Kalindee Rail Nirman (Eng) 249.62 5.90Nagarjuna Construction Co. 175.97 4.16Sobha Developers 45.86 1.08
Construction Materials 132.62 3.13Simplex Projects 132.62 3.13
Consumer Durables 138.59 3.27Voltas 138.59 3.27
Ferrous Metals 378.19 8.94Maharashtra Seamless 123.01 2.91Shree Precoated Steels 99.82 2.36Steel Authority of India 155.36 3.67
Finance 107.48 2.54Infrastructure Development Finance Company 107.48 2.54
Industrial Capital Goods 777.56 18.36Bharat Bijlee 123.65 2.92Bharat Heavy Electricals 162.96 3.85Emco 112.20 2.65McNally Bharat Engineering Co 107.25 2.53Siemens 121.60 2.87Thermax 149.90 3.54
Industrial Products 186.88 4.41Everest Kanto Cylinder 186.88 4.41
Power 2.02 0.05Power Grid Corp. of India 2.02 0.05
Real Estate Developers 402.23 9.49Ansal Properties & Infrastructure 82.63 1.95Housing Development & Inf. 163.22 3.85Peninsula Land 156.38 3.69
Telecom-Services 146.69 3.46Reliance Communications 146.69 3.46
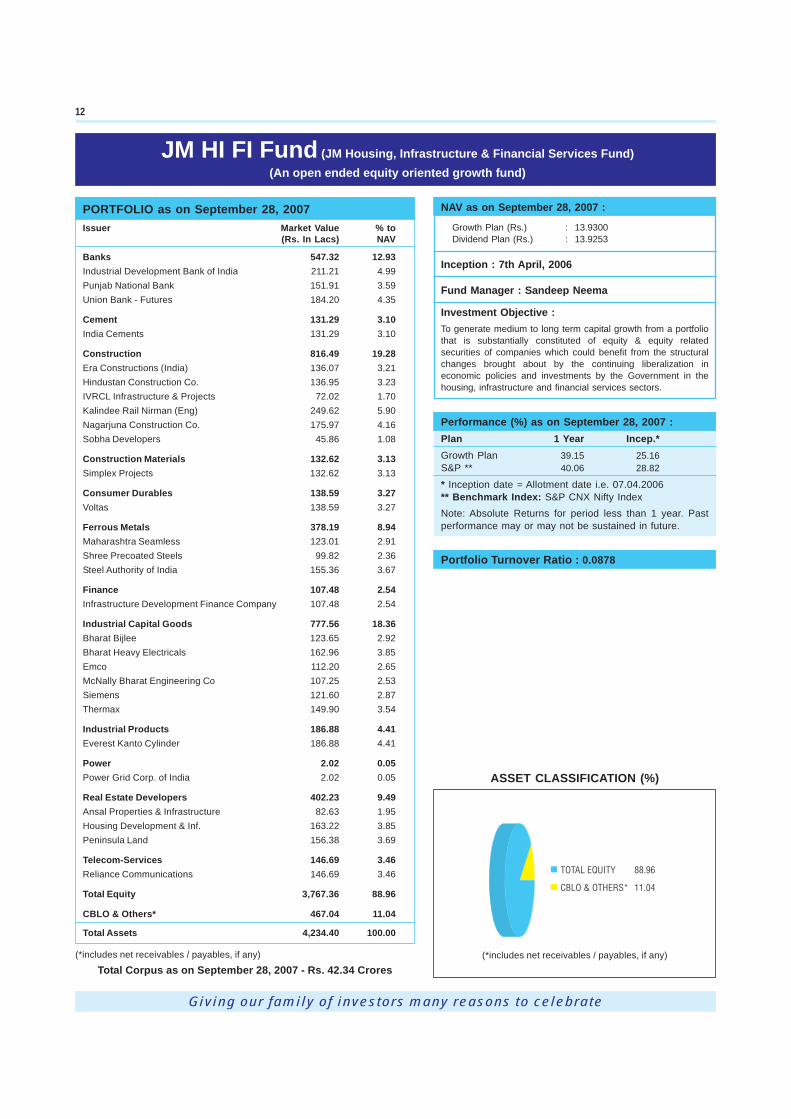
Total Equity 3,767.36 88.96
CBLO & Others* 467.04 11.04
Total Assets 4,234.40 100.00
(*includes net receivables / payables, if any)
Total Corpus as on September 28, 2007 - Rs. 42.34 Crores(*includes net receivables / payables, if any)
ASSET CLASSIFICATION (%)
12

Giving our family of investors many reasons to celebrate
13
NAV as on September 28, 2007 :
Regular Plan - Growth Option : 12.3941Regular Plan - Dividend Option : 12.3941Institutional Plan - Growth Option : 10.0000Institutional Plan - Dividend Option : 10.0000
Inception : 30th April, 2007
Fund Manager : Sandip Sabharwal
Investment Objective :The investment objective of the Scheme is to provide capitalappreciation by primarily investing in small cap and mid-capstocks. Small cap stock is defined as any company which has amarket capitalization less than 10% of the market capitalizationof the last stock in S&P CNX NIFTY. Mid-cap stock is definedas any company which has a market capitalization less than themarket capitalization of the last stock in S&P CNX NIFTY butgreater than 10% of the market capitalization of the last stock inS&P CNX NIFTY.
JM Small & Mid-Cap Fund (An open ended equity oriented fund)
Portfolio Turnover Ratio : 0.1052
PORTFOLIO as on September 28, 2007Issuer Market Value % to
(Rs. In Lacs) NAV
Auto Ancillaries 1,280.98 6.79Apollo Tyre 1,280.98 6.79
Cement 985.82 5.22Century Textile & Inds. 985.82 5.22
Construction 2,170.60 11.50Hindustan Construction Co. 1,023.32 5.42Nagarjuna Construction Co. 1,147.28 6.08
Consumer Non Durable 2,717.06 14.40Gitanjali Gems 1,396.57 7.40Hanung Toys & Textiles 1,320.49 7.00
Industrial Capital Goods 2,554.75 13.53Bharati Shipyard 1,247.98 6.61Emco 1,306.77 6.92
Industrial Products 1,484.20 7.86Sintex Industries 1,484.20 7.86
Non Ferrous Metals 444.99 2.36Sujan Towers 444.99 2.36
Real Estate Developers 1,392.74 7.38Ansal Properties & Infrastructure 849.32 4.50Housing Development & Inf. 543.42 2.88
Software 744.21 3.943i Infotech 744.21 3.94
Telecom-Services 1,000.08 5.30Tulip IT Services 1,000.08 5.30
Textile Products 1,196.60 6.34Bombay Rayon Fashions 1,196.60 6.34
Textiles & Apparel 965.93 5.12House of Pearl Fashions 965.93 5.12
Transportation 1,137.49 6.03Spicejet 1,137.49 6.03
Total Equity 18,075.45 95.77
CBLO & Others* 796.36 4.23
Total Assets 18,871.81 100.00
(*includes net receivables / payables, if any)
Total Corpus as on September 28, 2007 - Rs. 188.72 Crores
Performance (%) as on September 28, 2007 :Plan 1 Month 3 Months Incep.*Regular Plan - Growth Option 9.09 17.08 23.94Institutional Plan - Growth OptionCNX MCI ** 16.15 14.92 30.91
* Inception date = Allotment date i.e. 30.04.2007** Benchmark Index: CNX MID CAP INDEXNote: Absolute Returns for period less than 1 year. Pastperformance may or may not be sustained in future.
DISCLAIMER : JM Small & Mid-cap Fund (“Product”) is not sponsored, endorsed, sold or promoted by India Index Services & Products Limited (“IISL”). IISLmakes no representation or warranty, express or implied to the owners of the Product or any member of the public regarding the advisability of investing insecurities generally or in the Product particularly or the ability of the CNX Midcap Index to track general stock market performance in India. The relationshipof IISL to JM Financial Asset Management Private Limited is in respect of the using of the trademark and trade name of CNX Midcap Index which isdetermined, composed and calculated by IISL without regard to the JM Financial Asset Management Private Limited or the Product. IISL has no obligationto take the needs of JM Financial Asset Management Private Limited or the owners of the Product into consideration in determining, composing orcalculating the CNX Midcap Index. IISL is not responsible for nor has participated in the determination of the timing of, prices at, or quantities of the Productto be issued or in the determination or calculation of the equation by which the Product is to be converted into cash. IISL has no obligation or liability inconnection with the administration, marketing or trading of the Product.IISL does not guarantee the accuracy and / or the completeness of the CNX Midcap Index or any data included therein and they shall have no liability for anyerrors, omissions, or interruptions therein. IISL makes no warranty, express or implied, as to the results to be obtained by the JM Financial Asset ManagementPrivate Limited, owners of the Product, or any other persons or entities from the use of the CNX Midcap Index or any data included therein. IISL makes noexpress or implied warranties and expressly disclaims all warranties of merchantability or fitness for a particular purpose or use with respect to the CNXMidcap Index or any data included therein. Without limiting any of the foregoing, in no event shall IISL have any liability for any special, punitive, indirect orconsequential damages (including lost profits), even if notified of the possibility of such damages.
ASSET CLASSIFICATION (%)
(*includes net receivables / payables, if any)

Giving our family of investors many reasons to celebrate
14
PORTFOLIO as on September 28, 2007Issuer Market % to Market Rating
Value NAV Value(Rs.In Lacs) (Rs.In Lacs)
Futures
Auto 355.06 0.58Ashok Leyland 343.65 0.56Ashok Leyland - Futures (347.05)Escorts India 11.41 0.02Escorts India - Futures (11.44)
Banking Services 733.76 1.19DENA Bank 38.92 0.06DENA Bank - Futures (39.44)Syndicate Bank 694.84 1.13Syndicate Bank - Futures (703.12)
Banks 15,813.20 25.83Allahabad Bank 989.60 1.62Allahabad Bank - Futures (1006.10)Andhra Bank 685.21 1.12Andhra Bank - Futures (696.31)Bank of Baroda 1,983.81 3.24Bank of Baroda - Futures (2005.38)Central Bank of India 59.50 0.10Central Bank of India - Futures (60.22)Indian Overseas Bank 17.03 0.03Indian Overseas Bank - Futures (17.25)Indusind Bank 388.51 0.63Indusind Bank - Futures (393.45)Kotak Mahindra Bank 1,212.23 1.98Kotak Mahindra Bank - Futures (1226.43)Oriental Bank of Commerce 49.36 0.08Oriental Bank of Commerce - Futures (50.29)Punjab National Bank 1,445.35 2.36Punjab National Bank - Futures (1461.07)State Bank of India 5,929.98 9.69State Bank of India - Futures (6010.13)Union Bank 1,800.93 2.94Union Bank - Futures (1824.64)Vijaya Bank 1,244.86 2.03Vijaya Bank - Futures (1260.82)Yes Bank 6.83 0.01Yes Bank - Futures (6.92)
Cement 1,531.40 2.50India Cements 1,531.40 2.50India Cements - Futures (1550.29)
Chemicals 117.20 0.19Gujarat Alkalies & Chemicals 117.20 0.19Gujarat Alkalies & Chemicals - Futures (118.52)
Construction 1,324.52 2.16GMR Infrastructure 643.62 1.05GMR Infrastructure - Futures (643.62)Nagarjuna Construction Co. 37.98 0.06Nagarjuna Construction Co. - Futures (38.18)Parsvnath Developers 336.32 0.55Parsvnath Developers - Futures (340.54)Punj Lloyd 306.60 0.50Punj Lloyd - Futures (308.88)
Consumer Durables 246.53 0.40Voltas 246.53 0.40Voltas - Futures (247.97)
Consumer Non Durable 1,556.16 2.54Bajaj Hindustan 9.74 0.02Bajaj Hindustan - Futures (9.81)
NAV as on September 28, 2007 :
Growth Plan (Rs.) : 11.0578Dividend Plan (Rs.) : 10.1575
Inception : 18th July, 2006
Fund Manager : Biren Mehta
Investment Objective :
The primary investment objective of the scheme is togenerate income through arbitrage opportunities emerging outof mis-pricing between the cash market and the derivativesmarket and through deployment of surplus cash in fixedincome instruments.
JM Arbitrage Advantage Fund (An Open-Ended Equity Oriented Interval Fund)
Issuer Market % to Market RatingValue NAV Value
(Rs.In Lacs) (Rs.In Lacs)Futures
continued on next page
Balrampur Chini Mills 724.80 1.18Balrampur Chini Mills - Futures (733.92)Triveni Engineering & Industries 821.62 1.34Triveni Engineering & Industries - Futures (830.86)Ferrous Metals 3,645.39 5.95Jindal Steel & Power 563.96 0.92Jindal Steel & Power - Futures (569.67)JSW Steel 112.59 0.18JSW Steel - Futures (113.30)Maharashtra Seamless 132.85 0.22Maharashtra Seamless - Futures (134.18)Sesa Goa 2,835.99 4.63Sesa Goa - Futures (2855.66)Fertilizers 1,982.17 3.24Chambal Fertilizers & Chemicals 735.52 1.20Chambal Fertilizers & Chemicals - Futures (745.62)Nagarjuna Fertilizers 965.58 1.58Nagarjuna Fertilizers - Futures (977.55)Oswal Chemicals & Fertilizers 281.07 0.46Oswal Chemicals & Fertilizers - Futures (284.43)Finance 1,891.25 3.09IFCI 1,443.76 2.36IFCI - Futures (1463.43)Infrastructure Development Finance Company 145.63 0.24Infrastructure Development Finance Company - Futures (147.29)LIC Housing Finance 301.86 0.49LIC Housing Finance - Futures (304.69)Gas Utilities 669.61 1.09Reliance Natural Resources 669.61 1.09Reliance Natural Resources - Futures (676.68)Hotels 367.21 0.60Hotel Leela Venture 309.29 0.51Hotel Leela Venture - Futures (314.18)Indian Hotels Co. 57.92 0.09Indian Hotels Co. - Futures (58.34)Industrial Capital Goods 474.25 0.77Lakshmi Machine Works 474.25 0.77Lakshmi Machine Works - Futures (479.27)Industrial Products 40.03 0.07Bharat Forge 40.03 0.07Bharat Forge - Futures (40.10)Media & Entertainment 1,096.37 1.79Adlabs Films 30.37 0.05Adlabs Films - Futures (30.60)New Delhi Television 1,066.00 1.74New Delhi Television - Futures (1079.65)Metals & Mining 840.31 1.37Neyveli Lignite Corporation 840.31 1.37Neyveli Lignite Corporation - Futures (847.87)Paper 54.78 0.09Ballarpur Industries 54.78 0.09Ballarpur Industries - Futures (55.38)Pesticides 177.99 0.29United Phosphorous 177.99 0.29United Phosphorous - Futures (180.03)Petrochemicals 1,434.99 2.34Mangalore Refineries & Petrochemicals 938.19 1.53Mangalore Refineries & Petrochemicals - Futures (947.23)

Giving our family of investors many reasons to celebrate
15
Performance (%) as on September 28, 2007 :Plan 1 Mth 3 Mths 6 Mths 1 Year Incep.*Growth Plan 0.49 2.09 4.28 9.09 8.76CLFI ** 0.66 1.46 4.00 7.35 7.07
* Inception date = Allotment date i.e. 18.07.2006** Benchmark Index: CRISIL LIQUID FUND INDEXNote: Absolute Returns for period less than 1 year. CAGR for period 1year or more, with reinvestment of dividends (if any). Past performancemay or may not be sustained in future.
Dividend History :Dividend Plan :
FY 2007-08 : 4.5000%FY 2006-07 : 4.2000%
After payment of dividend, the NAV will fall to the extent of payoutand distribution taxes wherever applicable. Past performance may ormay not be sustained in future. The face value per unit is Rs.10/-.
Portfolio Turnover Ratio : 0.5962
ASSET CLASSIFICATION (%)
(*includes net receivables / payables, if any)
JM Arbitrage Advantage Fund (An Open-Ended Equity Oriented Interval Fund)contd.....
Issuer Market % to Market RatingValue NAV Value
(Rs.In Lacs) (Rs.In Lacs)Futures
Petronet LNG 496.80 0.81Petronet LNG - Futures (501.73)
Petroleum Products 519.26 0.85Bongaigaon Refinery 126.38 0.21Bongaigaon Refinery - Futures (127.58)Chennai Petroleum 288.15 0.47Chennai Petroleum - Futures (291.18)Indian Oil Corporation 79.04 0.13Indian Oil Corporation - Futures (79.67)Reliance Petroleum 25.69 0.04Reliance Petroleum - Futures (25.95)
Pharmaceuticals 1,359.93 2.22Aurobindo Pharma 138.89 0.23Aurobindo Pharma - Futures (139.76)Cipla 20.51 0.03Cipla - Futures (20.58)Divi’s Laboratories 620.30 1.01Divi’s Laboratories - Futures (626.35)Orchid Chemicals & Pharma 580.23 0.95Orchid Chemicals & Pharma - Futures (586.79)
Power 1,569.59 2.56Power Finance Corporation 1,569.59 2.56Power Finance Corporation - Futures (1576.58)
Real Estate Developers 593.62 0.98Housing Development & Inf. 286.25 0.47Housing Development & Inf. - Futures (288.60)IVR Prime Urban Estate Developers 40.70 0.07IVR Prime Urban Estate Developers - Futures (40.78)Omaxe 201.51 0.33Omaxe - Futures (203.90)Peninsula Land 65.16 0.11Peninsula Land - Futures (65.63)
Retail 1,196.10 1.95Pantaloon Retail (India) 1,196.10 1.95Pantaloon Retail (India) - Futures (1212.05)
Software 1,913.59 3.13Aptech 202.58 0.33Aptech - Futures (204.04)Hinduja TMT 39.34 0.06Hinduja TMT - Futures (39.69)I-Flex Solutions 193.26 0.32I-Flex Solutions - Futures (195.09)Mphasis BFL 141.83 0.23Mphasis BFL - Futures (143.44)NIIT Technologies 1,124.55 1.84NIIT Technologies - Futures (1137.88)
Issuer Market % to Market RatingValue NAV Value
(Rs.In Lacs) (Rs.In Lacs)Futures
TATA Consultancy Service 212.03 0.35TATA Consultancy Service - Futures (212.63)
Steel 293.68 0.48Welspun Gujarat Stahl Rohren 293.68 0.48Welspun Gujarat Stahl Rohren - Futures (296.31)
Telecom-Equipment & Accessories 54.82 0.09Sterlite Optical Technologies 54.82 0.09Sterlite Optical Technologies - Futures (55.01)
Telecom-Services 683.34 1.11GTL 619.70 1.01GTL - Futures (624.58)Tata Teleservices (Maharashtra) 63.64 0.10Tata Teleservices (Maharashtra) - Futures (64.37)
Textile Products 1,978.19 3.23Alok Industries 71.56 0.12Alok Industries - Futures (72.21)Arvind Mills 802.47 1.31Arvind Mills - Futures (812.17)S.Kumars Nationwide 1,104.16 1.80S.Kumars Nationwide - Futures (1123.12)
Textiles - Synthetic 257.09 0.42SRF 257.09 0.42SRF - Futures (259.92)
Total Equity 44,771.39 73.10
Fixed Deposit Scheme 16,300.00 26.63HDFC Bank 1,000.00 1.63HDFC Bank 1,000.00 1.63HDFC Bank 500.00 0.82HDFC Bank 500.00 0.82HDFC Bank 1,000.00 1.63HDFC Bank 800.00 1.31Jammu & Kashmir Bank 500.00 0.82Jammu & Kashmir Bank 1,500.00 2.45Jammu & Kashmir Bank 2,000.00 3.27Jammu & Kashmir Bank 2,500.00 4.08Jammu & Kashmir Bank 2,000.00 3.27Jammu & Kashmir Bank 1,000.00 1.63UTI Bank 2,000.00 3.27
Total Debt 16,300.00 26.63
CBLO & Others* 155.47 0.27
Total Assets 61,226.86 100.00
(*includes net receivables / payables, if any)
Total Corpus as on September 28, 2007 - Rs. 612.27 Crores

Giving our family of investors many reasons to celebrate
Scheme JM JM JM JM JM G-Sec JM JM JM JM JMDetails Income Fund High Liquidity Money G-Sec Fund Fund (PF & Short Term Floater Liquid Plus Equity & MIP Fund
Fund Manager Fund (Regular Plan) PF Plus Plan) Fund Fund Fund Derivative Fund
Launch Date Dec 1994 Dec 1997 Sept 2006 Sept 1999 Sept 1999 June 2002 June 2003 June 2003 Feb 2005 Aug 2003**Super IP: PF Plus: LPF-PP° :May ‘04 Dec 2003 Sept 2004Premium Plan -Daily Div Option:10 Feb 2006
Entry Load Nil Nil Nil Nil Nil Nil Nil Nil Nil Nil
Exit Load 0.40% if = < Nil Regular & 0.25% for Nil Nil STP : Nil LPF: 0.50% = For investments 0.50%~Rs.5 lakhs if Super Plan: Nil investment 0.60 %(+) < Rs.5.00 lakhs of less than & incl.redeemed / Super Plus upto Rs.2 lakhs if redeemed / Rs.1 Crore: 2% forswitched Plan: w.e.f. if redeemed / switched investments< 90 days 01/02/2007, switched < 90 days redeemed withinfrom date of 0.1% if < 90 days from date of 25 days from theinvestment. redeemed from date of investment. date of allotment.Nil > Rs.5 lakhs. within 7 investment. Nil > Rs.5 lakhs. 1.5% for investments
calendar days LPF-PP°: Nil redeemed withinfrom the date 85 days from theof allotment date of allotment.of units. 1% for investments
redeemed within175 days from thedate of allotment.For investmentsabove Rs. 1 Crore:0.50% for investmentsredeemed / switchedout within 25 daysfrom the date ofallotment.
Plans / Growth Plan Growth Plan Regular Plan: Growth option PF Plan: Growth Plan Short Term Regular Plan: Growth option Growth Planoptions Dividend Plan Dividend Plan Growth option Dividend option Growth option Dividend Plan Plan: Growth option Dividend option Dividend Plan -
Growth Plan - Daily Div. Plan Daily Div. option Bonus option Dividend option Institutional Growth option Dividend option Bonus option Mly. Div. optionBonus option Growth Plan - Weekly Div. option PF Plus Plan: Plan: Dividend option Premium Plan: Qly. Div. option
Bonus option Fortnightly- Growth option Growth option Growth option Ann. Div. optionDividend Plan - Div. option Dividend option Dividend option Dividend optionQly. Div. option Super Plan:Premium Plan - Growth optionDaily Div. option Daily Div. optionInst. Plan: Weekly Div. optionGrowth option Fortnightly-Dividend option Div. optionDaily Div. option Super Plus Plan:Super Inst. Plan: Growth optionGrowth option Daily Div. optionDaily Div. option Weekly Div. optionWkly Div. option Fortnightly-
Div. option
Dividend Quarterly $ Daily / Daily / Weekly / Quarterly - Fortnightly Short Term Regular Plan - Monthly /Frequency¥ Weekly / Qtly Fortnightly (with Plan - Daily Daily / Weekly / Quarterly /
* Daily / Weekly compulsory Quarterly Annuallyre-investment) LPF-PP°
Daily / Weekly /Fortnightly
Minimum Rs. 5000 Rs. 5000 Rs.5000 Rs. 5000 Rs. 5000 Rs. 5000 Rs. 5000 Rs. 5000 Rs. 5000 Rs. 10000Investment▲ # Rs. 1 Lakh PF Plus: *Rs. 1 Lakh LPF-PP°:
* Rs. 1 Crore Rs. 1 Lakh Rs.1 Lakh** Rs. 5 Crore
Redemption T + 2 T + 1 T+1 T + 2 T + 2 T + 1 T + 1 T + 1 T + 2 (***) T + 2Time¤ Working Days Working Days Working Days Working Days Working Days Working Days Working Days Working Days Working Days Working Days
SCHEMES AT A GLANCE
16

Giving our family of investors many reasons to celebrate
17
ABBREVIATIONS : $ Regular Plan. # For Regular - Daily Dividend Plans / Options. * For Institutional Plan. ** For Super Institutional Plan. + 0.60% (atapplicable NAV) if redeemed [either through normal redemption or exercising Fixed Period Redemption Option (FPRO)] or switched out within 180 daysfrom the date of making the investment. The exit load however, would not be applicable for cases covered under Automatic Annual Reinvestment Option(AARO) & Automatic Capital Appreciation Withdrawal Option (ACAWO). ¤It will be our endeavor to dispatch redemption proceeds as indicated in the tableabove. As per the Regulations, the Fund is required to dispatch redemption proceeds within 10 Business days of receiving a valid redemption request. Forfurther details, investors are requested to refer to the Scheme Offer Document. ° LPF-PP : Liquid Plus Fund - Premium Plan. ~ 0.50% if redeemed within3 months for investments upto and including Rs.5 Lakhs and NIL for investments exceeding Rs.5 Lakhs. However no exit load is applicable for investorsavailing Systematic Withdrawal Option. μ 2.25% of NAV on all investments of less than Rs. 3 crores; Nil on all investments of Rs. 3 crores and above. Nilfor investors under Systematic Investment Facility (SIF) and Systematic Transfer Facility (STF). @ On all investments of less than Rs. 3 crores, in case theinvestments are redeemed within 182 days of transfer / allotment of units. @@ On all investments of Rs. 3 crores and above, in case the investments areredeemed within 91 days of transfer / allotment of units. ß 2.25% of NAV for investments through STF and SIF, if redeemed within 1 year of transfer /allotment of respective installments. ▲ After the minimum investment, additional investment under all Schemes / Plans is in multiples of Re. 1/-. For ongoinginvestment in an existing folio, the minimum investment will be Rs. 1,000/- and in multiples of Re.1/- thereafter. For investing under SIF/STF/SWP option,please refer to respective scheme offer documents. ¥ Dividends shall be declared at the discretion of the Trustee subject to availability of distributable profitsas computed in accordance with SEBI (Mutual Funds) Regulations, 1996.( ) The redemption shall be in terms of Interval Period defined hereinbelow.Redemption request can be submitted to the official point of acceptance on any business day till 3.00 pm. All redemption requests received till Friday (in casesuch Friday is a holiday then the last business day) of the week preceding the interval period, would be processed at the NAV of the Interval Period. The Intervalperiod will be the settlement Thursday (the settlement day for derivatives segment in the NSE which is currently last Thursday of the month) or any day whichis declared as the settlement day for Derivatives segment by the NSE.Illustrative Example:
Interval Period Applications for redemption / switchout Applicable NAV for theredemption/switchout
For July 2007 - 26.07.2007 All redemptions received till 20.07.2007 before 3.00 p.m. NAV of 26.07.2007For August 2007 - 30.08.2007 All redemptions received on 20.07.2007 after 3.00 p.m. and NAV of 30.08.2007
during the period 21.07.2007 to 24.08.2007 before 3.00 p.m.
It is clarified that the cut-off timings will also be applicable to investments made through “sweepmode”.Investors will not have to bear entry load, wherever applicable, for their inter-equity and intra equity scheme switches except in case of (i) switches to / fromJM Arbitrage Advantage Fund from / to any equity scheme and (ii) switches from any scheme to an equity scheme during its New Fund Offer period.
The above details are subject to provisions laid down in the respective scheme Offer Documents.
SCHEMES AT A GLANCEScheme JM JM JM JM JM JM JM JM JM JM JMDetails Equity Fund Balanced Basic Fund Auto Sector Healthcare Emerging HI FI Fund Arbitrage Financial Telecom Small &
Fund Fund Sector Leaders Advantage Services Sector MidcapFund Fund Fund Sector Fund Fund Fund
Launch Date Dec 1994 Dec 1994 Mar 1997 June, 2004 June, 2004 June, 2005 Feb 2006 June 2006 Nov 2006 Nov 2006 March 2007
Entry Load 2.25% µ 2.25% µ 2.25% µ 2.25% µ 2.25% µ 2.25% µ 2.25% µ Nil 2.25% µ 2.25% µ 2.25% µ
Exit Load 0.50%@ 0.50%@ 0.50%@ 0.50%@ 0.50%@ 0.50%@ 0.50%@ 0.50% if 0.50%@ 0.50%@ 0.50%@
0.50% @@ 0.50% @@ 0.50% @@ 0.50% @@ 0.50% @@ 0.50% @@ 0.50% @@ redeemed 0.50% @@ 0.50% @@ 0.50% @@
2.25% ß 2.25% ß 2.25% ß 2.25% ß 2.25% ß 2.25% ß 2.25% ß within 2.25% ß 2.25% ß 2.25% ß
30 days ofallotment /transfer ofunits
Plans / Growth Plan Growth Plan Growth Plan Growth Plan Growth Plan Growth Plan Growth Plan Growth Plan Growth Plan Growth Plan Growth Planoptions Dividend Plan Dividend Plan Dividend Plan Dividend Plan Dividend Plan Dividend Plan Dividend Plan Dividend Plan Dividend Plan Dividend Plan Dividend Plan
Dividend - - - - - - - - - - -Frequency¥
Minimum Rs. 5000 Rs. 5000 Rs. 5000 Rs. 5000 Rs. 5000 Rs. 5000 Rs. 5000 Rs. 5000 Rs. 5000 Rs. 5000 Rs. 5000Investment▲ Inst. Plan:
Rs. 3 crores
Redemption T + 3 T + 3 T + 3 T + 3 T + 3 T + 3 T + 3 T + 2 (***) T + 3 T + 3 T + 3Time¤ Working Days Working Days Working Days Working Days Working Days Working Days Working Days Working Days Working Days Working Days Working Days

Giving our family of investors many reasons to celebrate
JM MIP Fund(An open-ended monthly income fund with no assured return. Monthly Income is not
assured and is subject to the availability of the distributable surplus.)
PORTFOLIO as on September 28, 2007Issuer Market Value % to Rating
(Rs. In Lacs) NAVAuto Ancillaries 47.04 3.49Apollo Tyre 47.04 3.49
Banks 33.02 2.45HDFC Bank 33.02 2.45
Beverages 0.47 0.03McDowell India Spirits 0.47 0.03
Construction Materials 38.70 2.87Action Construction Equipment 35.32 2.62Simplex Projects 3.38 0.25
Consumer Durables 23.94 1.78Kaveri Seed Company 23.94 1.78
Industrial Products 32.61 2.42Cummins India 32.61 2.42
Power Generation 1.70 0.13Power Grid Corp. of India 1.70 0.13
Real Estate Developers 41.30 3.06Housing Development & Inf. 41.30 3.06
Total Equity 218.78 16.23
Certificate of Deposits 294.40 21.84Hong Kong Bank 199.80 14.82 F1+ICICI Bank 94.60 7.02 A1+
Floating Rate Bonds 435.01 32.26IDBI 130.00 9.64 AA+IDBI 75.00 5.56 AA+Union Bank of India 210.00 15.58# AA+UTI Bank 20.01 1.48 LAA+
Non Convertible Debenture 145.47 10.79Reliance Industries 145.47 10.79 AAA
Securitised 9.46 0.70Indian Retail ABS Trust Srs 47-A1 9.46 0.70 LAAA(so)
Total Debt 884.34 65.59
CBLO & Others* 245.10 18.18
Total Assets 1,348.22 100.00
(*includes net receivables / payables, if any)# Increase over 15% on account of market movements / change in net assets ofthe scheme.
Total Corpus as on September 28, 2007 - Rs. 13.48 Crores
NAV as on September 28, 2007 :
Growth Plan (Rs.) : 13.9292Dividend Plan - Monthly Div. option (Rs.) : 10.7646Dividend Plan - Quarterly Div. option (Rs.) : 10.8952Dividend Plan - Annual Div. option (Rs.) : 11.5896
Inception : 18th September, 2003
Fund Manager : Shalini Tibrewala
Investment Objective :To generate regular income, primarily through investmentsin fixed income securities so as to make monthly,quarterly and annual dividend distribution, declare bonusin the growth option. The Fund would also aim to achievecapital appreciation through investing a portion of itsassets in equity and equity related securities.
Performance (%) as on September 28, 2007 :Plan 1 3 6 1 3 Incep.*
Month Months Months Year YearsGrowth Plan 1.90 3.51 6.62 8.18 9.30 8.57CMIP In ** 2.78 4.62 8.28 10.32 9.70 8.80
* Inception date = Allotment date i.e. 18.09.2003** Benchmark Index: CRISIL MIP BLENDED INDEX
Note: Absolute Returns for period less than 1 year. CAGR forperiod 1 year or more, with reinvestment of dividends (if any).Past performance may or may not be sustained in future.
Dividend History :FY 2007-08$
Dividend Plan - Monthly Div. option : 3.6780%Dividend Plan - Quarterly Div. option : 1.8390%
FY 2006-07$
Dividend Plan - Monthly Div. option : 7.356%Dividend Plan - Quarterly Div. option : 7.317%Dividend Plan - Annual Div. option : 9.000%
FY 2005-06$
Dividend Plan - Monthly Div. option : 6.1870%Dividend Plan - Quarterly Div. option : 6.8700%Dividend Plan - Annual Div. option :11.5000%
FY 2004-05$
Dividend Plan - Monthly Div. option : 5.2010%Dividend Plan - Quarterly Div. option : 5.1420%
FY 2003-04Dividend Plan - Monthly Div. option : 3.90 %Dividend Plan - Quarterly Div. option : 4.00 %
After payment of dividend, the NAV will fall to the extent ofpayout and distribution taxes wherever applicable. Pastperformance may or may not be sustained in future. The facevalue per unit is Rs.10/-. $ Includes Dividend Distribution Tax.
Portfolio Statistics as on September 30, 2007 :Current Yield : 7.99 %Duration : 0.1247 yearsAvg Maturity : 0.2634 years
ASSET CLASSIFICATION (%)
(*includes net receivables / payables, if any)
18
Giving our family of investors many reasons to celebrate
JM Income Fund (An open-ended income scheme)
NAV as on September 28, 2007 :Growth Plan (Rs.) : 29.3950Dividend Plan (Rs.) : 10.3997Growth Plan - Bonus option (Rs.) : 12.0257
Inception : 1st April, 1995
Fund Manager : Mohit Verma
Investment Objective :To generate stable long term returns with low risk strategyand capital appreciation / accretion through investment in debtinstruments and related securities besides preservation ofcapital.
PORTFOLIO as on September 28, 2007Issuer Market Value % to Rating
(Rs. In Lacs) NAV
Non Convertible Debenture 1,011.68 23.38Nabard 503.21 11.63 AAA
State Bank of India 508.47 11.75 AAA
Floating Rate Bonds 1,974.54 45.62IDBI 600.00 13.86 AA+
Indian Railway Fin. Corp. 604.44 13.97 AAA
Union Bank of India 480.00 11.09 AA+
UTI Bank 290.10 6.70 LAA+
Securitised 36.90 0.85Asset Securitisation Trust 22.65 0.52 AAA(so)
Retail Trust II March 2005 Series A1 13.10 0.30 AAA(so)
UBL Trust Series 10 Series A3 1.15 0.03 AAA(so)
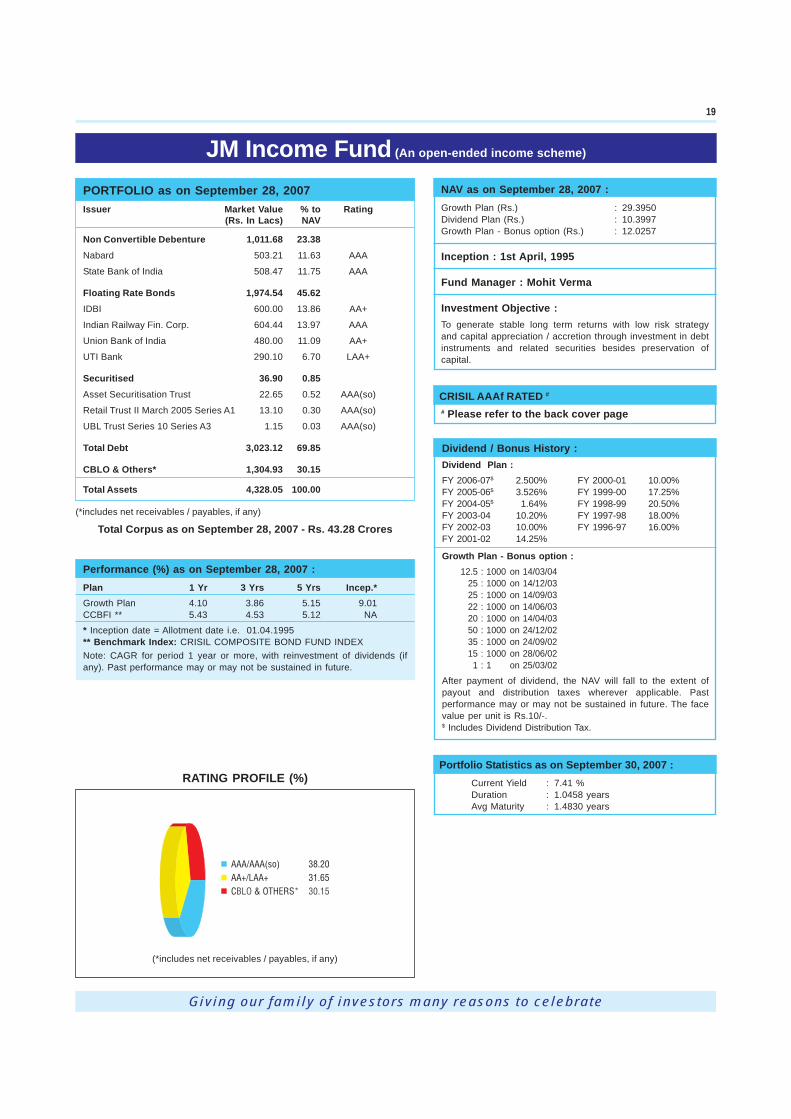
Total Debt 3,023.12 69.85
CBLO & Others* 1,304.93 30.15
Total Assets 4,328.05 100.00
(*includes net receivables / payables, if any)
Total Corpus as on September 28, 2007 - Rs. 43.28 Crores
Performance (%) as on September 28, 2007 :Plan 1 Yr 3 Yrs 5 Yrs Incep.*Growth Plan 4.10 3.86 5.15 9.01CCBFI ** 5.43 4.53 5.12 NA
* Inception date = Allotment date i.e. 01.04.1995** Benchmark Index: CRISIL COMPOSITE BOND FUND INDEXNote: CAGR for period 1 year or more, with reinvestment of dividends (ifany). Past performance may or may not be sustained in future.
Dividend / Bonus History :Dividend Plan :FY 2006-07$ 2.500% FY 2000-01 10.00%FY 2005-06$ 3.526% FY 1999-00 17.25%FY 2004-05$ 1.64% FY 1998-99 20.50%FY 2003-04 10.20% FY 1997-98 18.00%FY 2002-03 10.00% FY 1996-97 16.00%FY 2001-02 14.25%
Growth Plan - Bonus option :12.5 : 1000 on 14/03/04
25 : 1000 on 14/12/0325 : 1000 on 14/09/0322 : 1000 on 14/06/0320 : 1000 on 14/04/0350 : 1000 on 24/12/0235 : 1000 on 24/09/0215 : 1000 on 28/06/021 : 1000 on 25/03/02
After payment of dividend, the NAV will fall to the extent ofpayout and distribution taxes wherever applicable. Pastperformance may or may not be sustained in future. The facevalue per unit is Rs.10/-.$ Includes Dividend Distribution Tax.
Portfolio Statistics as on September 30, 2007 :Current Yield : 7.41 %Duration : 1.0458 yearsAvg Maturity : 1.4830 years
CRISIL AAAf RATED ## Please refer to the back cover page
RATING PROFILE (%)
(*includes net receivables / payables, if any)
19

Giving our family of investors many reasons to celebrate
JM High Liquidity Fund (An open-ended liquid scheme)
continued on next page
PORTFOLIO as on September 30, 2007Issuer Market Value % to Rating
(Rs. In Lacs) NAV
JM HIGH LIQUIDITY FUND
Certificates of Deposits 7,912.04 16.14Federal Bank 2,239.18 4.57 P1+Hong Kong Bank 638.62 1.30 F1+ICICI Bank 1,877.99 3.83 A1+Indian Bank 2,208.50 4.51 P1+State Bank of Indore 947.75 1.93 P1+
Commercial Paper 4,802.52 9.80Micro Inks 1,495.85 3.05 PR1+Pidilite Industries 2,822.44 5.76 P1+Rabo India Finance 484.23 0.99 P1+
Floating Rate Bonds 19,482.30 39.77Citi Fin. Con. Finance 2,516.04 5.14 AAACiticorp Fin (India) 4,926.95 10.06 AAACiticorp Finance 210.00 0.43 AAACiticorp Maruti Fin. 1,002.68 2.05 AAAIDBI 3,090.00 6.31 AA+IDBI 15.00 0.03 AA+Indian Railway Fin. Corp. 221.63 0.45 AAARaymond 2,500.00 5.10 PR1+Sterlite Optical Tech. 3,500.00 7.14 P1Whirlpool of India 1,500.00 3.06 P1+
Privately Placed Debenture 4,000.00 8.16L & T Finance 1,500.00 3.06 PR1+**Ranbaxy Holding Company 2,500.00 5.10 P1
Securitised 3,245.61 6.62BHPC Auto Sec Trust May 2005 Series A1 63.90 0.13 LAAA(so)GE Loan Trust Series I 2,500.00 5.10 LAA(so)India Loan Sec. Series VI Trust 2006 Sr.A 528.40 1.08 AAA(so)Indian Retail ABS Trust Srs 47-A1 85.12 0.17 LAAA(so)Retail Trust II March 2005 Series A1 61.74 0.13 AAA(so)UBL Trust Series 10 Series A3 6.45 0.01 AAA(so)
Total Debt 39,442.47 80.49
CBLO & Others* 9,554.88 19.51
Total Assets 48,997.35 100.00
JM HIGH LIQUIDITY FUND - PREMIUM PLAN - DAILY DIVIDEND OPTION
Certificate of Deposits 99.93 34.21Indian Bank 99.93 34.21 P1+
Total Debt 99.93 34.21
CBLO & Others* 192.18 65.79
Total Assets 292.11 100.00
(*includes net receivables / payables, if any)(**shadow rating)
Total Corpus as on September 30, 2007 - Rs. 492.89 Crores
NAV as on September 30, 2007 :
Growth Plan (Rs.) : 21.2797Dividend Plan (Rs.) : 10.4625Daily Dividend Plan (Rs.) : 10.4302Growth Plan - Bonus option (Rs.) : 11.1749Dividend Plan - Quarterly Dividend option (Rs.) : 12.2511Institutional Plan - Growth option (Rs.) : 12.8380Institutional Plan - Dividend option (Rs.) : 10.2256Institutional Plan - Daily Dividend option (Rs.) : 10.0159Super Inst. Plan - Growth option (Rs.) : 12.2077Super Inst. Plan - Daily Dividend option (Rs.) : 10.0165Super Inst. Plan - Weekly Dividend option (Rs.) : 10.0215Premium Plan - Daily Dividend option (Rs.) : 10.0000
Inception :31st December, 1997
Fund Manager : Shalini Tibrewala
Investment Objective :
To provide income by way of dividend (dividend plans) and capital
gains (growth plan) through investing in debt and money market
instruments.
CRISIL AAAf RATED ## Please refer to the back cover page
Performance (%) as on September 30, 2007 :Plan 1 3 6
Month Months Months
Growth Plan 6.82 5.96 6.69CLFI ** 7.73 5.78 7.93
Plan 1 Yr 3 Yrs 5 Yrs Incep.*
Growth Plan 7.29 5.88 5.56 8.05CLFI ** 7.35 5.84 5.28 NA
* Inception date = Allotment date i.e. 31.12.1997** Benchmark Index: CRISIL LIQUID FUND INDEX
Note: Simple Annualised returns for period less than 1year, CAGR for period 1 year or more, with reinvestment ofdividends (if any). Past performance may or may not besustained in future.
Portfolio Statistics as on September 30, 2007 :
High Liquidity FundCurrent Yield : 7.65 %Duration : 0.1995 yearsAvg Maturity : 0.1995 years
High Liquidity Fund - Premium Plan - Daily Dividend OptionCurrent Yield : 6.07 %Duration : 0.0056 yearsAvg Maturity : 0.0056 years
20

Giving our family of investors many reasons to celebrate
JM HIGH LIQUIDITY FUNDRATING PROFILE (%)
(*includes net receivables / payables, if any)
21
Dividend / Bonus History :FY 2007-08$
Dividend Plan : 2.9820%Daily Dividend Plan : 3.4140%Inst. Plan - Dividend option : 2.9060%Inst. Plan - Daily Dividend option : 3.2788%Super Inst. Plan - Weekly Div. option : 1.0820%Super Inst. Plan - Daily Div. option : 3.2787%Premium Plan - Daily Div. option : 3.3933%
FY 2006-07$
Dividend Plan : 5.906%Daily Dividend Plan : 7.049%Inst. Plan - Dividend option : 5.855%Inst. Plan - Daily Dividend option : 6.868%Super Inst. Plan - Weekly Div. option : 5.944%Super Inst. Plan - Daily Div. option : 6.982%Premium Plan - Daily Div. option : 6.918%
FY 2005-06$
Dividend Plan : 4.5880%Daily Dividend Plan : 5.0985%Inst. Plan - Dividend option : 4.9020%Inst. Plan - Daily Dividend option : 5.2423%Super Inst. Plan - Weekly Div. option : 5.2540%Super Inst. Plan - Daily Div. option : 5.5167%Premium Plan - Daily Div. option : 0.8614%
FY 2004-05$
Dividend Plan : 22.3350%Daily Dividend Plan : 4.2926%Inst. Plan - Dividend option : 4.4630%Inst. Plan - Daily Dividend option : 4.4686%Super Inst. Plan - Weekly Div. option : 3.9730%Super Inst. Plan - Daily Div. option : 4.0218%
FY 2003-04Dividend Plan : 4.950%Daily Dividend Plan : 4.333%Dividend Plan - Quarterly option : 19.000%Dividend Plan - Annual option : 19.000%Inst. Plan - Dividend option : 4.205%Inst. Plan - Daily Dividend option : 2.866%
FY 2002-03 (Dividend Plan) : 1.180%FY 2001-02 (Dividend Plan) : 7.275%FY 2000-01 (Dividend Plan) : 7.525%FY 1999-00 (Dividend Plan) : 8.500%
Growth Plan - Bonus option :190 : 1000 on 23/10/2006
After payment of dividend, the NAV will fall to the extent of payout anddistribution taxes wherever applicable. Past performance may or maynot be sustained in future. The face value per unit is Rs.10/-.$ Includes Dividend Distribution Tax.
JM High Liquidity Fund (An open-ended liquid scheme)
JM HIGH LIQUIDITY FUND - PREMIUM PLANRATING PROFILE (%)
(*includes net receivables / payables, if any)

22
JM Money Manager Fund (An open-ended income scheme)
NAV as on September 28, 2007 :Regular Plan - Growth option : 10.7032Regular Plan - Daily Dividend option : 10.0000Regular Plan - Weekly Dividend option : 10.0211Super Plan - Growth option : 10.6975Super Plan - Daily Dividend option : 10.0000Super Plan - Weekly Dividend option : 10.0000Super Plus Plan - Growth option : 10.8479Super Plus Plan - Daily Dividend option : 10.0037Super Plus Plan - Weekly Dividend option : 10.0335Super Plus Plan - Fortnightly Dividend option : 10.0395
Investment Objective :
An open-ended liquid scheme which seeks to provideincome by way of dividend (dividend option) and capitalgains (growth option) through investing in debt and moneymarket instruments.
Inception : 27th September, 2006
Fund Manager : Shalini Tibrewala
Giving our family of investors many reasons to celebrate
PORTFOLIO as on September 28, 2007Issuer Market Value % to Rating
(Rs. In Lacs) NAV
Portfolio of REGULAR PLAN
Certificate of Deposits 691.63 61.08Federal Bank 496.13 43.82 P1+Hong Kong Bank 1.00 0.09 F1+ICICI Bank 94.60 8.35 A1+Indian Bank 99.90 8.82 P1+
Non Convertible Debenture 72.74 6.42Reliance Industries 72.74 6.42 AAA
Privately Placed Debenture 200.00 17.66Reliance Capital 200.00 17.66 A1+
Total Debt 964.37 85.16
CBLO & Others* 167.91 14.84
Total Assets 1,132.28 100.00
Portfolio of SUPER PLAN
Certificate of Deposits 283.80 28.56ICICI Bank 283.80 28.56 A1+
Non Convertible Debenture 72.74 7.32Reliance Industries 72.74 7.32 AAA
Privately Placed Debenture 100.00 10.06Reliance Capital 100.00 10.06 A1+
Total Debt 456.54 45.94
CBLO & Others* 537.11 54.06
Total Assets 993.65 100.00
Portfolio of SUPER PLUS PLAN
Certificate of Deposits 41,903.36 42.80Export Import Bank of India 4,604.29 4.70 P1+Federal Bank 1,701.02 1.74 P1+Hong Kong Bank 1,437.94 1.47 F1+ICICI Bank 1,876.99 1.92 A1+Jammu & Kashmir Bank 1,878.45 1.92 P1+NABARD 2,301.22 2.35 AAAOriental Bank of Commerce 1,378.90 1.41 P1+Punjab National Bank 4,600.41 4.70 F1+State Bank of Hyderabad 2,337.42 2.39 A1+State Bank of Hyderabad 2,385.03 2.43 A1+State Bank of Hyderabad 2,348.04 2.40 A1+State Bank of Mysore 4,735.03 4.83 A1+State Bank of Saurashtra 2,376.49 2.43 A1+State Bank of India 4,550.86 4.65 P1+UCO Bank 197.64 0.20 P1+Union Bank of India 1,295.56 1.32 A1+Union Bank of India 1,898.07 1.94 A1+ continued on next page
Issuer Market Value % to Rating(Rs. In Lacs) NAV
Commercial Paper 15,606.00 15.93Britannia Ind. 2,298.72 2.35 P1+Financial Technologies 1,901.63 1.94 F1HDFC 1,433.30 1.46 P1+Pidilite Industries 3,761.49 3.84 P1+Rabo India Finance 2,341.14 2.39 P1+Rabo India Finance 1,940.00 1.98 P1+Rabo India Finance 1,929.72 1.97 P1+
Floating Rate Bonds 14,800.00 15.10Hero Cycles 1,000.00 1.02 P1+**Hindustan National Glass & Ind. 2,000.00 2.04 PR1+Stelite Optical Tech 3,000.00 3.06 P1Sterlite Optical 3,000.00 3.06 P1Sterlite Optical Tech. 800.00 0.82 P1Sterlite Optical Tech. 2,000.00 2.04 P1Whirlpool of India 3,000.00 3.06 P1+
Non Convertible Debenture 9,716.24 9.93Nabard 3,572.76 3.65 AAAState Bank of Indore 495.21 0.51 AAAState Bank of India 508.47 0.52 AAAD.S. Constructions 2,077.32 2.12 A1+(so)Export Import Bank of India 2,484.67 2.54 AAAPower Fin. Corporation 505.07 0.52 AAAReliance Industries 72.74 0.07 AAA
Floating Rate Bonds 640.00 0.65Dewan Housing Fin. Corp 430.00 0.44 AA+IDBI 210.00 0.21 AA+
Privately Placed Debenture 7,500.00 7.65Emaar MGF Land Pvt. 2,500.00 2.55 PR1+**L & T Finance 2,500.00 2.55 PR1+**Ranbaxy Holding Company 2,500.00 2.55 P1
Securitised 6,519.06 6.65Collateralised Debt Trust Sr. 12 - Class A1 2,277.29 2.32 P1+(so)Collateralised Debt Trust Sr. 12 - Class A2 189.49 0.19 P1+(so)Credit Asset Trust Series XVI - Class A2 2,528.35 2.58 F1+(ind)ULS Trust Series I - Series A1 20/06/08 1,523.93 1.56 F1+(ind)(so)
Treasury Bills 74.76 0.08182 Days T-Bill 19/10/07 74.76 0.08 SOV
Total Debt 96,759.42 98.79
CBLO & Others* 1204.40 1.21
Total Assets 97,963.82 100.00
(*includes net receivables / payables, if any)(**shadow rating)
Total Corpus as on September 28, 2007 - Rs. 1,000.90 Crores

Performance (%) as on September 28, 2007 :Plan 1 Mth 3 Mths 6 Mths 1 Year Incep.*Regular Plan - Growth option 0.54 1.40 3.20 7.01 7.01Super Plan - Growth option 0.59 1.36 3.08 6.95 6.96Super Plus Plan - Growth option 0.66 1.95 4.19 8.46 8.45CLFI ** 0.66 1.46 4.00 7.35 7.34
* Inception date = Allotment date i.e. 27.09.2006** Benchmark Index: CRISIL LIQUID FUND INDEXNote: Simple Annualised returns for period less than 1 year, CAGR forperiod 1 year or more, with reinvestment of dividends (if any). Pastperformance may or may not be sustained in future.
Dividend History :FY 2007-08$
Regular Plan - Daily Dividend option : 3.0891%Regular Plan - Weekly Dividend option : 0.8800%Super Plan - Daily Dividend option : 2.9444%Super Plan - Weekly Dividend option : 0.1680%Super Plus Plan - Daily Dividend option : 4.0157%Super Plus Plan - Weekly Dividend option : 1.2590%Super Plus Plan - Fortnightly Dividend option : 1.2840%
FY 2006-07$
Regular Plan - Dividend option : 3.713%Super Plan - Dividend option : 3.765%Super Plus Plan - Dividend option : 4.058%
After payment of dividend, the NAV will fall to the extent of payoutand distribution taxes wherever applicable. Past performance may ormay not be sustained in future. The face value per unit is Rs.10/-.$ Includes Dividend Distribution Tax.
JM Money Manager Fund (An open-ended income scheme)contd....
Portfolio Statistics as on September 30, 2007 :Regular Plan
Current Yield : 8.33 %Duration : 0.4302 yearsAvg Maturity : 0.4928 years
Super PlanCurrent Yield : 8.56 %Duration : 0.2830 yearsAvg Maturity : 0.2961 years
Super Plus PlanCurrent Yield : 9.45 %Duration : 0.5683 yearsAvg Maturity : 0.7339 years
Giving our family of investors many reasons to celebrate
23
JM MONEY MANAGER FUND - SUPER PLANRATING PROFILE (%)
(*includes net receivables / payables, if any)
JM MONEY MANAGER FUND - REGULAR PLANRATING PROFILE (%)
(*includes net receivables / payables, if any)
JM MONEY MANAGER FUND - SUPER PLUS PLANASSET CLASSIFICATION (%)
(*includes net receivables / payables, if any)

Giving our family of investors many reasons to celebrate
JM G-Sec Fund (An open-ended dedicated gilts scheme)
PORTFOLIO as on September 28, 2007Issuer Market Value % to Rating
(Rs. In Lacs) NAVPortfolio of REGULAR PLAN
Treasury Bills 224.27 67.45182 Days T-Bill 19/10/07 224.27 67.45 SOVTotal Debt 224.27 67.45CBLO & Others* 108.20 32.55
Total Assets 332.47 100.00
Portfolio of PF PLAN
Treasury Bills 149.51 65.96182 Days T-Bill 19/10/07 149.51 65.96 SOVTotal Debt 149.51 65.96CBLO & Others* 77.16 34.04
Total Assets 226.67 100.00
Portfolio of PF PLUS PLAN
Treasury Bills 548.22 70.40182 Days T-Bill 19/10/07 548.22 70.40 SOVTotal Debt 548.22 70.40CBLO & Others* 230.50 29.60
Total Assets 778.72 100.00
(*includes net receivables / payables, if any)
Total Corpus as on September 28, 2007 - Rs. 13.38 Crores
NAV as on September 28, 2007 :
Regular Plan - Growth option (Rs.) : 21.5258Regular Plan - Dividend option (Rs.) : 10.2912Regular Plan - Bonus option (Rs.) : 10.4723PF Plan - Growth option (Rs.) : 22.3302PF Plan - Dividend option (Rs.) : 20.4612PF Plus Plan - Growth option (Rs.) : 11.0593PF Plus Plan - Dividend option (Rs.) : 11.0619
Inception :Regular & PF Plan : 29th September, 1999PF Plus Plan : 15th January, 2004
Fund Manager : Mohit Verma
Investment Objective :To provide ultimate level of safety to its unitholders throughinvestments in sovereign securities issued by the Centraland State Government.
Performance (%) as on September 28, 2007 :Plan 1 Yr 3 Yrs 5 Yrs Incep.*Regular Plan 3.59 4.17 5.77 10.05PF Plan 3.31 3.98 5.90 10.56I-SEC ** 7.09 5.69 6.68 NA
Plan 1 Mth 3 Mths 6 Mths 1 Yr 3 Yrs Incep.*PF Plus Plan 0.14 0.31 0.55 0.89 3.55 2.76I-SEC ** 0.63 2.77 4.57 7.09 5.69 4.21
* Inception date = Allotment date i.e.:Regular & PF Plan : 29.09.1999PF Plus Plan : 15.01.2004
** Benchmark Index: I-SEC COMPOSITE INDEXNote: Absolute Returns for period less than 1 year. CAGR forperiod 1 year or more, with reinvestment of dividends (if any).Past performance may or may not be sustained in future.
Dividend / Bonus History :Regular Plan - PF Plan -
Dividend option Dividend optionFY 2007-08$ - -FY 2006-07$ 2.8 % -FY 2005-06$ 3.8500 % -FY 2004-05$ 1.7040 % -FY 2003-04 10.75 % -FY 2002-03 10.00 % 15.00 %FY 2001-02 23.00 % -FY 2000-01 12.00 % -FY 1999-00 6.50 % -
Regular Plan - Bonus Option :15 : 1000 on 14/06/06 5 : 1000 on 14/06/0420 : 1000 on 14/03/06 12.5 : 1000 on 14/03/04
7.5 : 1000 on 15/12/05 25 : 1000 on 14/12/036.5 : 1000 on 15/09/05 30 : 1000 on 14/09/0310 : 1000 on 14/06/05 25 : 1000 on 14/06/0310 : 1000 on 14/03/05 20 : 1000 on 14/04/03
5 : 1000 on 14/12/04 7 : 1000 on 19/12/02After payment of dividend, the NAV will fall to the extent ofpayout and distribution taxes wherever applicable. Pastperformance may or may not be sustained in future. The facevalue per unit is Rs.10/-.$ Includes Dividend Distribution Tax.
Portfolio Statistics as on September 30, 2007 :Regular Plan Current Yield : 5.93 %
Duration : 0.0342 yearsAvg Maturity : 0.0342 years
PF Plan Current Yield : 5.93 %Duration : 0.0335 yearsAvg Maturity : 0.0335 years
PF Plus Plan Current Yield : 5.93 %Duration : 0.0355 yearsAvg Maturity : 0.0355 years
MATURITIES
Average Portfolio Maturity (in years)
24

Giving our family of investors many reasons to celebrate
NAV as on September 28, 2007 :
Growth Plan (Rs.) : 13.9727Dividend Plan (Rs.) : 11.4563Inst. Plan - Growth option (Rs.) : 10.0000Inst. Plan - Dividend option (Rs.) : 10.3813
Inception : 24th June, 2002
Fund Manager : Mohit Verma
Investment Objective :
To generate regular returns and high level of liquidity withlow risk strategy and capital appreciation / accretionthrough investment in debt instruments and relatedsecurities besides preservation of capital.
Dividend History :
FY 2007-08$
Dividend Plan : 1.4510%Inst. Plan - Dividend option : 4.2470%
FY 2006-07$
Dividend Plan : 2.885%Inst. Plan - Dividend option : 6.403%
FY 2005-06$
Dividend Plan : 3.2600%Inst. Plan - Dividend option : 4.8030%
FY 2004-05$
Dividend Plan : 4.0360%Inst. Plan - Dividend option : 4.1240%
FY 2003-04Dividend Plan : 4.762%Inst. Plan - Dividend option : 4.710%
FY 2002-03Dividend Plan : 3.60%
After payment of dividend, the NAV will fall to the extent ofpayout and distribution taxes wherever applicable. Pastperformance may or may not be sustained in future. Theface value per unit is Rs.10/-.$ Includes Dividend Distribution Tax.
Performance (%) as on September 28, 2007 :Plan 1 3 6 1 3 5 Incep.*
Mth Mths Mths Yr Yrs Yrs
Growth Plan 0.87 2.26 4.54 8.12 6.42 6.38 6.56CLFI ** 0.66 1.46 4.00 7.35 5.84 5.28 5.34
* Inception date = Allotment date i.e. 24.06.2002** Benchmark Index: CRISIL LIQUID FUND INDEX
Note: Absolute Returns for period less than 1 year. CAGRfor period 1 year or more, with reinvestment of dividends(if any). Past performance may or may not be sustainedin future.
Portfolio Statistics as on September 30, 2007 :
Current Yield : 8.18 %Duration : 1.3724 yearsAvg Maturity : 2.2280 years
JM Short Term Fund (An open-ended income scheme)
PORTFOLIO as on September 28, 2007Issuer Market Value % to Rating
(Rs. In Lacs) NAV
Certificate of Deposits 1,139.51 25.57Hong Kong Bank 480.47 10.78 F1+
Jammu & Kashmir Bank 469.61 10.54 P1+
State Bank of India 189.43 4.25 P1+
Non Convertible Debenture 1,952.68 43.82Nabard 452.89 10.16 AAA
State Bank of India 508.47 11.41 AAA
IDBI 486.25 10.91 AA+
Power Fin. Corporation 505.07 11.34 AAA
Floating Rate Bonds 600.09 13.47Union Bank of India 350.00 7.86 AA+
UTI Bank 250.09 5.61 LAA+
Privately Placed Debenture 161.19 3.62Citicorp Maruti Finance 161.19 3.62 AAA
Securitised 23.35 0.52BHPC Auto Sec Trust May 2005 Series A1 23.35 0.52 LAAA(so)
Total Debt 3,876.82 87.00
CBLO & Others* 578.58 13.00
Total Assets 4,455.40 100.00
(*includes net receivables / payables, if any)
Total Corpus as on September 28, 2007 - Rs. 44.55 Crores
JM SHORT TERM FUNDIN DEBT - SHORT TERM CATEGORY
(21 Schemes) for 18 month periodending September 2007.
Value Research Rating###
RATING PROFILE (%)
(*includes net receivables / payables, if any)
25

JM FLOATER FUND - Short Term PlanIN DEBT - FLOATING RATE SHORT TERM CATEGORY
(22 Schemes) for 18 month period ending September 2007.
Value Research Rating###
JM Floater Fund (An open-ended income scheme)
NAV as on September 30, 2007 :Short Term Plan - Growth option (Rs.) : 12.7779Short Term Plan - Dividend option (Rs.) : 10.0883
Inception : 25th June, 2003
Fund Manager : Shalini Tibrewala
Investment Objective :To provide regular income and capital appreciation throughinvestment in floating rate debt instruments, fixed rate debtinstruments swapped for floating rate returns and also fixed rateinstruments and money market instruments.
PORTFOLIO as on September 30, 2007Issuer Market Value % to Rating
(Rs. In Lacs) NAV
Portfolio of SHORT TERM PLAN
Certificate of Deposits 41.97 0.88
Hong Kong Bank 41.97 0.88 F1+
Floating Rate Bonds 2,590.32 54.55
IDBI 1,000.00 21.06 AA+
Union Bank of India 700.00 14.74 AA+
UTI Bank 890.32 18.75 LAA+
Total Debt 2,632.29 55.43
CBLO & Others* 2,116.33 44.57
Total Assets 4,748.62 100.00
(*includes net receivables / payables, if any)
Total Corpus as on September 30, 2007 - Rs. 47.49 Crores
Dividend History :FY 2007-08$ Short Term Plan - Dividend option : 3.4780%FY 2006-07$ Short Term Plan - Dividend option : 6.742%FY 2005-06$ Short Term Plan - Dividend option : 5.3910%FY 2004-05$ Short Term Plan - Dividend option : 4.7500%FY 2003-04 Short Term Plan - Dividend option : 0.6040%
After payment of dividend, the NAV will fall to the extent ofpayout and distribution taxes wherever applicable. Pastperformance may or may not be sustained in future. The facevalue per unit is Rs.10/-.$ Includes Dividend Distribution Tax.
Performance (%) as on September 30, 2007 :
Plan 1 3 6 1 3 Incep.*Mth Mths Mths Yr Yrs
Short Term Plan 6.80 6.71 7.02 7.27 6.33 5.91
CLFI ** 7.73 5.78 7.93 7.35 5.84 5.29
* Inception date = Allotment date i.e. 25.06.2003
** Benchmark Index: CRISIL LIQUID FUND INDEX
Note: Simple Annualised returns for period less than 1 year for JM Floater Fund -
Short Term Plan. CAGR for period 1 year or more, with reinvestment of dividends
(if any). Past performance may or may not be sustained in future.
Portfolio Statistics as on September 30, 2007 :Short Term Plan
Current Yield : 7.12 %Duration : 0.0747 yearsAvg Maturity : 0.1386 years
Giving our family of investors many reasons to celebrate
JM FLOATER FUND - SHORT TERM PLANRATING PROFILE (%)
(*includes net receivables / payables, if any)
26
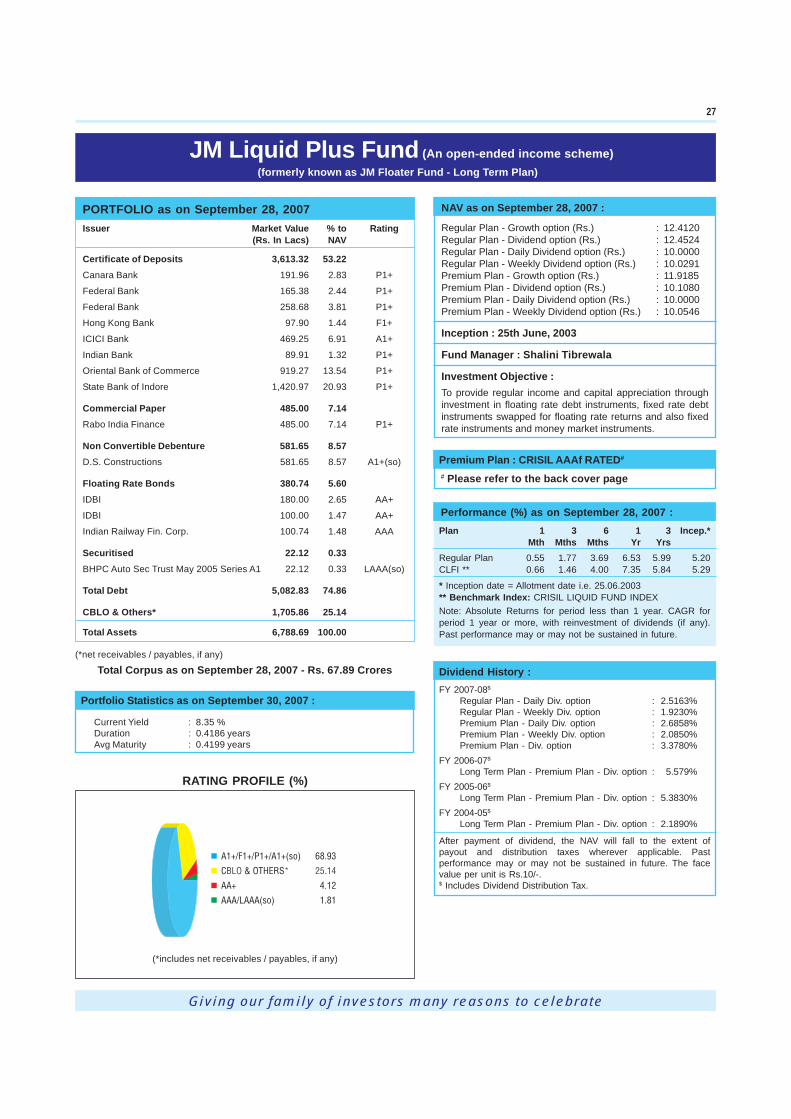
Giving our family of investors many reasons to celebrate
JM Liquid Plus Fund (An open-ended income scheme)(formerly known as JM Floater Fund - Long Term Plan)
Dividend History :FY 2007-08$
Regular Plan - Daily Div. option : 2.5163%Regular Plan - Weekly Div. option : 1.9230%Premium Plan - Daily Div. option : 2.6858%Premium Plan - Weekly Div. option : 2.0850%Premium Plan - Div. option : 3.3780%
FY 2006-07$
Long Term Plan - Premium Plan - Div. option : 5.579%FY 2005-06$
Long Term Plan - Premium Plan - Div. option : 5.3830%FY 2004-05$
Long Term Plan - Premium Plan - Div. option : 2.1890%
After payment of dividend, the NAV will fall to the extent ofpayout and distribution taxes wherever applicable. Pastperformance may or may not be sustained in future. The facevalue per unit is Rs.10/-.$ Includes Dividend Distribution Tax.
Performance (%) as on September 28, 2007 :Plan 1 3 6 1 3 Incep.*
Mth Mths Mths Yr YrsRegular Plan 0.55 1.77 3.69 6.53 5.99 5.20CLFI ** 0.66 1.46 4.00 7.35 5.84 5.29
* Inception date = Allotment date i.e. 25.06.2003** Benchmark Index: CRISIL LIQUID FUND INDEXNote: Absolute Returns for period less than 1 year. CAGR forperiod 1 year or more, with reinvestment of dividends (if any).Past performance may or may not be sustained in future.
Premium Plan : CRISIL AAAf RATED#
# Please refer to the back cover page
Portfolio Statistics as on September 30, 2007 :
Current Yield : 8.35 %Duration : 0.4186 yearsAvg Maturity : 0.4199 years
PORTFOLIO as on September 28, 2007Issuer Market Value % to Rating
(Rs. In Lacs) NAV
Certificate of Deposits 3,613.32 53.22Canara Bank 191.96 2.83 P1+
Federal Bank 165.38 2.44 P1+
Federal Bank 258.68 3.81 P1+
Hong Kong Bank 97.90 1.44 F1+
ICICI Bank 469.25 6.91 A1+
Indian Bank 89.91 1.32 P1+
Oriental Bank of Commerce 919.27 13.54 P1+
State Bank of Indore 1,420.97 20.93 P1+
Commercial Paper 485.00 7.14Rabo India Finance 485.00 7.14 P1+
Non Convertible Debenture 581.65 8.57D.S. Constructions 581.65 8.57 A1+(so)
Floating Rate Bonds 380.74 5.60IDBI 180.00 2.65 AA+
IDBI 100.00 1.47 AA+
Indian Railway Fin. Corp. 100.74 1.48 AAA
Securitised 22.12 0.33BHPC Auto Sec Trust May 2005 Series A1 22.12 0.33 LAAA(so)
Total Debt 5,082.83 74.86
CBLO & Others* 1,705.86 25.14
Total Assets 6,788.69 100.00
(*net receivables / payables, if any)
Total Corpus as on September 28, 2007 - Rs. 67.89 Crores
NAV as on September 28, 2007 :
Regular Plan - Growth option (Rs.) : 12.4120Regular Plan - Dividend option (Rs.) : 12.4524Regular Plan - Daily Dividend option (Rs.) : 10.0000Regular Plan - Weekly Dividend option (Rs.) : 10.0291Premium Plan - Growth option (Rs.) : 11.9185Premium Plan - Dividend option (Rs.) : 10.1080Premium Plan - Daily Dividend option (Rs.) : 10.0000Premium Plan - Weekly Dividend option (Rs.) : 10.0546
Inception : 25th June, 2003
Fund Manager : Shalini Tibrewala
Investment Objective :To provide regular income and capital appreciation throughinvestment in floating rate debt instruments, fixed rate debtinstruments swapped for floating rate returns and also fixedrate instruments and money market instruments.
RATING PROFILE (%)
(*includes net receivables / payables, if any)
27

Giving our family of investors many reasons to celebrateGiving our family of investors many reasons to celebrate
NAV as on September 28, 2007 :
Growth Option (Rs.) : 11.9485Dividend Option (Rs.) : 10.2194Bonus Option (Rs.) : 11.0639
Inception : 4th March, 2005
Fund Manager : Biren Mehta
Investment Objective :The primary investment objective of the scheme is togenerate income through arbitrage opportunities emergingout of mis-pricing between the cash market and thederivatives market and through deployment of surplus cashin fixed income instruments.However, there can be no assurance that the investmentobjective of the scheme will be realized. The scheme doesnot guarantee/indicate any returns.
PORTFOLIO as on September 28, 2007Issuer Mkt. Value % to Mkt. Value Rating
(Rs. In Lacs) NAV (Rs. In Lacs)Futures
Banks 666.95 10.75
Andhra Bank 38.60 0.62
Andhra Bank - Futures (39.23)
State Bank of India 583.76 9.41
State Bank of India - Futures (591.65)
Union Bank 44.59 0.72
Union Bank - Futures (45.18)
Finance 491.66 7.92
IFCI 491.66 7.92
IFCI - Futures (498.36)
Media & Entertainment 333.12 5.37
New Delhi Television 333.12 5.37
New Delhi Television - Futures (337.39)
Petroleum Products 260.45 4.20
Essar Oil 260.45 4.20
Essar Oil - Futures (264.46)
Pharmaceuticals 182.30 2.94
Cipla 182.30 2.94
Cipla - Futures (182.90)
Retail 540.00 8.70
Pantaloon Retail (India) 540.00 8.70
Pantaloon Retail (India) - Futures (547.20)
Textile Products 96.30 1.55
Bombay Rayon Fashions 96.30 1.55
Bombay Rayon Fashions - Futures (97.26)
Textiles - Synthetic 180.84 2.91
SRF 180.84 2.91
SRF - Futures (182.83)
Total Equity 2,751.62 44.34
Fixed Deposit Scheme 1,000.00 16.11
HDFC Bank 200.00 3.22
Jammu & Kashmir Bank 800.00 12.89
Floating Rate Bonds 650.02 10.48
Union Bank of India 600.00 9.67 AA+
UTI Bank 50.02 0.81 LAA+
Total Debt 1,650.02 26.59
CBLO & Others* 1,802.37 29.07
Total Assets 6,204.01 100.00
(*includes net receivables / payables, if any)
Total Corpus as on September 28, 2007 - Rs. 62.04 Crores
JM Equity & Derivative Fund (An income scheme - interval fund)
Performance (%) as on September 28, 2007 :Plan 1 3 6 1 Incep.*
Mth Mths Mths YearGrowth Plan 0.61 2.17 3.70 7.46 7.17CLFI ** 0.66 1.46 4.00 7.35 6.07
* Inception date = Allotment date i.e. 04.03.2005** Benchmark Index: CRISIL LIQUID FUND INDEXNote: Absolute Returns for period less than 1 year. CAGR forperiod 1 year or more, with reinvestment of dividends (if any).Past performance may or may not be sustained in future.
Dividend / Bonus History :Dividend Option :
FY 2007-08$ : 4.3000%FY 2006-07$ : 8.3910%FY 2005-06$ : 3.4400%
Bonus Option :80 : 1000 on 28/08/2006
After payment of dividend, the NAV will fall to the extent ofpayout and distribution taxes wherever applicable. Pastperformance may or may not be sustained in future. The facevalue per unit is Rs.10/-.$ Includes Dividend Distribution Tax.
Portfolio Statistics as on September 30, 2007 :Current Yield : 8.32 %Duration : 2.007 yearsAvg Maturity : 2.0800 %
ASSET CLASSIFICATION (%)
(*includes net receivables / payables)
28

Giving our family of investors many reasons to celebrate
ADDENDA
29
I. THIS ADDENDUM DATED SEPTEMBER 21, 2007 SETS OUT THE CHANGES TO BE MADE IN THE OFFER DOCUMENTS AND KEY INFORMATIONMEMORANDUM OF OF JM EQUITY FUND, JM BALANCED FUND, JM AUTO SECTOR FUND, JM HEALTHCARE SECTOR FUND, JM BASIC FUND,JM EMERGING LEADERS FUND, JM HI FI FUND, JM FINANCIAL SERVICES SECTOR FUND, JM TELECOM SECTOR FUND, JM EQUITY TAXSAVER FUND – SERIES I, JM SMALL & MID-CAP FUND AND JM CONTRA FUND FOR CHANGE IN THE LOAD STRUCTURE
Change in load structure of the equity oriented schemes of JM Financial Mutual FundIn order to bring about uniformity in the load structures in the equity oriented Schemes of the Fund, it has been decided to change the existing loadstructures of the equity oriented Schemes.
Accordingly, with effect from 24th September, 2007, the load structures of JM Equity Fund, JM Balanced Fund, JM Auto Sector Fund, JM Healthcare SectorFund, JM Basic Fund, JM Emerging Leaders Fund, JM HI FI Fund, JM Financial Services Sector Fund, JM Telecom Sector Fund, JM Equity Tax SaverFund – Series I, JM Small & Mid-Cap Fund and JM Contra Fund will be modified as under :
EXISTING LOAD STRUCTURE REVISED LOAD STRUCTURE
Scheme Particulars Entry Load Exit Load Particulars Entry Load Exit Load
l JM Equity Fund On all investments of On all investments ofl JM Emerging Leaders Fund less than Rs. 3 crores. 2.25% 0.50%* less than Rs. 3 crores. 2.25% 0.50%***l JM Balanced Fundl JM Auto Sector Fund On all investments of On all investments ofl JM Healthcare Sector Fund Rs. 3 crores and above. NIL NIL Rs. 3 crores and above. NIL 0.50%*l JM Basic Fundl JM HI FI Fund Investments under SIF Investments under SIFl JM Equity Tax Saver Fund - and STF. NIL 2.25%** and STF. NIL 2.25%**
Series I (After the conversionof close ended into an openended scheme)
l JM Financial ServicesSector Fund
l JM Telecom Sector Fundl JM Small & Mid-Cap Fund
l JM Contra Fund In case of investments 1% if On all investments of 2.25% 0.50%***< Rs. 5 crores 2.25% redeemed less than Rs. 3 crores.
within6 monthsfrom the date ofallotment /transfer
In case of investments Nil 0.5% if On all investments of NIL 0.50%*>= Rs. 5 crores redeemed Rs. 3 crores and above.
within6 monthsfrom the date ofallotment /transfer
Investments made Nil 2.25% ** Investments under SIF NIL 2.25%**through Systematic and STF.Investment Facility(SIF) / SystematicTransfer Facility (STF)
* In case the investments are redeemed within 91 days of transfer/ allotment of units** In case the investments are redeemed within 1 year of transfer / allotment of respective instalment.*** In case the investments are redeemed within 182 days of transfer/ allotment of units
Investors are requested to note that the changes in load structure shall be applicable for all prospective investments in all the equity oriented schemes witheffect from 24th September, 2007 i.e. investments made on or after 24th September, 2007. Investments made prior to the above changes would continueto attract the load structure as would have been applicable at the time of their respective investments.
All other terms and conditions mentioned in the Offer Documents / Key Information Memoranda of the Schemes remain unchanged.
INVESTORS DESIROUS OF INVESTING IN JM EQUITY FUND, JM BALANCED FUND, JM AUTO SECTOR FUND, JM HEALTHCARE SECTORFUND, JM BASIC FUND, JM EMERGING LEADERS FUND, JM HI FI FUND, JM FINANCIAL SERVICES SECTOR FUND, JM TELECOMSECTOR FUND, JM EQUITY TAX SAVER FUND – SERIES I , JM SMALL & MID-CAP FUND AND JM CONTRA FUND SHOULD READ ANDUNDERSTAND THE ABOVE SCHEME SPECIFIC DISCLOSURE IN CONJUNCTION WITH THE DISCLOSURES MADE IN THE RESPECTIVEORIGINAL OFFER DOCUMENTS. INVESTORS MAY ASCERTAIN FURTHER CHANGES IN THE OFFER DOCUMENTS FROM THE MUTUALFUND (AMC) / INVESTOR SERVICE CENTRES / DISTRIBUTORS

30
ADDENDAcontd....
Giving our family of investors many reasons to celebrate
II. THIS ADDENDUM DATED SEPTEMBER 26, 2007 SETS OUT THE CHANGES TO BE MADE IN THE OFFER DOCUMENTS AND KEY INFORMATIONMEMORANDA OF THE FOLLOWING SCHEMES OF JM FINANCIAL MUTUAL FUNDJM EQUITY FUND, JM AUTO SECTOR FUND, JM HEALTHCARE SECTOR FUND, JM BALANCED FUND, JM BASIC FUND, JM EMERGING LEADERSFUND, JM HI FI FUND, JM FINANCIAL SERVICES SECTOR FUND, JM TELECOM SECTOR FUND, JM CONTRA FUND, JM SMALL & MID-CAP FUND,JM EQUITY TAX SAVER FUND - SERIES I, JM EQUITY & DERIVATIVE FUND, JM INCOME FUND, JM HIGH LIQUIDITY FUND, JM G-SEC FUND, JMFIXED MATURITY FUND, JM SHORT TERM FUND, JM FLOATER FUND, JM LIQUID PLUS FUND (FORMERLY KNOWN AS JM FLOATER FUND -LONG TERM PLAN), JM MIP FUND, JM MONEY MANAGER FUND AND JM ARBITRAGE ADVANTAGE FUND
1) Official Points of AcceptanceThe following clause is incorporated in all the Schemes of JM Financial Mutual FundInvestor Service Center(s) of JM Financial Mutual Fund/registrar & transfer agent and authorized web portal approved by JM Financial Mutual Fundfrom time to time/AMC’s own site are authorized to receive all types of transactions during NFO & Post NFO period as mentioned in the offer document.Selected branches of Banks are also authorized to act as a collecting banker during the period of New Fund Offer of any new scheme as mentionedin KIM of the scheme concerned.The above mentioned collection center will be treated as official points of acceptance for all financial transactions like subscription/redemption/switchand the cut-off timing for various transactions shall be reckoned at these Official Points. However Investor Service Centers located at corporate officeof the AMC situated at Bandra Kurla Complex (BKC) will act as the official point of acceptance for all financial transactions under all schemes exceptfor purchase/additional purchase transactions under liquid schemes where payment instrument is physically attached.
2) Default OptionsIn case the investor fails to specify their preference of investment plan/option, the following would apply:
Lack of information Default Plan / OptionChoice of Plan GrowthChoice of Option/ facility Dividend Reinvestment
3) Consequent to the decision of the AMC to calculate and declare the NAV of all schemes up to four decimal places, the example for sale/ purchase priceper unit and the redemption/ repurchase price per unit in the Offer Document will be amended as under:The sale / purchase price per Unit, i.e. the price at which an investor can buy units will be the NAV + Sales Load. For e.g. if the NAV of a unit is Rs.11.9585 and the entry load being charged is 2.25%, then the sale / purchase price will be Rs. 11.9585 plus 2.25% of Rs. 11.9585 i.e. Rs. 12.227566which will be rounded off to 12.2276.In case of redemption, the price will be NAV - Redemption Load. For e.g. if the NAV of a unit is Rs. 11.9585 and the exit / redemption load is beingcharged at 2.25%, then the redemption / repurchase price will be Rs. 11.9585 minus 2.25% of Rs. 11.9585 i.e. Rs. 11.689434 which will be rounded offto 11.6894For close-ended schemes proportionate unamortized expenses will be charged from the redemption/switch out proceeds over and above the stipulatedentry/exit load subject to the limit specified by SEBI.
4) The following clause is incorporated under clause (iv) Investment Plans of Section 10 Units on Offer in the Offer Documents / Key InformationMemoranda of all Schemes of the Mutual Fund : “The schemes will offer only Dividend Payout and Dividend Reinvestment under the Dividend Option.The facility of Dividend Transfer is hereby withdrawn for all the Schemes of the Fund.
5) Fund of Funds Scheme - LoadThe AMC will not charge any entry/exit load for a Fund of Funds Scheme investing in any Scheme of the Mutual Fund.
6) Certain clauses have been incorporated under Section 10 Units on Offer in the Offer Document to provide investor friendly facilities to the investors.Changes in the regulatory framework have also necessitated the inclusion of some of these clauses. These have been explained in detail below.The following paragraph appearing towards the end of the clause on Mode of Payment – Domestic Unitholders before the Note is hereby amended:Investors residing in centres, where the JM Financial Mutual Fund does not have any collection arrangement, are authorized to make payment by DDs/RTGS/NEFT/Transfer. In respect of individual investors, DD charges would be borne by the Fund / Asset Management Company (AMC) only where theAMC does not have a branch / ISC (Investor Service Center) or other collection facilities subject to DD is being payable and deposited at any of thecollection centers of JM Financial Mutual Fund.In respect of non-individual investors, DD charges on one application upto Rs. Ten Lacs, per investor, will be borne by the Fund / AMC, during the NFO.However in case of multiple applications submitted during any NFO the benefit of DD charges will be given if the total investment through multipleapplications does not exceeds Rs. Ten Lacs. Post NFO, for every application of upto Rs. Ten lacs received per day, per investor, the DD charges willbe borne by the Fund/AMC.SBI DD charges are treated as standard DD charges. However, if the AMC decides to maintain a table of standard DD charges, it may extend thebenefit of higher of the DD charges mentioned above, to the non-individual investor. The AMC in the normal course will not reimburse the DD charges.The AMC will process the application for eligible number of units after adding permissible DD charges, if applicable, and if claimed by investor in theapplication In the event that DD amount with permissible DD charges is not sufficient to allot minimum number of units, the AMC will refund the amountrepresented by the instrument deposited.
7) Redemption of unitsRedemption of units (except in SIP/STP/SWP cases) will be Rs. 500 or 50 units subject to applicable exit load. Any redemption in excess thereof maybe in multiples of Re.1/- subject to keeping minimum balance of 500 units or Rs. 5000/- whichever is less.In the event of remaining balance (for investment other than through SIP/STP/SWP falling below the minimum balance of 500 units or Rs.5000 (Whichever is less) while processing redemption/switch requests, the entire outstanding units redeemed.
8) Disclosure of Bank Mandate and PAN NumberAll cheques and bank drafts accompanying the application form should contain the application form number on its reverse. As per the directive issuedby SEBI vide their letter IIMARP/MF/CIR/07/826/98 dated April 15, 1998, and SEBI/IMD/CIR No. 6/4213/04 dated March 1, 2004 it is mandatory for

ADDENDAcontd....
Giving our family of investors many reasons to celebrate
applicants to mention their bank account numbers in their applications for purchase or redemption of units. This is to prevent fraudulent encashmentof dividend/redemption / refund cheques.In accordance with Circular dated April 27, 2007 issued by the Securities and Exchange Board of India (“SEBI”), Permanent Account Number (“PAN”)issued by the Income Tax authorities will be used as the sole identification number for all investors (existing and prospective) transacting in thesecurities market, including mutual funds, irrespective of the amount of transaction, with effect from July 02, 2007. SEBI vide its Circular dated June 25,2007 has further clarified that until December 31, 2007, the existing and potential investors not having PAN , should apply for PAN immediately andapplications for investment should be accompanied with the evidence of having applied for PAN. In view of the above, with effect from July 2, 2007, itis mandatory for all existing and prospective investors (including joint holders, guardians of minors, NRIs etc.) to enclose a certified copy of PAN cardor a copy of the evidence of having applied for PAN Card, along with the application for investing in the schemes of JM Financial Mutual Fund.Accordingly all new and existing investors shall furnish a certified copy of PAN card while investing in JM Financial Mutual Fund Schemes and thoseinvestors who do not have PAN Card may proceed as under :1. For investment amount less than Rs. 50,000 – A copy of the evidence of having applied for PAN (acknowledged copy of Form 49A) until the PAN
is received. Upon receipt of PAN, furnish certified copy of PAN, with respective folio numbers to Karvy Computershare, for updation in theirrecords.
2. If the investment is Rs 50,000 or more - A copy of the evidence of having applied for PAN (acknowledged copy of Form 49A) and Form 60 alongwith proof of address, until PAN is received.
The certification of the PAN verification from the original PAN card/ letter can be done by any one of the following with their signature, date, name andrubber stamp.1. The distributor/ broker through whom the transaction is done if PAN proof is self-attested by investor2. Bank Manager,3. Notary Public4. Officials of JM Financial Mutual/ Karvy Computershare Pvt. Ltd.Further, with effect from January 1, 2008, it will be mandatory for all investors to provide a certified copy of the PAN for all transactions in units ofschemes of the Fund.Investors transacting through approved Web Portals are also required to get their PAN validated by their Web Portals.In case, the investor does not conform to the above requirement of submission of verified copy of PAN or produces original PAN proof forverification or the PAN details as per furnished verified copy of PAN proof does not match with the Website of Income Tax Deptt asprescribed by SEBI, the AMC reserves the right to reject the application before allotment and refund the investment amount without anyinterest.In case of inadvertent allotment, the AMC reserves the right to refund the investment amount, without any interest.
9) Prevention of Money LaunderingIn terms of the Prevention of Money Laundering Act, 2002, the Rules issued there under and the guidelines / circulars issued by SEBI regarding the AntiMoney Laundering (“AML Laws”), all intermediaries, including Mutual Funds, have to formulate and implement a client identification programme, verifyand maintain the record of identity and address(es) of investors.In order to make the data capture and document submission easy and convenient for the investors, the Mutual Fund industry has collectively entrustedthis responsibility of collection of documents relating to identity and address and record keeping to an independent agency (presently CDSL VenturesLimited) that will act as central record keeping agency (“Central Agency”). As a token of having verified the identity and address and for efficientretrieval of records, the Central Agency will issue an Acknowledgment stating the investor is a KYC compliant investor (hereinafter called KYCACKNOWLEDGMENT or an acknowledgment by whatever name called), to each investor who submits his PAN Card and other necessary KYCdocuments to the Central Agency. Prior to March 1, 2007, the Central Agency had issued Mutual Fund Identification Number (“MIN”) to each investorwho had submitted the said application and the prescribed documents to the Central Agency.Investors who have obtained the MIN or the KYC acknowledgment can invest in the schemes of the Mutual Fund by stating the same, in lieu ofsubmitting information and documents required under AML Laws.Further, SEBI issued circular dated 20th March, 2002, advising all intermediaries to take necessary steps to ensure compliance with the requirementof Section 12 of the Act inter-alia maintenance and preservation of records and reporting of information relating to cash and suspicious transactions toFinancial Intelligence Unit-India (“FIU-IND”), New Delhi. The AMC may seek information or obtain and retain documentation used to establish identity.It may re-verify identity and obtain any missing or additional information for this purpose. The AMC, under powers delegated by the Trustee, shall haveabsolute discretion to seek information from investors, record investor’s telephonic calls, reject any application, prevent further transactions by a UnitHolder, report suspicious transactions to FIU-IND and / or to freeze the folios, if after due diligence, the investor / Unit Holder / a person making thepayment on behalf of the investor does not fulfill the requirements of the “Know Your Customer” or the AMC believes that the transaction is suspiciousin nature as regards money laundering. In this behalf the AMC reserves the right to reject any application and effect a mandatory redemption of unitsallotted within such time as may be reasonable or in compliance with any rules, regulations, guidelines, circular, etc. issued by any regulatory authorityin this regard from time to time. If the payment for purchase of units are made by a third party (e.g. a Power of Attorney Holder, a Financing Agency, arelative, etc.), the Unit Holder may be required to give such details of such transaction so as to satisfy the AMC of the source and / or considerationunderlying the transaction. The KYC documentation shall also be mandatorily complied with by the holders entering the Register of Members by virtueof operation of law e.g. transmission, etc.Applicants / Unit holders may contact our Investor Service Centers / their distributors, if any, for any additional information / clarifications.Also, please visit our website www.JMFinancialmf.com for any other related information.The Scheme will adhere to such guidelines / procedures as have been or may be issued by AMFI / SEBI / or any other regulatory authority in this regardfrom time to time.
10) The disclosure relating to Mr. Nimesh Kampani is being added against clause 5 (i.e. Any pending criminal cases against the Sponsor or any companyassociated with the Sponsor in any capacity including the AMC, Board of Trustee / Trustee Company or any of the directors or key personnel.) underthe Section on Penalties and Pending Litigation in the Offer Documents of all Schemes of the Mutual Fund as under :Mr. Nimesh Kampani, a director of JM Financial Trustee Company Private Ltd., was one of the non-executive directors of Nagarjuna Finance Limitedtill April 28, 1999. In the contempt case no. 915 of 2002, a single judge bench in the High Court of Judicature, Andhra Pradesh at Hyderabad, passedan order on August 3, 2007 punishing (simple imprisonment for six months and a fine of Rs. 2,000) Respondents no. 1 to 3 (Mr. K S Raju, Mr. N Selvaraj
31

32
ADDENDAcontd....
Giving our family of investors many reasons to celebrate
and Nagarjuna Finance Ltd. - NFL) for violating, disobeying the Order of the Company Law Board Southern Region Bench at Chennai in C.P. No. 35of 2000 dated 29-2-2000 and order in C.A. No.344/634-A/SRB/2001 dated August 21, 2001 and for breach of an affidavit filed in the Hon’ble Court inCompany Appeal No.7 of 2001. While passing the said order, the judge also included other directors of 3rd respondent, viz., NFL. Though Mr. Kampanihad resigned much before the order was passed by the Company law Board Southern Region Bench at Chennai in 2001, he had been made party inthe order of the Hon’ble High Court of Judicature, Andhra Pradesh. The implementation of the said order of the Hon’ble High Court of Judicature,Andhra Pradesh, Hyderabad has been suspended by a Division Bench of the High Court of Judicature, Andhra Pradesh, Hyderabad.
11) The names of some of the entities in the Offer Documents have undergone a change. Consequently references to the old names of the entities in theOffer Document, wherever they appear, will be replaced with the changed names.
Name of the entity in the Offer Document Changed NameJM Morgan Stanley Pvt. Ltd. JM Financial Consultants Pvt. Ltd.
JM Morgan Stanley Financial Services Pvt. Ltd. JM Financial Services Pvt. Ltd.
JM Morgan Stanley Fixed Income Securities Pvt. Ltd. JM Financial Securities Pvt. Ltd.
JM Morgan Stanley Securities Pvt. Ltd. Morgan Stanley India Company Pvt. Ltd.
12) In addition to the existing web portals, the following portals will also operate as Official Points of Acceptance. The services offered by these portalswould be governed by the terms and conditions of the agreement executed between these portals and JM Financial Asset Management PrivateLimited.
Name of the distributor Website for transactions in units of the Mutual FundReliance Securities Ltd. www.reliancemoney.com
Religare Securities Ltd. www.religare.in
Sharekhan Ltd. www.sharekhan.com
13) Amendments in the Offer Document of JM Equity Tax Saver Fund – Series Ia) JM Equity Tax Saver Fund – Series I to be a Close ended Equity Linked Saving Scheme.
JM Equity Tax Saver Fund – Series I was launched as a three year closed ended Equity Linked Savings Scheme which was to be converted intoan open ended plan at the close of three years, subject to the approvals from the AMC/Trustee and subject to SEBI Regulations. Moreover, theTrustees also reserved the right not to convert the Scheme into an open ended Scheme.Accordingly, at the meeting of the Board of Directors of the Trustee Company, the Trustees have decided not to convert JM Equity Tax Saver Fund– Series I into an open ended Scheme at the end of three years from the date of allotment. Consequently the Scheme will be a Close EndedScheme and all provisions set out in the Offer Document pertaining to the open ended nature of the Scheme after the three year period, will beinoperative and hence deleted.
b) Add the following for Declaration of NAV in JM Equity Tax Saver Fund – Series IThe AMC would declare the NAV of the Scheme on every Wednesday in compliance with SEBI Circular dated March 28, 2001.
All other features of the Schemes remain unchanged.
INVESTORS DESIROUS OF INVESTING IN JM EQUITY FUND, JM AUTO SECTOR FUND, JM HEALTHCARE SECTOR FUND, JM FINANCIALSERVICES SECTOR FUND, JM TELECOM SECTOR FUND, JM BALANCED FUND, JM BASIC FUND, JM EMERGING LEADERS FUND,JM HI FI FUND, JM SMALL & MID-CAP FUND, JM EQUITY TAX SAVER FUND – SERIES I, JM CONTRA FUND, JM EQUITY & DERIVATIVEFUND, JM INCOME FUND, JM HIGH LIQUIDITY FUND, JM G-SEC FUND, JM FIXED MATURITY FUND, JM MONEY MANAGER FUND,JM SHORT TERM FUND, JM FLOATER FUND, JM MIP FUND AND JM ARBITRAGE ADVANTAGE FUND SHOULD READ AND UNDERSTANDTHE ABOVE SCHEME SPECIFIC DISCLOSURES IN CONJUNCTION WITH THE DISCLOSURES MADE IN THE RESPECTIVE ORIGINALOFFER DOCUMENTS. INVESTORS MAY ASCERTAIN FURTHER CHANGES IN THE OFFER DOCUMENTS FROM THE MUTUAL FUND(AMC) / INVESTOR SERVICE CENTRES / DISTRIBUTORS.