Embed Size (px)
Citation preview
The mission of Wageningen University & Research is “To explore the potential of nature to improve the quality of life”. Under the banner Wageningen University & Research, Wageningen University and the specialised research institutes of the Wageningen Research Foundation have joined forces in contributing to finding solutions to important questions in the domain of healthy food and living environment. With its roughly 30 branches, 5,000 employees and 10,000 students, Wageningen University & Research is one of the leading organisations in its domain. The unique Wageningen approach lies in its integrated approach to issues and the collaboration between different disciplines.
Youri Dijkxhoorn, Michiel van Galen, Julian Barungi, John Okiira, Joyce Gema and Valerie Janssen
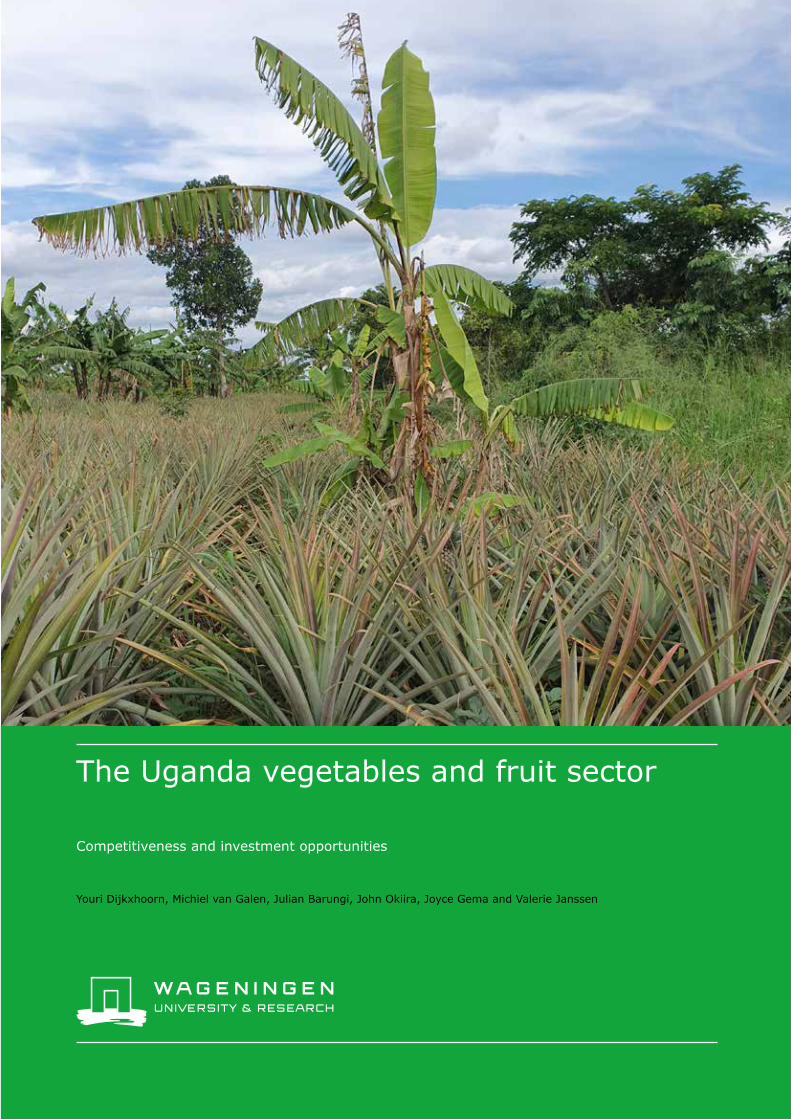
Competitiveness and investment opportunities
The Uganda vegetables and fruit sectorWageningen Economic ResearchP.O. Box 297032502 LS Den HaagThe NetherlandsE [email protected]/economic-research
Report 2019-117ISBN 978-94-6395-203-3

The vegetables and fruit sector in Uganda
Competitiveness, investment and trade options
Youri Dijkxhoorn, Michiel van Galen, Julian Barungi, John Okiira, Joyce Gema and Valerie Janssen
This study was carried out by Wageningen Economic Research and was commissioned by The Integrated Seed
Sector Development programme in Uganda (ISSD Uganda).
Wageningen Economic Research
Wageningen, November 2019
REPORT
2019-117
ISBN 978-94-6395-203-3

Youri Dijkxhoorn, Michiel van Galen, Julian Barungi, John Okiira, Joyce Gema and Valerie Janssen,
2019. The vegetables and fruit sector in Uganda: competitiveness, investment and trade options.
Wageningen, Wageningen Economic Research, Report 2019-117. 80 pp.; 35 fig.; 25 tab.; 24 ref.
The study assess the competitiveness of the fruit and vegetable sector and suggests specific
recommendations for further development. It also provides insights in market, trade and investment
opportunities. A focus is applied to a limited number of crop specific case studies. In Uganda the
production of fruit and vegetable is gaining importance. Despite agricultural practices being weak,
farmers in Uganda can make a reasonable profit margin from their farm plots. In addition, key
performances indicators of Uganda compared with Kenya show that most products for the domestic
and regional markets are very competitive in terms of quality, price and yield.
Key words: Vegetables, fruits, Uganda, competitiveness
This report can be downloaded for free at https://doi.org/10.18174/505785 or at
www.wur.eu/economic-research (under Wageningen Economic Research publications).
© 2019 Wageningen Economic Research
P.O. Box 29703, 2502 LS The Hague, The Netherlands, T +31 (0)70 335 83 30,
E [email protected], http://www.wur.eu/economic-research. Wageningen Economic
Research is part of Wageningen University & Research.
This work is licensed under a Creative Commons Attribution-Non Commercial 4.0 International
License.
© Wageningen Economic Research, part of Stichting Wageningen Research, 2019
The user may reproduce, distribute and share this work and make derivative works from it. Material
by third parties which is used in the work and which are subject to intellectual property rights may not
be used without prior permission from the relevant third party. The user must attribute the work by
stating the name indicated by the author or licensor but may not do this in such a way as to create the
impression that the author/licensor endorses the use of the work or the work of the user. The user
may not use the work for commercial purposes.
Wageningen Economic Research accepts no liability for any damage resulting from the use of the
results of this study or the application of the advice contained in it.
Wageningen Economic Research is ISO 9001:2015 certified.
Wageningen Economic Research Report 2019-117 | Project code 2282100331
Cover photo: Michiel van Galen/Wageningen University & Research

Contents
Summary 5
1 Introduction 7
1.1 Background 7 1.2 Objectives 7
2 Method 8
2.1 Introduction 8 2.2 Approach 9
2.2.1 Product selection 9 2.2.2 Desk study 9 2.2.3 In-depth interviews with key industry stakeholders 10 2.2.4 Primary data collection and analysis 10 2.2.5 Validation of findings 11
2.3 Limitations of the study 11
3 Ugandan fruit and vegetable sector 12
3.1 Introduction 12 3.2 Climate, water and infrastructure 12 3.3 Production of fruits and vegetables 14
3.3.1 Vegetable production 14 3.3.2 Fruit production 15
3.4 The value chain 17 3.4.1 Value chain map 17 3.4.2 Market structure and chain governance 21 3.4.3 The enabling and supporting environment 22
3.5 Market demand 26 3.5.1 National demand 26 3.5.2 Regional demand 27 3.5.3 International demand 29
4 Case studies 32
4.1 Introduction 32 4.2 Tomato 32
4.2.1 Main production areas 32 4.2.2 Value chain 32 4.2.3 Most suitable areas for tomato production 35 4.2.4 Challenges and opportunities 35
4.3 Onion 36 4.3.1 Main production areas 36 4.3.2 Value chain 36 4.3.3 Most suitable areas for onion production 38 4.3.4 Challenges and opportunities 38
4.4 Hot pepper 39 4.4.1 Main production areas 39 4.4.2 Value chain 39 4.4.3 Most suitable areas for hot pepper production 41 4.4.4 Challenges and opportunities 42

4.5 Pineapple 43 4.5.1 Main production areas 43 4.5.2 Value chain 43 4.5.3 Most suitable areas for pineapple production 46 4.5.4 Challenges and opportunities 46
4.6 Avocado 47 4.6.1 Main production areas 47 4.6.2 Value chain 47 4.6.3 Most suitable areas for avocado production 49 4.6.4 Challenges and opportunities 49
4.7 Kenya as the benchmark 50 4.7.1 Tomato 50 4.7.2 Onion 50 4.7.3 Hot pepper 51 4.7.4 Pineapple 51 4.7.5 Avocado 51
5 Conclusions 53
5.1 Conclusions 53 5.2 Competitiveness, investment and trade opportunities 53 5.3 Recommendations 55
5.3.1 Farm level 55 5.3.2 Value chain level 56 5.3.3 Enabling environment 56
References and websites 58
Stakeholders interviewed 59
Export value of fruits and vegetables from Uganda 61
List of stakeholders participating in validation workshops 63
Cost benefit data for studied crops per year Uganda 64
Food intake 65
Results of the 2013-2014 LSMS Survey for Uganda 66
Cost benefit data for studied vegetable crops Kenya 76
Cost benefit data for studied fruit crops Kenya 77
List of Districts in Uganda 78

Wageningen Economic Research Report 2019-117 | 5
Summary
Uganda is located at the equator with a favourable climate for producing all kind of fruits and
vegetables. Uganda is the second largest producer of fresh fruits and vegetables in sub-Saharan
Africa, after Nigeria, producing about 5.3 million tonnes per year according to recent FAO statistics.
However, production detailed data on Uganda’s fruits and vegetables is very limited. Vegetables and
fruits are a major crop produced in all the districts of Uganda. Fruits and vegetables are produced by
smallholders, scattered all over the country. The agricultural and fisheries sector as a whole
represents 24.2% of Uganda’s GDP (World Bank, 2019) and 70.7% of its employment in 2018
(ILOSTAT, 2019).
Competitiveness
Vegetable and fruit farmers in Uganda can make a reasonable profit from their crops, if the harvest is
not affected by pests, diseases or bad weather. Studied vegetable farmers obtain an average
calculated profit margin between 50 and 80%. Fruit farmers have higher profit margins due to lower
input needed.
Trade and investment
Based on our study the current investment and trade opportunities for the Dutch private sector are
limited:
• Many Dutch horticulture suppliers are already active in the market through local and regional agents
and distributors.
• Sourcing opportunities of fruits and vegetables from Uganda to Europe by Dutch importers are also
limited. Almost all Ugandan exporters supply the ethnic market, focusing on specific fruits and
vegetables for the Asian and African Diaspora. These fruits and vegetable are not in high demand by
the Dutch importers supplying conventional retailers. In addition, the current non-legal requirements
regarding certification and traceability for the conventional retail (and organic) EU market do not
align with the current practices among the Ugandan exporters.
Opportunities for improvement for the domestic market
The local market demand for fruit and vegetables is likely to increase and will provide serious
opportunities. The transition to being a middle-income country will impact the agricultural sector and
its output will need to be improved to feed the increasing urban population.
The current competition levels can be raised by increasing yields so as to increase the margin per kg
produced. Yields can be improved by supporting farmers with good agricultural practices trough
extensions or training. Issues like seeds, planting, weeding, application of fertilisers and pest control,
herbicides and fungicides should all be addressed. Food safety risks are high in the market due to
overuse of chemicals and poor post-harvest practices. Sustainable pest control at farm level and more
awareness among traders at markets to reduce the risks of contamination of fresh produce are
needed. In addition, the horticulture education system is weak with limited exposure and needs to be
supported.
The more serious farmers should be linked up with advanced value chains present in the domestic
market, like supermarkets. Current supermarkets in Uganda present a big opportunity for the more
serious farmers to provide a constant volume of high-quality products at a premium price.
Opportunities for the export market and investments
The current export inspections and procedures are not in line with international standards. Market
development points that should receive attention include the production of the right varieties at the
right moment, the use of the right packaging material, and the developing and sharing of market
information.
6 | Wageningen Economic Research Report 2019-117
Approach
The Ugandan fruit and vegetable value chain is the focus of this study. The study started with an
inception phase. A limited number of relevant products were selected for further analysis and primary
data collection, in-depth key informant interviews with key industry stakeholders were conducted in
May 2019. A survey among 33 farmers in Uganda was conducted to collect primary data on costs and
revenues for key production areas. We have estimated production costs, revenues and farmer income
using a “typical farm approach” by working with local experts, industry experts, input suppliers and
farmers. In addition, we analysed The Living Standards Measurement Study (LSMS), a dataset
providing a sample of household level data on consumption, crop and livestock production output and
costs, and the use of extension services. The preliminary results were validated in two separate
workshops in Kampala with crop experts and high-level stakeholders.

Wageningen Economic Research Report 2019-117 | 7
1 Introduction
1.1 Background
The production of horticultural products is gaining importance. The horticulture sector has
been supported by the Integrated Seed Sector Development (ISSD Plus Project) (2017-2020). The
ISSD and the ISSD Plus Project have been coordinated by the Wageningen Centre for Development
Innovation (WCDI) and funded by the Embassy of the Kingdom of the Netherlands (EKN) in Kampala,
Uganda.
ISSD Plus Project strengthens the development of the seed sector development in Uganda.
ISSD Plus Project promotes the use of quality seed and the cultivation of improved vegetables
varieties. The use of better seeds and improved varieties is likely to contribute to increased earnings
and improved competitiveness of the sector, which would subsequently contribute to improved
national food and nutrition security. However, quality seeds and advanced varieties alone are not
enough to increase competitiveness; there is a need for more in-depth information on the entire value
chain.
1.2 Objectives
The seed sector cannot reach its potential without the development of the entire horticultural value
chain. The purpose of the study was “to support the development of a vibrant, pluralistic and market-
oriented fruit and vegetable sector in Uganda”.
The study had two objectives (as described in the Terms of Reference):
1. To assess the competitiveness of Ugandan producers of vegetables and fruits and to recommend
specific intervention strategies for Uganda.
2. To provide insights in trade and investment opportunities and challenges for Dutch agribusiness
companies in the Ugandan vegetables and fruits sector (including export opportunities).
The Ugandan fruit and vegetable value chain was the focus of the study. In addition, we
compared some key developments and performances with other East African countries, most notably
Kenya.

8 | Wageningen Economic Research Report 2019-117
2 Method
2.1 Introduction
To assess the competitiveness of the fruit and vegetable sector it is necessary to further define the
concept of competitiveness. In the literature, there are various definitions, a commonly applied one
being “the ability to deliver goods and services at the time, place and form sought by overseas buyers
at prices as good as or better than those of other potential suppliers whilst earning at least
opportunity cost returns on resources employed” (Freebairn, 1987; cited in Sharples and Milham,
1990). Although not fully addressed in the article by Sharples and Milham, the original article by
Freebairn states several important issues related to the definition of international competitiveness at
the firm or industry level (i.e. one supplier versus the other, or the performance of an aggregated
sector versus another country or region):
• First, although not made explicit in the definition, Freebairn states that competitiveness is a dynamic
concept, and the preferences of buyers may change from one location to the other and over time.
What is good for one consumer may not be acceptable for another consumer. Segmentation of
products and buyer markets is therefore a crucial part of the exercise.
• Second, one must look at all the costs involved in bringing a product to market; not only the costs
of farm production.
• Third, competitiveness is about competing with alternative sources of supply. Alternative suppliers
may learn, improve, and change their production methods, and other products may go on the
market that compete with the firm’s products (i.e. related to Porter forces of new entrants and
substitutes).
• Fourth, it emphasises that suppliers are competing with other producers for the scarce resources like
labour, land, water and other inputs. This latter point is important because it means that no nation
will be competitive in the production of all products. Prices of labour and other resources will
increase if a country becomes more competitive in one industry, at the expense of competitiveness
in other industries.
• Finally, agricultural producers are seen as price takers in all markets, i.e. they cannot influence the
prices of inputs and outputs. This and similar definitions have been used in many studies.
However, competition is a dynamic concept, and different customers require different products. Also,
although Freebairn, and Sharples and Milham are studying the (long-term) competitiveness of the
Australian agricultural sector as a whole, the definition is essentially a limited definition of
competitiveness at firm level. Just because farmers are often seen as price takers, the definition
equally applies to the whole industry, as farmers will only compete on price with other farmers. In
reality however, firms do compete on price as well as quality. Finally, it does not explicitly give
attention to sustainability of production and the well-being of the population and the nation as a
whole. Following the definition of Freebairn, a company or industry is fully competitive if it produces at
low costs by exploiting its labourers, or by receiving large subsidies from the government.
Most definitions of competitiveness (at firm level, industry level, or nation level) imply that staying
competitive entails either producing at lower costs than other suppliers, or increasing the volume of
production. Recently the volume aspect of productivity has been emphasized more than the cost
aspect. If no improvement is achieved, competitiveness is almost inevitably reduced, as competing
suppliers and competing products are invariably improving.
Based on the above and to address some the shortcomings identified, we have defined
competitiveness as: “the medium- to long-run ability of a firm or significant part of the firms in an
industry to increase productivity and/or lower costs in a sustainable way, and deliver goods and
services at the time, place, form, and quality sought by the targeted customer segment(s) at prices as
good as or lower than those of other potential suppliers, whilst earning a reasonable profit and paying
at least opportunity cost of resources employed”.

Wageningen Economic Research Report 2019-117 | 9
2.2 Approach
The report is based on a desk study and primary data was collected among a limited number of
farmers in various districts of Uganda. We did an additional number of interviews in Uganda, the
Netherlands and Kenya. See Appendix 1 for an overview of the interviewed stakeholders.
2.2.1 Product selection
We have limited the study to a few relevant products. This guarantees that data collection
(interviews, focus groups, desk study) is feasible and focused. The final selection of a maximum of five
products was done in agreement with ISSD and EKN. We included the following products for further
analysis during this study:
Table 2.1 Product selection
Product 1 Product 2 Product 3 Product 4 Product 5
Product name Tomato Hot Pepper Onion Avocado Pineapple
Type Vegetable Vegetable Vegetable Fruit Fruit
Dominant
suppliers
Smallholders Smallholders Smallholders Smallholders Smallholders
Export Increasing regional
export e.g. Kenya
Successful export to
EU market
Regional export EU and Middle East Regional export
Study area Central Uganda Central Uganda Western &
Eastern Uganda
Central Uganda Eastern & Central
Uganda
Selected crops:
• Tomato is a major crop in Uganda. It is widely consumed in the domestic market. Tomato
demand is expected to increase with the rise in population and urbanization. In addition, the country
supplies countries like Southern Sudan, DRC and Rwanda.
• Hot pepper is a crop mainly produced for the distant export market. It is one of the few
crops that is currently being exported to the EU. It is mostly bought by traders who sell the produce
on the export market that caters to the EU ethnic market.
• Onion is a major vegetable widely consumed in Uganda. It is consumed by almost all
households on a daily basis and Uganda also supplies countries like South Sudan with onions. The
crop has the potential to increase household incomes and provide work for women and youth.
• Avocado is a priority fruit for development as a non-traditional export crop. Local demand is
high and there is potential for increased production since there are many opportunities for
commercialisation for the export markets.
• Uganda has favourable climatic conditions for the successful production of pineapples.
Uganda pineapples are considered sweeter and less acidic than those produced in other countries in
the region. Uganda also produces dried pineapple for export.
2.2.2 Desk study
The initial overview of the sector is based on a combination of desk research and stakeholder
interviews. The report is based on a desk study, with several additional interviews with Uganda and
Dutch industry stakeholders (see Appendix 1 for an overview of the interviewed stakeholders).
The Living Standards Measurement Study (LSMS) provides a unique sample of household
level data that is valuable to our study and has been used in addition to the information
that we collected through the fieldwork. Data collection for the LSMS study was funded by the
Government of Uganda, World Bank, and the Government of the Netherlands. To assess the input
market, Wageningen Economic Research has access to the National Panel Survey 2013-2014 for
Uganda that contains very detailed data at farm level about the types of inputs they use. The data is
collected among more than 50,000 households. A separate study was done for agriculture with over
2,300 respondents in all districts in Uganda. The agricultural survey contains information on land,

10 | Wageningen Economic Research Report 2019-117
crops, livestock, inputs, labour, production, and agricultural tools and machinery. In Appendix 6 we
provide a separate analysis of the LSMS data on agriculture for tomatoes, onion, pineapple and
avocado. However, the number of observations for vegetables and fruit (except for bananas) is limited
and believed to be only partly representative for the production per region. Most notably, the average
household crop production in the LSMS survey is found to take place at a lower scale and with less
input than the more serious producers that are the main suppliers of the market crops in Uganda.
Therefore, e.g. own consumption of the harvested crops are higher, and production per acre generally
lower. Also, the data of the LSMS includes crop failures and poor agricultural practices – as it should to
represent actual production – but in our fieldwork we have looked as much as possible for data on
production taking place under normal circumstances without crop failures.
The Global Detector was used to analyse the climatic conditions and to identify suitable areas
for the studied crops. The Global detector is a knowledge-based Geographic Information System that
is used to detect the worldwide potential for production, demand and market strategies. The Global
Detector can show data from a large number of indicators, such as climate, infrastructure, land
characteristics, on a disaggregated spatial grid level for almost any place in the world (Hennen et al.,
2016). A large set of indicators is readily available for use without any GIS-processing. For Uganda we
identified on a very detailed level the rainfall and the temperature for each district in the country. In
addition, we used this data to identify all possible areas were the selected crops can grow best. We used
the commonly known crop parameters based on the current known production locations that allow these
crops (climate, soil, altitude, water availability). By doing this we have identified the most promising
areas for each crop. We excluded deserts, lakes, dense forests, dense urban centres, natural parks and
steep hills in this analysis since they are not suitable for the production of fruit and vegetable crops.
2.2.3 In-depth interviews with key industry stakeholders
In-depth interviews with key industry stakeholders were conducted in May 2019. Various
type of stakeholders were interviewed, including government representatives, sector organisations,
NGOs, input suppliers, farmers, traders, exporters, processors, freight forwarders and supermarkets.
Additional interviews in Kenya and Netherlands about the position of Uganda in the
(regional/international) market were done.
2.2.4 Primary data collection and analysis
A survey among 33 farmers in Uganda was conducted to collect primary data on costs and
revenues for key production areas. The survey did not take into account the costs for own labour,
but only the costs for hired labour. Crop failure was not considered in our analysis, but if it occurred,
the data was imputed by using estimates based on industry experts.
For each crop some of the key cultivation areas were visited by local enumerators. The selection of the
farmers was done based on snowball sampling in the study areas. It provided information on costs of
production, production techniques, challenges and farmers’ needs. The results were compared to
Kenya to compare the countries on different production parameters. For this, an expert on the Kenyan
and Ugandan horticulture sector reviewed the studied parameters like costs for inputs, yields and
seasonality. The focus was on one season only.
Table 2.2 Farmers interviewed
Crop District Type of farmer
Hot pepper Mityana, Wakiso & Butambala Export orientated (large and small)
Avocado Butambala Domestic and export market
Tomato Mpigi, Kasanda, Nakaseke, Mityana & Gomba Domestic market with good quality
Open Pollinated Varieties (OPV), hybrid seed
and irrigation
Pineapple Luweero & Serere Export and domestic market
Onion Bulambuli, Bunyangabu & Kabarole Domestic market with improved varieties
(OPV) and hybrid seed
Wageningen Economic Research Report 2019-117 | 11
2.2.5 Validation of findings
We have estimated production costs and benefits using a “typical farm approach” by
working with local experts, industry experts, input suppliers and farmers. The data represent
all the costs and benefits under perfect conditions with Good Agricultural Practices and solid market
prices. The collected data has been triangulated with the LSMS survey and our own primary data
collected in different districts in Uganda. In July 2019, 2 Focus Group Discussions (FGDs) were
organized to validate the preliminary findings with stakeholders in the fruit and vegetable sector. See
Appendix 3 for the participants’ active in the FGD in Kampala. The cost benefit data has been
validated in the FGDs, which also has been used to identify any strengths, weaknesses, opportunities
and threats.
2.3 Limitations of the study
The LSMS data set is a rich source of information. However, the LSMS data and other statistical
data is outdated. The latest available LSMS dataset on agriculture refers to 2013/2014. Furthermore,
the number of observations of households that produce the specific crops that are the focus of this
study is limited. Nevertheless, the data provides some insights into the yields and production costs.
A focus on specific crops was applied in the case studies. To ensure some level of
representativeness of the type of products, limited availability of data and limited time and budget
meant that we had to focus on a limited number of case studies or take a broad view without going
into much detail. Therefore in the case studies we focus on a maximum of 5 products which are
important fruits and vegetables for Uganda. In that sense we will be representative of these important
products, but not for smaller products. The same applies to the type of producers: we focus on both
smallholders and larger producers, but the availability of data might imply that we are not fully
representative for each group at all times.
Limitations of the study relate to representativeness of the primary data. The
representativeness of the data is a potential risk. Uganda is a diverse country in terms of climate and
different agro-ecological zones. Therefore, the collected data will not represent all regions of the
country. However, we collected data in different regions to cover as much as possible different zones.

12 | Wageningen Economic Research Report 2019-117
3 Ugandan fruit and vegetable sector
3.1 Introduction
The agricultural and fisheries sector represented 24.2% of Uganda’s GDP (WB, 2019) and
70.7% of its employment in 2018 (ILOSTAT, 2019). According to the Uganda Bureau of Statistics
(UBOS), about 40% of the population is working in subsistence farming. Women work in subsistence
farming more than men (47% and 31% respectively). Major crops in terms of area include maize,
banana, cassava, sweet potatoes, beans and pulses, and sugar cane. Coffee, tea, cotton and tobacco
are traditional cash crops. Uganda is divided into 134 districts (as of 2019/2020) and the capital city
of Kampala, all of which are grouped into four administrative regions: Eastern Region (green),
Western Region (blue), Northern Region (yellow) and the Central Region (red), see figure 3.1 below. A
list of the districts on the map is provided in Appendix 9. Each district is further divided into counties
and sub-counties.
Figure 3.1 Districts of Uganda
Source: Wikipedia.
3.2 Climate, water and infrastructure
Uganda is located at the equator with a very favourable climate for producing all kinds of
fruits and vegetables. The climatic and geographic conditions in Uganda were mapped with the
Global-Detector tool. With this tool we can combine a large amount of data at grid-level (10x10km) to
estimate the suitability of regions to produce specific crops. Data at grid-level in Uganda is used to
produce maps that show the different values for the climate of Uganda for temperature and
precipitation. In addition, we have produced several graphs that show the climatic variations
throughout the year of different places in Uganda.

Wageningen Economic Research Report 2019-117 | 13
Figure 3.2 shows that Uganda receives relatively large amounts of precipitation throughout the year.
Especially the western, central and eastern parts of the countries. There is a short rainy season
(October, November, December) and long rainy season (March, April, May).
Figure 3.2 Monthly and yearly precipitation in Uganda, in mm
Source: Global Detector.
Figure 3.3 shows the Uganda temperature throughout the year. Uganda has a tropical climate, with
temperatures ranging from 25 to 29°C in most parts of the country, apart from in the mountainous
areas, which are much cooler (East and South-West). The hottest months are January and February.
Figure 3.3 Monthly and yearly temperature, in degrees Celsius
Source: Global Detector.

14 | Wageningen Economic Research Report 2019-117
The outcomes of a recent study show serious effects of climate change all over Uganda
(Duku et al., 2019). Despite the study being mainly focussed on sesame, the general climate change
also affects fruit and vegetable production. The main outcomes are:
• The temperature is expected to rise by about 3.2°C over southwestern and western Uganda especially
during the long rainy season. This rise in temperature during the long rainy season is also anticipated
in the rest of the country where temperature will rise by about 2.8°C over central, northern and
eastern parts of Uganda. During the short rainy period, the temperature is expected to rise by about
2.8°C over the southwestern part of Uganda, and by more than 2°C over the rest of the country.
• The seasonal average rainfall in the short rainy season is projected to increase in the dry areas of
the northeastern and northern part of Uganda by 40-50% for mid-century. In the northeastern and
northern part of the country, the increase in the seasonal average rainfall in the short rainy period
accompanied by an increase in the number of consecutive wet days by about 2-3 days could lead to
an enhancement of rainfall in the region. However, the length of the longest wet spell in the
southern half of the country during both rainy seasons is expected to decline by about 2-4 days.
• The projection of the longest period of consecutive dry days for the short rainy season show that dry
spells are expected to decrease by about 3-5 days over most parts of the country except the
southern tip. The decline in the dry spells coupled with the increase in the wet spells and seasonal
rainfall in the northeastern part of Uganda can reinforce the likelihood of floods in the region. On the
other hand, during the long rainy season, the consecutive dry days are expected to slightly increase
(~1day) over southern parts of the country. This coupled with the decrease in seasonal average
rainfall in the long rainy season (up to 5-10%) could lead to water scarcity in the region.
3.3 Production of fruits and vegetables
Uganda is currently the second largest producer of fresh fruits and vegetables in sub-
Saharan Africa after Nigeria, producing about 5.3 million tonnes per year according to
recent statistics (see figure below right). For fruits there was 900,000ha and for vegetables
250,000ha in 2017 (see figure left).
Production data on Uganda’s fruits and vegetables is very limited. This was confirmed by all
stakeholders in the sector. Most data (e.g. FAOSTAT / MAAIF) cannot be relied upon as they are rather
estimations or calculated data instead of field-collected data.
Figure 3.4 Area horticulture crops Uganda
2008-2017 (ha)
Figure 3.5 Production horticulture crops Uganda
2008-2017 (tonnes)
Source: FAOSTAT.
3.3.1 Vegetable production
Vegetables are a major crop produced in all districts of Uganda. Unfortunately, many
vegetables are not specified in detail in the official national data.
0
200,000
400,000
600,000
800,000
1,000,000
1,200,000
2008 2009 2010 2011 2012 2013 2014 2015 2016 2017
Fruit Primary Vegetables Primary
0
1,000,000
2,000,000
3,000,000
4,000,000
5,000,000
6,000,000
2008 2009 2010 2011 2012 2013 2014 2015 2016 2017
Fruit Primary Vegetables Primary
Wageningen Economic Research Report 2019-117 | 15
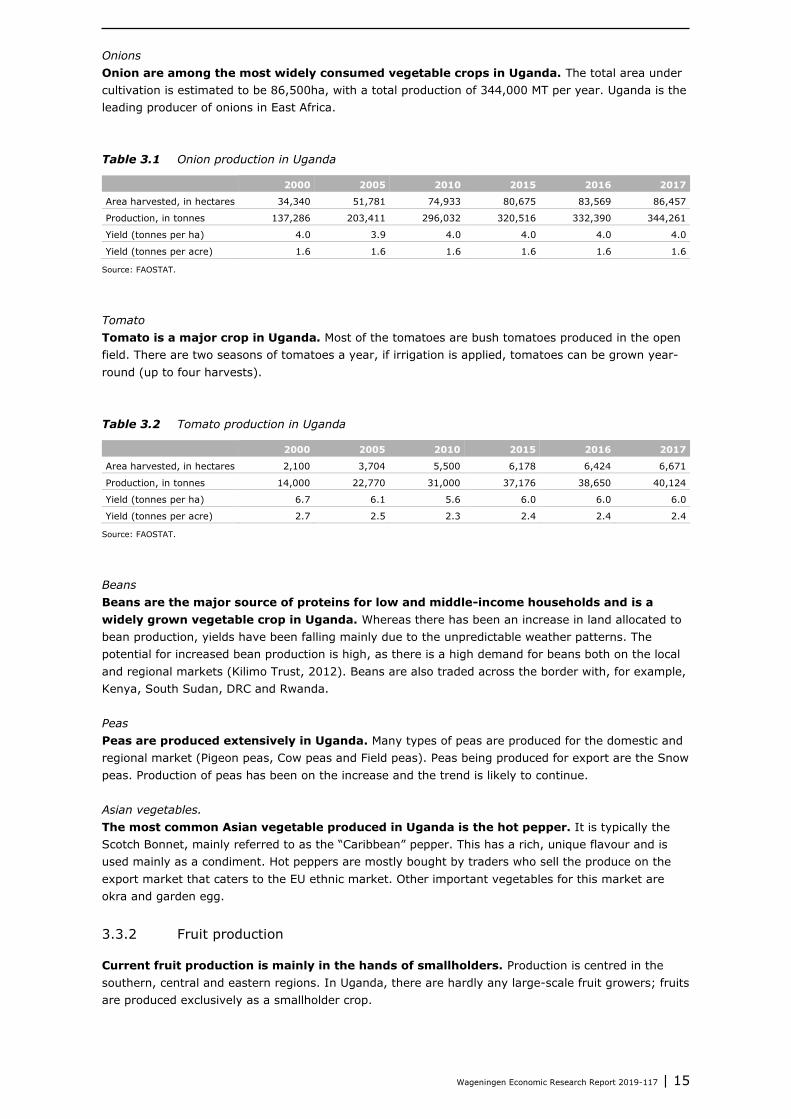
Onions
Onion are among the most widely consumed vegetable crops in Uganda. The total area under
cultivation is estimated to be 86,500ha, with a total production of 344,000 MT per year. Uganda is the
leading producer of onions in East Africa.
Table 3.1 Onion production in Uganda
2000 2005 2010 2015 2016 2017
Area harvested, in hectares 34,340 51,781 74,933 80,675 83,569 86,457
Production, in tonnes 137,286 203,411 296,032 320,516 332,390 344,261
Yield (tonnes per ha) 4.0 3.9 4.0 4.0 4.0 4.0
Yield (tonnes per acre) 1.6 1.6 1.6 1.6 1.6 1.6
Source: FAOSTAT.
Tomato
Tomato is a major crop in Uganda. Most of the tomatoes are bush tomatoes produced in the open
field. There are two seasons of tomatoes a year, if irrigation is applied, tomatoes can be grown year-
round (up to four harvests).
Table 3.2 Tomato production in Uganda
2000 2005 2010 2015 2016 2017
Area harvested, in hectares 2,100 3,704 5,500 6,178 6,424 6,671
Production, in tonnes 14,000 22,770 31,000 37,176 38,650 40,124
Yield (tonnes per ha) 6.7 6.1 5.6 6.0 6.0 6.0
Yield (tonnes per acre) 2.7 2.5 2.3 2.4 2.4 2.4
Source: FAOSTAT.
Beans
Beans are the major source of proteins for low and middle-income households and is a
widely grown vegetable crop in Uganda. Whereas there has been an increase in land allocated to
bean production, yields have been falling mainly due to the unpredictable weather patterns. The
potential for increased bean production is high, as there is a high demand for beans both on the local
and regional markets (Kilimo Trust, 2012). Beans are also traded across the border with, for example,
Kenya, South Sudan, DRC and Rwanda.
Peas
Peas are produced extensively in Uganda. Many types of peas are produced for the domestic and
regional market (Pigeon peas, Cow peas and Field peas). Peas being produced for export are the Snow
peas. Production of peas has been on the increase and the trend is likely to continue.
Asian vegetables.
The most common Asian vegetable produced in Uganda is the hot pepper. It is typically the
Scotch Bonnet, mainly referred to as the “Caribbean” pepper. This has a rich, unique flavour and is
used mainly as a condiment. Hot peppers are mostly bought by traders who sell the produce on the
export market that caters to the EU ethnic market. Other important vegetables for this market are
okra and garden egg.
3.3.2 Fruit production
Current fruit production is mainly in the hands of smallholders. Production is centred in the
southern, central and eastern regions. In Uganda, there are hardly any large-scale fruit growers; fruits
are produced exclusively as a smallholder crop.

16 | Wageningen Economic Research Report 2019-117
The majority of the fruits produced are pineapples and bananas. Other fruits of significant
importance include mango, passion fruit, apple, small sweet banana (Ndiizi), Cavendish banana
(Bogoya), avocado, citrus, papaya and jackfruit. A variety of tropical fruits are produced in various
districts of Uganda.
Bananas
There is significant production of bananas in Uganda. The area of banana production is
139,000ha. This area has been stable in recent years. However, before 2000 the banana sector faced
a serious drop in area and production due to serious issues with pests and diseases (Kagezi, G.H.
et al., 2006). Most of the bananas produced are the cooking bananas, which are a staple food crop.
There is limited export of these bananas to Europe, mainly to serve ethnic tastes of the migrant
African and Indian population.
There is also production of dessert bananas: apple bananas (Ndiizi) and Gros Michel bananas
(Bogoya), but exact details or the area of production are not available:
• Apple bananas can be grown in most districts of the country and there is potential for increased
production through the establishment of specialised farmers to produce the crop. Apple bananas
have a high local demand and command a good price in the European market, but must be air
freighted.
• The Gros Michel banana is a popular crop with a distinct flavour. Production of Gros Michel bananas
has been growing and they have a high potential for export, particularly in the regional markets but
also in the Arab countries and even Europe.
Table 3.3 Banana production in Uganda
2000 2005 2010 2015 2016 2017
Area harvested, in hectares 135,000 137,837 143,000 138,274 138,716 139,162
Production, in tonnes 610,000 609,856 600,000 584,304 583,761 583,217
Yield (tonnes per ha) 4.5 4.4 4.2 4.2 4.2 4.2
Yield (tonnes per acre) 1.8 1.8 1.8 1.8 1.8 1.8
Source: FAOSTAT.
Pineapples
Uganda has a large area dedicated to pineapple production. Due to the climatic conditions being
conducive to the successful cultivation of pineapples, Uganda is a leading pineapple producer in East
Africa, with the largest crop area of 240,197ha (FRR, 2017). It appears that FAOSTAT significantly
understates Uganda’s actual pineapple production (see table below). Pineapples are produced
exclusively as a small-holder crop, either as sole crop or inter-cropped with others such as bananas in
a given Ugandan farming system. Uganda pineapples are considered sweeter than those produced in
other countries in the region.
Table 3.4 Pineapple production in Uganda
2000 2005 2010 2015 2016 2017
Area, in hectares 194 203 350 404 418 433
Production, in tonnes 1,650 1,700 2,800 3,398 3,520 3,642
Yield (tonnes per ha) 8.5 8.4 8.0 8.4 8.4 8.4
Yield (tonnes per acre) 3.4 3.4 3.2 3.4 3.4 3.4
Source: FAOSTAT.
Passion, papaya and citrus fruit
Production of passion fruits has been growing over the years thanks to increased demand
for local consumption. The commercial passion fruit varieties grown in Uganda include the purple
granadilla variety locally known as Kasese, Masaka, and the highly disease and pest resistant
Kawanda. Kawanda Hybrid is the most preferred because of its big size and a lot of juice per fruit. The

Wageningen Economic Research Report 2019-117 | 17
Kawanda hybrid are produced in the Southern belt of Uganda at 1,000-1,200 m.a.s. (Sonko et al.,
2005).
Many varieties of papayas are grown widely in all districts of Uganda. There are limited specialised
farmers producing the fruit.
Citrus fruits produced in Uganda include several varieties of oranges, lemons and tangerines. The
demand for citrus fruits on the local market is high, as indicated by the volume of imports of oranges
from South Africa. There is a high potential for increased production mainly by getting more farmers
to engage in the commercial production of citrus fruits.
Mangoes
Mangoes are commonly grown in Uganda. Mangoes grow in the wild and have been adapted to all
ecological zones of Uganda: dry or humid lowland, mountain and Lake Shoreline. Production is argued
to be on the rise over the years with increasing demand on the local and export markets. However,
production statistics to support this claim are lacking.
Different varieties of mangoes are grown in almost all the districts of Uganda. Some of the varieties
are suitable for the fresh fruit market and others for processing into juice and other products.
Avocado
A few varieties are grown in most districts of Uganda, some large and others small. Local demand is
high and there is potential for increased production. Opportunities exist in commercial production of
the fruit for the export markets.
3.4 The value chain
3.4.1 Value chain map
Most of the fruits and vegetables produced in Uganda are consumed locally and are
produced by smallholder farmers. After harvest, they are transported to rural market centres for
local consumers or are bought at the farm by neighbours. Other fruits and vegetables are transported
to bigger market centres where many producers use the informal open-air markets that are organised
once or twice a week. Post-harvest technologies are absent for locally consumed fruits and vegetables.
However, fruits like pineapples and avocados exported to Europe and other destinations are graded
and packaged according to export standards. The figure below presents the most relevant actors in
the fruits and vegetables value chain.

18 | Wageningen Economic Research Report 2019-117
Figure 3.6 Fruit and vegetables supply chain diagram
Source: RS 2017.
3.4.1.1 Farmers
Good agricultural practices are not widely adopted by farmers. Only a small share of the
farmers use hybrid seeds (estimated at 15% by interviewed experts). The rest of the farmers use OPV
and farmer-saved seed. Overall there is a low germination rate due to poor nursery practices, high
disease incidence (already at seedling level), decreased crop stand after transplanting and high plant
population.
Poor fertility status of the soil due to limited use of fertilisers is low. The pest and disease pressure is
high and farmers have limited knowledge of pest and disease control and often overuse crop
protection agents. Overuse can lead to serious food safety issues further down the value chain.
Furthermore, irrigation is not common and water is not harvested.
3.4.1.2 Wholesalers and brokers
Wholesale traders have a dominant position in linking rural producers to urban consumers.
Only a minority of the farmers take their own produce to the market. Therefore, traders provide an
important intermediary service for both farmers and consumers, since the main vegetable production
fields are in rural areas of Uganda. Exploitative behaviour and high levels of informality are key
challenges reported by different stakeholders. Stakeholders during the validation workshops also
mentioned that farmers do not know their actual costs of production and sometimes sell their produce
below their production cost. Also, the presence of cartels at urban markets by traders is often
mentioned by interviewed farmers as a barrier for doing business. The main wholesale and retail
markets in Uganda can be found in Kampala city. They are St. Balikuddembe market (Owino market),
Kalerwe market and Nakasero market. Produce handling at the markets is not optimal and can cause
food safety issues for consumers.

Wageningen Economic Research Report 2019-117 | 19
3.4.1.3 Retail
There are several types of markets in Kampala including open air retail markets, groceries and
roadside kiosk, various institutions and supermarkets.
Supermarkets are a well-established segment in the food retail market in urban areas
where incomes are higher. The scale of procurement is typically much larger and requires both
volume and coordination among suppliers and between suppliers and retailers and their
intermediaries. In Kampala there are various large multinational supermarkets, several locally owned
small to medium-sized supermarkets spread out in all the suburbs, as well as different petrol stations
that have small supermarkets.
Small groceries are numerous in Kampala and in urban centres, including fresh-produce kiosks
and roadside vendors specialising in fruits and vegetables in strategic locations. At the lower-class
market, roadside stalls and kiosks offer an opportunity. Many of these kiosks operate informally
without license (Nyapendi et al., 2010).
3.4.1.4 International exporters
Professional exporters supplying the international markets are few. We estimate that there
are about 7-10 serious exporters supplying the international market, supplemented with many
opportunistic so-called ‘brief case’ exporters. The more serious exporters often have their own
production fields, have additional out-growers, supply out-growers with technical support and
assistance, and have their own packing facilities. The ‘brief case’ exporters often buy the produce on
the open market or make informal agreements with farmers without providing any support. Both types
of exporters lack GlobalG.A.P. certification and mainly focus on supplying the EU ethnic market or
some markets in the Middle East. The capacity of the pack houses is not sufficient, according to
stakeholders interviewed. Many pack houses are in residential houses that were turned into pack
houses. Cold chain facilities during transportation from the farmer fields to the pack houses and from
the pack houses to the airport were also reported to be lacking.
Current export of hot peppers is facing serious problems, with numerous interceptions in
the EU market. This is related to organisms demanding quarantine (False Coddling Moth; FCM) and
cases of exceeding the EU market’s Maximal Residue Limit (MRL) for chemicals. As a result, the EU
Commission has warned MAAIF several times to act.
3.4.1.5 Seed supply
According to the Access to Seed Index (2019), there are 21 seed companies in Uganda, see
the table below. Only nine companies provide extension services in Uganda, and these are mainly
regional companies. Bejo and East-West Seed are the only globally active companies to do so.
However, during recent interviews in Uganda with the distributor of Rijk Zwaan we learned that they
are also providing extension support to farmers. Local seed companies have basic and certified seed
production activities on-farm or with dedicated seed growers. Major seed-selling outlets are facilitated
by the government, agro input dealer distribution networks and non-governmental organizations
operating in the region. Three companies have breeding locations, and five have processing locations
in the country. Seed production, breeding and processing are carried out by the companies
headquartered in the region. No globally active companies carry out these activities in the country,
according to the Access to Seed Index (2019).
20 | Wageningen Economic Research Report 2019-117
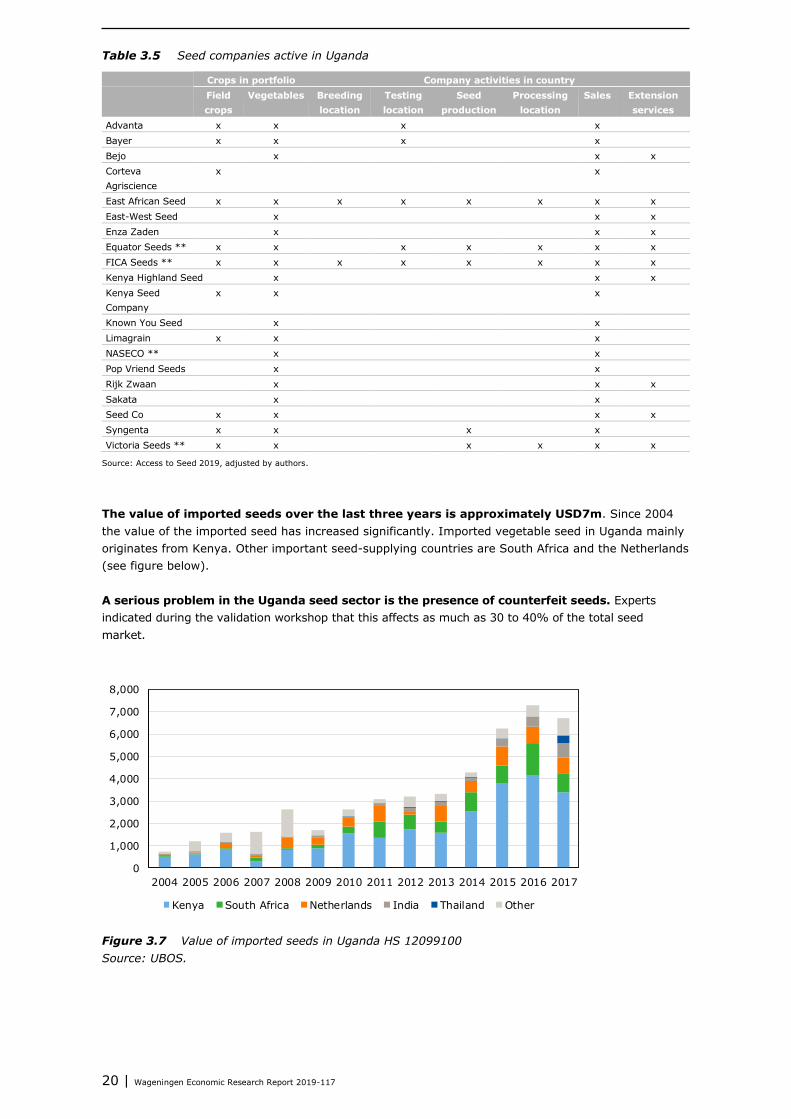
Table 3.5 Seed companies active in Uganda
Crops in portfolio Company activities in country
Field
crops
Vegetables Breeding
location
Testing
location
Seed
production
Processing
location
Sales Extension
services
Advanta x x
x
x
Bayer x x
x
x
Bejo
x
x x
Corteva
Agriscience
x
x
East African Seed x x x x x x x x
East-West Seed
x
x x
Enza Zaden
x
x x
Equator Seeds ** x x
x x x x x
FICA Seeds ** x x x x x x x x
Kenya Highland Seed x
x x
Kenya Seed
Company
x x
x
Known You Seed
x
x
Limagrain x x
x
NASECO **
x
x
Pop Vriend Seeds
x
x
Rijk Zwaan
x
x x
Sakata
x
x
Seed Co x x
x x
Syngenta x x
x
x
Victoria Seeds ** x x
x x x x
Source: Access to Seed 2019, adjusted by authors.
The value of imported seeds over the last three years is approximately USD7m. Since 2004
the value of the imported seed has increased significantly. Imported vegetable seed in Uganda mainly
originates from Kenya. Other important seed-supplying countries are South Africa and the Netherlands
(see figure below).
A serious problem in the Uganda seed sector is the presence of counterfeit seeds. Experts
indicated during the validation workshop that this affects as much as 30 to 40% of the total seed
market.
Figure 3.7 Value of imported seeds in Uganda HS 12099100
Source: UBOS.
0
1,000
2,000
3,000
4,000
5,000
6,000
7,000
8,000
2004 2005 2006 2007 2008 2009 2010 2011 2012 2013 2014 2015 2016 2017
Kenya South Africa Netherlands India Thailand Other
Wageningen Economic Research Report 2019-117 | 21
3.4.1.6 Other input suppliers
In Uganda there are about 4,000 agro-input dealers, according to the Uganda National Agro-
input Dealers Association (UNADA). The knowledge level of the agro dealers in Uganda is low and yet
the agro dealer is the source of information and advice for the farmer. Therefore, the UNADA has
started training 1,200 agro dealers in the safe handling of pesticides. Unfortunately, less than
300 agro dealers are officially licensed to trade in agrochemicals.
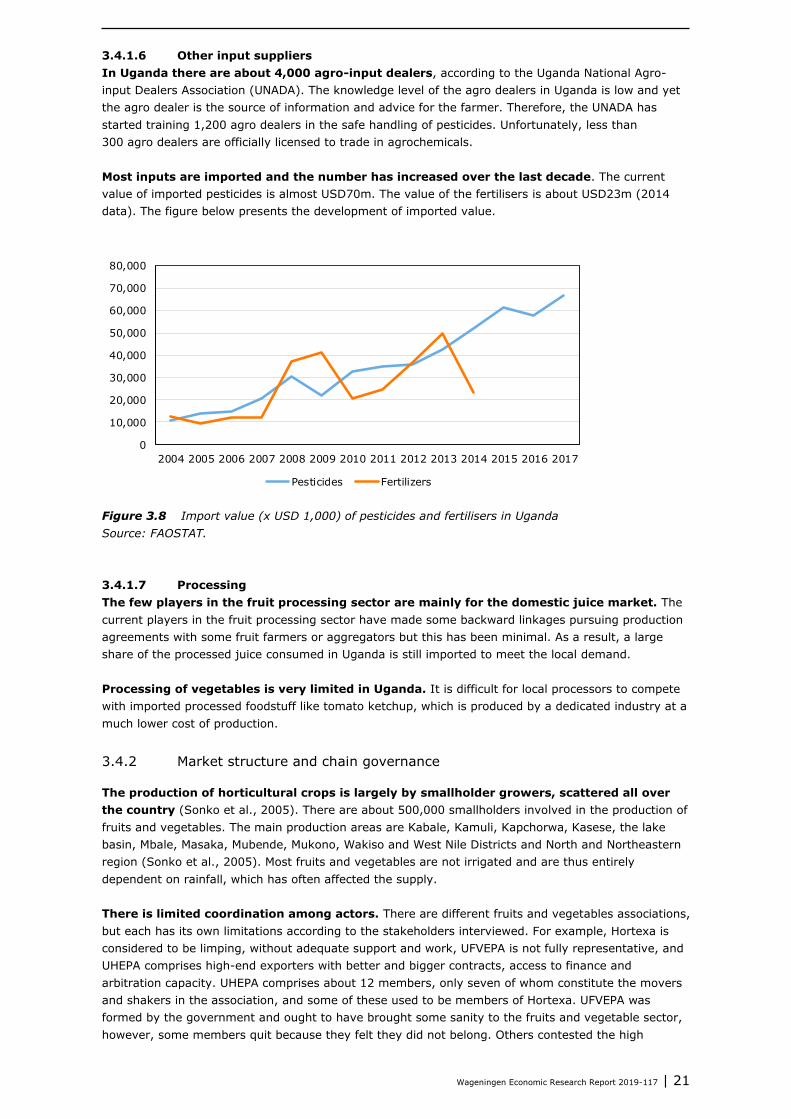
Most inputs are imported and the number has increased over the last decade. The current
value of imported pesticides is almost USD70m. The value of the fertilisers is about USD23m (2014
data). The figure below presents the development of imported value.
Figure 3.8 Import value (x USD 1,000) of pesticides and fertilisers in Uganda
Source: FAOSTAT.
3.4.1.7 Processing
The few players in the fruit processing sector are mainly for the domestic juice market. The
current players in the fruit processing sector have made some backward linkages pursuing production
agreements with some fruit farmers or aggregators but this has been minimal. As a result, a large
share of the processed juice consumed in Uganda is still imported to meet the local demand.
Processing of vegetables is very limited in Uganda. It is difficult for local processors to compete
with imported processed foodstuff like tomato ketchup, which is produced by a dedicated industry at a
much lower cost of production.
3.4.2 Market structure and chain governance
The production of horticultural crops is largely by smallholder growers, scattered all over
the country (Sonko et al., 2005). There are about 500,000 smallholders involved in the production of
fruits and vegetables. The main production areas are Kabale, Kamuli, Kapchorwa, Kasese, the lake
basin, Mbale, Masaka, Mubende, Mukono, Wakiso and West Nile Districts and North and Northeastern
region (Sonko et al., 2005). Most fruits and vegetables are not irrigated and are thus entirely
dependent on rainfall, which has often affected the supply.
There is limited coordination among actors. There are different fruits and vegetables associations,
but each has its own limitations according to the stakeholders interviewed. For example, Hortexa is
considered to be limping, without adequate support and work, UFVEPA is not fully representative, and
UHEPA comprises high-end exporters with better and bigger contracts, access to finance and
arbitration capacity. UHEPA comprises about 12 members, only seven of whom constitute the movers
and shakers in the association, and some of these used to be members of Hortexa. UFVEPA was
formed by the government and ought to have brought some sanity to the fruits and vegetable sector,
however, some members quit because they felt they did not belong. Others contested the high
0
10,000
20,000
30,000
40,000
50,000
60,000
70,000
80,000
2004 2005 2006 2007 2008 2009 2010 2011 2012 2013 2014 2015 2016 2017
Pesticides Fertilizers

22 | Wageningen Economic Research Report 2019-117
membership costs. Some actors think that UFVEPA should be disbanded and a new association that is
more representative should be formed. With the expansion of Entebbe airport, the fruits and vegetable
sector could lose out on the new cold chain facilities in favour of the flower sector because the latter is
more organised, coordinated and can lobby better.
3.4.3 The enabling and supporting environment
Liberal economic reforms in Uganda have weakened the enabling environment for the
horticulture sector. Wiegratz (2010) describes the process of liberal economic reforms in detail: “Since
the late 1980s but especially in the 1990s, the government neoliberalised the Ugandan state, economy
and society extensively according to ‘market society’-oriented prescriptions – all with significant financial
and technical donor assistance and related pressure. The new economic reforms included a currency
reform, the liberalisation of the foreign exchange markets and the export crops sectors (coffee, cotton),
the abolition of the respective marketing boards, the dismantling (directly or indirectly) of cooperatives,
the transformation of ministerial responsibilities and practices including the agricultural extension service
(towards ‘demand-driven’ and consultancy-type services), the laying off of an estimated 150,000 or
more public servants and a further administrative restructuring in accordance with ‘new public
management’ doctrines. Further, they included new ‘business-friendly’ laws (e.g. regarding investment
and profit expatriation), the privatisation of most state-owned businesses/parastatals and properties and
the creation of state institutions such as the Uganda Investment Authority (UIA) and the Uganda
Revenue Authority (URA), a general deregulation across the economy and the lifting of protective buffers
for (weak) economic actors (such as peasants and workers).”
Past agricultural extension reforms failed. In line with this another author states the following:
“The need to improve agricultural extension services had long been recognized as necessary to
improve agricultural productivity in Uganda. In 2000, a high-profile and substantial reform of
agricultural extension services was initiated, and a relatively strong and efficient agency was set up to
implement it. Initially, the program appeared successful. However, the reform gradually stalled and
was reversed after a series of political interventions. Finally, in 2012 it was effectively abandoned in its
original form, and extension services remain highly inadequate in Uganda (Kjaer, 2015)”. Therefore,
the use of extension services is relatively low: recent LSMS data indicates that countrywide 18% of
the farmers use extension services provided by the National Agricultural Advisory Services (NAADS).
The table below gives an overview of the different sources of extension.
Table 3.6 Use of extension services, in % of households
Central East North West Total
National Agricultural Advisory Services (NAADS) 13% 17% 21% 19% 18%
Input supplier 0% 1% 2% 0% 1%
NGO 2% 2% 5% 1% 3%
Cooperative/farmer’s association 1% 2% 0% 0% 1%
Large scale farmer 1% 0% 0% 0% 0%
Other 1% 0% 0% 0% 1%
No use of extension 82% 78% 72% 80% 76%
Source: LSMS 2013/2014, unweighted, calculations Wageningen Economic Research.
Wiegratz (2010) also describes that many past government programmes, for example in the
agricultural sector, were characterised by severe corruption and implementation problems and thus
could not deliver on the outlined ambition. Wiegratz (2010) argues that ultimately “the reforms did
not remove many of the sources of economic and social uncertainty but endorsed and kept many in
place and unleashed new ones.”
Various policies were developed by the government to support the sector, but they lack a
successful implementation strategy. Uganda Vision 2040 aims to transform Uganda from a
predominantly peasant and low-income country to a competitive upper middle-income country. The
Ugandan government has identified fruits and vegetables as priority crops in the Framework

Wageningen Economic Research Report 2019-117 | 23
Implementation Plan. The government also heads up the creation of an enabling environment and
oversees regulations and aims to connect subsistence farmers to the markets. They aim to increase
production and productivity, market access, and value added. The government of Uganda has pursued
previous policies and strategies under the Plan for Modernization of Agriculture (PMA) – a multi-
sectoral framework aimed at transforming subsistence farming to commercial agriculture. The Uganda
National Bureau of Standards (UNBS) is the body concerning standardization and implementation of
food standards, other activities are scattered amongst many ministries and agencies and
uncoordinated. Combined with outdated legislation and poor facilities, enforcement appears to be
difficult. For example, the Uganda Food and Nutrition Policy was developed in 2003, but strategies
mentioned in that document have hardly been implemented.
Despite government efforts in the PMA, progress was made mainly in research and
agricultural advisory services (only two of seven pillars of the PMA), while limited progress
was achieved in the other five pillars (MAAIF, 2010). As such, government has identified areas
of weakness in the PMA framework and addressed them in this five-year Agricultural Sector
Development Strategy and Investment Plan (DSIP) 2010/11 – 2014/15, which is in line with the
agricultural priorities in the National Development Plan (NDP):
(i) Enhancing production and productivity, aiming at supporting Ugandans to engage in productive
and profitable agricultural and agribusiness activities to ensure food security and increase
household income;
(ii) Significant improvements in market performance through facilitating access to high quality inputs
and participation in value addition activities, expanding the rural network infrastructure, improving
capacity for regulation and enforcing standards, among others;
(iii) Providing an enabling environment involving a body of statutes, regulations and standards to
remove critical constraints to private sector growth; supporting opportunities that improve market
efficiency; and improving the incentive environment facing the private sector in the key market
chains;
(iv) Development of institutions to deal with structural challenges faced under MAAIF since most of the
agriculture sector challenges were compounded by institutional challenges. Support structures that
were expected included the restructuring MAAIF to create an Agribusiness, and Regulatory
Services Departments in each of the three ‘commodity’ directorates of Crop Resources, Animal
Resources and Fisheries (MAAIF, 2010).
The National Development Plan-II (NDP-II) proposes government support and investments
in 12 agricultural value chains, however, excludes high value fruits and vegetables. The NDP
is focused on cotton, coffee, tea, maize, rice, cassava, beans, fish, beef, milk, citrus and bananas. The
NDP-II is the second in a series of six five-year plans aimed at achieving the Uganda Vision 2040. The
NDP-II is expected to be implemented from 2015/16 through 2019/20, seeking to leverage
opportunities and honour obligations presented by emerging developments at the national, regional,
continental levels, and even the global level. The areas of attention will be strengthening agricultural
research, implementing a single spine extension system, promoting technology adoption at the farm
level, increasing access to and effective use of critical farm inputs, promoting sustainable land use and
soil management, increasing access to agricultural finance with specific options for women farmers,
and strengthening agricultural institutions for effective coordination and service delivery. This is
expected to lay the foundation for the establishment and expansion of agro-processing in the country.
The plan recognises stages along the value chains of the selected enterprises where interventions will
be focused, as well as offering potential leverage.
National Extension Policy 2016 will develop and invest in various agricultural extension approaches
and systems with varying demand for human, capital and financial resources. In 2014, the
government made a decision to re-structure the entire national agricultural extension system to
address past weaknesses in extension services. It has various policy objectives:
(i) To establish a well-coordinated, harmonised pluralistic agricultural extension delivery system for
increased efficiency and effectiveness.
(ii) To build institutional capacity for effective delivery of agricultural extension services.
(iii) To develop a sustainable mechanism for packaging and disseminating appropriate technologies to
all categories of farmers and other beneficiaries in the agricultural sector.
24 | Wageningen Economic Research Report 2019-117
(iv) To empower farmers and other value chain actors (including youth, women and other vulnerable
groups) to effectively participate in agricultural extension processes and build their capacity to
demand for services.
A new Agriculture Sector Strategic Plan (ASSP) was developed following a comprehensive
review of the DSIP for the period 2010/11 to 2014/15 and contains 12 additional priority
crops including fruits and vegetables. The review identified some implementation challenges,
lessons learnt, opportunities, emerging issues and generated key recommendations to guide future
action. The ASSP is the flagship plan for investment and development of the agricultural sector, in line
with the NDP to be implemented through a multi-sector-wide approach. The ASSP aims to increase the
income of households, support food and nutrition security, strengthen institutions, and increase access
to inputs and to markets.
• For the ASSP there has been a Framework Implementation Plan with four strategic commodities: oil
palm, oil seeds, cotton, cocoa.
• There are 12 additional priority crops: bananas, beans, maize, rice, cassava, tea, coffee, fruits and
vegetables, dairy, fish, livestock (meat).
Despite the above efforts, the specific policies in the fruits and vegetables subsector in
Uganda have been inadequate (MAAIF, 2018). In addition, many industry stakeholders have
argued that the fruit and vegetable sector has been neglected by the government. Therefore, specific
policies have been critically reviewed and MAAIF developed ‘The FRUITS AND VEGETABLES
FRAMEWORK IMPLEMENTATION PLAN’ which is currently on its way to being finalised and
implemented. The framework involves different horticultural crops, focusing mainly on technical
support, with various thematic themes like youth, gender, HIV/AIDS, nutrition and environment
(MAAIF, 2018).
The current export inspections and procedures are not in line with international standards.
Interviewed stakeholders mentioned that some exporters actually export without prior inspection at
the production site and/or the pack house. However, the Government is trying to address this by
restricting current hot pepper exports to the EU market to ‘clean the house’. There is currently no ban
on exports but there could be a ban in November 2019 if Uganda does not take serious measures on
time to address the issues identified by the EU notably the FCM and the high MRLs. The EU mandated
Uganda to address specific issues causing interceptions and in November, the EU will send a team to
Uganda to check if the identified issues with MRL and quarantine organisms have been addressed
accordingly. However, interviews with various stakeholders revealed that there was misunderstanding
among them on the state of hot pepper exports to the EU and the farmers were not aware of the
policy decision by MAAIF. Other actions by government as reported by stakeholders during the
validation workshops include: requiring exporters to have production sites or out-growers, recruitment
of more extension workers, retooling of extension workers and building capacity for the inspection of
horticultural products. Stakeholders reported that the Uganda Agricultural Chemicals Board lacks the
capacity to carry out a full sampling of export consignments. Sometimes even random sampling for
the consignments is lacking.
There is a mismatch between phytosanitary regulations between the Netherlands and
Uganda. According to formal seed importers it is difficult to operate in Uganda and to import seeds.
There is a strong focus on bulk crops like soy, but very little attention to vegetable seeds. Uganda
requires additional ISTA certificates to be able to import seeds. This adds costs to the selling price of
seeds that the grower is unwilling to pay. Another challenge was that seeds had to be treated
according to the ISTA from 2019 with certain chemicals (Thiram) and in the EU this product was
banned, no longer available, and will be replaced by a more expensive product. European seed
breeders are not able to make exceptions for export to Uganda. A suggestion by various industry
stakeholders is to follow the Dutch NAL norms, which are considered to be more advanced than ISTA.
Fruits and vegetables education system is weak with limited practice and exposure. There is
a 2-year diploma course in Bukalasa Agricultural College supported by the government of Denmark
and the Netherlands. Other universities like Makerere and Mt. of the Moon also offer horticultural
courses at degree level.

Wageningen Economic Research Report 2019-117 | 25
Actors in the fruits and vegetable sector have limited access to finance. Limited access to
financial resources presents many potential challenges, as access to financial resources is critically
important for development. Many stakeholders in the fruit and vegetable sector confirmed that all
actors have difficulties in obtaining external credit. Most actors willing to invest rely on informal credit
through family and friends. In addition, commercial bank interest rates and interest rates of private
money lenders are high, averaging at 25% year. But also, short term credits with rates of 5-10% per
month have been identified. This high interest rates make borrowing in the horticulture sector difficult.
3.4.3.1 Investment environment
The level of FDI inflows as a share of the GDP in Uganda is relatively high compared to
neighbouring countries. Since 2016 Foreign Direct Investments (FDI) inflow has increased again
and has a value of almost USD1.4bn (4.8% of GDP). For example, the share of FDI as a share of the
GDP in Kenya is 0.9%; in Rwanda 3.2%; and in Tanzania 2.2%.
Figure 3.9 FDI in Uganda in current USDbn
Source: World Bank.
Comparing Uganda with its regional peers the business climate is less attractive. We see
some interesting difference related to the business climate (WB Doing Business, 2019):
• Uganda ranks 127 out of 190 countries;
• Kenya ranks 61 out of 190; and
• Rwanda ranks 40 out of 190;
For example: In Uganda it takes 24 calendar days to register a company; in Rwanda only 4. The main
limitations affecting doing business in Uganda include: poor access to finance, corruption, high tax
rates, inadequate supply of infrastructure, poor work ethic and government bureaucracy.
Land is available for investment purposes. The Ministry of Lands and Urban Development is
mandated “To ensure a rational, sustainable and effective use and management of land and orderly
development of urban and rural areas as well as safe, planned and adequate housing for socio-
economic development”. It has two departments that are directly related to land acquisition for
investment. The Department of Land Administration (DLA) is responsible for the supervision of land
administration institutions and the valuation of land and other properties. The DLA issues certificates
of titles, general conveyance, keeping custody of the national land register, coordination, inspection,
monitoring and back-up technical support relating to land registration and acquisition processes land
in Uganda is under the following land tenure systems which may be available for investment purposes,
as described in a publication by the Uganda Investment Authority (2015):
• Leasehold tenure. Leasehold tenure is a form of tenure whereby one-party grants to another the
right to exclusive possession of land for a specified period, usually in exchange for the payment of
rent. The longest lease term is 99 years.
0
0.2
0.4
0.6
0.8
1
1.2
1.4
1.6
200420052006200720082009201020112012201320142015201620172018
Billions
26 | Wageningen Economic Research Report 2019-117
• Free hold land tenure. This tenure derives its legality from the Constitution and the written law.
Freehold tenure may involve either a grant of land in perpetuity, or for a lesser specified period.
Only citizens of Uganda are entitled to own land under freehold tenure. Noncitizens may lease it for
a period up to 99 years.
• Mailo Land tenure. This tenure is almost identical to freehold tenure. Registered land can be held in
perpetuity and a Mailo owner is entitled to enjoy all the powers of a freehold owner
• Customary tenure. In some places the land is held communally, in some it belongs to a clan while in
others it is held by individuals. The rules of customary law also vary in different parts of the country.
3.4.3.2 Activities of development partners
At the moment not many donors are active in the fruit and vegetable sector. In the past there
were many projects in the sector (e.g. SNV is active in the pineapple sector, USAID has a focus on
commodity production and marketing for coffee, maize and beans)). At the moment it appears that
the fruits and vegetables sector is not receiving a lot of attention. Solidaridad is doing projects in the
sector, e.g. with onion production, youth involvement and bringing Uganda exporters to Kenya for
exposure purposes.
SNV in partnership with Wageningen University and Research (WUR), CGIAR’s Climate Change
Agriculture and Food Security Programme, Agriterra and Rabo Partnerships published a series of
climate risk assessment reports as part of the Climate Resilient Agri-businesses For Tomorrow
(CRAFT) project (funded by the Netherlands Ministry of Foreign Affairs). Some of the cases studied are
based in Uganda but do not concern the fruits and vegetables situation.
3.5 Market demand
3.5.1 National demand
Local market demand for fruit and vegetables is likely to increase. Various indicators support
this:
• Urbanisation rate (since 2012 +3% per year)
• Population growth (since 2012 +7m)
• Moderate GDP growth (5% per annum)
The transition to middle income country will impact the agricultural sector and yields need
to be improved at farm level to be able to feed the increasing urban population. Uganda’s
Vision 2040 envisions a transition to middle income country status with a largely non-agrarian
workforce and urban-dwelling populace. However, the Ugandan economy is still heavily reliant on the
agriculture sector, with 69% of household’s dependent on subsistence farming for their main source of
income, and nearly 75% of all households residing in rural areas (UBOS, 2014). In addition, food
insecurity is still a problem for some regions of Uganda (FSOU, 2019).
The studied LSMS data shows an increasing diversity in all regions of Uganda. The biggest
increase in household diversity intake can be observed in Central Uganda. In this part of the country
the consumption goes from almost 8 to above 9 food groups that are consumed, based on a 24hr
recollection (figure 3.10). Looking at the detailed data the fruits (85%) and vegetables (73%) are an
important contributor to the daily diet of the household in all parts of Uganda. Between 2012 and
2016 especially the importance of fruits gained importance in the diet. Appendix 5 presents an
overview of the different food groups. However, the volumes of the vegetables consumed per capita
remain relatively low (insert FAO data, food supply).

Wageningen Economic Research Report 2019-117 | 27
Figure 3.10 Household Dietary Diversity Score
Source: LSMS 2013-14.
3.5.2 Regional demand
Uganda has a good position in the region and Uganda supplies neighbouring countries like Kenya,
South Sudan, Democratic Republic of Congo (DRC) and Rwanda.
3.5.2.1 Kenya imports from Uganda
Main imports from Uganda are:
Bananas: Imported through the year; greatest demand is for cooking banana varieties, as Kenya
has an adequate supply of ripening bananas. Three traders reported to import ripening banana
recently when Kenya had inadequate supply due to climate change and increased banana panama
disease, which is impacting the Mount Kenya production region. Upon fact checking, it was found
that there is also a significant problem of fusarium wilt and nematodes in the Mount Kenya region
– especially bananas from tissue culture production – as farmers do not manage hygiene in the
field. Cooking bananas, which are in shorter supply than the ripening bananas, are imported
throughout the year.
Pumpkins: Kenya imports pumpkins from Uganda year-round due to production shortages,
inadequate volumes for aggregation in the areas where pumpkins grow. There is a culture of
farmers using pumpkin leaves as vegetables and only growing pumpkins as boarder crops, as they
are low value.
Oranges and tangerines: Oranges are imported into Kenya from Uganda during April and May as
seasons differ. Kenya used to produce a lot of oranges in the same season in its Thika, Machakos
and Embu regions, however, the citrus greening disease wiped out production in these areas ten
years ago and the regions have not gone back into production. There are pockets of production,
the volume of which is mainly consumed in the same regions. Oranges are produced in the lower
parts of the Eastern Counties and coast especially in Kwale, Kilifi and lower Tana. Infrastructure
and aggregation constraints restrict these regions’ access to the market. There are new plantings
by medium-scale farmers in Kibwezi County who produce export varieties, as they also export
mangos from the region. Kenya does not produce tangerines, relying mainly on imports from
South Africa and Egypt.
Lemons: These are grown in coastal Kenya in limited volume and shipped to Nairobi. Kenya relies
on Tanzania and Uganda, plus a limited quantity from its Mt. Kenya and Kibwezi regions. These
regions do have potential, and if production improves, they will supply more citrus to the market
than they do now. Investments from counties are prioritizing citrus, especially in Kibwezi, Kilifi and
Kwale. It remains, however, to be seen how this will improve production and productivity.
Pineapples: Pineapples in Kenya are mainly grown in Thika, Malindi and Kisii, however, there are
few pineapples to harvest during the cold season from June to September. It is during this window
that Kenya imports pineapples from Uganda. The taste of pineapple from the Kisii region is similar
to that of Ugandan pineapples, so traders who buy pineapples from that region prefer to purchase
Ugandan fruits, as that results in the Thika plantations selling off–grade pineapples to the local
0
1
2
3
4
5
6
7
8
9
10
East West North Central Uganda
2009/10 2010/11 2011/12 2013/14

28 | Wageningen Economic Research Report 2019-117
market in order to maintain the taste that consumers favour. Homabay County is promoting
pineapple cultivation, which may allow a year-round supply from Kenya, as the weather is hot and
new smallholders may grow the region’s market share. However, it is not yet clear how new
plantings will impact the market, as the scale is still small.
Watermelons: Watermelons in Kenya are grown by medium-scale farmers, as its production
requires scale and investments. Production is limited from June to September due to the cold
weather and susceptibility to diseases, making it expensive for the producers to grow during this
season and the costs of importing from Uganda lower. Medium-scale farmers prefer contract
production and as watermelons are controlled by a select number of traders who dictate prices
and sourcing trends, smaller wholesalers who cannot engage in contract production opt to buy
from Uganda where volumes are sufficient. We found trading relations outside the shortage
window among emerging wholesalers not connected to wholesale markets who import from
Uganda year-round. These traders are few and mainly supply to hotels and institutions, making
them less visible than the traders in wholesale markets.
3.5.2.2 Kenya exports to Uganda
Main exports from Kenya to Uganda are the following:
• Tomatoes: mostly in the month of May.
• Carrots: year-round from Nakuru County but climate change is limiting year-round production.
• Garden peas: year-round from Nakuru County but climate change is limiting year-round production:
while demand from Tanzania is also growing.
• Mangoes: February to April.
• Passion fruits: February and May.
• Potatoes: year-round from Nakuru County but climate change is limiting year-round production:
while demand from Tanzania is also growing.
3.5.2.3 Transport costs
Transport from Uganda to Kenya is often 30% cheaper than transport from Kenya to Uganda. Demand
for transport from Kenya to Uganda is higher as more goods are shipped from and through Kenya to
Uganda than the reverse. Transport from Uganda averages KES 30,000 (USD 290 or UGX 1,08m) for
10MT while transport from Kenya to Uganda averages KES 50,000 (USD 480 or UGX 1.79m) for 10MT.
The vehicles that are used to transport produce from Uganda to Kenya are mainly used to transport
industrial goods to Uganda like chemicals, especially lime and salt from Mombasa and Kajiado. Due to
their size, 10MT, they are more suitable for transporting fresh agricultural produce back to Kenya,
while the larger trucks transport cereals, maize and animal feed inputs.
3.5.2.4 Cross-border trade
The nature of cross-border trade differs from trade between Uganda and the rest of the country. The
communities along the border are interconnected and related. On the Busia border, the Luhyia
community that dominates the area lives on both sides of the border and therefore trades on a
different scale than the rest of the country. Dry cereals – especially beans, maize and ground nuts –
are traded across the border in higher volumes. While other horticultural produce is also traded in
Malaba border markets, cross-border trade statistics are more difficult to ascertain.
3.5.2.5 Drivers for trade
Several factors influence the trade from Uganda to Kenya:
• Seasonality: the most important factor is seasonality for all products. The two countries have
different production seasons, and due to the exclusively rain-fed nature of agriculture in the two
countries and the seasonality of production, there is a symbiotic relationship in the demand and
supply.
• Taste: There are two products that Kenya prefers to consume out of Uganda, as they find them to
have a better flavour than those grown in Kenya: pineapple and watermelon. The Thika region
produces quite acidic pineapples – not as sweet as pineapples from Uganda. The same is said for
watermelon, but there is no clear characteristic (like acidity) that the traders use to distinguish
watermelons grown in Uganda.

Wageningen Economic Research Report 2019-117 | 29
• Reliability of supply: Watermelon traders prefer to source from Uganda due to the reliability in
supply and the demand for volumes which are not consistently supplied by Kenya. Uganda therefore
has priority over Kenya among the traders.
• Variety: There is a huge preference for “Kiganda” green bananas in the Kenyan market that is quite
distinct from the Kenyan green bananas. While Kenya produces high volumes of green bananas,
there is a market perception that Kiganda is a better green banana variety for children than Kenyan
green bananas. There is a culture of weaning children using green banana, which gives the
Ugandan-grown bananas a higher market share in Kenya.
• Underutilised transport capacity: Uganda imports products through the port of Mombasa; but
ships back less products than available capacity. Transporters therefore lower return transportation
costs to increase their chances of moving products back to the country: transport from Uganda to
Kenya is often 30% cheaper than transport from Kenya to Uganda. Demand for transport from
Kenya to Uganda is higher, as more goods are shipped from and through Kenya to Uganda than the
reverse.
The only quality parameters that the traders mentioned are those related to taste. No trader
mentioned price to be an issue except when Kenya is off-season and prices are higher than Uganda’s
prices. However, FAO statistics on wholesale price in Kenya and Uganda give the impression that the
prices in Uganda are lower (excluding transport). See the figure below.
Uganda’s location at the centre of the Great Lakes region and in the EAC offers Ugandan
farmers access to a regional market with over 150 million consumers. Recent export growth
has been stimulated by demand in neighbouring countries such as South Sudan, which has emerged
as an important trading partner, demanding food and other manufactured materials. However, due to
unrest in South Sudan, this market has now been reduced in importance for export from Uganda.
Moreover, the border with Rwanda has been closed for some time due to political issues and this
affects cross-border trade.
Figure 3.11 Wholesale price of beans in Uganda versus Kenya
Source: FAOSTAT.
3.5.3 International demand
Current export volumes of fruits and vegetables from Uganda are estimated by COMTRADE
to be almost 400,000 tonnes of produce with a value of USD118m in 2017. Most of the
exported produce consists of vegetables, with the key products being capsicums (hot peppers,
including Scotch Bonnet, habanero, chilies, etc.) and the garden eggs. As such, the horticultural sector
has become important in the Ugandan economy as it contributes an increasing share of the non-
traditional exports.
0
100
200
300
400
500
600
700
800
900
USD
/tonne
Month
Uganda, Wholesale Average Kenya, Wholesale

30 | Wageningen Economic Research Report 2019-117
The major destinations for horticultural exports include the UK and Belgium and are
consumed by ethnic buyers in Europe. This niche market is relatively limited in size and is subject
to only the bare minimum legal requirements regarding MRLs and sanitary and phytosanitary aspects.
Figure 3.12 Export quantity of fruits and vegetables (HS07&08) in tonnes 2001-2017
Source: UN COMTRADE.
Despite increasing export during recent years, Uganda continues to struggle in comparison
to export volumes of surrounding countries. See the tables below. Interviewed importers in the
EU mention many challenges in the export value chain, including a lack of cold storage, lack of
traceability and certification, lack of monitoring at farm level of chemical use, lack of adequate packing
material, and other factors. In the case of beans and peas, the climatic conditions are not favourable
(USAID, 2002). In the case of fresh tropical fruits, due to their weight, they are generally shipped by
sea and the distance to the nearest seaport is further away, compared to countries like Kenya and
Tanzania. Appendix 2 gives an overview of the value of exported fruits and vegetables.
At present, there is no commercial farmer in Uganda that is producing fresh vegetables up
to the standards of major European supermarkets. Foreign supermarket requirements regarding
quality, traceability, and food safety are increasing, and this leaves room only for serious and
professional production of fresh produce. In Uganda there is no producer nor exporter that has
GlobalG.A.P. certification.
Table 3.7 Export of fruit from Uganda 2008-2017 in tonnes
2008 2009 2010 2011 2012 2013 2014 2015 2016 2017
Fresh or dried mangoes 0 12 5 64 51 49 64 1,313 2,521 10,112
Fresh or dried pineapples 2,426 1,981 1,746 2,299 522 815 671 1,012 2,481 3,470
Fresh or dried avocados 6 4 60 122 128 191
Citrus fruit, fresh or dried 13 7 298 99 206 311 594 3,758 3,139 13,582
Melons, incl. watermelons,
and papaws (papayas),
fresh
1523 1951 1328 668 264 446 183 1,114 1,738 5,299
Bananas, incl. plantains,
fresh or dried
409 813 461 637 270 632 25,522 4,647 2,807 2,501
Fresh strawberries,
raspberries, blackberries,
back, white or red currants,
gooseberries and ...
748 204 106 257 153 55 16 115 72 995
Apples, pears and quinces,
fresh
18 8 7 98 65 232 264 597 801 522
Other 1,371 70 35 173 140 77 532 230 138 45
Source: UN Comtrade.
0
50,000
100,000
150,000
200,000
250,000
300,000
350,000
400,000
450,000
Fruits Vegetables

Wageningen Economic Research Report 2019-117 | 31
Table 3.8 Export of vegetables from Uganda 2008-2017 in tonnes
2008 2009 2010 2011 2012 2013 2014 2015 2016 2017
Dried leguminous
vegetables, shelled, whether
or not skinned or split
34,042 47,972 24,188 31,698 28,845 38,092 39,813 15,3526 21,4144 26,6794
Leguminous vegetables,
shelled or unshelled, fresh
or chilled
637 611 1,835 4,785 1,471 5,314 1,902 3,193 6,337 39,952
Roots and tubers of manioc,
arrowroot etc
9,159 898 11,416 5821 445 8942 5961 12729 14,317 16,950
Tomatoes, fresh or chilled 2 14 5 23 20 14 1351 3215 5,852 15,862
Potatoes, fresh or chilled 25 74 2 14 98 190 867 9,892 15,803 13,564
Vegetables, uncooked or
cooked by steaming or
boiling in water, frozen
3,076 2,298 2,112 1,016 1,807 5,601 6,577 6,583 6,859 7,069
Other vegetables, fresh or
chilled (excluding potatoes,
tomatoes, alliaceous
vegetables, edible ...
983 983 488 1,347 2,593 1,789 1,025 1,346 7,24 1,546
Onions, shallots, garlic,
leeks and other alliaceous
vegetables, fresh or chilled
3 125 52 92 104 61 985 1,407 545 726
Other 14 7 2 10 22 5 336 336 270 214
Source: UN Comtrade.

32 | Wageningen Economic Research Report 2019-117
4 Case studies
4.1 Introduction
In the following case studies, we analysed five different crops in more detail. For each case study we
provide a brief overview of the following:
• The main production area;
• A detailed value chain description and the role of the different actors;
• The cost and benefit analysis; and
• We conclude with a SWOT that gives an overview of the key strengths, weaknesses, opportunities
and threats.
4.2 Tomato
4.2.1 Main production areas
Tomatoes are grown throughout the country. The main production districts include;
• Central region: Luweero, Mpigi, Masaka, Kayunga, Nakaseke
• Eastern region: Mbale, Kapchwora
• Western region: Kabale, Kasese
4.2.2 Value chain
Tomato farmers are linked in various ways with the market. Most of the farmers sell to middlemen,
agents or brokers that travel around the rural areas to buy produce and resell it again at the
wholesale markets in rural areas, or in urban markets. Some farmers close to the markets sell their
produce themselves at the market, however, the majority of the farmers sell to travelling middlemen.
Others supply regional exporters.
Seed suppliers sometimes supply farmers directly, but they mostly work with agro-input dealers that
supply input retailers located in the villages.
For growing tomatoes there are two seasons, based on the rain. The first growing season runs from
April to May. The second growing season runs from September to November. In the meantime, there
is also some production with irrigation. Overall quality is less during the rainy season due to lots of
pests and diseases. Farmers are selling their produce mostly to middlemen in boxes with top-up,
which can contain between 100 and 200kg but are not weighed.
A recent study by ABA (2018) for the USAID supported Feed the Future Program in Rwanda shows
that on average farmers are losing on 21% of their crop during harvest. At the collection point,
another 11.5% of tomatoes are lost. At the wholesale level 10% of tomatoes are rejected and at the
retail level 13.6% of tomatoes are discarded. In total they estimate that on average 40% in the value
chain is lost. Unfortunate we were not able to retrieve any reliable data on Uganda, however, given
the comparable production and marketing system in a comparable climate, it is reasonable, based on
field observations and expert indications, to assume that this share is similar.

Wageningen Economic Research Report 2019-117 | 33
Figure 4.1 The tomato value chain
4.2.2.1 Farmers
Many of the tomato farmers in Uganda are involved in subsistence farming. The number of tomato
farmers is minimal considering how serious a business the tomato cultivation is. Tomato farmers can
benefit from at least two growing seasons with sufficient rain in a year.
The more serious farmers are often using improved seed, irrigating and sometimes have a small
greenhouse, while the subsistence farmers use mainly OPV seeds or farmer saved seeds with very
limited additional inputs. In general the current level of agricultural practices is low and misuse and
overuse of pesticide is very common. The planting of seeds is mainly done directly in the soil or at
small nursery plots at the farm.
We found that the level of irrigation is still low, although the results from our study show that
irrigation is adding value.
Tomato “quality” is very subjective and hardly rewarded in the market with a price premium.
Interviewed farmers consider “quality” to refer to the large size of the tomatoes as well as to the
hardness of the tomato skin. They also mentioned that their customers prefer tomato varieties with a
longer shelf life. Some of the tomato farmers also sell directly on the markets and therefore pay taxes
to market authorities.
Actors in the tomato value chain mention the following yields as realistic, under good agricultural and
climate conditions:
• 15 tonnes per acre for hybrid varieties including irrigation. Irrigation can enable farmers to have a
maximum three to four harvests per year. The initial investment in irrigation is between UGX 8 and
14m for the pump and pipes for one acre. It also requires additional running costs for fuel;
• 8 tonnes per acre for hybrid varieties only;
• 6 tonnes per acre for OPV varieties.
The current farm gate sales price is UGX 1,000-1,500 per kg. Given the reported yields at the farm
level and the reported average tomato price per kg at farm gate, the margin is between 40 and 55%.

34 | Wageningen Economic Research Report 2019-117
Our analysis of the LSMS also confirms a positive margin for farmers that produce tomatoes; see
Appendix 6 for a more complete analysis.
We studied different type of farmers: farmers that work only with OPV seeds, farmers that use hybrid
seeds and farmers with irrigation. It appears that farmers that have hybrid seed are able to have
better financial results due to increased yields but also due to four harvests per year compared to only
two without irrigation. Irrigation also increases the annual yields (see the figure below).
Figure 4.2 Margin and costs of studied tomato
farmers in Uganda per acre per year
Source: Author’s field data.
Figure 4.3 Margin and costs per kg produced of
studied tomato farmers in Uganda per year
Source: Author’s field data.
4.2.2.2 Traders
Tomatoes are transported in wooden crates and traded in basins and wooden crates (boxes). Not
much trade is actually weighed in kilograms; instead, volumes traded are per crate, or per basin.
Retailers pay a commission to the market. For example, a small retailer that was selling from a 230kg
box paid about UGX 2,000 for a morning of selling the tomatoes. Larger traders pay more, and this
can go up to UGX 30,000 for a full truck. Most smaller retailers, however, buy from middlemen. A
common crate has a weight of 230-250kg and has a sourcing value of about UGX 270,000. The farm-
gate price equals about UGX 1,200 per kg and the wholesale price adds another 300 per kg, which can
be sold for 2,000 UGX per kg at retail (see table 4.1).
Table 4.1 Average tomato prices along the value chain (2019)
Farm to wholesale wholesale to retail Retail to consumer
Price per kg 1,000-1,200 UGX 1,200-1,500 UGX 2,000 UGX
Source: Author’s field data.
4.2.2.3 Markets
The major markets for tomatoes are Balikuddembe market (Owino market), Kalerwe market and
Nakasero market, all of which are located in Kampala. However, some commercial farmers with
irrigation even supply supermarkets and regional exporters. There are middlemen in these markets
who sell the tomatoes for a commission, usually UGX 10,000 per wooden crate. The middlemen
bargain with the buyers and the farmer only gets to know the price after the middleman has sold.
The regional export market has a big influence on pricing. In May the prices are high due to the
volume of tomato export to Kenya. Prices without a significant export demand can be as low as UGX
60,000 per wooden crate. Tomatoes are neither sorted, displayed, nor labelled according to size:
consumers can select for themselves. Not even the damaged or old tomatoes are sorted out, which
results in overall unappealing appearance and quality in the market display. A small number of
tomatoes are imported from Kenya in the ‘dry season’ between December and February. Some
supermarkets in Uganda also import tomatoes from Holland and these serve a niche market for
upscale restaurants in the country.
-
5,000,000
10,000,000
15,000,000
20,000,000
25,000,000
OPV Hybrid Irrigated
Costs Margin
-
200
400
600
800
1,000
1,200
1,400
1,600
1,800
OPV Hybrid Irrigated
Costs Margin

Wageningen Economic Research Report 2019-117 | 35
4.2.3 Most suitable areas for tomato production
The outcomes of the Global Detector are presented in the figure below. It clearly shows that there are
many locations in Uganda where tomatoes can be produced. The main area of production is Central
and West Uganda, which is very much in line with the current production areas.
Figure 4.4 The potential for tomato production in East Africa
Source: Global Detector.
4.2.4 Challenges and opportunities
A SWOT is presented below to show the strengths of the tomato value chain. The main one is the
minimum of two growing seasons, which, with irrigation can be extended to three or even four
seasons. Other strengths are the availability of good seed varieties in the market. The main problems
encountered in tomato production are the substantial presence of counterfeit seeds in the market and
a lack of support from the government (e.g. the absence of financing and extension services).
Opportunities are related to the growing market demand on the domestic and the regional markets.
Threats are related to new pests (like Tuta Absoluta) and the declining soil fertility. Another important
threat is climate change: the changing rain patterns make farming more and more unpredictable.
Table 4.2 SWOT for the tomato sub sector
Strengths Weaknesses
• Minimum of two growing seasons
• Relatively fertile land
• Availability of high yielding varieties in the market
• Unstable market prices
• Poor agricultural practices, including post-harvest
• Low productivity and quality
• Counterfeit inputs
• Limited financing
• Weak policies and weak extensions service
Opportunities Threats
• Population growth
• Availability of water for irrigation
• Growing regional markets
• New pests
• Declining soil fertility
• Climate change especially drought & changes in rain
patterns

36 | Wageningen Economic Research Report 2019-117
4.3 Onion
4.3.1 Main production areas
Uganda is the leading producer of onions in East Africa. Due to Uganda’s climate they are considered
the most suitable for production (Sonko et al., 2005). Popular varieties in the market are Red Bombay
and Red Creole. Onions are produced in areas between 1,500-2,100m above sea level:
• Eastern region: Kapchorwa, Kween, Bukwo, Naminsidwa, Bulambuli, Bududa, Sironko, Manafwa,
Tororo;
• Western region: Rukiga, Kabale, Kisoro, Ntungamo, Kasese, Kabarole.
4.3.2 Value chain
Middlemen play an important role in the onion supply chain by reducing time and transaction costs for
sourcing onions by wholesalers. The onion value chain lacks storage facilities, which renders the
onions especially vulnerable during rainy seasons. This forces farmers to sell immediately after
harvesting at low prices to prevent the onions from rotting. The figure below gives an overview of the
onion value chain in Uganda.
Figure 4.5 Onion value chain
4.3.2.1 Farmers
In Uganda onion crops are usually rain-fed rather than irrigated, and we identified the size of the plots
to be between 0.25 and 2 acres. However, there are also more advanced farmers that can cultivate
large areas of land up to 10 acres. Farmers are able to harvest onions twice a year. Most farmers
plants in March and harvest all the onions in June. They plant again in September and harvest all the
onions in December (rainy season). Current agronomic practices of farmers are very poor. They often
harvest too early and overuse both pesticides and fertilisers.

Wageningen Economic Research Report 2019-117 | 37
The achievable yield under good conditions and applying Good Agricultural Practices differ per season.
In the wet season the yields are slightly higher. In general the achievable yields are as follows:
• 10 to 20 tonnes per acre for hybrid seeds per season, depending on variety.
• 2 to 5 tonnes per acre for OPV per season.
We have collected data among onion farmers with OPV varieties and with hybrid varieties. It appears
that the hybrid farmers are performing better. The major cost for onion farming is the costs for labour
and fertilisers. The analysis of the LSMS provides further insights and confirms an average margin of
about 70%. See Appendix 6 for more information on the analysis of the LSMS data.
Figure 4.6 Margin and costs of studied onion
farmers in Uganda per acre per year
Source: Author’s field data.
Figure 4.7 Margin and costs per kg produced of
studied onion farmers in Uganda per year
Source: Author’s field data.
4.3.2.2 Traders
There is a considerable level of fragmentation of onion production. It appears that middlemen are very
important in the supply chain of onions, with 38% of wholesalers procuring onions from individual
farmers, whereas other traders source from fellow traders (Kilimo Trust, 2017). Some middlemen
even buy complete onion plots. Onion trade is highly informal, however, in compliance with some
trade requirements, traders – mostly wholesalers – incur costs from local taxes (at the areas of
operations), business licenses and market fees.
In the same study by Kilimo Trust (2017) they found that more than half of all wholesalers
interviewed reported that they go to farmers or aggregation centres near farmers to source their
onions, while at most 30% of them have other traders who deliver the produce at their premises.
Middlemen from all the East African countries that border Uganda move freely to production areas in
the country to obtain onions at lower prices from farmers themselves. On the other hand, they play a
vital value chain role: they offer an alternative market to farmers who consider packaging and
transportation of onions to major markets, an expensive undertaking.
4.3.2.3 Markets
Red bulb onions produced in Uganda are consumed in rural and urban areas with Kampala being the
hub of consumption. There is also a considerable export market for onions produced in Uganda in
neighbouring countries such as Rwanda and Kenya. However, urban consumers prefer onions
imported from Tanzania, as they have superior quality characteristics such as medium size and long
shelf life. Consequently, onion importers expressed the desire to source onions almost exclusively
from Tanzania, and there is now a significant volume of imports from Tanzania to meet local demand.
Available official statistics indicate that the volume imported from Tanzania in 2018 was
18,000 tonnes. It is very likely that this volume is higher, however, since a lot of cross-border trade is
not being registered.
In the onion sector there is some grading: grade 1 is of medium size, (the size of an egg) while bigger
sizes are regarded as grade 2. Medium sized onions are preferred by households because they just
use one onion without having to cut a piece from a large-sized one and reserving the rest for later
use, a practice that reduces the shelf life of a piece of onion. On the other hand, institutions like hotels
and schools prefer large-sized onions due to the large quantities they cook at one time. Small onions
are considered ‘rejects’ and are sold to low-end consumers at the lowest price.
-
5,000,000
10,000,000
15,000,000
20,000,000
25,000,000
30,000,000
35,000,000
OPV Hybrid
Costs Margin
-
200
400
600
800
1,000
1,200
1,400
OPV Hybrid
Costs Margin

38 | Wageningen Economic Research Report 2019-117
Table 4.3 Onion prices along the value chain (2019)
Farm to wholesale wholesale to retail Retail to consumer
Price per kg 800-1,000 UGX 1,300-1,500 UGX 3,000 UGX
Source: Author’s field data.
4.3.3 Most suitable areas for onion production
The outcomes of the Global Detector are presented in the figure below, showing the physical
boundaries for onion production in Uganda at 1,500-2,100 metres above sea level, as identified during
the FGD validation workshop. It clearly shows that there only a few locations in Uganda where onions
can be produced. The main areas of production are in Central and East Uganda, which is very much in
line with the current production areas.
Figure 4.8 The potential for onion production in East Africa
Source: Global Detector.
4.3.4 Challenges and opportunities
The key strengths identified and mentioned by industry stakeholders vis-à-vis onion production are
that the Ugandan market is able to absorb more onions; that the current climate is very suitable for
onion cultivation; and that it is possible to store onions for long periods of time provided they are
cured and stored properly. Two challenges that were identified were the limited cultivation locations
within Uganda and the poor agricultural practices due to the limited availability of extension services.
Table 4.4 SWOT for the onion subsector
Strengths Weaknesses
• Ready market (local & regional)
• Climate suitable for production
• High shelf life (up to 6 months if cured)
• Inadequate public & private extension services
• Farmers lack storage facilities
• Poor accessibility from some production areas to markets
• Poor agronomic practices
Opportunities Threats
• Prospects for new markets
• Introduction of new high yielding varieties
• Climate change
• Competition from neighbouring countries
• Depletion in soil fertility

Wageningen Economic Research Report 2019-117 | 39
4.4 Hot pepper
4.4.1 Main production areas
The main production districts of hot pepper in Uganda include:
• Central Region: Wakiso, Mukono, Kayunga, Luweero and Mubende;
• Eastern region: Mbale, Bulambuli, Bududa, Bugiri, Bukwo, Tororo, Iganga, Kamuli, Jinja,
Namayingo, Kibuku and Mayuge;
• Western region: Masindi, Hoima, Ibanda, Ntungamo and Mbarara.
4.4.2 Value chain
The products are consolidated by the buying agents from the different production areas and later
transported to the urban markets with a major focus on Kampala. The product is later sold via two
different avenues:
The majority of the hot peppers are sorted and prepared for exporters targeting European
markets.
A small share is sold to supermarkets in urban Kampala, but a limited share is also processed into
chili sauce and chili powder for the domestic market.
Hot peppers are very suitable for export since it is a crop that can withstand harsh post-harvest
conditions before leaving the country and being integrated in a cooled supply chain, which often only
starts once the product enters the airplane. The figure below gives an overview of the hot pepper
value chain in Uganda.
Figure 4.9 Hot pepper value chain
4.4.2.1 Farmers
The majority of the hot peppers cultivated are Scotch Bonnets. Currently there are many problems in
the field, particularly with the presence of the FCM that is widely found in all production areas in
Uganda. Farmers have serious problems in controlling this FCM, which is considered a quarantine
organism in the EU market.

40 | Wageningen Economic Research Report 2019-117
Hot pepper production in Uganda is mainly rain-fed and has one season per year. The season starts in
November and December with the first harvesting and it ends in May/June. In total there is a
possibility to harvest for 24 to 28 weeks at two-week intervals. The current yield of hot peppers is
estimated by experts to be four tonnes per acre. This crop is mainly cultivated on rented land.
A box of 6-7kg of hot pepper is usually sold for UGX 5,000 to 9,000 but can also go up to UGX 16,000
if the market is willing. Given the achievable yields at the farm level and the average price at the farm
gate, the margin is on average 75%. The main cost is labour (circa 70 to 90%). We found that larger
farmers can benefit from economies of scale due to efficient allocation of labour.
Figure 4.10 Margin and costs of studied hot
pepper farmers in Uganda per acre per year
Source: Author’s field data.
Figure 4.11 Margin and costs per kg produced of
studied hot pepper farmers in Uganda per year
Source: Author’s field data.
Ugandan hot pepper farmers hardly use improved seed. The majority of the farmers use farmer-saved
seed and this is often sold to them by the exporters, who in turn source the seeds from rejects (fruits
not suitable for export). At farm level there is hardly any sorting, so they sell everything to the
exporters, who then manage the sorting and grading of the product for the export market. All the
rejects are prepared for the domestic market and are used for harvesting seeds for the next season.
The farmers are thus essentially buying back their own product, much of which is faulty. As a result,
the disease incidence among hot pepper crops is high and the fruits are reducing in size. Findings from
the field also revealed that some farmers intercropped hot peppers with tomatoes. Because both hot
peppers and tomatoes belong to the Solanaceae family, if they are not intercropped in moderation, the
pest incidence could increase as they are attacked by similar pests.
4.4.2.2 Traders and exporters
As it happens in other African countries, the role of the hot pepper traders in Uganda is often obscured
and hard to pinpoint. We consider two basic models:
• Large exporters with own land that often work with out-growers.
• Small-scale exporters with no land who rely on smallholders’ produce gathered through informal
trading relationships. This group of exporters is often referred to as ‘briefcase exporters’ and has an
opportunist business mentality.
Overall, no formal agreements with farmers are in place. Furthermore, exporters interviewed also
emphasised the lack of access to financing. Due to the current situation with the FCM and the lack of
sincere communication between exporters and farmers, there is a lack of trust between the parties. In
addition, the ‘briefcase exporters’ are opportunistic and if the export market prices are not good they
will not buy the farmers’ products.
A problem the exporters face is the lack of cargo space available, since fresh produce is only loaded
onto passenger airplanes. If the airplane is full, the cargo is offloaded and postponed to the next day’s
flight.
-
2,000,000
4,000,000
6,000,000
8,000,000
10,000,000
12,000,000
small large
Costs Margin
-
200
400
600
800
1,000
1,200
1,400
small large
Costs Margin
Wageningen Economic Research Report 2019-117 | 41
4.4.2.3 Markets
The European market is dominated by large supermarket retailers. However, there are also retailers
that are specialised in vegetables for the ethnic population.
About 60-90% of produce is sold through supermarkets, depending on the product and country.
Supermarkets have many requirements for suppliers in place. A minimum requirement to supply EU
retailers is a GlobalG.A.P. certificate. In Uganda there is no producer nor exporter that has
GlobalG.A.P. certification.
The ethnic market in Europe is informal and certification is not required. Many of the importers are
relatively small. They supply ethnic wholesale traders and grocery shops with an assortment for the
ethnic communities. In the United Kingdom and the Netherlands there are several markets that have
many specialised importers focusing on the ethnic market. In the United Kingdom the main FFV
wholesale markets are in Southall (Western International Market), Stratford (Spitalfield Market) and
Birmingham (Birmingham Wholesale Market). In the Netherlands the main wholesale market is in
Amsterdam (Food Centre), and it includes several traders specialised in the ethnic market. In these
markets, shopkeepers buy fresh produce every 3 or 4 days, although this varies largely depending on
the season and the final users’ needs.
The conventional market demands high-quality and ‘safe sourcing’. The main difference between the
two markets is the final consumer. Supermarket customers expect transparent information about the
sourcing and a high-quality product. To cater for these needs, supermarkets require suppliers’
adherence to stringent global standards that include certification of social and environmental
standards and/or GlobalG.A.P. The latter is the private sector standard most used by European
retailers. Although attaining GlobalG.A.P. is not a legal requirement nowadays, it is widely regarded as
the minimum standard for exporters to be able to supply to the main supermarket retailers in Europe.
Besides GlobalG.A.P., many supermarkets demand compliance with other more specific certifications.
Nevertheless, if an exporter can achieve GlobalG.A.P., then supermarket-specific standards are often
not a problem. One of the key facets of private sector standards is the ability to trace the history of a
product throughout the supply chain from field to the consumer.
The world production of chilies amounts to around 31m tonnes, which is cultivated on approximately
1.9m hectares of land (FAOSTAT). China is the world leader in chilli production, followed by Indonesia
and Ethiopia. However, these countries do not supply the European market. The bulk share of chilies is
produced by Asian countries for the regional Asian market.
The main competitors for Uganda on the EU market are India, the Dominican Republic, Ghana and
Kenya. They supply comparable types of hot chilies (Scotch Bonnet). India is a dominant exporter, but
export tends to fluctuate due to availability issues. The market peak is September to December. Their
most important export destination is the United Arab Emirates, where about 1.8 million Indians live.
Export to the EU is limited to the United Kingdom where ethnic market outlets are supplied. However,
an increasing number of chilies from India are being sold in the mainstream supermarket segment.
Ghana is another important competitor on the market from March to September. Freight from West
Africa to the UK is less expensive due to being on average two hours shorter flight time. As a result,
freights cost is about 30-40% more expensive in Uganda.
4.4.3 Most suitable areas for hot pepper production
The outcomes of the Global Detector are presented in the figure below. It shows that hot pepper
production can take place in basically all parts of the country. This is very much in line with the
current production areas.
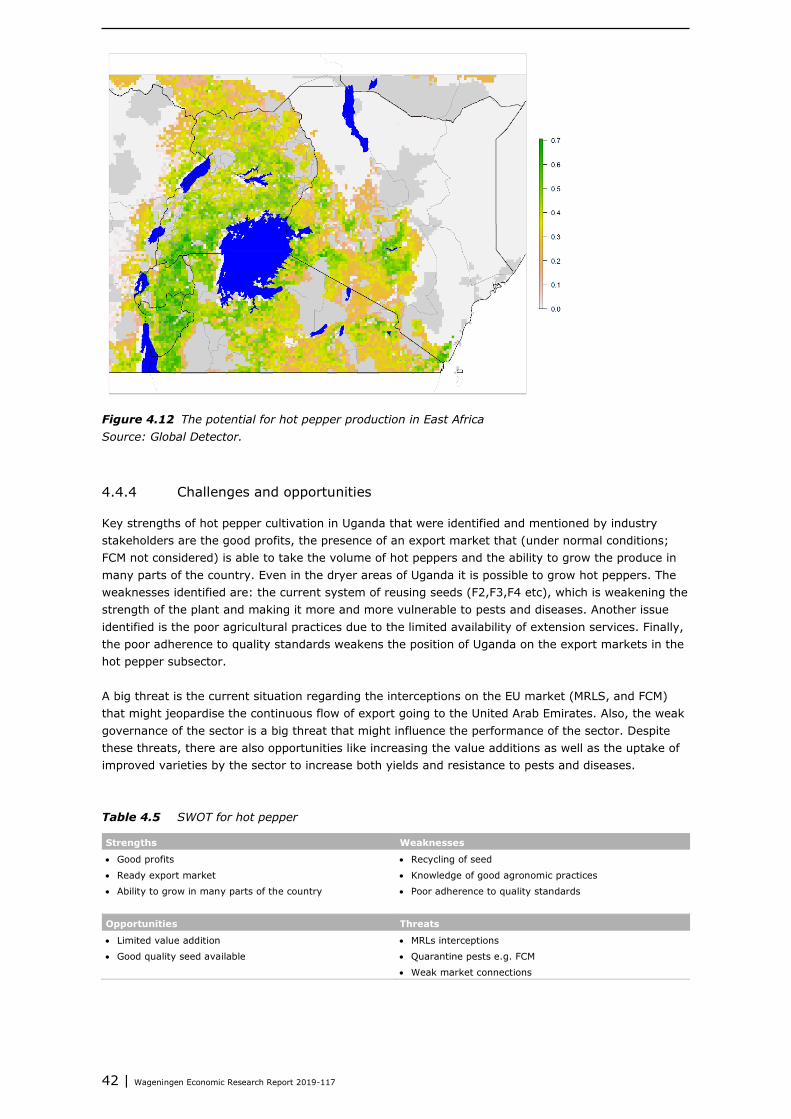
42 | Wageningen Economic Research Report 2019-117
Figure 4.12 The potential for hot pepper production in East Africa
Source: Global Detector.
4.4.4 Challenges and opportunities
Key strengths of hot pepper cultivation in Uganda that were identified and mentioned by industry
stakeholders are the good profits, the presence of an export market that (under normal conditions;
FCM not considered) is able to take the volume of hot peppers and the ability to grow the produce in
many parts of the country. Even in the dryer areas of Uganda it is possible to grow hot peppers. The
weaknesses identified are: the current system of reusing seeds (F2,F3,F4 etc), which is weakening the
strength of the plant and making it more and more vulnerable to pests and diseases. Another issue
identified is the poor agricultural practices due to the limited availability of extension services. Finally,
the poor adherence to quality standards weakens the position of Uganda on the export markets in the
hot pepper subsector.
A big threat is the current situation regarding the interceptions on the EU market (MRLS, and FCM)
that might jeopardise the continuous flow of export going to the United Arab Emirates. Also, the weak
governance of the sector is a big threat that might influence the performance of the sector. Despite
these threats, there are also opportunities like increasing the value additions as well as the uptake of
improved varieties by the sector to increase both yields and resistance to pests and diseases.
Table 4.5 SWOT for hot pepper
Strengths Weaknesses
• Good profits
• Ready export market
• Ability to grow in many parts of the country
• Recycling of seed
• Knowledge of good agronomic practices
• Poor adherence to quality standards
Opportunities Threats
• Limited value addition
• Good quality seed available
• MRLs interceptions
• Quarantine pests e.g. FCM
• Weak market connections

Wageningen Economic Research Report 2019-117 | 43
4.5 Pineapple
4.5.1 Main production areas
The main production districts for pineapple cultivation include;
• Central region: Kayunga, Luweero, Wakiso (Busi Island), Mubende;
• Eastern region: Serere;
• Western region: Kasese.
Pineapple production has consistently increased over the years. The majority of the pineapples
produced in Uganda are the Sweet Cayenne variety.
4.5.2 Value chain
Pineapple farmers mainly obtain suckers from their own gardens and most of the pineapples are sold
to middlemen who also do the harvesting. The figure below presents the pineapple value chain. The
majority is produced for the local market by numerous smallholder farmers. There is a small share
that is being exported, mainly to Kenya but also to some other countries in the Middle East and even
the EU. Processing is also done, often by exporters, in the form of dried fruit slices.
Figure 4.13 Pineapple value chain
4.5.2.1 Farmers
In Uganda, there are no large-scale pineapple growers at present – it is exclusively a smallholder crop. A
typical pineapple plot of one acre lasts for three years with three harvests. Between 20-30,000 suckers
are needed to plant one acre. Pineapples are often mixed with fruits like banana, if the land is owned.
The last harvest typically gives smaller fruits. Many of the pineapple producers are organic by default.
This implies that they hardly use any chemical inputs. There are not many diseases in pineapple
cultivation except brown rust-like patches called Endogenous Brown Spot (EDS). The major pests of
pineapple include scales, mealybugs and nematodes.

44 | Wageningen Economic Research Report 2019-117
We found that pineapple production can be very profitable and can enhance incomes among rural
households. However, pineapple farming in Uganda is linked with soil nutrient depletion. As a result,
farmers obtain low crop yields and sometimes experience crop failure, making it difficult for the
farmers to get sustainable incomes from farming. This is worsened by poor agronomic practices.
Furthermore, soil degradation is widespread in Uganda, mainly due to loss of soil nutrients from fields
with no or minimal replacement. Nutrient depletion in Uganda is estimated at 66kg ha per year (Zziwa
et al., 2017). Consequently, farmers are constantly searching for virgin land in order to expand
cultivation. Pineapples are often grown on land that was previously fallow or under forest cover due to
the fruit’s need for high fertility; pineapple cultivation thus has a serious environmental impact.
We also observed differences between Luweero and Serere: the prices in Luweero are generally lower
because the pineapples are produced in bulk. Many farmers in Luweero grow pineapples and all these
pineapples ripen at the same time, so the abundant supply explains the lower prices. In fact, some of
the farmers pointed this out as one of the reasons for high post-harvest losses: because everyone has
pineapples and there is no market, some pineapples rot or get damaged because they are not able to
sell them and also cannot consume them all. Serere District in Eastern Uganda has fewer growers and
consequently a limited supply, which might explain the higher prices. Also, the Luweero farmers sell to
middlemen who buy at lower prices, while the farmers in the Serere District sell directly to consumers,
who usually offer better prices than the middleman.
During our fieldwork we identified the average pineapple yield to be between 20,000 and 25,000 fruits
per acre per year, with an average sales price of UGX 300 to 900 per unit. We calculated a profit
margin of between 70 and 90%, see the figures below. The analysis of the LSMS also confirms this
profit margin; see Appendix 6 for more background information. One must bear in mind that pineapple
prices do fluctuate heavily, peaking around September, with prices per unit at farm going up to UGX
2,000-2,500.
Labour is an import factor in the production of pineapples and most is provided by family members. At
75% of total costs, however, hired labour also makes a significant contribution too. Family labour is
dominant for sensitive tasks such as acquisition of planting materials, while hired labour is mostly
used for labour-intensive and demanding activities such as land clearing, planting and weeding.
Figure 4.14 Margin and costs of studied
pineapple farmers in Uganda per acre per year
Source: Author’s field data.
Figure 4.15 Margin and costs per kg produced of
studied pineapple farmers in Uganda per year
Source: Author’s field data.
A study by Zziwa et al. (2017) shows that pineapple farmers obtain information mainly from fellow
farmers and farmer groups. The majority of farmers (57.8%) participate in trainings organised by
extension workers, buyers of processed pineapples, and farmer groups. Generally, pineapple farmers have
limited access to agricultural extension services at the grassroots level. Consequently, extension services
including information are provided though non-traditional sources including farmers’ associations,
research institutions and trading companies that buy farmers’ pineapples. Respondents indicated that it is
through these sources that they have been able to receive training on pineapple agronomic practices.
Even though the pineapple sector has been identified as a priority crop by the government, it has not
received any significant interest in the last decade in terms of research capacity, extensions and support.
-
2,000,000
4,000,000
6,000,000
8,000,000
10,000,000
12,000,000
14,000,000
16,000,000
Luwero Serere
Costs Margin
-
100
200
300
400
500
600
700
800
900
1,000
Luwero Serere
Costs Margin

Wageningen Economic Research Report 2019-117 | 45
4.5.2.2 Traders
For the domestic market the middlemen buy directly from farmers (see figure below). There are no
fixed contracts with farmers. The trader arranges transport – a full truck with about 2,000-3,000
pineapples can cost between UGX 450-500,000 for transportation to the market. The farmers
interviewed stated that if a middleman buys a pineapple at UGX 1,000 they will sell it at UGX 1,200 if
small and UGX 1,300 if bigger in size and then the final consumer buys the same pineapple at
UGX 2,000 if small and then UGX 2,500 shillings if bigger in size (see table below).
From our interviews it appears that some of the Ugandan middlemen who buy from farmers later sell
to Kenyan traders who come to Uganda.
For the export, there are some contracts in place but if the market is poor the contracts are often
breached to the disadvantage of the farmer. Exporters also double as processors.
Table 4.6 Pineapple prices in Uganda, 2019
Farm to wholesale wholesale to retail Retail to consumer
Large pineapple (price per unit) 800-1,000 UGX 1,300 UGX 2,000 UGX
Small pineapple (Price per unit) 700-900 UGX 1,200 UGX 2,500 UGX
Source: Author’s field data.
4.5.2.3 Markets
Imports of fresh pineapples into the European market have stabilised at around 900,000 tonnes in
recent years (CBI, 2019). The pineapple trade is dominated by the MD2 variety, which has now
replaced Smooth Cayenne pineapples as the preferred variety in every major market. Over 80% of all
European imports are MD2, but ripe Sweet Cayennes, with their superior flavour, get air-freighted to
the specialist and catering sectors. The Dutch Centre for the Promotion of Imports from developing
countries (CBI) advises that smaller exporters from developing countries distinguish themselves with
quality, price, and sustainability. The market is dominated by a few multinational companies: Dole
Food Company, Del Monte Foods, Fyffes and Chiquita.
Pineapples are judged mature when they have reached full size and a have nice colour. The products
for the local market get no pre-treatment prior to marketing. Those for export purposes are, however,
brushed before packing and are trimmed to leave a stock of one inch. Other post-harvest practices
among exporters are limited. In Uganda various important steps considered to be essential for
exporting pineapples are lacking (e.g. the waxing of the fruits). Fresh pineapples are classified
according to Size Codes A–H, with average weights (including the crown) ranging from 2,750 grams
(Size A) to 800 grams (Size H).
The climate and agronomic practices in Uganda favour larger sized fruits, which are regarded
unsuitable for export since the European markets prefer smaller sized fruits. For instance, Sweet
Cayennes do not ship well and normally grow bigger than the preferred size on the EU market.
However, the pineapples that can be exported are graded according to colour and size. The export
product is directly packed into cartons and transported by trucks or pickups. At the airport the
package is palletised. Produce destined for the local market is put on pick-ups without any form of
padding. All the loading and off-loading is done manually, and this can amount up to 3 times before
being loaded onto the aircraft.
A trader pays UGX 10,000 for a space at local urban markets like Nakesero, and more like 30,000 if he
comes with a truck. He can stay there from midnight to 9am the following morning, when part of the
market becomes a road. The trader sells to retailers that in turn sell to consumers. Grading for local
markets usually takes place at the retailer’s. Preferences vary: some clients prefer green pineapples
which are not so ripe, while others want them to be riper.
There is always a surplus in the market during peak harvest time, resulting in low prices. Farmers that
get to the market early can benefit from better prices.

46 | Wageningen Economic Research Report 2019-117
4.5.3 Most suitable areas for pineapple production
The outcomes of the Global Detector are presented in the figure below. It clearly shows that there are
many areas in Uganda where pineapple can be produced, the main ones being Central and West
Uganda. This corresponds with the current production areas.
Figure 4.16 The potential for pineapple production in East Africa
Source: Global Detector.
4.5.4 Challenges and opportunities
Industry stakeholders identified the key strengths of pineapple production as being the good taste and
the fact that the crop can easily be cultivated in many parts of the country. Weaknesses identified are
the poor agricultural practices due to the limited availability of extension services. Finally, the lack of
knowledge regarding market standards, which weakens Uganda’s position on the export markets. For
example, the fact that the Sweet Cayenne consistently produces large sized fruits that are too large
for the EU export market.
A serious threat is the pineapple farmers’ constant quest for new farm land, compounded by the limited
extension services and the weak support received by the government. Despite these threats there also
opportunities, like increasing the value additions and promoting the uptake of improved varieties by the
sector to increase yields, as well as boosting the resistance of the crop to pests and diseases.
Table 4.7 SWOT for pineapple
Strengths Weaknesses
• Sweet taste & flavour (Sweet Cayenne) in the regional
market
• Grown in many parts of the country
• Relatively easy agronomy
• Poor management practices
• Misuse of pesticides
• Ignorance of market requirements (variety less suitable
for export to EU)
• Absence of seed certification
• Limited research on pineapple
Opportunities Threats
• High demand for fresh pineapple in the domestic and
international market, is it the right variety?
• Available market for pineapple value added products
(pulp, juice, dried)
• Farmers keep on searching for new lands to use for
production
• Limited extension services
• Weak implementation of policy provisions on developing
pineapple value chains

Wageningen Economic Research Report 2019-117 | 47
4.6 Avocado
4.6.1 Main production areas
Production districts include;
• Northern region: Zombo, Arua, Gulu
• Western region: Ntungamo, Kabarole
• Eastern region: Mbale, Mayuge, Buikwe, Iganga
4.6.2 Value chain
The main players in the avocado value chain are the farmers, the rural assemblers, wholesalers and
retailers. The avocado marketing channels are similar to those presented for other fruits. Exporters
interviewed in the study mentioned that they obtained their avocados from middlemen. Small avocado
farmers interviewed were also selling to market vendors (retail market). As avocados are an important
fruit in any grocery store, it has the potential to be developed as a non-traditional export crop.
Figure 4.17 Avocado value chain
4.6.2.1 Farmers
There are only a few advanced large-scale farmers engaged in avocado cultivation, and they focus
their efforts on growing ‘Jumbo’ varieties (any variety whose fruit weighs more than 500gram). There
is hardly any Hass production yet; in the last five years they have planted a lot but the trees are not in
yet in full production. Largely due to the fruit being grown mainly at 1,400-1,600 metres above sea
level, actors in the avocado sector claim to have better production conditions and a longer season
compared to neighbouring countries.
Avocado is often intercropped with coffee, bananas and other fruit tree crops. In Uganda, avocado is
grown without much manure or fertiliser application, but most of the avocado trees do well, as the
soils are fertile by nature. Yields vary greatly according to cultivar, tree age, and weather conditions.
Production varies from 20-100 kg per tree for young trees and doubles for mature trees. Hass avocado
seedlings are in high demand now and are therefore expensive, at UGX 5,000.

48 | Wageningen Economic Research Report 2019-117
Yields are on average between 5 and 25 tonnes per acre. The average sales price will be around
UGX 800 per kg or between UGX 50 and 150 per fruit. There is a difference in price for the smaller
avocados that normally fetch a lower price and are sorted at the farm. For a smallholder producer
focusing on the domestic market, with no cash input requirements and who uses only family labour,
net revenue is calculated equal to the total revenue. A smallholder, therefore, can expect annual
earnings of almost 100%. The more intensive production of avocado, typically for the export market,
does use some inputs like fertilisers. The average calculated profit margins among the studied farmers
was nonetheless still 90% (see figure below). Our analysis of the LSMS confirms a positive profit
margin – see Appendix 6 for more background information.
Figure 4.18 Margin and costs of studied avocado
farmers in Uganda per acre
Source: Author’s field data.
Figure 4.19 Margin and costs per kg produced of
studied avocado farmers in Uganda
Source: Author’s field data.
4.6.2.2 Traders
The marketing of avocados for the domestic market is not given much attention with respect to the
post-harvest care of the fruits. At the retail market premises, the fruits are stored in wooden boxes,
and displayed on wooden tables for selling. The unsold ones are always covered with mats, and not
returned to the stock container. This prevents damage that may arise from storing and displaying. The
price range is usually UGX 333 to UGX 1,000 per unit. Traders and retailers in Kampala pay a
commission to the market of UGX 2,000 depending on the size of their market stall. Traders and
retailers buy during the night from farmers that bring their produce to the market, at prices that had
already been negotiated during the day by phone.
Table 4.8 Price of avocado in Uganda per unit, 2019
Farm to wholesale wholesale to retail Retail to consumer
Price per unit 50-100 UGX 150 UGX 250-350 UGX
Source: Author’s field data.
4.6.2.3 Markets
The EU import value of avocados almost tripled in the period between 2013 and 2017 (CBI, 2019).
This upward trend is driven by consumer demand for ready-to-eat and healthy food. It creates
opportunities for producers and exporters, especially for the Hass avocado variety, although
competition is increasing.
The green varieties are losing market share to Hass quickly. Green varieties are mostly sold loose or in
small nets, while Hass dominates the market for ready-to-eat avocados. Green varieties are still sold
because they have a different harvest period, but Western European countries mainly favour the taste
and ease of the ready-to-eat Hass variety.
Avocados are classified according to Size Codes 1 to 30, with a minimum weight of 123 grams (or for
Hass 80 grams). In Europe, the preferred sizes for Hass avocados range between size 16 and 20 (for
the Fuerte variety size 14 to 16). EU buyers prefer the weight and quality to be the same throughout
-
500,000
1,000,000
1,500,000
2,000,000
2,500,000
3,000,000
3,500,000
domestic export
Costs Margin
-
200
400
600
800
1,000
1,200
domestic export
Costs Margin

Wageningen Economic Research Report 2019-117 | 49
the year, and prefer the smaller ones, whereas consumers in Uganda like the bigger avocados. In
addition, the oil content of the avocados must also be aligned with the market requirements.
Stakeholders at the validation workshops mentioned that there is a growing market for
younger/immature avocados in the Middle East, as they are processed into drinks. They also
mentioned that the Jumbo avocado varieties exported to the Middle East were popular in the catering
industry that mainly used them to make salads.
4.6.3 Most suitable areas for avocado production
The outcomes of the Global Detector are presented in the figure below. It clearly shows that there are
many areas in Uganda where avocados can be produced, which corresponds with the current
production areas.
Figure 4.20 The potential for avocado production in East Africa. Source: Global Detector.
4.6.4 Challenges and opportunities
As local and international demand is high and there is potential for increased production, an
opportunity as regards the avocado is that it can been taken up as a priority fruit for development as a
non-traditional export crop. Seeing a future in avocado cultivation, in recent years many farmers have
been planting Hass varieties, which will be ready in a few years for harvest and export.
Table 4.9 SWOT
Strengths Weaknesses
• Availability of land & water for production
• Ready market (national & international)
• Limited availability of good quality planting materials
• Lack of technical knowledge among the growers
• Limited knowledge on existing varieties & their attributes
Opportunities Threats
• Potential for value addition
• Favourable weather & soils for production
• Development of varieties preferred in the market
• Pest and diseases
• Changing climatic conditions
• Changing consumer preferences

50 | Wageningen Economic Research Report 2019-117
4.7 Kenya as the benchmark
Various production parameters in Kenya (e.g. technology level, seasonality, cost of productions,
revenues, quality) serve as a comparison with Uganda’s situation. An expert on the Kenyan and
Ugandan horticulture sector reviewed the studied parameters, focussing on one season only.
Appendices 7 and 8 give an overview of the detailed crop budgets for Kenya.
4.7.1 Tomato
The high season of tomato production in Kenya is from August to October, and there is another short
window between April and June when there is good supply. June and July is the cold season, so supply
is limited, but there is still some supply. March to April is low season.
As presented in the table below, the estimated reliable yields by industry experts in Kenya and
Uganda is comparable. The farming systems are also the same. The majority of the tomato farmers in
Kenya also apply low-input farming, for example non-irrigated farming in combination with OPV
varieties. With improved irrigation (drip), tomato farmers are able to increase yields.
Table 4.10 Comparison yields between Uganda and Kenya tomato
OPV non irrigation Non irrigated hybrid Irrigation (drip)
Kenya per acre 6 tonnes 7 - 8 tonnes 15-18 tonnes
Uganda per acre 6 tonnes 8 tonnes 15 tonnes
Source: Authors.
The cost price of tomato production for irrigated farming in Uganda is much higher compared to
Kenya. This is mainly related to the fact that the irrigation in Kenya is centrally arranged and the
farmers only pay a small fee to the local irrigation associations. In Uganda farmers have to arrange
this themselves and are required to invest in pumps, diesel and pipes. An initial investment for
irrigation is between UGX 8 and 14m for the pump and pipes for one acre.
Table 4.11 Comparison cost price between Uganda and Kenya tomato
Season Costs per acre per season (UGX)
Uganda hybrid with irrigation Season 1
April - June
6,377,000
Season 2
October - January
7,242,000
Kenya with irrigation April - June 3,857,000
Source: Authors.
4.7.2 Onion
In Kenya, onion is one of the most important vegetable crops for the domestic market. It is also an
important source of income for smallholder farmers. They are grown in a wide range of agroecological
zones, ranging from sea level to the upper highland areas below 2,000m above sea level.
The main growing areas include the Central, Rift valley, Western and Eastern Provinces of Kenya (FAO
cropping calendar). Favourable conditions for onion production exist in Kenya and the majority of the
farmers produce with hybrid seeds. In Kenya there is onion production throughout the entire year,
however, the low seasons are March to April (the wet season) and June to July (the cold season).
In Kenya there is hardly any OPV onion production. Yields for a single season of hybrid onion
production at larger scale are higher in Kenya compared to Uganda.

Wageningen Economic Research Report 2019-117 | 51
Table 4.12 Yield comparison between Uganda and Kenya
OPV Hybrid variety
Kenya per acre Small 6 - 7 tonnes 9 - 10 tonnes
Large 10 tonnes 25-28 tonnes
Uganda per acre Small 2-3 tonnes -
Large 10 tonnes 20-25 tonnes
Source: Authors.
Cost of production is also comparable between Uganda and Kenya for one season. The costs of OPV
varieties are much lower per season compared to the hybrids. See table below: given the higher yields
of hybrid production, it appears that the farmers in Kenya are performing better.
Table 4.13 Comparison between Uganda and Kenya for the total cost (UGX) per acre for one season
Kenya hybrid Uganda hybrid Uganda OPV
Total cost per acre for one season
from December to February
2,387,000 2,828,000 1,612,000
Source: Authors.
4.7.3 Hot pepper
Hot pepper is mainly produced in the tropical areas near Mombasa, Kenya. It is irrigated and the
seeds are mainly OPV. Yields are comparable between Kenya and Uganda, at about three to four
tonnes per acre per season. An important cost driver in Uganda is labour, at 66%, while in Kenya, it is
only 35%. In Kenya there is also some level of irrigation for the hot pepper, constituting 20% of the
costs compared to Uganda, including additional labour.
Table 4.14 Comparison between Uganda and Kenya for the total cost per acre for one season
Uganda UGX Kenya UGX
Input 12,000 754,950
Other costs 1,549,867 1,279,820
Total costs 1,561,867 2,034,770
Source: Authors.
4.7.4 Pineapple
For pineapple on a single acre, a typical Kenyan farmer plants 4,000 to 4,500 suckers and will harvest
about 2,000 fruits per season. In Uganda it is common to plant more suckers – between 12,000 and
25,000 suckers per acre – which yields much more harvest. In Kenya pineapple production has two
harvests in a year and is harvested for three consecutive years. The high season is from October to
April. The harvest starts at the beginning of each dry season, however, during the colder season, a
limited harvest of pineapple is possible, especially from June to August. In Uganda the high season
has its peak around September. Appendix 8 gives an overview of the cost price for pineapples in
Kenya.
4.7.5 Avocado
Just like Uganda, Kenya also enjoys a year-round avocado yield for local varieties; the main harvests
last from April to July and October to December. Important avocado production areas are located in
Embu and Nakuru. According to our interviewed experts, avocado production in Embu is generally low
input, while the farmers in Nakuru use more inputs (e.g. fertilisers and chemicals). In Kenya there is

52 | Wageningen Economic Research Report 2019-117
already a large export sector of avocado producers focussing on shipping produce to the EU and the
Middle East.
The current cost price per acre for an orchard in Embu, Kenya is UGX 2m, while the cost of production
for Nakuru is almost UGX 3m per acre per season. Appendix 8 gives an overview of the cost price for
avocado in Kenya, which is much lower in Uganda. Many of the orchards have no costs at all, whereas
the more intensive orchards have costs of only UGX 50,000 to UGX 500,000 per acre per season.
Yields per acre depend largely on the tree density and age of the trees. Among the studied farms in
Uganda this was very diverse: from 10 to 200 trees per acre. In Uganda yields vary between one and
six tonnes per acre per year. In Kenya this is estimated at 300 fruits per tree per season, so with an
average tree density of 75, the orchard will generate 75,000 fruits after seven years (see table 4.15).
This equals 0.6 to 15 tonnes per year, depending on the tree age.
Table 4.15 Age of trees and estimated production by experts in Kenya
Age of trees Trees per acre Fruits per
tree/ year
Yield
acre per year
Annual yield
3 years 75 40 3 tonnes 0.6 tonnes
4 years 75 200 15 tonnes 3 tonnes
5 years 75 600 45 tonnes 9 tonnes
7 years 75 1,000 75 tonnes 15 tonnes
Source: Authors.

Wageningen Economic Research Report 2019-117 | 53
5 Conclusions
5.1 Conclusions
Current farming practices in Uganda are rather weak. Farmers must improve overall agronomic
practices, including sustainable pest control, water use, and efficient pre- and post-harvest practices.
It is also necessary to realize a higher added value by developing national and international markets
for fresh produce from Uganda. This requires training, as well as (private and public) investments for
advancing Uganda’s currently low-cost low-output vegetables and fruits sector.
The domestic and regional market is providing opportunities. The demand for fruits and vegetables
has increased in the last decade and is likely to further increase. The demand for Ugandan fresh
produce was observed to be increasing but the poor production methods prevent the sector from
increasing volumes enough to meet the demand. Also, the supermarket has become a well-established
market segment in Kampala and this can provide opportunities for the more advanced farmers in
terms of supply. A recent systematic review of contracts between the more advanced farmers and
supermarkets (e.g. Ton et al., 2018) showed that smallholders can benefit from contractual
arrangements that include services and inputs. In the most effective cases there was a price premium
for farmers as well.
Food safety risks are high in the market due to overuse of chemicals and poor post-harvest practices.
Sustainable pest control at farm level and more awareness among traders at the markets to reduce
the risks of contamination of fresh produce are required.
Reaching the export market is a big challenge for the fruit and vegetable sector. The export sector
keeps on failing to comply with current legal market norms and standards requirements. The Uganda
export sector has a poor reputation in the EU market; supplying the conventional EU retail market is
not feasible due to a lack of tracking and tracing, certification, consistent volumes and a lack of
professionalism amongst many exporters. Additional challenges include the quality of inputs and
regulations that safeguard the quality of inputs, phytosanitary protocols during production and
transport, and limited market understanding – specifically on buyer requirements in export markets.
The government of Uganda has failed to support the sector in a conducive and coherent way. The
actors in the sector therefore feel neglected. Supportive incentive policies and frameworks for
consistent policy implementation are missing and only limited data are available on the horticulture
sector.
5.2 Competitiveness, investment and trade opportunities
We defined competitiveness earlier as the medium to long-term ability of a firm or significant part of
the firms in an industry to increase productivity and/or lower costs in a sustainable way, and deliver
goods and services at the time, place, form, and quality sought by the targeted customer segment(s)
at prices as good as or lower than those of other potential suppliers, whilst earning a reasonable profit
and paying at least the opportunity costs of resources employed. Profitability in this definition is
therefore an important concept.
Vegetable and fruit farmers in Uganda can make a reasonable profit. The vegetable farmers in this
study obtain a calculated average profit margin of 50% to 80%. The studied fruit farmers have higher
profit margins due to lower input needed (see figures 5.1 and 5.2 below), assuming that market prices
remain average, there is adequate pest and disease control and there is no extreme drought or
rainfall. For many crops Uganda is performing equal to Kenya in terms of costs and yields.
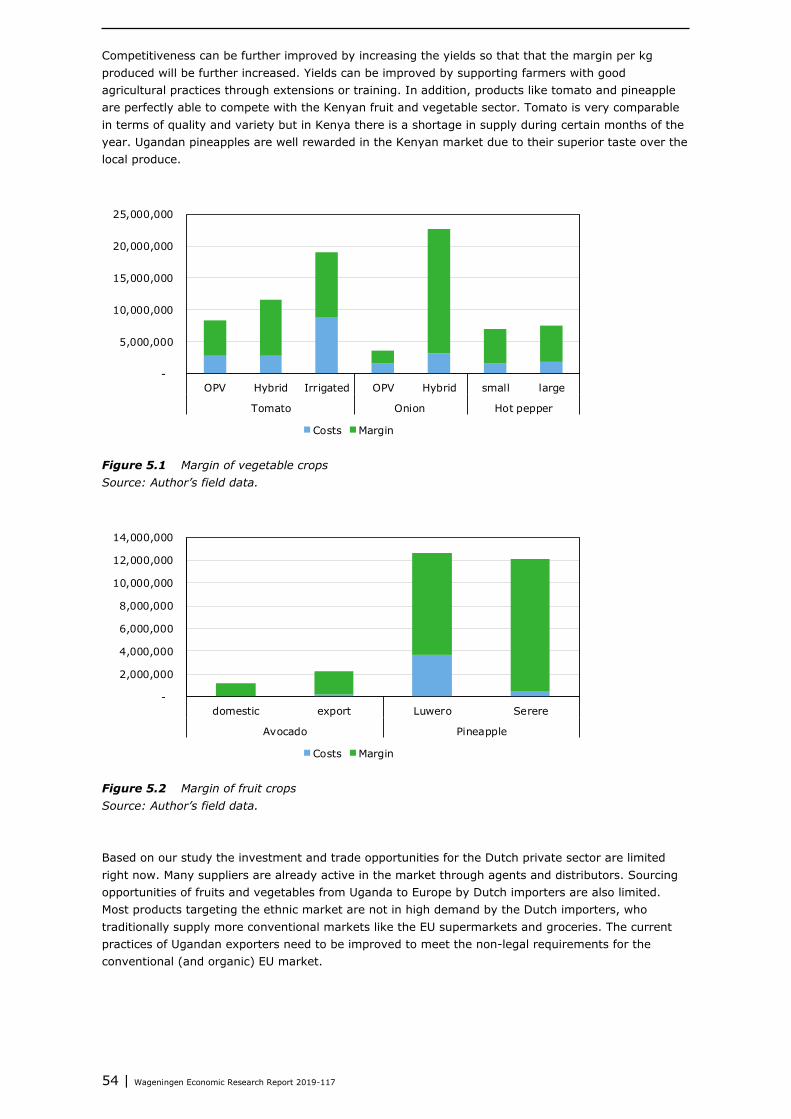
54 | Wageningen Economic Research Report 2019-117
Competitiveness can be further improved by increasing the yields so that that the margin per kg
produced will be further increased. Yields can be improved by supporting farmers with good
agricultural practices through extensions or training. In addition, products like tomato and pineapple
are perfectly able to compete with the Kenyan fruit and vegetable sector. Tomato is very comparable
in terms of quality and variety but in Kenya there is a shortage in supply during certain months of the
year. Ugandan pineapples are well rewarded in the Kenyan market due to their superior taste over the
local produce.
Figure 5.1 Margin of vegetable crops
Source: Author’s field data.
Figure 5.2 Margin of fruit crops
Source: Author’s field data.
Based on our study the investment and trade opportunities for the Dutch private sector are limited
right now. Many suppliers are already active in the market through agents and distributors. Sourcing
opportunities of fruits and vegetables from Uganda to Europe by Dutch importers are also limited.
Most products targeting the ethnic market are not in high demand by the Dutch importers, who
traditionally supply more conventional markets like the EU supermarkets and groceries. The current
practices of Ugandan exporters need to be improved to meet the non-legal requirements for the
conventional (and organic) EU market.
-
5,000,000
10,000,000
15,000,000
20,000,000
25,000,000
OPV Hybrid Irrigated OPV Hybrid small large
Tomato Onion Hot pepper
Costs Margin
-
2,000,000
4,000,000
6,000,000
8,000,000
10,000,000
12,000,000
14,000,000
domestic export Luwero Serere
Avocado Pineapple
Costs Margin

Wageningen Economic Research Report 2019-117 | 55
5.3 Recommendations
For the recommendations we focus on different levels of the fruits and vegetables sector, namely the
farm, the value chain and the enabling environment. At the farm and value chain level we focus on the
five case studies. The enabling environment can be an important socio-economic driver and therefore
we address this for the entire food system because there are many overarching recommendations.
See the figure below for a graphic representation.
The theory of the most limiting factor is often applied for identifying those deciding elements in a
sector that blocks further development (de Wit, 1992). We have therefore identified this factor for the
farm and value chain levels, and if it is adequately addressed, we expect that further promising
development opportunities will arise.
Figure 5.3 Different levels of suggested recommendations
5.3.1 Farm level
Below we have addressed the most limiting factor and related recommendations at farm level for the
different case study crops:
• Tomato is a crop that requires key inputs like seeds, fertilisers, fungicides and pesticides. Improving
the availability of these products in the market and their accessibility by farmers is essential for
realizing yield increase.
• Onion farmers should get better access to hybrid seeds and sensitization on crop rotation to
overcome challenges related to soil-borne pests and diseases and to increase their yield.
• Low input use among pineapple farmers should be addressed. Currently, pineapple farmers keep on
searching for and clearing large portions of virgin lands for their production. This practice is
regarded as very unsustainable and is not needed. If farmers are able to use efficient fertilisers and
apply crop residue management practices they can continue farming on the same plots.
• The most limiting factor for avocado farmers is that they produce the wrong variety for the export
market. The popular variety in the export market is Hass due to favourable features (like oil, size)
but this variety is not yet produced in large numbers in Uganda and its seedlings are not widely
available. It would be a great opportunity if farmers can get access to this variety.
• Good quality seed is paramount in hot pepper growing. However, many hot pepper growers in
Uganda use diseased seeds that have been recycled on the farm for decades and realise high crop
Farm level
•Onion, tomato, hot pepper
•Pineapple and avocado
Value chain level
•Onion, tomato, hot pepper
•Pineapple and avocado
Enabling environment
•All crops
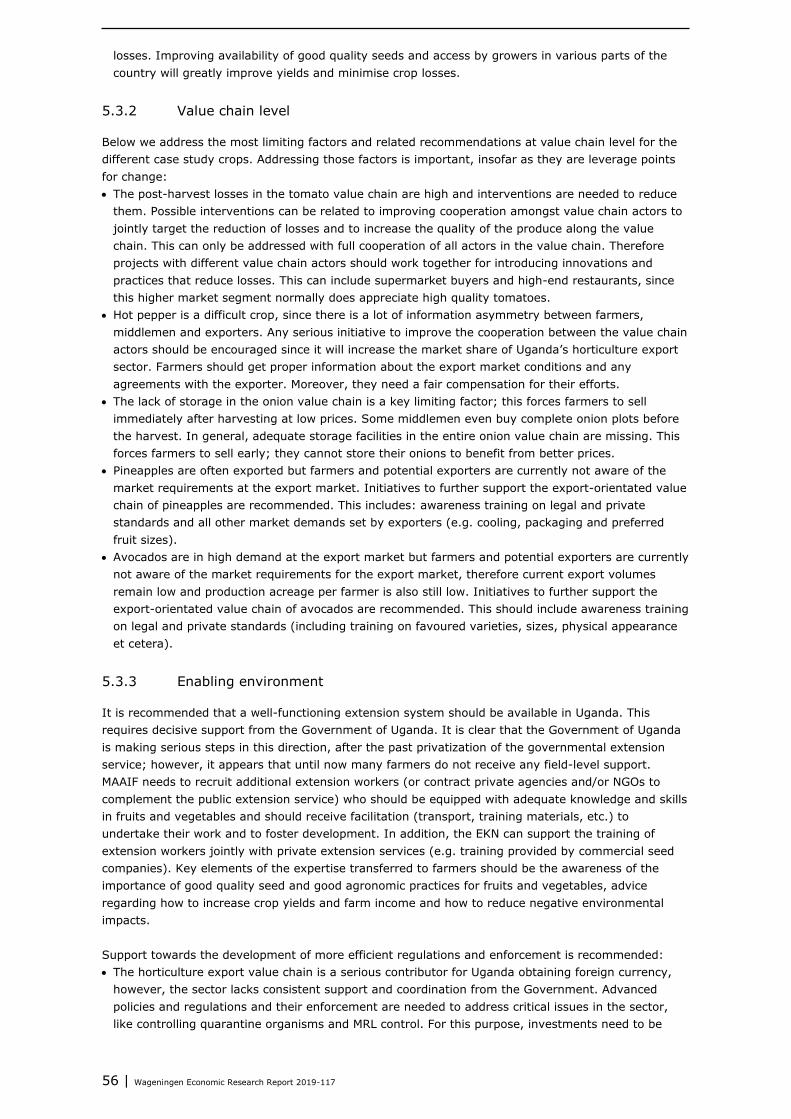
56 | Wageningen Economic Research Report 2019-117
losses. Improving availability of good quality seeds and access by growers in various parts of the
country will greatly improve yields and minimise crop losses.
5.3.2 Value chain level
Below we address the most limiting factors and related recommendations at value chain level for the
different case study crops. Addressing those factors is important, insofar as they are leverage points
for change:
• The post-harvest losses in the tomato value chain are high and interventions are needed to reduce
them. Possible interventions can be related to improving cooperation amongst value chain actors to
jointly target the reduction of losses and to increase the quality of the produce along the value
chain. This can only be addressed with full cooperation of all actors in the value chain. Therefore
projects with different value chain actors should work together for introducing innovations and
practices that reduce losses. This can include supermarket buyers and high-end restaurants, since
this higher market segment normally does appreciate high quality tomatoes.
• Hot pepper is a difficult crop, since there is a lot of information asymmetry between farmers,
middlemen and exporters. Any serious initiative to improve the cooperation between the value chain
actors should be encouraged since it will increase the market share of Uganda’s horticulture export
sector. Farmers should get proper information about the export market conditions and any
agreements with the exporter. Moreover, they need a fair compensation for their efforts.
• The lack of storage in the onion value chain is a key limiting factor; this forces farmers to sell
immediately after harvesting at low prices. Some middlemen even buy complete onion plots before
the harvest. In general, adequate storage facilities in the entire onion value chain are missing. This
forces farmers to sell early; they cannot store their onions to benefit from better prices.
• Pineapples are often exported but farmers and potential exporters are currently not aware of the
market requirements at the export market. Initiatives to further support the export-orientated value
chain of pineapples are recommended. This includes: awareness training on legal and private
standards and all other market demands set by exporters (e.g. cooling, packaging and preferred
fruit sizes).
• Avocados are in high demand at the export market but farmers and potential exporters are currently
not aware of the market requirements for the export market, therefore current export volumes
remain low and production acreage per farmer is also still low. Initiatives to further support the
export-orientated value chain of avocados are recommended. This should include awareness training
on legal and private standards (including training on favoured varieties, sizes, physical appearance
et cetera).
5.3.3 Enabling environment
It is recommended that a well-functioning extension system should be available in Uganda. This
requires decisive support from the Government of Uganda. It is clear that the Government of Uganda
is making serious steps in this direction, after the past privatization of the governmental extension
service; however, it appears that until now many farmers do not receive any field-level support.
MAAIF needs to recruit additional extension workers (or contract private agencies and/or NGOs to
complement the public extension service) who should be equipped with adequate knowledge and skills
in fruits and vegetables and should receive facilitation (transport, training materials, etc.) to
undertake their work and to foster development. In addition, the EKN can support the training of
extension workers jointly with private extension services (e.g. training provided by commercial seed
companies). Key elements of the expertise transferred to farmers should be the awareness of the
importance of good quality seed and good agronomic practices for fruits and vegetables, advice
regarding how to increase crop yields and farm income and how to reduce negative environmental
impacts.
Support towards the development of more efficient regulations and enforcement is recommended:
• The horticulture export value chain is a serious contributor for Uganda obtaining foreign currency,
however, the sector lacks consistent support and coordination from the Government. Advanced
policies and regulations and their enforcement are needed to address critical issues in the sector,
like controlling quarantine organisms and MRL control. For this purpose, investments need to be
Wageningen Economic Research Report 2019-117 | 57
made in hardware (laboratories) and manpower (more horticulture inspectors). The current export
inspections and procedures need to be improved to align with international standards. Market
development should receive attention, which includes the production of the right varieties at the
right moment, the use of the right packaging material, development and sharing of market
information for both domestic and foreign markets.
• Climate change is likely to have a serious impact on the fruit and vegetable sector. Recent studies
show that farmers need to adopt climate-smart technologies, including irrigation and water
harvesting.
• The sales of agrochemicals and seeds should be done by registered agro-input dealers by ensuring
that only licensed agro-input dealers sell authentic agrochemicals and that agro-input dealers can
sell seed whose quality has been certified by MAAIF (e.g. ban counterfeits). Also it is important to
keep enabling importers of quality foreign seeds by aligning the import regulations with international
standards.
• Support healthy food and also safe food for the Ugandan consumers, so that overuse of chemicals
and poor harvest and post-harvest practices will be limited. Sustainable pest control at farm level
and more awareness among traders at markets to reduce contamination risk of fresh produce is
therefore essential. This requires the support to sector-wide multi-stakeholder platforms of key
stakeholders and the development of an integrated National Food Policy addressing food safety
issues. Consumer demand for safe food is likely to be an important socio-economic driver for
systemic change in the horticulture sector and should be addressed accordingly.

58 | Wageningen Economic Research Report 2019-117
References and websites
ABA (2018). POSTHARVEST LOSS ASSESSMENT O TOMATOES IN RWANDA. FEED THE FUTURE
INNOVATION LAB FOR HORTICULTURE for USAID.
ADC IDEA (2003). Sixteen Semi-Annual Progress Report. USAID
de Wit, C.T. (1992). Resource use efficiency in agriculture. Agricultural Systems 1-3: 125-151
Duku, C. A. de Groot, M. Budding-Polo, T. Demissie (2019). Sesame Uganda: Climate change risks
and opportunities. CRAFT
ESSD (2005). Uganda Horti-floriculture Sector Development Study. Prepared for ESSD and PSD
Departments Africa Region – The World Bank In the framework of the PRIVATE SECTOR
COMPETITIVENESS II PROJECT.
Hennen, W., A. Daane and K. van Duijvendijk (2016). Global-Detector; GIS- and Knowledge-based
tool for a global detection of the potential for production, supply and demand. In: L. Ragia,
J. G. Rocha and R. Laurini (Eds.), Proceedings of the 3rd International Conference on Geographical
Information Systems Theory, Applications and Management; Porto, Portugal, 27-28 April 2017.
Freebairn, J. (1987). Implications of Wages and Industrial Policies on the Competitiveness of
Agricultural Export Industries. Review of Marketing and Agricultural Economics, vol. 55, issue 01.
https://EconPapers.repec.org/RePEc:ags:remaae:12315
FRR (2018). Innovation Opportunities in Organic Pineapple Production in Uganda. FRR Vol 2 No 17
Kilimo Trust (2012). Development of Inclusive Markets in Agriculture and Trade (DIMAT): The Nature
and Markets of Bean Value Chains in Uganda.
Kagezi, G.H., Kangire, A., Tushemereirwe, W., Bagamba, F., Kikulwe, E., Muhangi, J., Gold, C. &
Ragama, P. (2007). Banana Bacterial Wilt Incidence in Uganda. African Crop Science Journal
(ISSN: 1021-9730) Vol. 14.
KjÆr, A.M. (2015). Political Settlements and Productive Sector Policies: Understanding Sector
Differences in Uganda. World Development, Elsevier, vol. 68(C), pages 230-241.
MAAIF (2019). DRAFT FRUITS AND VEGETABLES FRAMEWORK IMPLEMENTATION PLAN. MAAIF.
Nyapendi R., Best R., Ferris S., Jagwe J. (2010). Identifying Market Opportunities for Urban and Peri-
Urban Farmers in Kampala. In: Prain G., Lee-Smith D., Karanja N. (eds) African Urban Harvest.
Springer, New York, NY
Porter, M.E. (1990). The competitive advantage of nations. Harvard Business Review.
UBPS (2014). National Population and Housing Census 2014, UNCTAD Stat database.
http://unctadstat.unctad.org
UIA (2015) BRIEF GUIDE TO INVESTING IN UGANDA: Fruits of investment. Uganda Investment
Authority
Wiegratz, J. (2010). Fake capitalism? The dynamics of neoliberal moral restructuring and pseudo-
development: the case of Uganda, Review of African Political Economy, 37:124, 123-137
RSA (2017). Mapping of distributors of fruits and vegetables in Kenya
SARC (2016). The Agri-Business scan for Uganda. Strategic Advisory and Research Company.
Kampala.
Sharples, J. and N. Milham (1990). Longrun competitiveness of Australian agriculture. Washington, DC
(1301 New York Ave., NW, Washington 20005-4788): U.S. Dept. of Agriculture, Economic
Research Service.
Sonko, R. Njue, E. Ssebuliba, J. and De Jager, A. (2005). The horticultural sector in Uganda. ISHS.
Ton, G. W. Vellema, S. Desiere, S. Weituschat, M. D’Haese (2018). Contract farming for improving
smallholder incomes: what can we learn from effectiveness studies? World Dev., 104 46-64
FSOU (2019). Uganda Food Security Outlook. FEWS NET
https://reliefweb.int/sites/reliefweb.int/files/resources/Uganda_FSOU_04_2019_Final.pdf
Zziwa, A., K. R. Kyeyune, K. Allan, K. Nicholas, M. G. John, and K. Florence (2017). Socioeconomic
characterization and the agronomic practices that affect the use of pineapple waste to enhance soil
fertility in Kayunga District, Uganda. Agricultural Engineering International: CIGR Journal, 19(2):
12–21.
Wageningen Economic Research Report 2019-117 | 59
Stakeholders interviewed
Enabling and supporting environment:
• MAAIF Crop production Commissioner Mr Alex Lwakuba
• SNV Mr Appolo Muyanja
• USAID Dr. Simon Byabagambi
• MAAIF Crop inspection Commissioner Mr Paul Mwambu
• MTIC Commissioner External Trade Mr. Emmanuel Mutahunga
• UNFFE Farmers Federation Mr. Humphrey Mutaasa
• Hortexa Mr. David Lule
• UEPB Mr. Sam Karuhanga
• UHEPA & KK Foods Dr. James Kanyije
• Solidaridad Mr. Julius Ssemyalo
• Uganda Fruit & Vegetables Exporters and Producers Association Mr. Micheal Owino, Mr Henry Kasoma
• Integrated Seed Sector Development Plus Program Mr. Patrick Oyee (Chief of Party)
Traders, forwarders and input suppliers
• East Africa Seed Company Mr Reddy
• Sulma Group Mr Godfrey Bogere
• House of Seeds Ms Anja de Feijter
• Holland Greentech Ms Victoria Nakyagaba & Mr Maarten Hermus
• Kuehne & Nagel Freight Forwarder Ms Inge Wagner
Farmers
• Avocado farmer 1 export market David Lule
• Avocado farmer 2 domestic market Asuman Nkolo
• Avocado farmer 3 export market Zakayo Mukalazi
• Avocado farmer 4 domestic market Ali Lutakome
• Avocado farmer 5 export market Cyprian Sekubulwa
• Hot pepper farmer 1 Rahma Nabatanzi
• Hot pepper farmer 2 Pauline Nabbumba
• Hot pepper farmer 3 Rehema Nakimera
• Hot pepper farmer 4 Mohammed Ssentongo
• Hot pepper farmer 5 Ismail Tomusange
• Hot pepper farmer Mr Thomas Nyombi
• Tomato farmer Mrs Hellen and Mr Duncan Mwesigwa
• Tomato farmer 1 improved seeds Joseph Kasule
• Tomato farmer 2 OPV George William Semusu
• Tomato farmer 3 OPV & improved variety Ismail Kizimula
• Tomato farmer 4 OPV Vincent Lubega
• Tomato farmer 5 improved variety Najib Kitaka
• Tomato farmer 6 improved variety Michael Kawalya
• Tomato farmer 7 improved variety Ramadhan Sebuliba
• Tomato farmer 8 improved variety Yvonne Asiimwe
• Avocado farmer6 larger export in Luweero District Godfrey Bogere from Sulma Foods
• Pineapple farmer Mr Lawrence Batte
• Pineapple organic farmer1 in Luweero District John Sekitoleko
• Pineapple organic farmer2 in Luweero District Godfrey Segawa
• Pineapple organic farmer3 in Luweero District Mary Namirembe
• Pineapple conventional farmer4 in Serere District Emmanuel Oluka
• Pineapple conventional farmer5 in Serere District Julius Osaa
• Onion farmer OPV1 in Bulambuli District Michael Gimwali
• Onion farmer OPV2 in Bulambuli District James Manana

60 | Wageningen Economic Research Report 2019-117
• Onion farmer hybrid3 in Bulambuli District Oluba Balunaba
• Onion farmer hybrid4 in Bulambuli District Antonina Namabumbi
• Onion farmer5 OPV western region in Kabarole District Moses Kwezi
• Onion farmer6 OPV western region in Kabarole District Robinson Tumuhimbise
• Onion farmer7 hybrid western region in Kabarole District Kate Basemera
• Onion farmer8 hybrid western region in Bunyangabu District Vincent Nyakoojo
European market
• Fruit Consultancy Europe Piet Schotel, director
• Natures Pride exotic fruit and vegetable import Bart Quartel

Wageningen Economic Research Report 2019-117 | 61
Export value of fruits and
vegetables from Uganda
Fruit
2001 2002 2003 2004 2005 2006 2007 2008 2009 2010 2011 2012 2013 2014 2015 2016 2017
Fresh or dried mangoes 12 4 0 12 5 64 51 49 64 1313 2521 10112
Fresh or dried pineapples 42 27 42 323 467 1305 3409 2426 1981 1746 2299 522 815 671 1012 2481 3470
Fresh or dried avocados 3 3 17 52 2 6 6 4 60 122 128 191
Citrus fruit, fresh or dried 6 1 8 16 13 7 298 99 206 311 594 3758 3139 13582
Melons, incl. watermelons,
and papaws (papayas), fresh
3 5 25 339 1602 6223 3096 1523 1951 1328 668 264 446 183 1114 1738 5299
Bananas, incl. plantains, fresh
or dried
1336 1560 1644 1751 2199 521 1185 409 813 461 637 270 632 25522 4647 2807 2501
Fresh strawberries,
raspberries, blackberries,
back, white or red currants,
gooseberries and ...
336 503 297 369 440 576 935 748 204 106 257 153 55 16 115 72 995
Apples, pears and quinces,
fresh
1 1 18 8 7 98 65 232 264 597 801 522
Coconuts, Brazil nuts and
cashew nuts, fresh or dried,
whether or not shelled or
peeled
39 93 14 114 1336 48 1 45 0 264 5 48 34
Dried apricots, prunes,
apples, peaches, pears,
papaws “papayas”, tamarinds
and other edible ...
24 72 35 74 137 55 36 2 12 13 146 69 44 95 85 84 11
Other nuts, fresh or dried,
whether or not shelled or
peeled (excluding coconuts,
Brazil nuts ...
49 3 25 91 99 29 1 22 11 12 23 72 97 4 0
Grapes, fresh or dried 8 28 2
Apricots, cherries, peaches
incl. nectarines, plums and
sloes, fresh
1 7 5
Fruit and nuts, uncooked or
cooked by steaming or boiling
in water, frozen, whether or
not ...
20 0 13 22 0 0 12 6 2 1
Fruit and nuts, provisionally
preserved, e.g. by sulphur
dioxide gas, in brine, in
sulphur ...
8 6 4 3 4 0 3 1 7 81 9
Peel of citrus fruit or melons,
incl. watermelons, fresh,
frozen, dried or provisionally
preserved ...
0 9 1 7 5
Source: Comtrade.

62 | Wageningen Economic Research Report 2019-117
Vegetables
2001 2002 2003 2004 2005 2006 2007 2008 2009 2010 2011 2012 2013 2014 2015 2016 2017
Dried leguminous vegetables,
shelled, whether or not
skinned or split
6465 9734 16629 23361 27110 26746 20243 34042 47972 24188 31698 28845 38092 39813 153526 214144 266794
Leguminous vegetables,
shelled or unshelled, fresh or
chilled
264 1005 978 273 845 387 910 637 611 1835 4785 1471 5314 1902 3193 6337 39952
Roots and tubers of manioc,
arrowroot, salep, Jerusalem
artichokes, sweet potatoes
and similar ...
27 67 10 97 128 91 20541 9159 898 11416 5821 445 8942 5961 12729 14317 16950
Tomatoes, fresh or chilled 1 43 6 2 14 5 23 20 14 1351 3215 5852 15862
Potatoes, fresh or chilled 1 8 1 8 2 51 25 74 2 14 98 190 867 9892 15803 13564
Vegetables, uncooked or
cooked by steaming or boiling
in water, frozen
527 2309 2846 3709 1323 2980 1928 3076 2298 2112 1016 1807 5601 6577 6583 6859 7069
Other vegetables, fresh or
chilled (excluding potatoes,
tomatoes, alliaceous
vegetables, edible ...
3 8 428 441 562 260 480 983 983 488 1347 2593 1789 1025 1346 724 1546
Onions, shallots, garlic, leeks
and other alliaceous
vegetables, fresh or chilled
1 142 29 11 53 1 3 125 52 92 104 61 985 1407 545 726
Lettuce “Lactuca sativa” and
chicory “Cichorium spp.”,
fresh or chilled
1 1 11 0 4 1 283 263 168 110
Dried vegetables, whole, cut,
sliced, broken or in powder,
but not further prepared
89 144 31 107 3 9 1 1 1 4 42 35 51
Vegetables provisionally
preserved, e.g. by sulphur
dioxide gas, in brine, in
sulphur water ...
174 2 18 4 1 0 3 2 9 17 3 0 19 46
Cabbages, cauliflowers,
kohlrabi, kale and similar
edible brassicas, fresh or
chilled
10 25 2 2 0 1 47 26 47 7
Carrots, turnips, salad
beetroot, salsify, celeriac,
radishes and similar edible
roots, fresh ...
0 1 1
Cucumbers and gherkins,
fresh or chilled
1 2 4 1
Source: Comtrade.

Wageningen Economic Research Report 2019-117 | 63
List of stakeholders
participating in validation
workshops
Name Designation Organisation
Workshop 1
17/7
Dr. Gabriel Ddamulira Head, Horticulture Program National Crops Resources Research
Institute
Dr. Idd Ramathan Vegetable breeder National Crops Resources Research
Institute
Dr. Robinah Ssonko Re. Lecturer Makarare University
Mr. Jackson Onyinge Agronomist Brac Seeds
Mr. John Ssenkayi Vegetable Agronomist ISSD Plus
Mr. David Kayemba Vegetable Agronomist ISSD Plus
Ms. Victoria Nakyagaba Business Developer Holland Green Tech
Ms. Anja de Feijter Chief Executive Officer House of Seeds
Ms. Sylvia Kyeyune General Manager Simlaw Seeds
Mr. Denis Ochan Head of Procurement for Fresh
Supplies
Shoprite Supermarket
Ms. Jane Nalunga Head of Programmes National Organic Agriculture Movement
of Uganda
Mr. Arnold Mbowa Project Officer, Partnership for Africa
Seed Technology Transfer Activity
AATF
Mr. Emmanuel Adira Project Officer House of Seeds
Mr. Ronald Mwisaka Operations Manager Cycas International
MS. Sandra Kamenya Horticulture Lecturer Uganda Christian University
Mr. Paul Sigombe Managing Director REAL IPM
Florence Nakitto Coordinator HortExA
Dr. James Ssemwanga Managing Director TSC’s pack house
MS. Esther Nekambi Acting Executive Director Uganda Flower Exporters’ Association
Mr. Cherop Joel ZAK Managing Director ARII
Mr. Frank Namudoyi Executive Director UFVEPA
Mr. Joshua Mwanguhya Project Coordinator East West Seed International
Mr. Philip Musoke Asst. Manager Production Soroti Fruits Ltd
Mr. Kagaba Muhumuza Treasurer UFPFA
Workshop 2
19/7
Mr. Edmund Bishaka Principal Agricultural Officer Department of Crop Production, Ministry
of Agriculture, Animal Industry and
Fisheries
Mr. Gilbert Sebutare Inspector Department of Crop Inspection and
Certification, Ministry of Agriculture,
Animal Industry and Fisheries
Mr. Steven Wabusanyi Senior Commercial Officer Department of External Trade, Ministry
of Trade, Industry and Cooperatives
Mr. Anno Galema Food security officer and private
sector development
EKN
Mr. Josephat Byaruhanga Food security and agribusiness officer EKN
Mr. Sam Karuhanga Export Marketing Executive Uganda Export Promotion Board
Mr. Apollo Muyanja Mbazzira Agriculture Advisor SNV
Mr. Ysakor Haile Selassie Country Director Agriterra
Mr. Julius Ssemyalo Country Project Manager Solidaridad
Ms. Sheila Mugyenzi Director, Investment Promotion Uganda Investment Authority
Mr. Chris Ibyisintabyo Executive Director Uganda National Agroinput Dealers’
Association
Mr. David Slane Chief of Party IFDC Uganda
Mrs. Cate Adilu Vegetables program ISSD ISSD
Mr. Patrick Oyee Chief of Party ISSD
Mr. Rinus Van Klinken Project Manager SNV
Mr. Michael Kirya Manager Agribusiness KCCA
Mr. John Senkayi Veg. Agronomist ISSDPlus
Ms. Darlene Nagitta Production Manager Gittands Agro Ltd
Mr. Peter Sseruwagi CEO Gittands Agro Ltd
Ms. Racheal Nabbira Finance &Admin SOLIDARIDAD
Mr. David Kayemba Veg. Agronomist ISSD Plus

64 | Wageningen Economic Research Report 2019-117
Cost benefit data for studied
crops per year Uganda
Tomato Onion Hot pepper
OPV n=3
(2 season)
Hybrid n=3
(2 season)
Irrigated n=3
(4 season)
OPV n=4
(seasons)
Hybrid =n4
(2 seasons)
small n=3
(1 season)
Large n=2
(1 season)
Seeds 53,000 187,895 606,762 280,000 758,933 12,000 -
Fertilisers 227,500 251,368 457,143 258,211 1,186,222 40,000 84,444
Pesticides 29,500 243,579 306,667 37,895 23,844 60,000 53,333
Fungicides 79,500 253,474 314,286 60,000 143,333 - -
Inputs
other
758,000 420,842 2,560,000 12,000 206,151 9,600 8,889
Durables 54,313 69,484 812,483 10,711 16,615 376,000 13,889
Fuel - - 549,333 - - - -
Labour 903,500 874,526 2,499,048 826,211 151,778 1,038,667 1,654,328
Transport 596,000 417,474 839,048 - 178,133 25,600 21,333
Land - - - 52,632 13,333 - 22,222
Other costs 87,000 42,105 - 72,632 533,333 - -
Total costs 2,788,313 2,760,747 8,944,769 1,610,289 3,211,677 1,561,867 1,858,439
Revenue 8,330,000 11,666,772 19,042,570 3,660,537 22,702,889 7,030,520 7,470,329
Margin 5,541,688 8,906,024 10,097,801 2,050,247 19,491,212 5,468,653 5,611,889
Avocado
Pineapple
Domestic n=2
(2 season)
Export n=4
(2 season)
Luweero n=3
3 years
Serere n=1
3 years
Seeds - - - 200,000
Fertilisers - 16,333 - -
Pesticides - 10,000 - -
Fungicides - 2,400 - -
Inputs
other
- - - -
Durables - 27,880 - 7,000
Fuel - - -
Labour - 94,733 2,814,000 131,000
Transport - 35,200 340,800 125,000
Land - - 540,000 -
Other costs - - - 32,000
total costs - 189,659 3,694,800 495,000
Revenue 1,185,625 2,219,594 12,613,100 12,119,000
Margin 1,185,625 2,029,935 8,918,300 11,624,000

Wageningen Economic Research Report 2019-117 | 65
Food intake
Food group 2011-2012 Rank 2015-2016 Rank
Cereals 80% 5 83% 5
Dairy products 38% 9 36% 11
Eggs 11% 12 18% 12
Fish 38% 10 39% 10
Fruit 38% 11 45% 9
Meat 47% 8 49% 8
Oils and fats 68% 6 75% 6
Outside food and drinks, condiment and beverages 99% 1 100% 1
Pulses & Nuts 89% 4 89% 4
Roots & Tubers 90% 3 90% 3
Sweets 61% 7 69% 7
Vegetables 92% 2 93% 2
Source: LSMS.

66 | Wageningen Economic Research Report 2019-117
Results of the 2013-2014
LSMS Survey for Uganda
Introduction
The data from the LSMS (Living Standards Measurement Study) Agricultural survey describe the
results of farming in 2013-2014. The data are collected during two separate visits to the households
throughout the country, during which the production and farming practices of the households can be
observed in two separate seasons. The timing of the two visits differs greatly between households, but
roughly the first visits were done in the second half of 2013 and the second visits in the first half of
2014. In some cases the two ‘visits’ were conducted at the same time and farmers were asked to
recall the situation of the previous season. The first season roughly coincides with the period February
to May 2013 for planting, and from May-July 2013 for harvesting, while the second season was mostly
reported to range from August-October 2013 for planting and from November-December 2013 for
harvesting. This means that the first season is a dry season (planting at the end of the wet season)
and the second season is a wet season.
The data is presented per season, only if different seasons apply. For pineapples and avocado the data
are aggregated and all the costs and revenues are attributed to the entire period of the survey. In
some cases however, for tomatoes and onions, the costs of planting and fertilizing or spraying appear
to be registered in one season while the revenues of the crop are made in the other season. There was
no way of correcting this without additional information.
For this analysis, the households that grew tomato, onion, avocado or pineapple crops – no data on
peppers is available in the LSMS survey of 2013-2014 – were selected, i.e. households with some area of
production of these crops. This were 134 households, out of a total of 2,495 households in the survey.
The data about the size of the parcels and plots of the specific crops was combined with data on the use
of fertilisers, pesticides, labour and other inputs on these plots. In some cases, costs of inputs were
allocated to different crops that were grown on the same plot. Harvested production, sold production,
transport costs, if any, and the value of sales were also available for most households. However, in a
number of cases information was missing on e.g. the quantity sold or harvested. We estimated these
whenever possible from the existing data of the household (e.g. when a quantity unit for production sold
was missing but clearly the same quantity unit applied as for product harvested). The remaining
observations were inspected for outliers, looking at them specifically in terms of production per acre and
in terms of prices of sold production. Generally, these outliers were related in the sense that abnormal
high production per acre was usually accompanied by abnormally low prices. Outliers were eliminated
per season and for the year aggregate if they were lower than two times the interquartile range below
the value of the first quartile, and if they were above two times the interquartile range above the value
of the third quartile. From this procedure it follows that the aggregated (total) costs and margins over
the year can include different households than the separate seasons.
The resulting production and costs estimates look plausible. However, we note that the LSMS survey
was not designed to produce estimates of costs and production of serious tomato or pineapple
farmers. The households in the survey often produce multiple crops and livestock and the average size
of the farms is lower than those that we visited during the fieldwork in this project. More importantly
we corrected some of the fieldwork data for failed crop harvests based on expert estimates of
potential harvests. The data in the LSMS survey is not corrected for failed crops. Therefore, when the
results of the LSMS survey are compared with our results of the fieldwork, mostly, the produced
quantities per acre are lower in the LSMS survey. In addition, we note that five years have passed
since 2013/2014 and that inflation has increased prices by about 25%-30%. It is likely that prices of
vegetables and fruit have risen as well.
A final remark is made about the use of own resources. Much of the labour and other inputs such as
seeds and fertilisers are neither hired nor bought, but come from the family or the other farming

Wageningen Economic Research Report 2019-117 | 67
activities of the family. These costs are not included in the data; hence, the remaining margins are
used as family income but also, for example, to feed cattle whose manure is used as a fertiliser.
Tomato
The costs and margin division in percentage of the total sales value of tomatoes is presented in
figure 1. The margins are between 60 and 80%. The second season has a lower margin because of the
lower harvest, with roughly equal – to somewhat higher - costs of production. Especially the costs of
fertilisers was higher in the second season. Note that some of the produce was consumed in the
household (about 7%). This was not valued as revenue. At the same time most of the labour is
performed by the members of the household. This labour is not valued, either – it is the margin that
remains for the household that is the compensation for the family labour.
The findings from the LSMS survey differ in a number of ways from the data in the fieldwork. In terms
of production per acre, the average firm in the LSMS data only produced about 2,800kg of tomatoes
per acre per year, including two seasons.
Figure 2 Costs and margins of tomatoes production in Uganda, in % of total sales revenue, in
2013/2014
Source: LSMS Survey 2013/2014, calculations Wageningen Economic Research.
In the table below the results of the costs and revenues estimates per acre are given for tomatoes. The
data is based on 24 observations in season 1 and 36 observations in season 2. In total there were 52
households reporting the production of tomatoes in either one of the seasons that fit within the sample
selection criteria (outliers excluded). Sixty of these households actually sold tomatoes, and five only
produced tomatoes but for some reason did not sell any. The reasons for this could be that tomatoes
were intentionally only produced for own use, but another reason could be a loss of harvest. Because we
want to give a reliable picture of the production and revenue capacity of the sector, we included all these
households in the reported figures. Also, some plots were sown and fertilised but not harvested yet
(immature crops). We have also included these plots in the calculations because it increased the amount
of data on the use of pesticides, fertilisers and seeds, and their respective costs. Of course, excluding
these plots from the data would imply a small increase in the production per acre. The differences are
minimal however, as the observation period is quite long and most crops were harvested.
The data reveal that the average acre of tomatoes yielded about 1,300kg of tomatoes per season. The
harvests were much higher in the first season than in the second season. The highest reported yields
per acre in season one reached 30 tonnes, which is much higher than the average yield. This
particular farmer used certified improved seeds on a half-acre plot, without much more costly inputs
besides own labour. The highest costs per acre are reported to be pesticides, labour and seeds. Some
differences between seasons exists although variations between households are also quite high. The
0%
20%
40%
60%
80%
100%
season 1 season 2 total
Tomatoes
Seed costs Organic fertilizer costs Other fertilizer costs
Pesticides costs Labour costs (hired) Transport costs
Margin

68 | Wageningen Economic Research Report 2019-117
production quantities in season two (November -December harvest) were reported to be much lower,
while the selling prices were higher.
On average the margin per acre was higher in the first season than in the second season. The
‘average column’ is calculated as the sum of the two seasons’ costs and revenues divided by the sum
of the planted areas in the two seasons, meaning that it is the average costs and revenues over both
seasons. The ‘total’ column, on the other hand, takes the total costs and margin and divides it by the
average acreage of the two seasons. It is an estimate of the total production capacity and costs if the
same plot is planted and harvested twice in a year.
Table 2 Cost and revenues of tomato production in Uganda, per acre, in UGX, in 2013/2014
Season 1 Season 2 Average per season Total all seasons
Production harvested kg 1,559 814 1,223 2,575
Production sold kg 1,457 721 1,131 2,381
Seed costs 38,852 42,532 48,885 102,936
Organic fertiliser costs 24,283 1,779 33,760 71,088
Other fertiliser costs 38,573 126,701 64,361 135,522
Pesticides costs 75,816 108,476 81,398 171,397
Labour costs (hired) 28,256 94,218 60,568 127,535
Transport costs 10,949 9,685 9,462 19,923
Total costs 216,729 383,392 298,435 628,400
Revenues 1,332,009 948,114 1,179,285 2,483,162
Margin 1,115,279 564,722 880,850 1,854,762
Selling price per kg 914 1,316 1,043 1,043
Source: LSMS Survey 2013-2014, calculations Wageningen Economic Research. N= 24 in seasons 1, 36 in seasons 2, 52 in total.
The two charts below show the same costs and revenues, expressed per acre (as in the table above),
and per kilogram of tomatoes produced (harvested). Again, some of the produce was not sold, so if we
expressed the costs in terms of quantities sold, the costs and the revenues would both be a little bit
higher, but their proportions would remain the same. The main difference between the two is in the
differences between the first and second season. Per acre the margin is much higher in the first season,
while per kg the margin is somewhat higher in the second season. This reflects the situation that the
yields are higher in the first season: with low inputs a higher yield means a higher margin. Per kilogram,
however, the second season is somewhat more interesting, but also requires more inputs. Labour costs
and especially fertiliser costs are higher in the second season. It shows that while yields are not great in
the second season, it can be profitable to produce tomatoes if the land is available. Obviously, with
higher input costs, the risk of losing a harvest is also higher and controlling production is more
important. This means irrigation, good crop protection, as well quality seeds are very important.
Figure 3 Costs and margins of tomato production in Uganda, in UGX per acre, in 2013/2014
Source: LSMS Survey 2013/2014, calculations Wageningen Economic Research.
0
200,000
400,000
600,000
800,000
1,000,000
1,200,000
1,400,000
season 1 season 2 total
Tomatoes per acre
Seed costs Organic fertilizer costs Other fertilizer costs
Pesticides costs Labour costs (hired) Transport costs
Margin

Wageningen Economic Research Report 2019-117 | 69
Figure 4 Costs and margins of tomato production in Uganda, in UGX per kg, in 2013/2014
Source: LSMS Survey 2013/2014, calculations Wageningen Economic Research.
Onion
For onions, the LSMS dataset of 2013-2014 contains 23 complete observations of households
producing onions after removing outliers, of which 16 in season one and 14 in season two. The onions
were planted between March and May in season one and harvested between June and August. In
season two the growing season lasted roughly from June-August for planting to November-December
for harvesting. Most of the growing households were found in the Western and Northern regions. The
data on the households in the northern region, were, however, incomplete for some of these
household, yielding only two of the observations per season for the northern region.
The figure below gives the shares in total revenue of the various costs of inputs and labour, and the
margin. The average margins fluctuate between 70% and 80%. The fact that the margin for the ‘total’
is somewhat lower is caused by a few firms with incomplete data per season (missing quantities sold
or quantities harvested) but which were included in the total. The production in especially the
Northern region of the country is (according to the available data) characterised by very low input
costs; almost no (bought) seed costs, fertilisers or pesticides are used. The figure presents the
averages for all observations in all regions.
Labour costs are an important component of the cost structure for onions. This is due to the fact that
harvesting is labour intensive. This is especially apparent in the regions where the harvested areas are
larger and non-family labour is hired. These higher labour costs are mostly recorded in the Eastern
and Western part of the country. The average size of the onion-growing areas per household are also
much higher in these regions, although still small with an average of about 0.5 to 1 acre. In the
Northern region, the recorded area averaged about 0.20 acre in season one and 0.37 acre in season
two.
The cost structure is somewhat comparable between the seasons. The costs of pesticides are quite low
for onions in comparison to e.g. tomatoes, because onions grow underground.
0
200
400
600
800
1,000
1,200
1,400
season 1 season 2 total
Tomatoes Per kg
Seed costs Organic fertilizer costs Other fertilizer costs
Pesticides costs Labour costs (hired) Transport costs
Margin

70 | Wageningen Economic Research Report 2019-117
Figure 5 Costs and margins of onion production in Uganda, in % of total sales revenue, in
2013/2014. Source: LSMS Survey 2013/2014, calculations Wageningen Economic Research.
In the table below the costs per acre are specified. Note again that the number of observations is
limited and the absence of costs for a particular input in a season does not mean that it was not used
at all. The overall ‘total’ costs and revenues include the most observations and give the most accurate
picture of production costs. Selling prices were about UGX 850 to 1,000 per kg. The prices were a little
bit higher in the second season. Combined with higher production per acre, the average margin per
acre was higher in the second season.
In the figure below the table, the same data is shown as in the table above. When compared to
figure 6, it is clear that the onion market was quite stable. The production per acre was higher in the
second season and prices were also higher in the second (dry) season.
Table 3 Costs and revenues of onion production in Uganda, per acre, in UGX, in 2013/2014
Season 1 Season 2 Average per
season
Total all seasons
Production harvested kg 690 828 668 1,430
Production sold kg 641 757 608 1,302
Seed costs 32,956 71,414 50,528 108,172
Organic fertiliser costs 6,289 ~ 3,018 6,460
Other fertiliser costs ~ ~ 13,881 29,716
Pesticides costs 9,057 ~ 7,242 15,504
Labour costs (hired) 88,050 106,242 86,904 186,047
Transport costs 881 1,062 905 1,938
Total costs 137,233 178,718 162,477 347,836
Revenues 544,654 778,088 535,244 1,145,866
Margin 407,421 599,369 372,767 798,030
Selling price per kg 850 1,028 880 880
Source: LSMS Survey 2013-2014, calculations Wageningen Economic Research. N= 16 in season 1, 14 in season 2, 23 in total.
0%
20%
40%
60%
80%
100%
season 1 season 2 total
Onions
Seed costs Organic fertilizer costs Other fertilizer costs
Pesticides costs Labour costs (hired) Transport costs
Margin

Wageningen Economic Research Report 2019-117 | 71
Figure 6 Costs and margins of onion production in Uganda, in UGX per acre, in 2013/2014
Source: LSMS Survey 2013/2014, calculations Wageningen Economic Research.
Figure 7 Costs and margins of onion production in Uganda, in UGX per kg, in 2013/2014
Source: LSMS Survey 2013/2014, calculations Wageningen Economic Research.
Pineapple
In the LSMS data on pineapple production was reported in all regions, but most of the production was
found in the Western region. The typical acreage per household was a little bit higher in the Central
region than in the other regions, though still small – around one acre.
In the LSMS data, harvesting is reported between about May and August in season one and between
November and December in season two. In the data there were a total of nine complete observations
in the two seasons of pineapple producing households.
Pineapples are produced low input. Seed costs (suckers) are one of the main costs, along with labour
and transport. Pesticides or chemical fertilisers are hardly used. The figure below expresses the total
reported costs over the whole year (by the households reporting to have produced pineapples in season
one or two or both) as a fraction of the total value of the sold production. Keep in mind that a part of the
production is not sold, although this part is rather small for pineapples (about 96% reported to be sold).
0
200,000
400,000
600,000
800,000
1,000,000
season 1 season 2 total
Onions Per acre
Seed costs Organic fertilizer costs Other fertilizer costs
Pesticides costs Labour costs (hired) Transport costs
Margin
0
200
400
600
800
1,000
season 1 season 2 total
Onions Per kg
Seed costs Organic fertilizer costs Other fertilizer costs
Pesticides costs Labour costs (hired) Transport costs
Margin

72 | Wageningen Economic Research Report 2019-117
Figure 8 Costs and margins of pineapple production in Uganda, in % of total sales revenue, in
2013/2014
Source: LSMS Survey 2013/2014, calculations Wageningen Economic Research.
The average production per acre (for the whole year) was about 750kg. Note that we do not have a
balanced sample of households producing pineapples in each of the two seasons, but most of the
households in the survey reported to be producing pineapples in both seasons on the same plots (as
expected).
Table 4 Cost and revenues of pineapple production in Uganda, per acre, in UGX, in 2013/2014
Total, *)
Production harvested kg 754
Production sold kg 672
Seed costs 52,863
Organic fertiliser costs 7,401
Other fertiliser costs 0
Pesticides costs 0
Labour costs (hired) 15,383
Transport costs 2,115
Total costs 77,761
Revenues 357,985
Margin 280,224
Selling price per kg 533
Source: LSMS Survey 2013-2014, calculations Wageningen Economic Research. N=6 in season 1, 8 in season 2, 9 in total. *) per acre on the
basis of total harvest and costs over the whole year and average area as reported in seasons one and two.
Pineapples
Seed costs Organic fertilizer costs Other fertilizer costs
Pesticides costs Labour costs (hired) Transport costs
Margin

Wageningen Economic Research Report 2019-117 | 73
Figure 9 Costs and margins of pineapple production in Uganda, in UGX per acre, in 2013/2014
Source: LSMS Survey 2013/2014, calculations Wageningen Economic Research.
Figure 10 Costs and margins of pineapple production in Uganda, in UGX per kg, in 2013/2014
Source: LSMS Survey 2013/2014, calculations Wageningen Economic Research.
Avocado
Avocado is a perennial crop. The avocado trees can be productive for many years, but if grown from a
young tree from a nursery the trees are not productive for the first three to four years. The trees from
the 23 households in the LSMS survey were on average about 10 years old, but some trees were not
yet productive. In the figure below, the average cost structure for the two seasons and the total
survey period 2013-2014 of the survey are given. The first seasons was roughly reported as the
period from January to June, while the second season was the period from July to December.
Harvesting happened year-round. Most of the avocado growers in the LSMS data were found in
Northern and Western Uganda; in the LSMS data no growers were found in Eastern Uganda.
Most households use very little or no inputs other that what is already available at the household. The
reported inputs of avocado production were mainly fertiliser costs, which were organic fertilisers in
most cases, but the number of households that actually reported any use of inputs was very limited.
Only in some cases, did households report using hired labour and similar numbers were found for
fertilisers. Pesticides were used by two households as well. This illustrates the very low number of
inputs used for avocado production in Uganda. Because avocado is a perennial crop, we presented the
data for the whole year (mostly the year 2013).
0 50,000 100,000 150,000 200,000 250,000 300,000 350,000 400,000
total per acre
Pineapples per acre
Seed costs Organic fertilizer costs Other fertilizer costs
Pesticides costs Labour costs (hired) Transport costs
Margin
0 100 200 300 400 500
total
Pineapples Per kg
Seed costs Organic fertilizer costs Other fertilizer costs
Pesticides costs Labour costs (hired) Transport costs
Margin

74 | Wageningen Economic Research Report 2019-117
Figure 11 Costs and margins of avocado production in Uganda, in % of total sales revenue, in
2013/2014
Source: LSMS Survey 2013/2014, calculations Wageningen Economic Research.
The production quantities per acre are presented in the table below.
Table 5 Cost and revenues of avocado production in Uganda, per acre, in UGX, in 2013/2014
Total *)
Production harvested kg 1,638
Production sold kg 1,225
Seed costs 0
Organic fertiliser costs 92,212
Other fertiliser costs 9,175
Pesticides costs 11,010
Labour costs (hired) 15,598
Transport costs 5,505
Total costs 133,502
Revenues 524,831
Margin 391,329
Selling price per kg 428
Source: LSMS Survey 2013-2014, calculations Wageningen Economic Research. N = 8 in total. *) per acre on the basis of total harvest and costs
over the whole year and average area as reported in seasons one and two.
Figure 12 Costs and margins of avocado production in Uganda, in UGX per acre, in 2013/2014
Source: LSMS Survey 2013/2014, calculations Wageningen Economic Research.
Avocado
Seed costs Organic fertilizer costs Other fertilizer costs
Pesticides costs Labour costs (hired) Transport costs
Margin
0 100,000 200,000 300,000 400,000 500,000 600,000
total per acre
Avocado Per acre
Seed costs Organic fertilizer costs Other fertilizer costs
Pesticides costs Labour costs (hired) Transport costs
Margin

Wageningen Economic Research Report 2019-117 | 75
Figure 13 Costs and margins of avocado production in Uganda, in UGX per kg, in 2013/2014
Source: LSMS Survey 2013/2014, calculations Wageningen Economic Research.
0 50 100 150 200 250 300 350
total
Avocado Per kg
Seed costs Organic fertilizer costs Other fertilizer costs
Pesticides costs Labour costs (hired) Transport costs
Margin

76 | Wageningen Economic Research Report 2019-117
Cost benefit data for studied
vegetable crops Kenya
Onion in Machakos Tomato in Kirinyaga Capsicum in Machakos
UNIT QUANTITY UGX TOTAL
UGX
QUANTITY UGX TOTAL
UGX
QUANTITY UGX TOTAL
UGX
LAND PREPARATION
Land clearing M/DAYS - - 3 12,446 37,338 - - -
Ploughing ACREAGE 1 142,240 142,240 1 88,900 88,900 1 142,240 142,240
Harrowing ACREAGE 1 12,4460 12,4460 - - 1 124,460 124,460
Ridging ACREAGE 1 - - 1 44,450 44,450 - - -
Cost of manure TONS/Kg
s
- - 10 14,224 142,240 - -
Labour for manure
application
M/DAYS 10 12,446 124,460 5 12,446 62,230 10 12,446 124,460
SUB TOTAL COST 391,160 375,158 391,160
COST OF INPUTS
Fertiliser 50Kg
BAG
1 42,672 42,672 70kg 124,460 124,460
Seeds 50Kg
BAG
3 53,340 160,020 4 113,792 455,168 2 53,340 106,680
Seedling preparation Kgs/gms 1kg 224,028 224,028 391,160 - 1 142,240 142,240
Herbicide Kgs/LITS 1 106,680 106,680 - - - - -
Insecticide 1 Kgs/LITS 1 106,680 106,680 - - - - -
Insecticide 2 Kgs/LITS 1 231,140 231,140 200mls 142,240 142,240 1 177,800 177,800
Fungicide 1 Kgs/LITS 1 231,140 231,140 200mls 35,560 35,560 - - -
Fungicide 2 Kgs/LITS - - - 5 42,672 213,360 1 177,800 177,800
Foliar feed 1,2,3 Kgs/LITS - - - 5 42,672 213,360 - - -
Strings, staking sticks Kgs/LITS 50kg 71,120 71,120 - - - - -
Fuel Pick-ups - - - 8,000 71 568,960 - - -
Others LITS
177,800 177,800 140 4,089 572,516 177,800 177,800
SUB TOTAL COST 1,351,280 2,201,164 906,780
CROP MANAGEMENT
Planting labour M/DAYS 5 10,668 53,340 2 17,780 35,560 5 10,668 53,340
Fertiliser application
labour split 1st and 2nd
M/DAYS 10 10,668 106,680 10 7,112 71,120 10 10,668 106,680
Spraying labour 1st,2nd
and 3rd
M/DAYS 5 10,668 53,340 2 28,448 56,896 5 10,668 53,340
Weeding labour 1st and
2rd
M/DAYS 2 10,668 21,336 5 28,448 142,240 2 10,668 21,336
Harvesting 1st,2rd,3rd……... M/DAYS 10 10,668 106,680 - - 10 10,668 106,680
Grading, sorting, packing M/DAYS 20 10,668 213,360 40 7,112 284,480 20 1,067 21,336
Irrigation labour cost M/DAYS 10 10,668 106,680 1 8,890 8,890 10 10,668 106,680
Others M/DAYS 20 10,668 213,360 5 7,112 35,560 20 10,668 213,360
SUB TOTAL 874,776
634,746 682,752
TOTAL COST 2,617,216 3,211,068 1,980,692

Wageningen Economic Research Report 2019-117 | 77
Cost benefit data for studied
fruit crops Kenya
Pineapple in Kericho Avocado in Embu Avocado in Nakuru
UNIT QUANTITY UGX TOTAL
UGX
QUANTITY UGX TOTAL
UGX
QUANTITY UGX TOTAL
UGX
LAND PREPARATION
Land clearing M/DAYS 1 142,240 142,240 4 14,224 56,896 20 7,112 142,240
Ploughing ACREAGE
- - 1 56,896 56,896 - -
Harrowing ACREAGE
- - 110 533 58,674 - -
Ridging ACREAGE 1 106,680 106,680
- - - -
Cost of manure TONS/Kgs
- - 7 35,560 248,920 10 35,560 355,600
Labour manure application M/DAYS
- - 6 14,224 85,344 - -
SUB TOTAL COST
248,920
506,730 497,840
COST OF INPUTS
Fertiliser 50kg bag/kg 50Kg BAG
- - 2 124,460 248,920 1 99,568 99,568
Seedling / suckers PIECES 2 142,240 284,480 110 7,112 782,320 160 10,668 1,706,880
Insecticide 1 Kgs/LITS 5 7,112 35,560
- - 1 64,008 64,008
fungicide 2 Kgs/LITS
- -
- - 1 42,672 42,672
SUB TOTAL COST
- 320,040
- 1,031,240 - 1,913,128
CROP MANAGEMENT
Planting M/DAYS 30 7,112 213,360 3 14,224 42,672 30 7,112 213,360
Fertiliser application labour
split 1st and 2nd
M/DAYS
- - 2 14,224 28,448 - -
Spraying 1st, 2nd and 3rd M/DAYS
- - 1 14,224 14,224 - -
Weeding 1st and 2nd M/DAYS 12 124,460 1,493,520 4 14,224 56,896 20 7,112 142,240
Harvesting 1st, 2nd,
3rd……...
M/DAYS
- -
-
- -
Grading, sorting, packing M/DAYS
- -
-
- -
Irrigation M/DAYS
- - 4 12,446 1,493,520 - -
SUB TOTAL
1,706,880
1,635,760 355,600
TOTAL COST
2,275,840 3,173,730 2,766,568

78 | Wageningen Economic Research Report 2019-117
List of Districts in Uganda
Central Region Eastern Region Northern Region Western Region
Map District Map District Map District Map District
82 Buikwe 4 Amuria 1 Abim 81 Buhweju
84 Bukomansimbi 7 Budaka 2 Adjumani 10 Buliisa
86 Butambala 49 Bududa 78 Agago 11 Bundibugyo
87 Buvuma 8 Bugiri 79 Alebtong 12 Bushenyi
89 Gomba 83 Bukedea 3 Amolatar 18 Hoima
27 Kalangala 9 Bukwa 80 Amudat 19 Ibanda
90 Kalungu 85 Bulambuli 39 Amuru 26 Isingiro
29 Kampala 13 Busia 5 Apac 23 Kabale
36 Kayunga 15 Butaleja 6 Arua 24 Kabarole
38 Kiboga 88 Buyende 16 Dokolo 31 Kamwenge
95 Kyankwanzi 20 Iganga 17 Gulu 32 Kanungu
48 Luweero 21 Jinja 22 Kaabong 34 Kasese
99 Lwengo 25 Kaberamaido 42 Kitgum 37 Kibaale
100 Lyantonde 28 Kaliro 43 Koboko 40 Kiruhura
51 Masaka 30 Kamuli 93 Kole 92 Kiryandongo
56 Mityana 33 Kapchorwa 44 Kotido 41 Kisoro
59 Mpigi 35 Katakwi 97 Lamwo 96 Kyegegwa
60 Mubende 91 Kibuku 47 Lira 46 Kyenjojo
61 Mukono 45 Kumi 50 Maracha 52 Masindi
63 Nakaseke 94 Kween 57 Moroto 55 Mbarara
64 Nakasongola 98 Luuka 58 Moyo 102 Mitooma
70 Rakai 101 Manafwa 62 Nakapiripirit 106 Ntoroko
72 Sembabule 53 Mayuge 104 Napak 66 Ntungamo
76 Wakiso 54 Mbale 65 Nebbi 109 Rubirizi
103 Namayingo 107 Nwoya 71 Rukungiri
14 Namutumba 108 Otuke 111 Sheema
105 Ngora 67 Oyam
69 Pallisa 68 Pader
110 Serere 77 Yumbe
73 Sironko 112 Zombo
74 Soroti
75 Tororo

Wageningen Economic Research Report 2019-117 | 79

Wageningen Economic Research
P.O. Box 29703
2502 LS The Hague
The Netherlands
T +31 (0)70 335 83 30
www.wur.eu/economic-research
Wageningen Economic Research
REPORT
2019-117
The mission of Wageningen University & Research is “To explore the potential
of nature to improve the quality of life”. Under the banner Wageningen
University & Research, Wageningen University and the specialised research
institutes of the Wageningen Research Foundation have joined forces in
contributing to finding solutions to important questions in the domain of
healthy food and living environment. With its roughly 30 branches, 5,000
employees and 10,000 students, Wageningen University & Research is one of
the leading organisations in its domain. The unique Wageningen approach
lies in its integrated approach to issues and the collaboration between
different disciplines.


The mission of Wageningen University & Research is “To explore the potential of nature to improve the quality of life”. Under the banner Wageningen University & Research, Wageningen University and the specialised research institutes of the Wageningen Research Foundation have joined forces in contributing to finding solutions to important questions in the domain of healthy food and living environment. With its roughly 30 branches, 5,000 employees and 10,000 students, Wageningen University & Research is one of the leading organisations in its domain. The unique Wageningen approach lies in its integrated approach to issues and the collaboration between different disciplines.
Youri Dijkxhoorn, Michiel van Galen, Julian Barungi, John Okiira, Joyce Gema and Valerie Janssen
Competitiveness and investment opportunities
The Uganda vegetables and fruit sectorWageningen Economic ResearchP.O. Box 297032502 LS Den HaagThe NetherlandsE [email protected]/economic-research
Report 2019-117ISBN 978-94-6395-203-3