Embed Size (px)
Citation preview

STUDY
Market study in the context of decentralized energy supply using renewable energy technologies in selected Russian regions

Publisher
Deutsche Energie-Agentur GmbH (dena)
German Energy Agency
Chausseestraße 128 a
10115 Berlin, Germany
Tel: +49 (0)30 66 777 - 0
Fax: +49 (0)30 66 777 - 699
E-mail: [email protected]
Internet: www.dena.de
Authors
George Kekelidze, Eurosolar Russia
Alexey Kaplun, Eurosolar Russia
Ulf Lohse, eclareon GmbH
Tatiana Andreeva, eclareon GmbH
Georgy Ermolenko, Higher School of Economics Moscow (HSE)
Alina Rodina, Higher School of Economics Moscow (HSE)
Date: 10/2019
All rights reserved. Any use is subject to consent by dena.
All content has been prepared with the greatest possible care and is provided in good faith. dena provides no
guarantee regarding the currency, accuracy and completeness of the information provided. dena accepts no
liability for damages of a tangible or intangible nature caused directly or indirectly by the use of or failure to
use the information provided, unless dena can be proven to have acted with intent or gross negligence.
Please quote as: German Energy Agency (dena, 2020): “Market study in the context of decentralized energy
supply using renewable energy technologies in selected Russian regions“

dena study „Market study in the context of decentralized energy supply using renewable energy technologies in selected Russian regions“ 3
Contents
Objectives of the market study ........................................................................................ 6
Executive summary ......................................................................................................... 7
Сводное Резюме (Executive Summary) ........................................................................... 9
1 Introduction to energy supply in remote areas in Russia ...................................... 11
1.1 History and overview ................................................................................................ 11
1.2 Energy and supply in remote areas .......................................................................... 12
1.3 Legal and regulatory framework for off-grid energy supply ................................... 14
1.4 Off-grid renewable energy projects.......................................................................... 23
1.5 Selection of regions .................................................................................................. 24
1.6 Financing and profitability analysis of renewable energy business models .......... 26
2 Detailed analysis of target regions ..................................................................... 28
2.1 Sakha (Yakutia) ......................................................................................................... 29
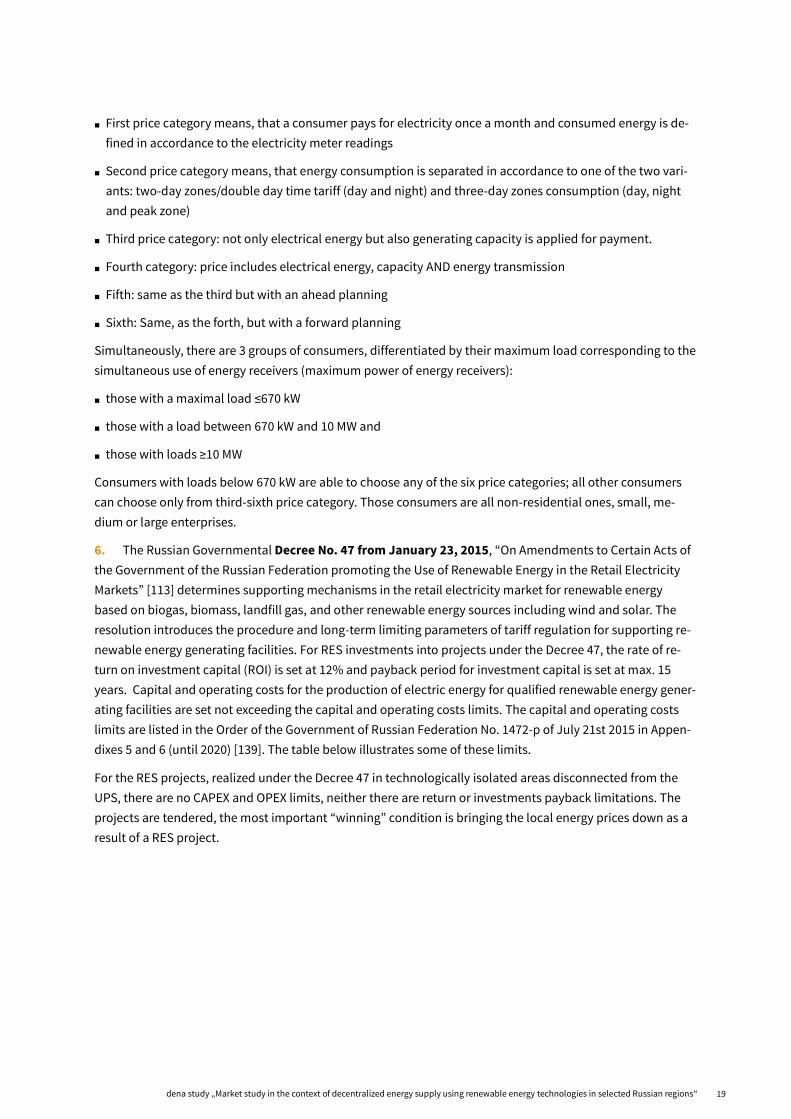
2.1.1 Current energy supply situation and renewable energy potential ......................... 29
2.1.2 Electricity tariffs and costs ........................................................................................ 35
2.1.3 Extreme cases of high electricity costs in Yakutia .................................................... 38
2.1.4 Regional business environment & specific legal and regulatory framework for
energy supply ............................................................................................................ 39
2.1.5 Regional specific business case ................................................................................ 41
2.1.6 Business model description ..................................................................................... 41
2.1.7 Profitability analysis (inputs, outputs, scenarios, sensitivities) .............................. 43
2.1.8 Potential for cooperation/business opportunities and recommendations ........... 48
2.1.9 Risks and barriers ...................................................................................................... 49
2.2 Kamchatka ................................................................................................................ 52

2.2.1 Current energy supply situation and renewable energy potential ......................... 52
2.2.2 Electricity tariffs and costs ........................................................................................ 58
2.2.3 Regional business environment & specific legal and regulatory framework for
energy supply ............................................................................................................ 62
2.2.4 Regional specific business case ................................................................................ 64
2.2.5 Business model description ..................................................................................... 64
2.2.6 Profitability analysis (inputs, outputs, scenarios, sensitivities) .............................. 65
2.2.7 Potential for cooperation/business opportunities .................................................. 71
2.2.8 Risks and barriers ...................................................................................................... 72
2.3 Republic of Altai ........................................................................................................ 74
2.3.1 Current energy supply situation and renewable energy potential ......................... 74
2.3.2 Electricity tariffs and costs ........................................................................................ 78
2.3.3 Regional business environment & specific legal and regulatory framework for
energy supply ............................................................................................................ 80
2.3.4 Regional specific business case ................................................................................ 81
2.3.5 Business model description ..................................................................................... 82
2.3.6 Profitability analysis (inputs, outputs, scenarios, sensitivities) .............................. 83
2.3.7 Potential for cooperation/business opportunities .................................................. 88
2.3.8 Risks and barriers ...................................................................................................... 89
2.4 Bashkortostan ........................................................................................................... 90
2.4.1 Current energy supply situation and renewable energy potential ......................... 90
2.4.2 Electricity tariffs and costs ........................................................................................ 94
2.4.3 Regional business environment & specific legal and regulatory framework for
energy supply ............................................................................................................ 96
2.4.4 Regional specific business case ................................................................................ 96
2.4.5 Business model description ..................................................................................... 97

dena study „Market study in the context of decentralized energy supply using renewable energy technologies in selected Russian regions“ 5
2.4.6 Profitability analysis (inputs, outputs, scenarios, sensitivities) .............................. 99
2.4.7 Potential for cooperation/business opportunities ................................................ 104
2.4.8 Risks and barriers .................................................................................................... 105
2.5 Krasnodar Krai ........................................................................................................ 106
2.5.1 Current energy supply situation and renewable energy potential ....................... 107
2.5.2 Electricity tariffs and costs ...................................................................................... 110
2.5.3 Regional business environment & specific legal and regulatory framework for
energy supply .......................................................................................................... 111
2.5.4 Regional specific business case .............................................................................. 112
2.5.5 Business model description ................................................................................... 113
2.5.6 Profitability analysis (inputs, outputs, scenarios, sensitivities) ............................ 114
2.5.7 Potential for cooperation/business opportunities ................................................ 119
2.5.8 Risks and barriers .................................................................................................... 120
Conclusions and Recommendations ............................................................................. 121
Figures ........................................................................................................................ 122
Tables ......................................................................................................................... 127
Bibliography .........................................................................................................128
Abbreviations .......................................................................................................137

Objectives of the market study
The German Energy Agency (dena) is implementing the "German-Russian Dialogue on Energy Efficiency and
Renewable Energies" with the support of the Federal Ministry for Economic Affairs and Energy (BMWi). The
overall objective of this project is to sustainably improve the framework conditions for energy efficiency and
renewable energy in Russia and thus to support the development of a market for energy efficiency and re-
newable energies.
For this purpose, dena held a workshop in Berlin in November 2017 with representatives of the BMWi, associ-
ations of the renewable energy industry, companies and representatives of Russian regions. The main goal
here was to assess potential cooperation between Russian regions and German companies in the field of re-
newable energies. A market that struck participants as particularly interesting for any German-Russian coop-
eration is the expansion of renewable energies with smaller capacities (below 10 megawatts) for decentral-
ized energy supply in remote, sparsely populated areas without access to a grid-connected energy supply
(also known as isolated solutions). The method of power supply that is currently preferred in these off-grid
regions, diesel generators, is costly mainly due to logistics costs for fuel transport which are heavily subsi-
dized as a result. The use of renewable energies, in particular photovoltaics, wind power, and possibly hydro-
electric power and bioenergy, could therefore be particularly economical in these regions.
In Russia the market for large and grid-based renewable energy capacities is regulated by centralized and
nationwide tendering procedures and are economically advantageous due to guaranteed capacity-based
tariffs for investors. During the workshop it became clear however that there is hardly any information avail-
able about the market for smaller, decentralized and off-grid capacities in remote regions and that little is
known about the potential the market has and the local investment conditions.
The study at hand has been written in this context with the aim to familiarize German companies, particu-
larly small and medium-sized enterprises (SMEs), with the economic potential that the use of off-grid renew-
able energies solutions (isolated solutions) have in remote regions of Russia and to identify possibilities to
exploit their potential. For this, the market for electricity supply using diesel generators in off-grid areas of
Russia has been analyzed in five regions and an assessment of the business opportunities for renewable en-
ergies has been carried out. PV and wind power hybrid solutions were in the focus of the analysis, with small
hydropower, geothermal energy and biomass utilization being of secondary importance.

dena study „Market study in the context of decentralized energy supply using renewable energy technologies in selected Russian regions“ 7
Executive summary
The Russian energy system has, since its inception, been defined by centralized structures with conventional
power plants that are to a large extent powered by fossil fuels. Renewable energy sources, with the exception
of large hydro power plants, have not played a role in the energy supply of the country. There is a myriad po-
litical, social and, arguably most important, economic reasons for this: being rich in natural resources, Rus-
sia’s electricity generation has been generally cheap and prices for end-consumers have been kept low if re-
quired. Even in areas where electricity generation is relatively expensive, tariffs have been kept artificially
low with the use of subsides. This is often the case in remote areas, which are the focus of this study. The
combination of low generation costs and low electricity prices have historically hindered the natural devel-
opment of RES. The development has also been slow because Russian grassroots movements pushing for a
cleaner energy supply have not gained traction in Russia.
This is changing however, as electricity generation costs from renewable energy sources such as wind and
solar is falling, and will soon be comparable to the cost of electricity production from traditional sources. Alt-
hough conventional power plants are still undoubtedly the backbone of the Russian energy system, central-
ized PV and wind parks have started to appear more frequently. This development has been facilitated by the
introduction of renewable energy legislation, most importantly the Decree 449 which introduced a tender-
based support mechanism with important local requirements for the development of RES. Decree 449 has
enabled wind and PV parks to feed megawatts to the national energy grid, but this is not the focus of this re-
port. The focus here, was on how renewable energy sources, specifically wind and PV, can be a reliable and
affordable energy source for regions which are not connected to the central or a local grid. According to dif-
ferent estimations, up to 60 to 70% of Russian territory, which has a population of 22-25 million people, is
not connected to the central Russian grid, the UPS, and at least 10 million people are also not connected to a
local grid. Decentralized energy generation sources in Russia are traditionally powered by diesel generators
of all sizes. Today, the energy supply situation in these areas faces two major challenges:
1. the generators are often several decades old, meaning that their fuel-use is inefficient and that their op-
erations and maintenance costs keep rising;
2. transporting fuel (and supplies more generally) to remote areas is often very expensive, leading to
higher generation costs than the Russian average. The inherent advantage of RES such as wind and PV is that
there is no need for a constant supply of fuel for operation and that with the need to upgrade / modernize the
existing energy systems in remote areas represents an opportunity for using RE technologies to complement
or even to replace the diesel generators in the long-run.
This report examines the energy supply situation in remote areas, describes business cases for distributed RE
usage and assesses the challenges and chances for the future deployment of RES. Having examined 5 re-
gions, including isolated territories in the Far East as well as regions with centralized grids but where not all
of the territory is covered, the consensus is that RES are economical today in areas where diesel costs are
high. The following points, however, should be taken into consideration when developing such projects:
while low operating expenses work in favor of RES during the exploitation phase of a power plant, the rela-
tively high capital expenditure (CAPEX) that is required to build RE installations is a challenge for the so-
called “guaranteeing suppliers”, which are state-owned and sometimes private utilities with the mandate to

secure energy supply in remote regions. These utilities often struggle to meet the high initial capital require-
ments alone and as a result seek to install the largest amount of RE capacity possible instead of building the
best technical RE solutions, which could include storage and modern energy management systems, which
would be more economically attractive in the long-run. Due to the shortage of investment capital, the RE
share of hybrid diesel-RE systems remains relatively low for now and RE are mostly used to complement old
fuel-based capacity instead of replacing old energy systems with modern ones, including new and efficient
fuel-based generators, energy storage, RE and intelligent energy management systems. Overcoming this
CAPEX challenge is therefore an important factor when estimating the future market size of RE in remote ar-
eas. Transport is also a general issue for all items that are brought to these areas, so the logistics to build RE
installations needs to be planned more thoroughly than would be the case in areas with a better transporta-
tion infrastructure. Existing installations have shown that RE installations that are built in isolated territories
with extreme climatic conditions, as in Sakha Yakutia and Kamchatka, need to be carefully designed to be
able to withstand extreme weather conditions.
The study demonstrates that in remote regions, that are not connected to the grid, as well as in the case of
RES power supply to remote consumers in central Russia and Siberia, economically viable business cases can
rarely be developed using diesel prices alone. In such regions, logistics, albeit difficult at times, not always
represent a big challenge as is the case in isolated territories. Hence, diesel costs and electricity generation
costs are lower.
At the same time, RES can become attractive for customers that suffer from a combination of high end-user -
prices and an unreliable energy supply, ensuring reliable and safe energy supply together with diesel power
plants. Simultaneously, the existing mechanism supporting the implementation of RES projects for isolated
systems, as well as for remote consumers, are insufficient, which explains the small number of implemented
projects and the longer payback period compared to the projects implemented under the support measures.
The possibility to use energy service contracts also opens additional opportunities for RES. It is advisable to
improve the existing regulatory framework in Russia, by providing for the formation of support measures for
RES projects in isolated energy systems and for the supply of energy to remote consumers, and by support-
ing the manufacturing of relevant technologies. Development and implementation of appropriate RES tech-
nologies and professional education play a key role in the use of RES potential in these remote and isolated
areas of Russia.

dena study „Market study in the context of decentralized energy supply using renewable energy technologies in selected Russian regions“ 9
Сводное Резюме (Executive Summary)
Российская энергетическая система, с момента своего создания, была сформирована как централизован-
ная структура с традиционными электростанциями, работающими на ископаемом топливе и природном
газе. Возобновляемые источники энергии, за исключением крупных гидроэлектростанций, не играли
роли в энергоснабжении страны. Для этого существует множество политических, социальных и экономи-
ческих причин (которые, возможно, играют самую важную роль): будучи богатой природными ресурсами
страной, производство электроэнергии в России в целом можно считать не дорогим, при этом цены для
конечных потребителей сохраняются искусственно заниженными. Даже в тех районах, где производство
электроэнергии является относительно дорогостоящим, тарифы искусственно удерживаются на низком
уровне за счет применения субсидий. Такая ситуация чаще всего имеет место на удаленных территориях,
которые и являются целью настоящего исследования. Сочетание низких затрат на производство и низких
цен на электроэнергию исторически препятствовало естественному развитию ВИЭ. Развитие также было
медленным, потому что общественные движения, продвигающие идеи «чистого» производства электро-
энергии, не получили поддержки в России.
Однако ситуация меняется, так как стоимость производство электроэнергии из возобновляемых источни-
ков, таких как ветер и солнце, падает, и скоро будет сопоставимо со стоимостью производства электро-
энергии традиционными источниками генерации. Хотя обычные электростанции, несомненно, являются
основой российской энергетической системы, солнечные и ветровые парки в централизованной энерго-
системе стали появляться чаще. Этому способствовала разработка и введение в действие государствен-
ного законодательства о возобновляемых источниках энергии, в котором наиболее важным является По-
становление Правительства Российской Федерации от 28 мая 2013 года №449 «О механизме стимулиро-
вания использования возобновляемых источников энергии на оптовом рынке электрической энергии и
мощности», которое ввело механизм поддержки развития ВИЭ на основе тендера с важными требовани-
ями по локализации для развития ВИЭ. Постановление Правительства РФ №449 позволило ветровым и
солнечным электростанциям передавать мегаватты электроэнергии в Единую Энергетическую Систему
(ЕЭС) России, но не это является предметом настоящего доклада. Основное внимание здесь будет уде-
лено тому, как возобновляемые источники энергии, в частности ветер и солнце, могут стать надежным и
доступным источником энергии для регионов, которые не подключены к центральной или локальной
сети. По разным оценкам, от 60 до 70% российской территории, на которой проживает 22-25 миллионов
человек, не подключены к Единой Энергетической Системе, ЕЭС России, и ещё не менее 10 миллионов
человек не подключены к местным энергетическим сетям. В качестве источников децентрализованного
энергоснабжения традиционно используются дизельные генераторы всех типов. Сегодня ситуация с
энергоснабжением в этих районах характеризуется двумя основными проблемами:
1. Срок службы генераторов составляет несколько десятилетий, что означает неэффективное исполь-
зование ими топлива и постоянный рост эксплуатационных ремонтных расходов;
2. Транспортировка топлива (и вообще его поставка) в отдаленные районы часто обходится очень до-
рого, что приводит к более высоким затратам на производство электроэнергии, чем в среднем по России.
Неотъемлемым преимуществом ВИЭ, таких как ветер и солнце, является то, что происходит сильное сни-
жение объемов завозного топлива для работы генераторов, и что при необходимости замены/модерни-
зации существующих энергетических систем в отдаленных районах, они могут быть легко дополнены ВИЭ
и даже заменены на ВИЭ и оставаться рентабельными в долгосрочной перспективе.

В этом докладе анализируется ситуация с энергоснабжением в отдаленных районах, описываются биз-
нес-модели децентрализованного использования возобновляемых источников энергии, а также оцени-
ваются проблемы и возможности их будущего развертывания в этих районах. Исследовав 5 регионов,
включая изолированные территории на Дальнем Востоке, а также регионы с имеющимися централизо-
ванными сетями, но не покрывающими всю их территорию, мы пришли к выводу, что ВИЭ будут эконо-
мически выгодны в тех районах, где стоимость дизельного топлива высока. Однако при разработке таких
проектов следует учитывать следующие моменты: в то время как низкие эксплуатационные расходы ра-
ботают в пользу ВИЭ на этапе эксплуатации электростанции, относительно высокие капитальные затраты
CAPEX), необходимые для ввода оборудования ВИЭ, являются проблемой для так называемых «гаранти-
рующих поставщиков» - государственных и частных коммунальных предприятий с полномочиями по
энергоснабжению отдаленных регионов. Этим «гарантирующим поставщикам» обычно тяжело нести не-
обходимые капитальные затраты в одиночку. Как результат, они часто предпочитают установить стан-
дартные большие системы ВИЭ (такие как крупные СЭС от «Хевел») вместо того, чтобы внедрять иннова-
ционные технические решения на базе накопителей энергии, которые более выгодны экономически в
длительной перспективе. Из-за нехватки инвестиционного капитала, доля ВИЭ в гибридных системах ДИ-
ЗЕЛЬ-ВИЭ остается относительно низкой, так как ВИЭ в основном используются только для дополнения
старых энергетических систем вместо замены их на современные энергосистемы, включающие в себя
новые и эффективные топливные генераторы, системы хранения энергии, ВИЭ и интеллектуальные си-
стемы управления энергией. Поэтому при оценке рынка ВИЭ в отдаленных районах очень важно учиты-
вать необходимость преодоления этой проблемы инвестиционных капитальных затрат. Транспорт также
является общей проблемой для всего, что доставляется в эти районы, поэтому логистика при монтаже
установок ВИЭ должна планироваться более тщательно, чем это было бы в районах с лучшей транспорт-
ной инфраструктурой. Опыт эксплуатации установок ВИЭ, смонтированных в районах с экстремальными
климатическими условиями, таких как Республика Саха (Якутия) и Камчатка, показал, что они должны
быть тщательно спроектированы для того, чтобы выдерживать экстремальные погодные условия.
Исследование показывает, что в отдаленных регионах, которые не подключены к сетям, а также при
энергоснабжении посредством ВИЭ удаленных потребителей центральной части России и Сибири эконо-
мически жизнеспособные бизнес-модели редко могут развиваться на основе учета одних только цен на
дизельное топливо. В таких регионах логистика, хотя порой и сложная, не всегда представляет такую
большую проблему, как на изолированных территориях. Таким образом, затраты на дизельное топливо и
производство электроэнергии ниже. При этом, ВИЭ могут стать привлекательными для тех потребителей,
которые страдают от сочетания высоких цен для конечных пользователей и ненадежного энергоснабже-
ния, обеспечивая совместно с дизельными станциями надежное и безопасное энергоснабжение. Ис-
пользование механизма энергосервисных контрактов также открывает дополнительные возможности
для ВИЭ. При этом действующих механизмов поддержки реализации проектов с использованием ВИЭ
для изолированных систем, а также для удаленных потребителей недостаточно, этим объясняется не-
большое количество реализованных проектов и больший по сравнению с проектами, реализующимися в
рамках мер поддержки, срок их окупаемости. Целесообразно совершенствовать существующую в России
нормативно-правовую базу, предусмотрев формирование мер поддержки проектов ВИЭ, реализуемых в
изолированных энергорайонах и для энергообеспечения удаленных потребителей, а также поддержку
производства соответствующих технологий. Разработка и внедрение соответствующих технологий ВИЭ и
профессиональное обучение играют ключевую роль в использовании потенциала ВИЭ на этих отдален-
ных и изолированных территориях России.

dena study „Market study in the context of decentralized energy supply using renewable energy technologies in selected Russian regions“ 11
1 Introduction to energy supply in remote areas in Russia
This study is about the potential for RE in remote areas in Russia which are not necessarily the same as iso-
lated territories. For an area to be considered remote a number of criteria can be used: low population den-
sity, distance to urban centeres and the maturity of the infrastructure connecting the area to the rest of a
country. In the context of this study remoteness is defined as: a missing connection to a centralized electric-
ity grid based on fossil fuels. This narrow definition limits the focus to the isolated territories in the Arctic
north, Siberia and the Far East of the Russian Federation. While these territories and their specific challenges
are also included in this study, other regions that are not connected to a main grid and use diesel generators
for power generation are included to present a wide range of application fields for renewable energy technol-
ogies in Russia.
1.1 History and overview
With a surface area of 17.1 million square km, Russia is the largest country in the world. The country is a fed-
eral state and therefore divided into parts, with the 8 federal districts (Russian sources include the Crimea as
an additional, separate district) being the first sub-governmental division [1]. Each one has an administrative
center and includes smaller subjects of the Russian Federation – republics, oblasts (regions around bigger
cities which are the “capitals” of the oblasts), krais (regions, also with own “capitals”), autonomous regions,
cities of federal importance (Saint-Petersburg, Moscow and Sevastopol) and one autonomous oblast (Jewish
Autonomous Region). Looking at a map of Russian it becomes clear, that the closer regions are located to
Europe and Southern Russian borders, the smaller and more densely populated they become. The average
Russian population density is 8.58 people/km2, with the highest population density in Moscow – 4,894.31
people/km2. In Krasnodar the indicator is 73.80 people/km2 while, in the Republic of Sakha (Yakutia) it is
0.31 people/km2.
For many reasons, including climate conditions, the historical, political and economic development of the
Russian power grid has been varied. In 1920, the Soviet government launched the “GOELRO plan” which
aimed to raise the electrification rate in the country [26]. The plan was successfully executed and in 1935 the
largest part of the RSFSR (Russian Soviet Federative Socialist Republic) territory was electrified. However, it
has always been a challenge to supply every corner of the country with electricity and even nowadays there
are regions in Russia which still have no connection to the central power grid, the Unified Power System of
Russia (United Power System) (UPS). As a result, it is necessary to use decentralized energy generations,
which are often diesel generators.
According to different estimations, 60 to 70% of the Russian territory which is inhabited by 22-25 million peo-
ple, is not connected to the UPS [31] [33] which is illustrated in Figure 1:

Figure 1 Map of the modern electrification of Russia; source: Elistarov, 2016 [38], based on Fortov & Popel’, 2011 [44]
Although a large share of the settlements located outside the UPS area use local electricity grids operated by
regional grid companies and are included in small-scale electricity systems, there are still between 10 and 20
million people living in settlements with a population of mostly between 200-300 people, whose electricity
needs are traditionally covered by diesel and petrol generators of different sizes. These generating units rep-
resent a perspective market for PV, wind and hybrid diesel/RES generation solutions [33] [40]. Most of these
settlements are found in the Far East, Siberia and districts of the Far North. However, going beyond these so-
called “isolated territories”, there are also 30% of farms and 20% of gardening communities all over Russia,
including the European regions and the most developed areas close to Saint-Petersburg and Moscow, that
are also not connected to the centralized electricity grid system [35], meaning that the remote areas also ex-
ist in developed and highly populated Russian regions. Simultaneously, 50% of all Russian regions are esti-
mated to be energy-deficient, which means that they do not receive enough energy [32]. For example, only
around 50% of big settlements in Russia are gasified, while in rural areas the gasification rate does not ex-
ceed 35%.
Also, outside the northern isolated territories, there are thousands of small villages in Russia which have no
access to electricity grids, even though some of them are located relatively close to big cities and the UPS.
One example is a developing and growing village Podberyoza (rus. Подберёза) in the Novgorod oblast (Euro-
pean part of Russia) which has a brand-new road but lacks electricity supply, so inhabitants have to use pri-
vate diesel generators [36].
1.2 Energy and supply in remote areas
70% of the Far East is disconnected from the UPS and in Sakhalin and Kamchatka, roughly 90% of electricity
is generated from liquid fuels [34]. There are more than 900 autonomous diesel power stations of different
capacity in these two regions alone [34]. According to some estimations, the number of diesel-based generat-
ing facilities in the remote areas all over Russia exceeds 50,000 with an overall installed capacity of 500 MW.

dena study „Market study in the context of decentralized energy supply using renewable energy technologies in selected Russian regions“ 13
Annually they use more than 1 million tons of diesel to generate 2.54 billion kWh [38][43]. The overall Russian
off-grid installed electrical capacity (including diesel, coal, gas, RES based) is around 7.76 GW [39] while the
installed capacity of autonomous (private) PV generation, according to Anton Usachev, the head of the non-
commercial Association of Solar Energy of Russia, reaches 6 MW [42]. Annually, the Far North region, the Far
East and Siberia receive around 5 million tons of all types of liquid fuel (including diesel but also mazut1 and
petrol for transport needs) and 2 million tons of coal [37] from other parts of the country to cover the electric-
ity demand and fuel-needs for transport, this is also called the “northern delivery2”. The government’s
budget has allocated hundreds of billions of rubles annually to supply these regions with fuel for energy gen-
eration needs. The price of fuel usually doubles after being delivered to these regions due to high logistical
costs.
In the northern remote areas, that are disconnected from the UPS or a local electricity grid, costs for electric-
ity are the highest and vary between 35-220 RUB/kWh (0.44 – 2.9 EUR/kWh) reaching even 600 RUB/kWh (8
EUR/kWh) in very extreme cases: for instance, according to the Decree of the State Committee for Pricing Pol-
icy of the Republic of Sakha (Yakutia) N 225 of December 28th 2018, which approved establishment of the
electricity tariffs generated by “Sakhaenergo” (see chapter 2.1 for more details) for 2019, the village of Such-
chino is reported to have a single-rate electricity tariff of 660,55 RUB/kWh (8.8 EUR/kWh) [137]. Nevertheless,
consumers living in these areas are not the only ones that carry those costs: all energy related expenditures
are split and averaged between local energy supply companies, regional budgets and other consumer
groups. This is called cross-subsidization, meaning that consumer groups with low generation costs indi-
rectly finance the higher generation costs so that consumers based in remote areas do not have to pay the
“real” generation costs for electricity, far from it. Although electricity tariffs for the population in these areas
often differ from the average tariffs of the region, residential customers always pay the lowest price in com-
parison to other consumers, such as industrial consumers and SMEs. In order to make electricity prices af-
fordable for final customers, the state pays annual subsidies of around 65 billion RUB (866.9 million EUR) to
compensate the regional electricity supply companies for the difference between the economically appropri-
ate electricity price based on “real” generation costs and the end price for consumers [37].
Due to the low population density in these regions it would usually be economically unprofitable to develop
the centralized grid and/or to build large power plants far from the UPS. Instead, it is deemed to be more ef-
fective to construct local electricity stations powered traditionally by imported or locally extracted primary
energy sources (liquid fuels, gas, coal) or, this a more recent development of the last approx. 5 years to use
renewable energy sources. For the remote regions, using renewable energy sources and replacement/com-
plement of expensive imported diesel fuel is generally economically justified although RE installations in
some remote areas may have to be adapted to extreme weather conditions and can therefore not be consid-
ered “standard” RE solutions. Still, the cost of fuel saved can cover investment costs and ensure the full pay-
back of the investment. Depending on the size and type of the hybrid PV-diesel system, the average price of 1
kWh generated by a hybrid system in remote areas is sometimes estimated to vary between 7 and 15 RUB
(0.09 – 0.20 EUR) which is significantly cheaper than diesel electricity [40]. However, based on the research
and calculations done for this report these estimations seem to be very optimistic at least for the selected
target regions. The results of our calculations would rather be in line with research done by the Russian Presi-
dential Academy of national Economy and Public administration, RANEPA [41] : in a paper published in 2018,
1 Mazut or heavy fuel oil of a very dark colour, received at the first step of crude oil refinery. According to Volker Quaschning, emissions from natural gas
combustion are 0.2 kg/kWh, (…) of diesel is 0.27, and of mazut is 0.28. 2 A centralized delivery of the most important goods including food and petroleum products to the Far East, Northern Siberia and the Far North and some
Northern parts of the European territory of Russia. The Northern Delivery usually last between June and November when water ways are free from ice.

RANEPA gives estimates for LCOE for different PV applications. According to RANEPA, the LCOE of community
solar PV plants could vary between 0.09 and 0.72 EUR/ kWh whereby the high-end accounts for carbon cap-
ture and compression but no costs of storage and transportation.
With regards to the market, size estimations differ. According to Anton Usachev, an overall market size for PV
energy in remote Russian areas is estimated to be around 500 MW [40].
1.3 Legal and regulatory framework for off-grid energy supply
The power supply in the isolated energy zones is carried out in accordance with the existing regulatory and
legal framework, which specifies the electricity sale procedure of energy generating facilities in territories
that are not connected to the United Power System (UPS).
1. Government Decree No. 1178 from December 29, 2011 defines pricing specific aspects in regional en-
ergy systems disconnected from the UPS of Russia [108].
The decree defines the tariffs for energy and power capacity, as well as transmission payments of this energy
in disconnected from the UPS regional energy systems. The energy tariffs and tariffs for energy transmission
are set according to the special guidelines and methodology, approved by the Federal Antimonopoly Service
of Russia. The decree also states, that the local regulatory body of each region should be designed to fit the
region’s peculiarities and that energy systems may set various tariffs:
differentiated by 4 voltage levels: ≤0.4 kV (e.g. 150 V; 220 V); 1-20 kV (1, 6, 10, 20 kV); only 35 kV and more
than 110 kV;
differentiated by two voltage levels (electric grid facilities with a voltage ≤35 kV and ≥35 kV);
without differentiation by voltage levels;
differentiated by consumption and/or by groups of consumers determined by the authorized executive
bodies of the region.
The chosen tariffs, in accordance to the aforementioned list, are combined with other factors and tariff cate-
gories, which, at the end, seriously influence the end consumer energy price. This is especially relevant for
non-residential consumers (e.g. industry). The different prices influenced by these tariff groups are presented
in Table 4, Table 6, Table 8, and Table 10 of this report.
It is important to note that based on the methodological guidelines for the calculation of regulated tariffs
and prices for electricity in the retail market, approved by the Federal Tariff Service of Russia of August 6,
2004 No. 20-e / 2, there are 4 tariff groups of consumers distinguished in the Russian Federation:
Basic consumers - consumers with a required need of ≥20 MW of power capacity per month3 Those are
usually large enterprises which purchase energy only from energy producers who are not a part of the
wholesale market.
Population (residential consumers);
Other consumers (not included into categories 1, 2 or 4);
3 In Russia prices/tariffs for electricity often include payments for used capacity (kW/MW) along with payments for consumed power (kWh/MWh). Often,
consumers are divided into categories depending on the maximal capacity they purchase and on loads they have (especially is this important for industrial
consumers).

dena study „Market study in the context of decentralized energy supply using renewable energy technologies in selected Russian regions“ 15
Organizations that provide electric power transmission services and acquire it in order to compensate
losses in power grids owned by these organizations on the right of ownership or on other legal grounds.
Decree 1178 also regulates the following electricity tariffs for consumers4:
single rate tariffs which includes the full cost of delivery of 1 kWh, taking into account the unit cost of ca-
pacity;
single rate tariff differentiated by 2- and 3-day time zones (day and night & peak, semi-peak and night
zones). This tariff includes the full cost of delivery of 1 kWh taking into account the unit cost of capacity;
three-rate tariff applied since January 1, 2013, which includes consumption rates/ kWh and capacity
rates/kW paid by the consumer in the billing period. The major difference between a three-rate tariff and a
single-rate tariff is that a single rate tariff includes only payments for electrical power and a consumer shall
conclude an additional contract with a grid company and pay it for energy transmission services. At the
same time, a three-rate tariff already includes cost of electricity, price for power capacity (load) and pay-
ments for energy transmission. It means, that a consumer does not have to conclude a contract with a grid
operator in case it pays according to a three-rate tariff.
Consumers with the maximal power of their energy receivers is up to 670 kW are able to choose from the
mentioned above tariffs themselves, whereas all other consumers with higher maximum receivers’ capacity
use the three-rate tariff only.
Local regulatory authorities have the right not to set a three-rate electricity tariff in technologically isolated
energy systems. In regional energy systems disconnected from the UPS, the three-rate energy tariff delivered
to customers in retail markets is not set.
If the regulatory body does not prescribe a three-rate electricity tariff in technologically isolated (out of UPS)
areas consumers of the retail market, select the tariff from the following 2 variants:
single-rate tariff, which includes the total cost of delivery of 1 kWh, taking into account the cost of capacity;
single-rate tariff differentiated by 2- and 3-day time zones, which includes the full cost of delivery of 1 kWh,
taking into account the cost of capacity.
the Federal Antimonopoly Service approves the intervals of the tariff zones of the day by month of the cal-
endar year.
2. The Decree of the Government of the Russian Federation No. 854 from December 27, 2004 [109], ap-
proves the rules of operational dispatch management in the electric power industry. According to these
rules, operational dispatch control in power systems (both UPS of Russia and regional energy systems
disconnected from the UPS) is carried out by means of centralized management of interrelated techno-
logical modes of operation of electric power facilities and consumers’ power-receiving installations.
These modes together form the electricity regimes of the respective power systems. (Hereinafter - elec-
tric power grid management regime).
4 Only for non-residential consumers and groups which are not equated to population active on the retail markets of the non-prise zones and isolated
areas as well as territories disconnected from UPS. Groups, equated to population: the category includes many consumers such as non-profit horticul-
tural/agricultural communities; prisons; entities and individuals purchasing electricity with an aim to use it for household needs (military units, settle-
ments); religious organizations

Operational and dispatching management of the energy systems (both UPS and regional energy systems dis-
connected from the UPS) is led by a centralized regulator. For the UPS, the regulatory body is the system op-
erator of UPS (System Operator of the Unified Power System – “SO UPS”). For regional (local) energy sys-
tems, which are disconnected from the Russian UPS, this role is played by relevant operational branches of
“SO UPS”.
The system operator of regional energy systems disconnected from the UPS determines the structure of dis-
patch centers, including their levels and hierarchy in the area of its’ dispatch responsibility. At the same time,
dispatch centers defined as higher level dispatch centers cover operational zones that include the opera-
tional zones of other dispatch centers and are subordinate to higher level dispatch centers.
3. Federal Law No. 35-FZ from March 26, 2003, “On Electric Power Industry” [110] established a mecha-
nism of support for the production of electric energy based on the use of renewable energy sources in iso-
lated power systems, which prescribes long-term tariffs for RES-based electricity for the payback period and
guarantees the mandatory purchase of the entire amount of electricity generated by renewable energy by
the power system
4. When it is described how prices and tariffs in Russia are formed and function, it is important to distin-
guish between the different rules of how they are regulated on a higher level of the wholesale electricity
market of Russia. The territory of the country is divided into 4 zones, (see Figure 2), each of them has spe-
cific rules of price formation:
Price zones (first and second): prices for the consumers on the wholesale market and the retail market (ex-
cept for residential consumers) are non-regulated
Non-price zone (covering different territories of Russia but having the same rules): prices and tariffs for all
consumers are regulated
Isolated energy systems: prices and tariffs for all consumers are regulated
Electricity tariffs for residential consumers and groups equated to population5 are always regulated, regard-
less of which zone they belong to.
The figure below illustrates different prize zones of the wholesale market existing in Russia with the high-
lighted target regions.
5 Groups, equated to population: the category includes many consumers such as non-profit horticultural/agricultural communities; prisons; entities and
individuals purchasing electricity with an aim to use it for household needs (military units, settlements); religious organizations

dena study „Market study in the context of decentralized energy supply using renewable energy technologies in selected Russian regions“ 17
Figure 2 Prize, non-prize zones and isolated areas of the wholesale electricity market of Russia, target regions highlighted; source:
eclareon 2019, based on Ernst & Young, 2018 [163]
5. Government Decree No. 442 from May 4, 2012 [111]: this document regulates the rules of electric en-
ergy sales in isolated energy zones. The sale procedure of electrical energy produced by qualified RES gener-
ating facilities is illustrated by Figure 3. The parameters of tariff regulation are presented in Table 1.
In accordance with this decree, generating facilities located in regional energy systems disconnected from
the UPS sell energy at regulated tariffs to a “guaranteeing supplier” (retail company) that operates in the sys-
tem. The dispatching office of the technologically isolated regional energy system forms an hourly genera-
tion schedule of retail market participants a day in advance. The schedule includes planned hourly electric
energy (capacity) production of:
qualified generating facilities based on renewable energy
generating facilities with the lowest cost of produced electrical energy (capacity)
This rule is implemented under conditions of ensuring the reliability and safety of the electricity system.
Thus, in 2012, the regulatory framework determined the priority of renewable energy generation in the
power supply structure.

Figure 3 The procedure for the sale of electricity produced by qualified generating facilities in energy systems disconnected
from the UPS; source: Barkin O.G. [112]
Tariff regulation parameter Territories and power systems disconnected from the
UPS
Basic rate of return According to the results of the tender
Investment capital repayment period According to the results of the tender
Limits for capital expenditures According to the results of the tender
Limits for operating costs Not set
The requirement for minimum capacity factor Not set
Localization requirement (application of a reduction
of the penalty factor to investment capital)
Not set
Table 1 Terms of return of investment capital, provided for by measures of support in tariff regulation in relation to qualification ob-
jects of renewable energy; source: Barkin O.G. [112]
The same resolution addresses the issue of setting tariffs for various groups of consumers.
For residential consumers (population) and groups, equated to population, the electricity tariff is set at regu-
lated prices, regardless of the price zone or the location of the settlement, even in the isolated power system
[111].
For other groups of consumers, active in price zones, the tariff (price) is set at unregulated prices within the
limits of marginal unregulated prices [111]. The unregulated price is influenced by various market factors of
the wholesale market: the price may vary significantly from month to month (the effect of the magnitude of
demand, the cost of fuel, the repair of transmission lines, etc.). The final price consists of the following com-
ponents: the price of electrical energy (capacity) on the wholesale market (58% of the end price), the tariff for
power transmission (40%) and other components (less than 2%).
Price for non-residential consumers also differs depending on:
the voltage level (high ≥110 kV; first medium of 35 kV; Second medium 1-20 kV and low ≤0.4 kV)
belonging to one of six price categories that are calculated by the guaranteeing suppliers and are a type of
“energy tariffs” for enterprises [111]. Price categories depend on many factors and the scheme of defining a
price category is relatively complicated. The following price categories can be distinguished:
dena study „Market study in the context of decentralized energy supply using renewable energy technologies in selected Russian regions“ 19
First price category means, that a consumer pays for electricity once a month and consumed energy is de-
fined in accordance to the electricity meter readings
Second price category means, that energy consumption is separated in accordance to one of the two vari-
ants: two-day zones/double day time tariff (day and night) and three-day zones consumption (day, night
and peak zone)
Third price category: not only electrical energy but also generating capacity is applied for payment.
Fourth category: price includes electrical energy, capacity AND energy transmission
Fifth: same as the third but with an ahead planning
Sixth: Same, as the forth, but with a forward planning
Simultaneously, there are 3 groups of consumers, differentiated by their maximum load corresponding to the
simultaneous use of energy receivers (maximum power of energy receivers):
those with a maximal load ≤670 kW
those with a load between 670 kW and 10 MW and
those with loads ≥10 MW
Consumers with loads below 670 kW are able to choose any of the six price categories; all other consumers
can choose only from third-sixth price category. Those consumers are all non-residential ones, small, me-
dium or large enterprises.
6. The Russian Governmental Decree No. 47 from January 23, 2015, “On Amendments to Certain Acts of
the Government of the Russian Federation promoting the Use of Renewable Energy in the Retail Electricity
Markets” [113] determines supporting mechanisms in the retail electricity market for renewable energy
based on biogas, biomass, landfill gas, and other renewable energy sources including wind and solar. The
resolution introduces the procedure and long-term limiting parameters of tariff regulation for supporting re-
newable energy generating facilities. For RES investments into projects under the Decree 47, the rate of re-
turn on investment capital (ROI) is set at 12% and payback period for investment capital is set at max. 15
years. Capital and operating costs for the production of electric energy for qualified renewable energy gener-
ating facilities are set not exceeding the capital and operating costs limits. The capital and operating costs
limits are listed in the Order of the Government of Russian Federation No. 1472-p of July 21st 2015 in Appen-
dixes 5 and 6 (until 2020) [139]. The table below illustrates some of these limits.
For the RES projects, realized under the Decree 47 in technologically isolated areas disconnected from the
UPS, there are no CAPEX and OPEX limits, neither there are return or investments payback limitations. The
projects are tendered, the most important “winning” condition is bringing the local energy prices down as a
result of a RES project.

Type of energy generating object 2019 2020
Some limits for CAPEX, RUB/kW (EUR/kW)
Wind power plants up to 25 MW total ca-
pacity
109,561 (1,461) 109,451 (1,459)
PV power plants up to 0.5 MW capacity 110,525 (1,474) 108,315 (1,444)
PV power plants, capacity between 0.5
and 25 MW
105,262 (1,403) 103,157 (1,375)
Biogas power plants (landfill gas), capac-
ity between 1 and 5 MW
98,000 (1,307) 98,000 (1,307)
Some limits for OPEX, RUB/kW/year (EUR/kW)
Wind power plants up to 25 MW total ca-
pacity
1,927 (25.7) 1,999 (26.6)
PV power plants, capacity up to 25 MW 2,777 (37) 2,880 (38.4)
Biogas power plants (landfill gas) capac-
ity between 1 and 5 MW
17,150 (228.7) 17,150 (228.7)
Table 2 Some limits for CAPEX and OPEX for RES power plants constructed within the framework of the Decree 47; source: Order of
the Government of Russian Federation No. 1472-p [139]
7. These limits are also prescribed by the Russian Government Decree No. 1 from January 8th 2009, (rev.
from 15.05.2018) for a longer period (limits are presented until year 2024) [114]. Due to a relatively small size
of regional retail electricity markets and high CAPEX and OPEX limits, local administration has to increase the
end customer tariffs in order to provide a required investments payback rate. However, considering the
whole process of price formation, consumers’ tariffs are unlikely to grow by more than 0.4%. Still, enabling of
the Decree 47 is rather complicated and needs additional efforts from local governments, therefore, they are
usually not hurrying with implementation of this legislative act.
8. Decree of the Government of the Russian Federation No. 961 from September 23, 2016 [140], “On the
procedure for granting subsidies from the federal budget for state support of technological connection of
generating facilities using renewable energy sources” regulates the state support to stations operating on
renewable energy sources (RES - solar, wind power plants, small hydroelectric power stations) and peat with
an installed capacity up to 25 MW . Subsidies will be up to 70% of the cost of technical connection of generat-
ing unit to the grid but not exceeding 15 million rubles (200 thousand EUR) for each generating object.
The purpose of the law is to create legal, economic and organizational bases for stimulating energy saving
and increasing energy efficiency, and its action extends to activities related to the use of energy resources.
The development and implementation of municipal programs in the field of energy conservation and energy
efficiency enhancement refers the competence of local authorities in the field of energy conservation and
energy efficiency. Regional, municipal programs in the field of energy conservation and energy efficiency
should include an increase in the number of facilities using secondary energy resources and/or renewable
energy sources as energy sources.
9. Decree of the Government of the Russian Federation No 610 of May 23, 2017 “On Amendments to
the Qualification Rules for a Generating Facility Functioning on the Basis of Using Renewable Energy
Sources” [141] defines the basic principles and qualification criteria.
NP “Market Council” carries out the qualification of generating facilities and maintains their registry.

dena study „Market study in the context of decentralized energy supply using renewable energy technologies in selected Russian regions“ 21
Generating facilities operating on the basis of renewable energy sources must meet the following require-
ments in order to be recognized as qualified ones:
it generates energy from RES or combines RES with other types of fuel (e.g. with a diesel genset)
it is in operation (not being repaired or decommissioned)
it is connected to the power grid
for participants in retail markets, the generating facility is equipped with metering devices which meet the
requirements of the “Basic Operating Principles of Retail Electricity Markets”, approved by the Government
of the Russian Federation on May 4, 2012 No. 442 [111]
the generating facility is included into the “Scheme and program of Perspective Development of Electric
power industry” of the concrete region, where this RES facility is located
Currently, 54 solar installations, 9 wind installations, 10 small hydropower plants and 4 biogas-installations
in Russia are qualified according to the abovementioned criteria.
10. In 2018, the Federal Law No. 261 from November 23rd 2009 "On energy saving and on increasing energy
efficiency and on introducing amendments to certain legislative acts of the Russian Federation" came
into force as amended on 08.03.2018 [118].
The purpose of the law is to create legal, economic and organizational basis for stimulating energy saving
and increasing energy efficiency. The development and implementation of municipal programs in the field of
energy conservation and energy efficiency enhancement refers the competence of local authorities. Regional
programs in the field of energy conservation and energy efficiency should target increase in the number of
facilities using renewable energy sources.
Federal Law No. 261 can be used (and is used for PV-diesel and wind-diesel projects in remote northern re-
gions) as the basis for contracts between a local municipal company and an investor. In these contracts, fuel
saving through the use of renewable energy sources and other technologies are the basis for recouping in-
vestments and generating income. The investor receives a payback in the amount of the cash value of the
fuel saved in RUB/liter. When concluding these contracts, the localization of equipment production and con-
clusion of a tariff agreement are not required. Profitability for the investor in this case is not limited, but the
long-term tariff risk (which mainly corresponds to inflation) remains with the municipal company.
11. December 27, 2016, a meeting of the Council of State " On the environmental development of the Rus-
sian Federation in the interests of future generations"[116] resulted in the President of Russia approving the
List of Instructions No. p-140 GS from January 24th 2017. The document stipulates the development of mi-
crogeneration using renewable energy sources when formulating strategic planning documents and compre-
hensive action plan of the government of the Russian Federation for 2017-2025 [116].
12. In pursuance of the instructions list, on February 10th 2017, the government of the Russian Federation
issued a relevant order to the executive authorities [117].
On July 19th 2017, the Ministry of Energy of the Russian Federation prepared an Action Plan to stimulate the
development of generating facilities based on renewable energy sources with an installed capacity of
up to 15 kW. The plan provides for amendments to the legislation on electric power industry. It establishes
the basic principles of contractual relations between private owners of micro-generating units based on re-

newable energy sources and electric energy market participants (guaranteeing suppliers and grid compa-
nies). The main goal of the implementation plan is to simplify the procedure for RE micro-generating facilities
and to enable their owners to sell surplus electricity generated to public grid. In 2017, the Ministry of Finance
developed amendments to the tax code related to microgeneration. The ministry proposed exempting the
owners of micro renewable energy power plants from income taxes if they sell the surplus electricity gener-
ated by no more than 30,000 RUB (400 EUR) from January 1st to December 31st annually [119].
In pursuance of the Action Plan, the Ministry of Energy prepared a draft Federal law “On Amendments to the
Federal Law on Electric Power Industry” targeting development of microgeneration. On October 15, 2018, the
commission on legislative activities approved a draft law of the legal regulation of electricity generation by
microgeneration facilities [120]. On November 6th 2018, the Government of the Russian Federation sent a
draft law on the regulation of electricity production by micro-generating facilities to the state Duma6 [123].
The draft law introduces the following concepts and criteria for facilities, as well as criteria for classifying
generating facilities as micro-generating ones:
A micro-generating facility is based on the renewable energy source, with an installed capacity not exceed-
ing 15 kW and is used by private consumers to produce electricity to cover the electricity demand of their
personal household and/or their small production)
A micro-generation facility supplies with energy a private house only. Apartment houses are excluded from
the law.
The procedure for technological connection of facilities to electric grid is established by the government of
the Russian Federation;
Prosumers become participants of the retail market only and are empowered to sell energy on the retail
market.
All legal owners of micro-generating facilities (“prosumer”) sell their electricity in retail markets in accord-
ance with procedures established by retail markets basic principles. The sale of electric energy by citizens
owning micro-generating facilities is not considered being a business activity.
It is mandatory for guaranteeing suppliers to conclude power purchase agreements with owners of micro-
generating facilities in the area of guaranteeing supplier’s activity. To conclude the agreement, a prosumer
shall contact a guaranteeing supplier directly. The prices for electricity produced by microgeneration objects
are determined in accordance with procedures, established by the basic provisions of retail markets func-
tioning and not exceeding prices for electrical energy and power purchased by guaranteeing suppliers on the
wholesale market. Currently, the average price for 1 kWh on the wholesale market is around 2 RUB/kWh (0.02
EUR/kWh) [143], in 2018, this price was fluctuating around 1.5 RUB/kWh (0.02 EUR/kWh) [142].
In cases established by the main provisions of retail markets functioning, grid companies are obliged to com-
pensate grid losses, primarily through a purchase of electricity produced by qualified RES- or peat- based
power generating facilities.
On August 21st 2019, a Resolution of the Government of Russia N 1853-r has been sent out for consideration
to Duma. The Resolution amends the Tax Code of Russia with regard to the taxation of income from the sale
of electricity by RES microgeneration owners. It is suggested that the owners will be exempt from income tax
6 The State Duma – The Federal Assembly of the Russian Federation

dena study „Market study in the context of decentralized energy supply using renewable energy technologies in selected Russian regions“ 23
in case of selling any electricity amount to the grid operators. The benefit is planned to be valid until January
1st 2029.
1.4 Off-grid renewable energy projects
Given the absence of specific legislation for grid connected smaller installations (the law for installations <15
kW is currently prepared but not yet enacted, see above), the Russian RE market is divided between large
centralized MW installations that are mainly built based on the public tender mechanism of Decree 449 and
smaller off-grid installations with common sizes between hundreds of watt and kW. By and large two off-grid
(or weak grid) market segments can be distinguished in Russia:
1. Autonomous installations of mostly holiday houses. The famous Russian “datcha” settlements are of-
tentimes not connected to the grid. These private houses are often supplied by small diesel gensets but RE
solutions, mostly solar PV, play an increasingly important role for these settlements. The installation is a
pure private business between an installer and a private customer. In this small niche market economic con-
siderations play a role as well but are not as dominant in other market segments. These installations are of-
ten built in the surroundings of urban centres such as Moscow or St. Petersburg.
2. RE installations that are built in remote areas which are defined by low population densities and diffi-
cult supply logistics. Traditionally, electricity in these areas has been generated with diesel powered gensets
whose fuel supply is very expensive. Many of these gensets need to be modernized. RE installations in remote
areas range from solar powered lighthouse signals with some 100 Watts to MW installations which comple-
ment the traditional fossil-fuel based energy supply of larger settlements. Installations require mostly the
cooperation with a so-called “guaranteeing supplier” who are public utilities with the mandate to ensure en-
ergy supply of remote areas. Economic considerations play a role as the guaranteeing supplier are motivated
to decrease the often very high costs for energy supply in remote areas. Examples for installations are the PV
installation in the Batagai settlement in the Republic of Sakha Yakutia (see chapter 2.1.5) and the wind instal-
lation in Ust Kamchatsk (see chapter 2.2.4). Such installations are in the focus of this study.

1.5 Selection of regions
For this study the following 10 regions were pre-selected:
Nr. Region Which application
areas are there for
diesel power?
Flying
time
from
Moscow
Electricity
consumers
groups in
numbers > 15
€cent p.
kW/h?
Are pro-
grams for
the promo-
tion of re-
newable en-
ergy sources
available?
Have pilot
projects for
renewable
energy
sources
been im-
ple-
mented?
1 Sakha (Ya-
kutia)
The only source of
energy in Northern
territory is the die-
sel power for all
types of residential,
municipal and in-
dustrial consumers.
6 Energy compa-
nies, local mu-
nicipal commu-
nities
Moderniza-
tion program
to upgrade
diesel stations
with renewa-
ble energy
courses
12 off-grid
PV power-
plants in op-
eration
2 Kamchatka The only source of
energy in Northern
territory is the die-
sel power for all
types of residential,
municipal and in-
dustrial consumers.
9 Energy compa-
nies, local mu-
nicipal commu-
nities, fish pro-
cessing compa-
nies
Kamchatka
Energy supply
development
program in-
cludes wind
energy, small
hydro and ge-
othermal en-
ergy develop-
ment
Grid con-
nected only:
geothermal
power
plants, wind
parks
3 Sakhalin Kamchatka munici-
palities, energy
companies, fish pro-
cessing companies,
tourism areas.
9 Energy compa-
nies, local mu-
nicipal commu-
nities, fish pro-
cessing compa-
nies
No Regional
Program
Existing grid
connected
wind park
only
4 Irkutsk Metallurgy compa-
nies, remote con-
sumers, villages
5 Metallurgy
Companies
No Regional
Program
No
5 Tatarstan Industrial clusters 1,5 Techno parks,
Industrial
Parks
No Regional
Program
Small hydro
systems
6 Bashkorto-
stan
Municipalities and
tourism areas
2 Remote vil-
lages, Moun-
tain Tourism
places
No Regional
Program
5-10 MW So-
lar parks un-
der 449 law,
small hydro
power plants
7 Altai Municipalities, local
electric grid compa-
nies
5 Municipal and
Energy compa-
nies
No Regional
Program
Support of
solar on-grid
and off-grid
systems, in-
cluding large
PV parks
8 Primorye Northern territory is
a zone of decentral-
ized energy supply.
The only source of
energy there is the
7,5 Energy compa-
nies, local mu-
nicipal commu-
nities, all in-
No Regional
Program
Wind Park
project is
staring

dena study „Market study in the context of decentralized energy supply using renewable energy technologies in selected Russian regions“ 25
Nr. Region Which application
areas are there for
diesel power?
Flying
time
from
Moscow
Electricity
consumers
groups in
numbers > 15
€cent p.
kW/h?
Are pro-
grams for
the promo-
tion of re-
newable en-
ergy sources
available?
Have pilot
projects for
renewable
energy
sources
been im-
ple-
mented?
diesel power for all
types of residential,
municipal and in-
dustrial consumers.
dustrial com-
panies in the
North part of
Primorye
9 Magadan East and North part
are zones of decen-
tralized energy sup-
ply. The only source
of energy there is
the diesel power for
all types of residen-
tial, municipal and
industrial consum-
ers. Diesel station
serve as energy sup-
ply to all metallurgi-
cal industry in the
region.
8 Municipalities
and industrial
companies in
the North and
East of the re-
gion
No Regional
Program
No
10 Chukotka Used by Energy
companies as pri-
mary and reserve
sources. In addition,
the consumers are
metallurgical and
coal extracting min-
ing companies
9 Municipalities
and industrial
companies of
the region
No Regional
Program
Grid con-
nected wind
park project
under con-
struction
Table 3 Target regions, long list; source: eclareon

In order to cover as much diversity a possible in regards to remote regions in terms of geographical distribu-
tion, type of supplied customers etc. the following five regions were finally selected for in-depth research:
1. Sakha (Yakutia)
2. Kamchatka
3. Republic of Altai
4. Bashkortostan
5. Krasnodar Krai
Although there is no standard definition when a remote region is also an isolated territory, Sakha Yakutia and
Kamchatka would be classified based on population density and climatic conditions as isolated territories
whereas the other 3 target regions would not be regarded as isolated as a whole despite the fact there are
areas where off-grid energy supply play a role.
1.6 Financing and profitability analysis of renewable energy business models
An important objective of this report is to identify viable business models for the deployment of RE in remote
areas in Russia and business cases that can act as role model. Existing installations were selected and have
been analysed in more detail using a profitability analysis that evaluates the economic performance of RE
installations. An installation is economically viable if the sum of the discounted net benefits (benefits minus
costs) is positive, payback of the investment can be assured during the lifetime of the project and if the eco-
nomic internal rate of return (IRR) equals or exceeds the discount rate. A standard equity discount rate used
in economic analyses of projects in Russia is estimated to target a minimum of 12% and a payback period of
less than 8 years. The calculations took these values as orientation points into consideration but, in order to
show what it takes to create a viable business case, may have deviated from these reference values.
An Excel based discounted cash flow analysis (DCF) was used for the profitability analyses. The DCF method-
ology is used to evaluate a project using the concept of the time value of money. All future cash flows are es-
timated and discounted to give their present values. The net present value (NPV) is the sum of all positive
and negative cash flows’ present values including the initial investment. The NPV allows a comparison of in-
vestments with different durations and cash flow profiles over their lifetime at the present point in time. Be-
sides NPV, the internal rate of return (IRR) for both the equity and the entire project were calculated as well
as the amortization period for the invested capital. These parameters give investors an indication of the at-
tractiveness of an investment. Another key parameter calculated is the levelized cost of electricity (LCOE)
which makes it possible to compare power plants of different generation and cost structures. Finally, ratios
such as the debt service coverage ratio (DSCR) and loan life cycle coverage ratio (LLCR) provide information
about whether the project’s cash flows suffice to reimburse the debt invested in a project.
The regional business cases presented in this study always refer to one “real” project already installed in
every target region. These “real” projects do however not necessarily represent best practice cases: The pro-
jects were often amongst the first RES projects realized in their respective region which means that their real-
ization took place at the beginning of a learning curve, not at the end of it. For example, the case of the in-
stallation in Severny, Bashkortostan, is presented in this report since it was one of the very few existing off
grid installations in the region for which data could be researched. However, the installation ceased soon to

dena study „Market study in the context of decentralized energy supply using renewable energy technologies in selected Russian regions“ 27
generate electricity for technical reasons so it is far from being a best practice case. As such it rather repre-
sents an illustrative example of the difficulties that early RE projects have been facing in Russia.
Having researched and assessed the profitability analysis of these projects in different regions, a number of
general findings about the challenges that the development of RE faces in remote areas can already be sum-
marized here. It is well known that most RES are often characterized by relatively high initial investment
costs that can be, during the lifetime of an RE power plant, repaid by substantially lower expenses required
during the years of operation. Speaking in financial terms, initial capital expenditures (CAPEX) are relatively
high and operational expenditures (OPEX) are relatively low for RES. The opposite is true for conventional
power plants. Although financing may also play a role during operations, the costs that drive the financial
expenditures (FINEX) are usually the ones associated with the initial investment (CAPEX) which is paid back
during the lifetime of a project - this is illustrated in the following graph (Figure 4):
Figure 4 CAPEX, OPEX and FINEX for RES (yellow) and conventional energy sources (grey); source: eclareon, 2018
The need for upfront capital to finance RE in Russia was found to be problematic because the (mostly public)
energy companies responsible for the renovation and creation of energy generation capacities in remote ar-
eas often lack financial resources to finance high initial investments. In Russia, as described in this report,
there is a system of cross subsidies which means that certain consumer groups which live in an area where
generation costs are relatively low cross finance other consumer groups which otherwise would have to pay
very high electricity prices. Consumers in remote areas usually belong to the latter group. However, these
subsidies are targeted to finance operational costs, typically diesel fuel, and not initial investments.
0 1 2 3 4 5 6 7 8 9 10 11 12 13 14 15 16 17 18 19 20 21 22 23 24 25
Financing for RE is even more crucial than for
conventional energy technologies because
• CAPEX are relatively high AND CAPEX drives financial
expenditures (FINEX)
• OPEX are relatively low (no fuel input required)
US
D /
RU
B
Years

2 Detailed analysis of target regions
Having presented information that is generally true for all remote regions in the first section of this report,
the 5 targeted regions selected for this report will now be examined in more detail. The common feature for
all of them is the usage of diesel for energy generation in areas that are not connected to a centralized grid.
Apart from this, the regions were selected in such a way that not only the potential for off grid RES in “typi-
cal” isolated territories such as the Sakha Yakutia and Kamchatka could be examined but also the potential
of regions with some off grid areas which however do not represent the same climatic and logistic challenges
as can be found in the isolated territories.
Regions differ in terms of their natural RE potential and the most attractive RE source Figure 5 illustrates po-
tential of different renewable energy sources in Russia and shows the target regions examined in this study.
Figure 5 Map of renewable energy potentials in Russia and highlighted target regions of the study; source: eclareon 2019, generated
with amCharts Pixel Map, based on Renewable Energy Maps, [161], NIPOM, 2018 [162]

dena study „Market study in the context of decentralized energy supply using renewable energy technologies in selected Russian regions“ 29
2.1 Sakha (Yakutia)
The Sakha Republic, also simply referred to as Yakutia, is located in north-east Siberia and is a part of the Far
East Federal District. It is the largest Russian region, covering 3.1 million km2 [1][2]. More than 40% of the ter-
ritory is located beyond the Arctic Circle. Depending on the latitude, the Polar Nights and Polar Days have
different length: while in the coastal areas in the very north of Yakutia there is absolutely no sun for 3 months
a year and a 24-hours sunshine also for 3 months, in more southern regions these periods are shorter. Yaku-
tia’s territory is known for its high temperature variability: rising up to +400 C in summer and falling to -600 C
in winter [3]. 964.3 thousand people inhabit the region, of which 311.7 thousand live in Yakutsk, the regional
capital city, so the population density is 0.31 people/km2 which is one of the lowest in Russia [4] [5].
Figure 6 Map of Russia, Yakutia highlighted; source: eclareon 2019, generated with amCharts Pixel Map
Yakutia is Russia’s richest region regarding natural resource deposits of all types. The main branches of the
regional economy are: mining of diamonds, gold, oil, natural gas and coal [1]. Yakutian subsoils contain 82%
of overall Russian diamond deposits; 61% of uranium; 82% of antimony; 40% of coal; 28% of tin; 8% of quick
silver and many other types of natural resources including gas, oil, silver, zinc.
2.1.1 Current energy supply situation and renewable energy potential
Yakutia is located in one of the so-called non-prize market zones of Russia which means that the electricity
market is still more regulated than this is the case in the price zones. In addition, Yakutia has “true” isolated
territories, meaning that major part of the region has no connection to the UPS.
The regional energy system is divided into two energy zones including 4 distinct energy regions [10]:
3 regions that do have a centralized energy system (Central, Southern and Western)
The northern region that is supplied by decentralized energy systems

Figure 7 Current status of the electricity sector of Sakha Republic (Yakutia); source: eclareon 2019, generated with amCharts Pixel Map,
based on Ministry of Economy of Sakha Republic (Yakutia), 2006 [8], RusHydro [148] and WWF Russia [55]
The three centralized energy systems include Yakutsk, they cover 36% of the territory and supply ca. 85% of
the region’s population with electricity. More than 50% of Yakutia’s population lives within the parameters of
the central energy system, while the southern and eastern energy systems cover the needs of large mining
companies operating there. Major energy generation in the centralized system is ensured by the four largest
power plants: one CHPP, fueled by natural gas, and three HPPs [11]. To supply parts of the South Yakutia en-
ergy region with electricity, “Yakutskenergo”, the dominating regional energy company, purchases some of
the needed energy from the wholesale market of the second price zone. The decentralized zone covers as
much as 2,2 million km2 (64% of the territory) with 15% of the region’s population inhabiting it. Electricity
generation and supply is secured by a large number of local power plants which supply settlements and min-
ing sites.
Since January 2019, the centralized and eastern energy systems are connected to the UPS, however remain-
ing territories (southern energy system and decentralized energy supply areas in the north) still have no grid
at all or local isolated grid nets, which have no connection to the UPS. The connection to the UPS costed FSK
EES 19 billion RUB (253 million EUR7) for 750 km of 220-V power transmission lines and 2 large backhaul sub-
stations [100]. It is unlikely that the company expands the grid further into the region in the nearest future, as
that would definitely cost much more and mean complicated technical solutions.
The major reasons for connection of the two energy zones to the UPS were [100]:
Dependence of the most densely inhabited territories from the 4 major power plants and therefore, poor
quality of electricity. In case of any emergency situations or problems at any of the three HPPs or a Yaku-
tian CHPP, people suffered from power outages.
7 Here and further in the document – OANDA exchange rate for February 17th 2019, 1EUR=74.8552 RUB

dena study „Market study in the context of decentralized energy supply using renewable energy technologies in selected Russian regions“ 31
Majority of large combined heat and power plants in the region work on gas, which is delivered to the re-
gion by only three pipelines. Again, in case of emergency or any leakages in pipes, there is a danger of seri-
ous fuel shortage.
The energy system of Yakutia has the following three major stakeholder groups:
1. Power generating companies
major power generating company is PJS “Yakutskenergo” (owned by “RusHydro”)
other important power producers are: JSC “Far Eastern Generating Company” (DVGK) (owned by
RusHydro); PJS “Alrosa”; JSC “Surgutneftegas”; JSC “Sakhaenergo” (owned by “Yakutskenergo”).
In 2016, these companies generated 95.7% of the region’s electricity.
2. Power sales companies (suppliers): “Yakutskenergo” and “Sakhaenergo” are the main suppliers in the
region. There are no independent power sales companies due to peculiarities of the regional electricity sec-
tors’ status (unlike regions located in price and non-price zones, where electricity from the wholesale market
is purchased by grid companies, in isolated regions like Yakutia, it is sold to guaranteeing suppliers. It is com-
mon in these areas is that a guaranteeing supplier is simultaneously a generating company and energy trans-
mitting (grid) company. It is yet unclear, how that may change after January 2019.
3. Power grid companies
PJS “Yakutskenergo” manages 74% of the overall power grids’ length, mostly focusing on areas with cen-
tralized grid connection
JSC “Sakhaenergo” and PJS “FSK EES” manage practically equal shares of the grid, about 7% each,
“Sakhaenergo” works with decentralized territories and manages energy generation and distribution in
areas disconnected from the major grids of Yakutian energy systems.
JSC “DVGK”, JSC “Surgutneftegas”, JSC “Far Eastern Energy Management Company” managing remained
grids
According to calculations of eclareon8 based on the “Scheme and Program of the development of energy sec-
tor in the Republic of Sakha (Yakutia) for 2018-2022” [10], In 2017, the total installed generating capacity in
Yakutia overstepped 3,100 MW. More than 200 MW of this capacity belongs to autonomous generating facili-
ties in the decentralized electricity zone.
8 In the document “Scheme and Programme of the development of energy sector in the Republic of Sakha (Yakutia) for 2018-2022”, there is no data con-
cerning the total installed power capacity of diesel power plants in 2017, but there is data concerning installed power capacity of other energy sources for
2017. We estimate, that the installed diesel power capacity increased by ca. 10% similarly to the development of diesel-based power capacity in the previ-
ous year.

Figure 8 Structure of the installed capacity by type of power plant in Yakutia in 2017, *-estimations of eclareon based on the initial
data; source: Head of the Sakha Republic (Yakutia), 2018 [10]
Figure 8 presents information on types of power plants in Yakutia in 2017. The largest part referred to com-
bined heat and power plants (like Yakutian CHPP and CHPP-2) (40.3%), of which 47% are gas powered and
46% run on coal. A bit more than one third of the generation capacity comes from hydro power plants (larg-
est are Viliuyskaya HPP-3 and Viliui HPP Kaskade) and a bit less than a third – from diesel power plants. The
region is the country’s absolute leader in terms of diesel power plants number, there are more than 600 DPPs
of various size, 152 belong to “Yakutskenergo” (of which 136 are integrated into the power net of JSC
“Sakhaenergo”, subsidiary of PJS “Yakutskenergo”). “Sakhaenergo” manages about 200 MW of DPPs, “Ya-
kutskenergo” – about 96 MW. More than 240 MW of diesel generation belongs to other companies, mainly,
mining companies, having own generation and combining mining activities and energy generation activities
(e.g. “Gazprom Burenije”, “Burenergo” etc.) [144]. Renewable energy sources (excluding hydro) only ac-
counted for little more than 0.05% of installed capacity. However, a growing trend regarding the usage of RES
for electricity generation in Yakutia can be observed: the capacity of solar power plants installed in the region
within one year increased by 9% in 2017 [10]. Whether this positive trend is sustainable will depend on a
number of factors such as the increasing awareness for RE solutions among political and industrial decision
makers, the development of diesel prices and the costs for RE solutions. Moreover, the performance of the
recently built RE installations such as the 1 MW power plant in Batagai will play their role for the future devel-
opment of RE in the region.
9,327 million kWh of electricity was generated in 2016. 86.9% of this was generated by power plants located
in the 3 centralized energy zones and the remaining volume was produced in the decentralized zone. The
overall per capita electricity consumption in Yakutia in 2016 was 9,030 kWh/capita and this indicator has
been growing consistently for the last few years. Electricity consumption in 2016 was 8,693.7 million kWh, the
largest share (about 30%) of electricity in Yakutia is consumed by the mining industry (see Figure 9), 22% by
other industries, including manufacturing, and only roughly 10% by private households, which is less than
the electricity losses for the region [10].
Combined heat and
power plants; 1,347; 43%
Hydro PP; 957.5; 31%
Wind PP; 0.04;
0.001%
Solar PP; 1.61; 0.05%
Diesel PP*; 800.0; 26%
dena study „Market study in the context of decentralized energy supply using renewable energy technologies in selected Russian regions“ 33
Figure 9 Electricity consumption in Yakutia by type of consumer, %, 2016; source: Head of the Sakha Republic (Yakutia), 2018 [10]
Due to territorial and climatic conditions, including extreme temperatures and Arctic nights, electricity con-
sumption in the region increases especially (up to 3 times the rate of summer consumption) during winter
across all consumer groups. This increased demand is mainly driven by longer periods of illumination and
the increased use of heat pumps.
Consumer groups are different in off-grid communities where almost all electricity is consumed by residen-
tial customers and the public sector. The primary fuel source for heating purposes in all settlements apart
from Yakutsk is diesel, with the secondary fuel source being wood and coal.
Off-grid settlements with an average load of 700-800 kW are estimated to be big in terms of energy consump-
tion. For them, morning and evening peak loads are rather low: the evening peak, from 6-8 pm, is usually
15% higher than the night load. In small villages the difference between the morning/evening peak loads and
night consumption can reach 30%, which puts additional pressure on the power generating facilities in these
areas.
Yakutia has solar resources of up to 1,100 kWh/m2/year of irradiation in the very southern part and between
700-840 kWh/m2/year in the northern part [164]. A systematic use of solar PV generation facilities in Yakutia
started in 2012, with the construction of the first 60 kW solar PV installation in village of Batamay, followed by
a 30-kW array in the village of Yuchyugey. Nowadays, there are 21 solar PV installations in the region with an
overall capacity of 1.61 MW [10], 6 of which are fully autonomous and are combined with storage systems
[145]. The average diesel savings per each 50 kW of installed PV in Yakutia fluctuates around 15 tons/year [9].
In 2017, RES energy facilities (not including private non-registered facilities) generated 1.07 million kWh
[144], which has led to the overall fuel savings of nearly 300 tons, equivalent to about 13 million RUB (173.4
thousand EUR) [11] [145] . According to calculations, based on the average fuel savings, maximal diesel sav-
ings through functioning of the mentioned 21 PV installations can be as high as 480 tons annually. The most
famous of the current existing PV installations in the region is the SPP in Batagai, which has been included in
the Guinness Book of Records as the most northern SPP in the world. It is also the largest SPP in Yakutia, with
an installed capacity of 1 MW and a net annual energy production of approx. 1,375 kWh [13].
Agriculture0.35%
Mining industry29.20%
Other industries22.08%
Construction of buildings
1.14%
Transport and communications
14.23%
Other 10.85%
Private households / residential customers
10.63%
Losses in grids11.51%

Wind power has started to develop, albeit slowly, as well: the wind park at Bykovskiy cape has a capacity of
40 kW and one much larger wind power park is currently built in Tiksi. Tiksi is located in the arctic zone of the
region and is one of the most northern cities of Yakutia. In Tiksi, the polar night lasts from middle November
until the end of January, which means, that about 3 months it is completely dark there. Combined with the
very good wind power potential, this fact makes Tiksi and similar coastal settlements of Yakutia the most
suitable for wind energy projects. Tixi’s wind park with an installed capacity of 900 kW started its operation in
November 2018 [14]. According to estimations made by the wind park engineers, this wind power plant will
help to save between 450 and 500 tons of diesel annually. It is supposed to decrease the demand for diesel in
Tiksi area by roughly 20% and supply the settlement with electricity. The wind park is a joint project between
RusHydro and the Japanese NEDO corporation. The project also has R&D related aspects regarding testing
the functionality of wind turbines in extremal climatic conditions (wind in this area can reach speeds of 60
m/sec and temperatures may be lower than -600 C). The project is mostly financed by the Japanese corpora-
tion NEDO [12]. Japan is planning to participate further in similar RES oriented projects in the region. All cur-
rent RES generating facilities are managed by RusHydro through their regional subsidiary Yakutskenergo.
PV is mostly compatible with diesel on the off-grid market, where it may expand without additional subsidi-
zation. The size of RES in this market is assumed to vary according to the following scenarios:
approximately 8 MW for 117 remote off-grid settlements (50 to 400 inhabitants in each) with no DPPs’ mod-
ernization and no solar power management systems such as fuel saving controllers
approximately 16 MW for 117 remote off-grid settlements (50 to 400 inhabitants in each) with no DPPs’
modernization but with solar power management systems due to serious diesel equipment deterioration
and the impossibility of successful RES facility operations in current conditions.
more than 30 MW for 117 remote off-grid settlements in case of introduction of energy storage; with serious
storage systems and 70-80 MW SPPs, DPPs can be completely switched off in the spring and summer
months.
This off-grid market is assumed to be 4 to 5 times smaller for wind than for PV because only the Yakutia’s Arc-
tic coastal areas offer favorable conditions for wind parks.
RES projects in Yakutia have been experimental to date and have not been a priority because RE sources are
new and have not yet been able to guarantee a stable power supply as well as having capacity limits and not
being 100% reliable. Nowadays, in typical RES projects, the capacity of wind or PV power generation reaches
no more than 20% of the overall needed capacity, or 10% of the DPP’s nominal installed capacity. The project
in Tiksi, for example, has several parts: installed capacity of a new DPP is 3 MW, overall capacity of the three
wind turbines is 1 MW combined with an energy storage. In the end, all three parts should work in parallel.
In addition to the new RE hybrid solutions, it should be mentioned that there are small-scale RES solutions
used by hunters and nomads, however, are not very common in Yakutia. The common fact about RES for re-
mote areas in Yakutia is that they ultimately lower electricity prices. Transportation costs for diesel and big
distances between the settlements make off-grid remote areas of Yakutia very perspective for PV projects.

dena study „Market study in the context of decentralized energy supply using renewable energy technologies in selected Russian regions“ 35
2.1.2 Electricity tariffs and costs
As mentioned above, Yakutia is located in the regulated tariffs zone, which means that the electricity tariffs
are established by the local government. “Sakhaenergo” bears the costs of power energy generation and dis-
tribution in off-grid areas. However, sine 2019, the two energy zones which got connected to the UPS can pur-
chase power from the wholesale market and are now included into the non-price zone. That means, that
price of energy purchased by “Yakutskenergo” from the wholesale market falls under other regulations and
may change each day and even hour depending on the energy generation costs of the purchased on the
wholesale market power [100].
Yakutia is among the regions with the highest electricity prices. Tariffs for the population vary depending on
the group of consumers (night/day tariff; tariffs for people in rural and urban areas; tariffs for people
with/without electric stoves). In 2019, tariffs for private customers for the main tariff groups are [21]:
rural population, night tariff 2.74 RUB/kWh (0.04 EUR/kWh) – day tariff 4.23 RUB/kWh (0.06 EUR/kWh)
urban population (households with gas stoves9), night tariff 3.91 RUB/kWh (0.05 EUR/kWh) – day tariff 6-03
RUB/kWh (0.08 EUR/kWh)
single rate tariff (no differentiation by daytime or voltage) rural population 4.20 RUB/kWh (0.06 EUR/kWh) –
urban population 5.99 RUB/kWh (0.08 EUR/kWh)
Yakutia has the fourth highest electricity tariffs among Russian regions [17]. However, these tariffs do not re-
flect the real generation costs due to strong subsidization. Moreover, there is a small difference in electricity
tariffs for end consumers in the grid connected settlements and off-grid remote areas, although the real elec-
tricity price w/o subsidies would have to be much higher: according to research for this report, the electricity
costs for production, distribution and sale were on average as high as 10 RUB/kWh (0.13 EUR/kWh) in 2018,
which means that 41%-58.7% of the electricity price for the end customer is subsidized. In some settlements,
the costs are even higher and reach several dozen rubles.
All off grid settlements seriously rely on diesel power plants which work on imported fuel. Liquid fuels, in-
cluding diesel, are imported to the region on an annual basis, there are several ways [138]:
Arctic (marine) way, navigation period is only 30-45 days/a between August and September
Railways, which is weakly developed in the region, there are just some more than 165 km of railways in the
region
River ways, available for 4-4.5 months. This way supplies up to 30% of total annual diesel supply
Automobile way, available only in winter periods. Vehicles pick up the fuel from airports or coastal areas
where the marine ways end and deliver it to the settlements. There is a visible lack of automobile tech-
nique and usually owners of such vehicles in each settlement are monopolists, able to drive the price for 1
liter higher in order to gain profit. This way of transportation is the rarest one.
In 2016, 136 DPPs belonging to “Sakhaenergo” consumed over 670 tons of diesel [147] , while the total vol-
ume of diesel used for electricity generating targets in Yakutia by all power plants in 2017 reached 111,568
tons [144]. Average fuel consumption per 1 kWh is 340-500grams of diesel, reaching 800 and even 1,000
9 Here and further. In Russia, there are different residential tariffs for households with gas and electric stoves. People owning an electric stove instead of a
gas one pay 30% lower tariff that the ones cooking on gas. It is assumed, that households cooking with electricity stoves or having electric heating systems
consume much more electricity and therefore have a right to get a state support (subsidies) making their energy tariffs lower.

grams for old and inefficient diesel generators and costs of fuel form up to 60% of the end electricity price.
Simultaneously, in 2019, price for 1 ton of diesel overstepped 60,000 RUB (800 EUR) and reached 105,000 RUB
(1,400 EUR) for some arctic areas [146]. Therefore, costs of 1 kWh for remote energy systems (also called eco-
nomically justified prices in some sources) in 2016 reached on average 36 RUB/kWh (0.48 EUR/kWh) [20],
while the same economically justified price for centralized isolated energy systems of Yakutia only reached
6.6 RUB/kWh (0.08 EUR/kWh) [37]. In 2019, this average price is supposed to reach 40 RUB/kWh due to the
further rise of diesel prices. In regions that are particularly isolated from railways, grids and big settlements,
the price of diesel generated kWh can reach up to 100 or even 200 RUB (1.3 – 2.66 EUR/kWh) [22]. More than
90% of diesel imported to the region is used for energy generation targets.
In order to make electricity prices affordable for companies, they get cross-subsidization, driving the price
per 1 kWh down. In 2017, electricity prices for industrial consumers on the retail market in Yakutia reached 10
RUB/kWh and on average were 7-8 RUB/kWh (0.09 – 0.10 EUR/kWh) [125]. In the second half of 2017, the elec-
tricity tariff for entities dropped drastically and were 4 RUB/kWh (0.05 EUR/kWh) in 2017 [46]. Simultane-
ously, electricity tariffs in other Russian regions kept growing, which also nurtured cross-subsidization in Ya-
kutia. According to some calculations, each kWh consumed by industrial consumers of Yakutia bears on aver-
age 2.48 RUB (0.03 EUR/kWh) of cross-subsidies for diesel [45] (or simply diesel subsidies).
Type of voltage / type of tariff High voltage
(110 kV and
higher)
Middle first
voltage (35 kV)
Middle second
voltage (20-1
kV)
Low voltage
(0,4 kV and
less)
Single rate tariff, 2/2 of 2018, RUB/kWh (EUR/kWh) with VAT10, electricity for non-residential consumers disconnected
from the UPS, sold by “Yakutskenergo”
Tariff 10.76 (0.14) 11.22 (0.15) 11.78 (0.16) 11.87 (0.16)
Subsidy for tariff's levelling 5.49 (0.07) 5.76 (0.08) 6.07 (0.08) 6.013 (0.08)
Single rate tariff incl. Subsidy 4.29 (0.06) 4.42 (0.06) 4.55 (0.06) 4.62 (0.06)
Double-rate tariff, 2/2 of 2018, RUB/kWh (EUR/kWh) with VAT
Night tariff 8.92 (0.12) 9.29 (0.12) 9.77 (0.13) 9.83 (0.13)
Subsidy for tariff's levelling 5.49 (0.07) 5.76 (0.08) 6.07 (0.08) 6.13 (0.08)
Night time tariff incl. Subsidy 2.43 (0.03) 2.50 (0.03) 2.60 (0.03) 2.60 (0.03)
Day tariff 11.59 (0.15) 12.08 (0.16) 12.64 (0.17) 12.77 (0.17)
Subsidy for tariff's levelling 5.49 (0.07) 4.76 (0.06) 6.07 (0.08) 6.13 (0.08)
Day time tariff incl. Subsidy 5.11 (0.07) 5.29 (0.07) 5.46 (0.07) 5.53 (0.07)
Some electricity tariffs for 2019 for energy, generated by “Sakhaenergo” and purchased by “Yakutskenergo” accord-
ing to the purchase agreements. No voltage level differentiation, RUB/kWh (EUR/kWh) with VAT
Single rate tariff for settlement
Yuren, Verkhnevilyuyskiy region 600.45 (8.01)
Single rate tariff for settlement
Toyon-Ora of Hangalas municipal
district
228.40 (3.05)
Single rate tariff for settlement
Sayylyk Ust-Janski ulus municipal
district
80.21 (1.07)
10 VAT in 2018 = 18%; VAT since 2019 = 20%

dena study „Market study in the context of decentralized energy supply using renewable energy technologies in selected Russian regions“ 37
Average price for all decentralized
settlements served by
“Sakhaenergo”
40-80 (0.53 – 1.07)
Electricity tariffs (prices) in 2019, RUB/kWh (EUR/kWh) with VAT, electricity for non-residential consumers dis-
connected from the UPS, sold by “Yakutskenergo”
Single rate tariff (economically justi-
fies price) 84 (1.12)
Subsidy for tariff's levelling 78.37 (1.05)
Single rate tariff incl. Subsidy 5.63 (0.08)
Table 4 Some tariffs for the retail market’s consumers (except from population) of the electricity provided by “Yakutskenergo” and
energy price purchased by “Yakutskenergo” from “Sakhaenergo” according to the sales contracts ; source: Yakutskenergo, 2018 [21],
Sakhaenergo, 2019 [137], Yakutskenergo, 2019 [151]
Such high tariffs in the category “electricity tariffs for energy, generated by “Sakhaenergo” and purchased by
“Yakutskenergo” are basically economically justified energy prices for isolated (remote) areas of Yakutia,
which may be extremely high due to high costs of diesel, diesel transportation and OPEX (many DPPs are sev-
eral dozen years old and need regular reparations). However, end consumers purchase energy for more or
less affordable prices: “Sakhaenergo” sells energy to “Yakutskenergo” for these economically justified prices,
then “Yakutskenergo” sells energy to the end consumers. All losses of guaranteeing suppliers and difference
between the economically justified and end consumer price are compensated with the help of subsidies: “Ya-
kutskenergo bears the price difference, then it gets money back from the local government as a direct sub-
sidy. The local budget allocates around 7 billion RUB (approx. 93 million EUR) of subsides annually to cover
the difference between the real electricity price and tariffs paid for by the end customer (basically cross-sub-
sidization) and the sum is growing annually [18]. These subsidies are re-financed by funds from the federal
budget [19]. As an example, subsidies for non-residential consumers take 93% of the real energy price (Table
4). On average, up to 65% expenditures in energy supply payments in Yakutia come from local budgets.
As mentioned above, since 2019, two more regional energy systems of Yakutia got connected to the UPS,
which means, that the largest power plants located in these zones (s.a. Yakutian CHPP and CHPP-2, Vili-
uyskaya HPP) will now deliver energy not directly to the regional consumers, but to the wholesale market
through the UPS grids. Simultaneously, “Yakutskenergo” will purchase electricity from the same wholesale
market according to the wholesale market prices changing every hour. This is supposed to drive prices in the
southern, central and eastern energy systems of Yakutia down due to lower costs of energy transmission and
lower costs of energy generation [149]. Unlike prices formation earlier, when these energy systems referred
to “technologically isolated energy systems” and the price was fixed, now prices obey the rules of the non-
price zone and wholesale market prices will change monthly. As connection to the UPS is costly, these ex-
penses should be reflected in the price for transmission services and split between users of the new grid. Res-
idential consumers will still be subsidized, while large industrial consumers will pay for energy transmission
services, as they also consume energy from the wholesale market and this will allow to refund money spent
on the connection to UPS [100]. A representative of the tariff committee of Yakutia stated, that now it would
be especially important for non-residential consumers to keep their hourly consumption in line with the
planned one, because deviation will cause extra expenditures.

2.1.3 Extreme cases of high electricity costs in Yakutia
In Yakutia, there are some extreme cases of energy generating costs: there are 7 settlements where electricity
generating costs overstep 200 RUB/kWh (2 EUR/kWh) and 2 settlements for which this value is higher than
600 RUB/kWh (8 EUR/kWh) [137]. According to the Decree of the State Committee for Pricing Policy of the Re-
public of Sakha (Yakutia) N 225 of December 28th 2018, which approved establishment of the electricity tariffs
for the energy generated by “Sakhaenergo” and sold to “Yakutskenergo”, the highest tariffs in 2019 were the
following:
Suchchino settlement, located in the North-Eastern part of Yakutia 60 km from the larger settlement, elec-
tricity costs for 2019 are 660 RUB/kWh (9.25 EUR/kWh), this settlement is located in a remote area difficult
to be reached by any type of transport. The DPP located there is operated by “Sakhaenergo” and generates
power for 57 inhabitants.
Electricity demand of settlement Jyuren, where cost of 1 kWh is 600.45 RUB (8.41 EUR), is covered by a
small DPP and a PV system of 3 kW installed capacity with an energy storage system.
Troitsk settlement, located on the crossing of the Lena and Oijokma rivers in Southern Yakutia. Although
being close to the three energy regions of Yakutia, this settlement refers to the areas with autonomous en-
ergy supply, a local DPP with an installed capacity of less than 1 MW is run by “Sakhaenergo” and supplies
327 people with electricity. There the generating costs are 275.5 RUB/kWh (3-86 EUR/kWh).
Village Verkhnaya Amga on the banks of the Amga river southern from Yakutsk. The settlement is served by
a DPP of “Sakhaenergo”, generating electricity for 253.42 RUB/kWh (3.55 EUR/kWh). However, in summer,
the 27 inhabitants get energy exclusively from a local PV station with an installed capacity of 36 kW with a
lead-carbon storage system constructed in 2016.
Toyon-Ary settlement, inhabited by 170 people, located on an island in the Lena river about 100 km from
Yakutsk, also has a hybrid diesel-PV station with a PV part of 20 kW capacity, 2 diesel genset 30 kW each
and 96 kWh. While usual diesel consumption without PV part fluctuates around 170 kg/day, with a PV part
this volume drops to 60 kg/day which results into savings of 2.93 tons of diesel per annum. Electricity gen-
erating costs are 228.4 RUB/kWh (3.20 EUR/kWh).
Village Tinnaja, 46 inhabitants, supplied by a 70 kW DPP of “Sakhaenergo” and having electricity generat-
ing costs 223.93 RUB/kWh (3.14 EUR/kWh).
Innyuakh village on the banks of the Lena river close to the Southern border of Yakutia also has high elec-
tricity costs – 220.32 RUB/kWh (3.08 EUR/kWh). 103 people live in the settlement and their electricity de-
mand is covered by a local DPP and, since 2016, by a 20 kW PV power station. A PV part helps to save about
0.15 tons of diesel per year.
Three of six mentioned settlements have PV-based generating facilities. These costs are taken from a docu-
ment prepared by “Sakhaenergo”, it is however not specified there, whether the mentioned energy costs are
a result of only diesel-based generation, or if the investments into PV systems are also included into these
costs and amortization of the PV equipment is the reason driving electricity costs up. It is more likely, that
these costs are made up of only diesel-related expenses (incl. DPP maintenance costs).

dena study „Market study in the context of decentralized energy supply using renewable energy technologies in selected Russian regions“ 39
2.1.4 Regional business environment & specific legal and regulatory framework for energy supply
Stakeholders participating in any project targeting the construction and implementation of any new power
generating facility differ depending on the peculiarities of the project and exact region of implementation
(whether it is an on- or off-grid project). Nevertheless, there exists a common scheme of relations between
various stakeholders which can be considered the backbone of the process (see Figure 10)
Figure 10 A common scheme of relations between different stakeholders while implementing a new project; source: Eurosolar Russia
Research, 2018
In 2016, there were 675 diesel generators and turbines of power plants of different sizes, with a large share of
them being old and requiring much maintenance, resulting in low efficiency overall [10]. The equipment is
supposed to be replaced or renovated within the next 10 years, but this plan has not been formalized and
accepted by the local government yet. Currently diesel infrastructure is not being replaced with more energy
efficient equipment or RES on a large scale due to scarce financial sources of “Sakhaenergo”: in 2016 and
2015 the net profit of the corporation was negative and only became positive and equal in 2017 with 13,315
thousand RUB (177,586 EUR) [7]. Simultaneously, there is also a lack of supporting mechanisms. There is an
unofficial plan to build 120 diesel/PV hybrid power plants in Yakutia in the near future, but this plan has not
been formalized yet and there is no regional decree enabling and enforcing such a program. The region
would also need special funding from the federal budget to achieve this.
In present conditions, about 2% of the overall diesel-based capacity is being replaced per annum and usually
it refers to equipment in a critical condition, which is most often replaced with modern diesel generators,
Government of Sakha
Republic
Fixed electricity
tariff
„Yakutskenergo“ (RusHydro)
(energygenerationand el. Fromthe wholesale market)
Electricity supply
of the region
Potential
investor
Negotiations with
„Sakhaenergo“ OR newparallel energy
distributingsystem
(practically impossible)
„Yakutskenergo“
(RusHydro)Mixtireof the electricity
transmission/distribution costs of
„Yakutskenergo“ with
the costs from„Sakhaenergo“
RES energy supply
contract, priceof which will not make the local
electricity tariffs‘ growth
higher than the inflationrate
„Sakhaenergo“
(„Yakutskenergo“) (energygeneration)
such as the Chinese and Russian YAMZ11 50-150 kW diesel generators. In case an area needs a new power gen-
erating facility, a new DPP is normally built close to an old one to get the fastest and cheapest connection to
the existing heat and power grid.
Currently, there are no specific support schemes for RES development in Yakutia. However, some schemes
could be developed in the near future due to the rising popularity of RES and the plans of RAO EES of the East
and RusHydro to increase RES based capacity of the Far East up to 146 MW.
Yakutia falls within the scope of the core RES oriented laws, listed in section 0 of the report. Nowadays, De-
cree 47 is not enabled in Yakutia due to a number of reasons and are not strengthened by the local decrees.
Among the reasons why the Decree 47 is not enforced are:
Decree 47 does not contain directions to develop RES in isolated areas. It is not clear, how RES projects
should be developed in such areas;
The principles of holding regional competitions for the selection of renewable energy facilities aimed to
work for the retail electricity market are not formed and described in the decree;
There is contradiction between Decree 47 and higher level’s Decree 1178 “Regarding regulated tariffs” that
stipulates how tariffs in the Far East are calculated. Basically, Decree 1178 does not contain a norm to in-
clude RES costs from Decree 47. So, it is unclear, how the tariffs for RES-based power plants working on the
retail energy market should be set.
Additionally, there is a local law 1380-3 N 313-V “About the Renewable Energy Sources of Republic of Sakha
(Yakutia)” of November 27, 2014 and with changes from February 28, 2017. The major points of the law are
[23]:
Definition for technologically isolated (remote) power system: a technologically isolated territorial electric
and power system, which has an installed capacity of not more than 25 MW;
Definition of the necessity of legislative, economic and organizational stimulation of energy efficiency and
decline of the negative impact on the environment with the help of increase of the RES and peat combus-
tion shares in energy generation;
Definition of the roles of state institutions and municipalities in the process of RES development.
Mentioning of the necessity of supporting mechanisms’ development: creation of the feed-in tariff/ “green
tariff”, stimulation of investment inflows, creation of tax incentives for RES developers, creation of comfort-
able conditions for investors in RES, etc.;
Among others, creation of the special fund to provide financial support to RES development. The roles of
sources for the fund’s creation are: savings from the replacement of conventional energy sources with RES;
budget money of the Sakha Republic; part of the federal budget money received from the Russian budget
for the aim of regional programs of energy efficiency and RES development;
Allocation of lands for construction of RES power plants.
11 Rus. ЯМЗ – Ярославский Моторный Завод – Jaroslawl Engine Factory, supplies major Russian vehicle producers (e.g. GAS group and some military or-
ganizations)

dena study „Market study in the context of decentralized energy supply using renewable energy technologies in selected Russian regions“ 41
The law is one of the first steps towards regional RES support, although the mentioned fund has not been
created yet and the law does not provide any details about the concrete mechanism of the support schemes
such as land allocation and “green tariffs”.
2.1.5 Regional specific business case
The largest SPP of Yakutia is renowned for being the world’s largest solar power plant located in the Arctic
Circle. The SPP is located in the Batagai urban settlement12, which has a population of 3,676 (for 2017) peo-
ple inhabiting 150 private houses and 1,700 apartments. Batagai is located in the permafrost areas, the aver-
age temperature of the coldest month (January) is -41.80 C, while the lowest temperature can reach -600 C.
For half the year the sun sets at around 2 p.m. The transport connection to the settlement is only possible in
winter, when the Jana river and the near lying swamps are frozen [24]. Therefore, during warmer seasons,
the settlement gets fuel by air transport, which increases electricity prices for end-consumers by up to 35
RUB/kWh (0.46 EUR/kWh), should there be no subsidies available [24]. End-consumers pay on average
around 5 RUB/ kWh (0.06 EUR/kWh) and gap of 30 RUB/ kWh (0.40 EUR/kWh) is subsidized.
Before the solar power plant in Batagai was built in 2015, the existing diesel power plant owned by
“Sakhaenergo” had been in operation for 30 years and was outdated despite being the only electricity source
in the area. The DPP consists of 12 diesel generators with an installed capacity of 11 MW. The single units are
switched on and off when necessary. Average annual diesel consumption reached 6,000 tons and annual
electricity generation amounted to 23,200 MWh. Winter consumption is roughly three times higher than sum-
mer consumption. For instance, in 2012, the peak load in winter reached 5.18 MW and the peak load in sum-
mer was 2 MW. The new solar plant has been integrated into the existing power supply system of the village
and, combined with the DPP, leads to an average specific fuel consumption’s savings of 28 grams/kWh which
ends up into between 250 and 300 tons of diesel saved annually [25].
The CAPEX of the solar power plant amounted to approx. 200 million RUB (2.66 million EUR) and is expected
to function for at least 25 years which means that the solar power plant will remunerate itself 4 times within
the period should it be successful [26]. This power plant was a joint project of RAO EES of the Far East and
Yakutian government and is a part of the RAO EES of the Far East’s program to implement RES into local en-
ergy systems. The PV modules of the solar power plant were produced by a Chinese company Suntech
Power.
2.1.6 Business model description
The PV diesel hybrid installation of Batagai, which serves residential customers is used as an emblematic
business model for the region. In this model diesel savings represent the revenues of the PV installation and
the power consumer, investor and plant operator are the same entity. In this business there is one central
player, Sakhaenergo, assuming the roles of equity investor, borrower, operator, EPC contractor, O&M services
and grid operator.
Some of these activities are realized in conjunction with the local off-grid communities which are powered by
diesel generators and the regional government, finance may be partially provided by banks or the govern-
ment but the key role of Sakhanergo is undisputed. As state-owned company Sakhaenergo is moreover also
12 Rus. Поселок городского типа – a city-like settlement, between a town and a big village.

bound to procure from Russian manufacturers when possible. In case of project development, specific steps
need to be undertaken to develop the PV array. These steps are presented in Figure 11 below. The scheme
includes actors needed for each step and duration of the process.
The overall duration of the project’s implementation is usually about 1.5 years for a solar power plant, 2.5
years for a wind park. It includes the following steps:
Before starting the project, it is necessary to negotiate with local authorities, local distribution grid compa-
nies and ministries responsible for permits (e.g. Ministry of Housing and Public Utilities). These negotiations
take about 2 weeks; the process can however last longer. Delays may occur due to the poor communication
between different agencies, ministries and administration departments, one has to address each utility sepa-
rately and sometimes several approaches are needed before the necessary reply is received. Moreover, alt-
hough the power plant’s connection to the grid is in step 5 of the project’s flow, negotiations with a grid com-
pany (for most of the territory it is Sakhaenergo) should be completed before the project starts. This is essen-
tial because of the “technical conditions” requested by the grid company: it is important to discuss the con-
nection voltage and specifications of the transformer, agree on the capacity of the RES power site for its com-
patibility with an existing DPP and discuss other operational and connection peculiarities.
Figure 11 Scheme of the project's flow; source: based on the research completed by eclareon and partners of the project
It is important to take into consideration that, due to climate conditions, there is only a short period between
May and October which is suitable for construction. In case the works are not completed within this period,
construction has to be put on hold for months. Additionally, transportation of equipment is possible only in
the winter period between December and April when the roads are frozen and between June and September
when the equipment can be transported using waterways rivers are not frozen.
Investor/ist turnkey
contractor
Duration: About 1-1.5
years for wind measurments; 1-2
weeks in summer for
solar
Site selection
Investor/ist turnkey contractor;
local agencies, administration(e.g. Ministry of Housing and
Public Utilities, Ministry of
Energy of the Republic)
Duration&costs: 2-3 months for
getting permissions fromadministrationin case the land
is not private; 2 months for
geological rospect (preferablyin spring whenpermafrost is
the most stable). 10-40 thousand USD
Geological study and
corresponding
permissions
Investor/ist turnkey contractor;
local agencies, administration(e.g. Ministry of Housing and
Public Utilities, Ministry of
Energy of the Republic)
Duration: ca.2 monthsafter the
design is ready. Costs shouldnot exceed10 thousand USD
and paid to egineeringcompany
to get an approval
Construction
permissions
Project Flow
Steps
Investor/ist turnkey contractor,
construction and transportationsubcontractors
Duration: 1 year (1.5 for wind
projects). Transportation betweenDecember and April (2-
3 months); construction best
May-October (2-3 months). May vary dependingon the site and
size of the project & qualificationof subcontractors
Construction
Local grid company
(„Sakhaenergo“ in 90% ofcases)
2-3 months dependingon the
condition of a transformer and availability of grid connectionpoints. Can be done in parallel
with construction works
Utility connection
Investor/ist turnkey contractor,
„Rostechnadzor“*, local gridcompany
Up to 1 month, costs are
included into the contract‘sprice
Commissioning and
testing

dena study „Market study in the context of decentralized energy supply using renewable energy technologies in selected Russian regions“ 43
2.1.7 Profitability analysis (inputs, outputs, scenarios, sensitivities)
In the following, an exemplary profitability analysis for a 1MW PV project, based on diesel power savings is
presented. The reference model for this business case is the 1MW installation in the village of Batagai. The
known input data was partially updated due to the fact that the plant was already constructed in 2015.
The results of the calculations show that the payback period for the equity investment is about 10 years and
that the equity IRR is > 20%. These results suggest that the realization of a project such as Batagai is econom-
ically viable. It needs to be noted that the models used in this report calculate the payback period using the
time value of money concept. This means that future cash flows are discounted with a discount rate. This
concept is based on the assumption that money available now is worth more than the identical sum in the
future due to a potential earning potential of money. In simple terms this would mean that 10 RUB in the fu-
ture are worth less than 10 RUB earned today. In our calculation, equity cash flows are discounted with a cer-
tain rate (e.g. 10%). Practitioners often do not use the time value of money but the nominal value which
means that 10 RUB today are worth as much as 10 RUB in a year from now. If this concept were applied in-
stead of the time value of money concept the calculated payback period would be shorter.
The input parameters, main assumptions and results of the calculated base case scenario of the profitability
analysis are summarized in the following figure:
Figure 12 Project Overview – Batagai 1 MW diesel PV hybrid; source: eclareon calculations, based on input data researched by EUROSO-
LAR Russia, 2018
PV System System Operation
Project Duration Years 20 Aplied Yield kWh/kWp/a 800
PV System Size kWp 1.000,00 Average Yearly Generation kWh/a 724.541
PV Battery Capacity kWh - Self-Consumption Rate % 95%
Total System Cost RUB 156.000.000 Genset efficiency kWh/ltr 2,50
Global Horizontal Irradiation kWh/qm/a 1.000 Average Replaced Diesel Consumption ltr/year 275.326
Performance Factor % 80% Diesel Price (1st Ops Year) RUB/ltr 69,67
Degradation % p.a. 1% Diesel Price Escalation % p.a. 10%
Total Battery Replacement Costs RUB - Fixed Operation Costs RUB p.a. 2.340.000
Longterm Insurance Costs % p.a. -
Debt (Gearing) 60% RUB 93.600.000 Net-Present Value RUB 161.024.859
Loan Tenor Years 8 Project IRR % 18,8%
Grace period Years 1 Equity IRR % 21,7%
Debt Interest Rate % 10% Payback Period Years 10,14
Initial Equity RUB 66.100.895 LCOE (no subsidy) RUB/kWh 30,91
Additional Equity RUB 1.449.486 Min DSCR** x 0,85 x
Discount Rate % 10% Min LLCR*** x 1,32 x
Longterm Inflation Rate % 4% * LCOE: Levelized Cost of Electricity
** DSCR: Debt Service Coverage Ratio
*** LLCR: Loan Life Coverage Ratio
Financing Results

The cash flows from the perspective of an equity investor are shown in the next graph:
Figure 13 Equity Cash Flow – Batagai 1 MW diesel PV hybrid; source: eclareon calculations, based on input data researched by
EUROSOLAR Russia, 2018
As can be seen, the cash flow available to pay back the equity investment is low in years 1-8 when cash flows
are primarily used to pay back debt which accounts for 60% of the overall investment. After all debt has been
paid back after year 8 the cash-flow available for the equity investor increases. The cash flow available for
equity also increases year by year based on the assumption that the diesel that is replaced by solar power is
becoming more expensive every year. Under the chosen financing conditions (loan tenor of 8 years with a 1-
year grace period), the diesel savings are sufficient to repay the loan. Additional equity may however be re-
quired after year 1 in order to operate the plant. The equity is paid back after approx. 10 years. In the graph
this is illustrated by the blue line crossing the horizontal x-axis.
The next figure shows the development of revenues, debt service and the operations costs over time. O&M
costs are escalated with the RUB inflation rate, since the revenues (diesel purchases) are also in RUB and it is
assumed that O&M will be contracted and paid in RUB as well. As long as the red-shaded area in the graph
covers the bars which represent debt service (interest and repayment of the principal) and O&M costs, the
cash flows of the project suffices to cover these costs. Debt service is no longer needed from year 9 onwards
given the loan tenor of 8 years.
-100.000.000
-50.000.000
0
50.000.000
100.000.000
150.000.000
200.000.000
0 1 2 3 4 5 6 7 8 9 10 11 12 13 14 15 16 17 18 19 20
RUB
Operations Year
Investment and Cash Flow for Equity
Cash Flow for Equity Equity Investment Cumulative Cash Flows

dena study „Market study in the context of decentralized energy supply using renewable energy technologies in selected Russian regions“ 45
Figure 14 Project Cash Flows – Batagai 1 MW diesel PV hybrid; source: eclareon calculations, based on input data researched by
EUROSOLAR Russia, 2018
The following sensitivities show how the payback period for the equity (amortization) and the equity IRR
would change if some key input parameters were modified. The results of the base case scenario with an eq-
uity payback period of 10.1 years and an equity IRR of 22% are shown in rectangles of each graph.
The “Specific Yield” sensitivity shows how the equity payback period and the equity IRR would change if the
same installation were installed in an area with different solar irradiation. When the specific yield increases,
meaning if there is more irradiation available at a specific place that can be converted into electricity, the
equity IRR increases and the payback period decreases. The respective values can be found when moving
from left to right on the horizontal axis that shows different yield values. In the base case the global tilted ir-
radiation was at 1.000 kWh/kW/pa. The fact that not all of this irradiation can be converted into electricity is
accounted for by the performance factor that is set to 80%. The base case therefore assumes an applied yield
of 800 kWh/kWp/a that can be converted into electricity. If this value were higher, for instance at 1.000
kWh/kWp/a, equity payback could already be reached after approx. 8 years and the equity IRR would in-
crease to approx. 27%.
0
20.000.000
40.000.000
60.000.000
80.000.000
100.000.000
120.000.000
1 2 3 4 5 6 7 8 9 10 11 12 13 14 15 16 17 18 19 20
RUB
Operations Year
Revenues, Debt Service and Operations Cost
Revenues and Savings Debt Service O&M Cost

Figure 15 Specific Yield Sensitivity – Batagai 1 MW diesel PV hybrid; source: eclareon calculations, based on input data researched by
EUROSOLAR Russia, 2018
Another sensitive factor is of course the system price. This is illustrated in the next figure. The base case val-
ues are again shown in rectangles. In this case, the payback period increases when the system price is higher
than in the base case calculation. The researched price per kWp for the Batagai installation was at 156.000
RUB/ kWp (approx. 2.500€ at 2015 conversion rates). This price may seem rather high for a 1MW PV system
without storage. However, it needs to be reminded, that the systems described in this report are no standard
solutions as they may be found in other regions. The installations in isolated territories need to be designed
in such a way that they can withstand harsh weather conditions. Another factor that can explain a rather high
prices is that the installation of PV and other RES in Russia is a rather recent phenomenon which means that
actors did not yet have the chance to accumulate years of experience. However, once projects become more
standard and more experience is accumulated, costs may go down. What this means for an equity investor
can for example be seen when looking at the results for the payback period and the equity IRR if the system
price were assumed to be at 140.000 RUB/kWp: in that case, payback would decrease to approx. 9 years and
equity IRR would increase to approx. 24%.
14,9
12,911,3
10,19,2
8,47,5
10,113%16%
18%21%
23%25%
27%30%
22%
500 600 700 800 900 1.000 1.100
Specific Yield [kWh/kWp/a]
Amortization [a] Equity IRR [%] Base Case

dena study „Market study in the context of decentralized energy supply using renewable energy technologies in selected Russian regions“ 47
Figure 16 System Price Sensitivity – Batagai 1 MW diesel PV hybrid; source: eclareon calculations, based on input data researched by
EUROSOLAR Russia, 2018
Moreover, the diesel price today and its development over time play an important role for the business case.
This is shown in the following two graphs.
Figure 17 Diesel Price Batagai 1 MW diesel PV hybrid; source: eclareon calculations, based on input data researched by EUROSOLAR
Russia, 2018
6,48,0
9,110,1
11,212,3
13,5
10,1
34%
29%
26%23%
21%19%
17%15%
22%
100.000 120.000 140.000 160.000 180.000 200.000 220.000
System Price [RUB/kWp]
Amortization [a] Equity IRR [%] Base Case
14,9
12,911,3
10,19,2
8,47,5
10,113%16%
18%21%
23%25%
27%30%
22%
40,00 45,00 50,00 55,00 60,00 65,00 70,00 75,00 80,00 85,00 90,00 95,00
Diesel Price [RUB/ltr]
Amortization [a] Equity IRR [%] Base Case

The diesel price in the base case was assumed to be at nearly 70 RUB/ liter. These costs are relatively high
compared to standard pump prices in Russia. This higher price is explained by the challenging logistics when
it comes to bringing and storing diesel to an isolated territory. The higher the diesel costs the better the PV
business case from the perspective of an investor. As mentioned in the text, RES were installed in remote ar-
eas with the motivation to bring down electricity supply costs which are defined primarily by high diesel
costs. The big advantage of PV is that there are hardly any logistic costs for transportation and storage during
operation. If the base case assumption were changed, the graph of the diesel price sensitivity (Figure 17)
shows that, with a diesel price higher than 70 RUB/ liter, the payback period goes down while the equity IRR
goes up. At a location with even more challenging logistical conditions than Batagai, diesel could for instance
cost 85 RUB/ liter which would lead to a payback period of approx. 8 years and an equity IRR of approx. 26%.
Another sensitivity that has an impact on the key results of a business case is the future development of die-
sel prices. An investment is paid back over time which means that it is necessary to estimate how certain crit-
ical parameters will develop over time. Future diesel prices are not assumed to stay as they are today. The
annual diesel price escalation in the model was assumed to be at +10%. If this rate were higher the payback
period and the IRR for the equity would change accordingly: an annual diesel cost increase of 12% would de-
crease the payback period to less than 10 years and increase the equity IRR to 24%. However, it can of course
also be assumed that the diesel prices escalation is lower than in the base case. If that were the case, the
payback would increase and the IRR decrease. E.g. if the price escalated only by 6% p.a., equity payback
would increase to approx. 13 years and equity IRR would be at approx. 16%.
Figure 18 Diesel Cost Escalation Batagai 1 MW diesel PV hybrid; source: eclareon calculations, based on input data researched by
EUROSOLAR Russia, 2018
2.1.8 Potential for cooperation/business opportunities and recommendations
The RES market in the region is at a nascent state and there are both pros and cons for the perspective of RE
deployment in the dece0ntralized energy areas of Sakha Yakutia.
17,4
13,9
11,910,6
9,710,1
3%
6%
10%
13%
16%
19%
22%
24%
22%
-4% -2% 0% 2% 4% 6% 8% 10% 12% 14%
Diesel Cost Escalation [% p.a.]
Amortization [a] Equity IRR [%] Up Case

dena study „Market study in the context of decentralized energy supply using renewable energy technologies in selected Russian regions“ 49
Positive factors:
In Yakutia, many remote settlements are cut from the grid and need alternative energy sources. Although
the two energy regions of Yakutia are now connected to the United Grid of the East, which is a part of UPS,
remaining territory will remain isolated for years to come. It is hard to predict when the decentralized en-
ergy region of Yakutia (northern energy region) will be connected to any grid;
Due to the fact, that large industrial energy consumers will bear the costs of UPS expansion and pay more
for energy transition services, it is likely that their energy bills increase within the nearest time. This may
become a strong encouragement to found an own generation facility and avoid paying high transmission
fees (same as similar consumer groups make in other regions). PV-diesel/wind hybrid systems are a suita-
ble solution;
Currently existing DPPs are mostly outdated and most of them will need to be replaced or at least updated
to satisfy additional capacity in the next 10 years. This could at least be partially done by using RES. The
older the diesel generators, the smaller the installable PV capacity is, assuming that no further technical
upgrades are done (fuel save controllers etc.);
Diesel costs are showing a rising trend, which is driving diesel-based electricity prices up further and is
leading to the growth of subsidization and cross-subsidization in order to keep the prices low for the end
customer. Energy supply companies also have a motivation to develop RES, as the difference between the
real electricity costs and the price a consumer pays is significant, even in regard to commercial and indus-
trial consumers which pay higher prices than private households;
RAO EES of the East and RusHydro have announced ambitious plans to deploy RES in Yakutia. This will at-
tract more investments in the region and will most likely push local policy makers towards creating addi-
tional support schemes and legislative frameworks to make PV and wind development in Yakutia more fea-
sible;
Yakutia is a region rich in natural resources, with both existing and planned mining sites supplying the re-
gion’s electricity needs. RES could serve as a form of relief for mining companies, which usually operate in
remote areas. These solutions could reduce the operational costs of extraction, leading to lower final good
costs and an increase of the net profit;
The majority of settlements in Yakutia have poor transport communications, as some villages can only be
reached by air transport for half a year. For these settlements, diesel costs are even higher due to transpor-
tation costs and there is the additional risk of blackouts when diesel is not delivered on time. RES would at
least partially decrease this dependence;
From an economic perspective, high diesel costs make the payback of PV investments possible.
2.1.9 Risks and barriers
Logistics are a challenge: access to the region is difficult because of the geographical location, meaning
that there is only a short timeframe to construct RE plants due to climate conditions;
The climate conditions make wind and PV solutions a fringe energy source. A new supplier who has no ex-
perience in such severe and cold climate conditions (e.g. in Canada, Alaska etc.) must take this into consid-
eration;

Typical PV business cases in the region are ones where settlements are currently supplied by diesel and
upgraded with solar PV; in these cases, diesel remains the main energy source, and PV only supplies max.
10- 20% of the electricity;
There is no significant RES market in the region and foreign entities need to care about marketing, logistics
and search for partners on site themselves;
In theory, the maximum cumulated market size or the upgrading of remote villages would be 80MW (with
storage technology, modern switching technology etc.). The more realistic market size (spread over the
next 5-10 years) is 8-30 MW, annual 2 – 6 MW. The larger the RE share in the hybrid solution the more up-
front CAPEX investments are needed to upgrade diesel generators and introduce modern control technolo-
gies etc. It is doubtful that the central player Sakhaenergo is willing and/or able to pay more than the mini-
mum required CAPEX. So, the Batagai technical solution could be considered a role model;
The current Russian subsidy systems (cross-subsidies and direct subsidies) are designed and targeted to
reduce operating costs (OPEX), resulting in high diesel costs. However, there are no direct investment sub-
sidies that would reduce the high initial CAPEX needs;
The largest existing PV installation is Batagai, with a 1 MW installation. Batagai also has a population of
[45] approx. 3,500 people, most of the other off-grid villages are smaller, hence 1 MW projects will remain
an exception and the bulk of the projects will be most likely smaller despite other official annulments;
Despite the plans announced, there are currently no plans as to when and which village will be upgraded
with PV;
Regional and federal RE (Decree 47) laws have been put in place but have proven to be rather ineffective.
Decree 47 has to be implemented by all Russian regions before its directives are applicable to the region. In
Yakutia, this decree has not yet been implemented into the legislative framework, so the decree does not
work in the region yet;
In order to take part in the diesel upgrade projects you need to be in touch with Sakhaenergo; you can usu-
ally only do business when you are in personal contact with them. If you are not well connected there is no
real chance of doing business with them;
There is a lack of motivation among local administration representatives to encourage and speed up the
permits needed for a project;
Conflicts of interest between different branches of local administration. For example, there might be differ-
ent opinions about the same issue from the side of representatives of municipal and federal levels, how-
ever such conflicts are often thinly veiled;
Scarcity of qualified workforce and subcontractors. Since the market of RES oriented maintenance and ser-
vices is just beginning to develop, most of the players have lack of experience in this field;
There is an intrinsic lack of support, initiative and understanding from energy suppliers and grid compa-
nies. These companies have poor motivation to work with independent energy producers although their
ideas and projects result in saving fuel. One of the main reasons for this is the pricing strategy of
Sakhaenergo, where low energy production costs drive down electricity tariffs resulting in less profits for
the company. The reliability of energy supply from new RES-based energy sites is often uncertain in these
regions and therefore a major barrier to entry.

dena study „Market study in the context of decentralized energy supply using renewable energy technologies in selected Russian regions“ 51
The RE market in Yakutia was launched with a number of pilot projects because using renewable energy
sources, especially solar PV, makes sense from an ecological and from an economic point of view. However,
the market is still rather small today and it is unclear when it will be exploited on a larger scale. Moreover, the
role of state-owned Sakhaenergo is central and their decision processes are not transparent. As a conse-
quence, opportunities for German PV/RE companies are limited, especially for small and medium sized com-
panies. Those who want to invest in business development activities in Yakutia must approach key stake-
holders themselves and this challenging and time costly.
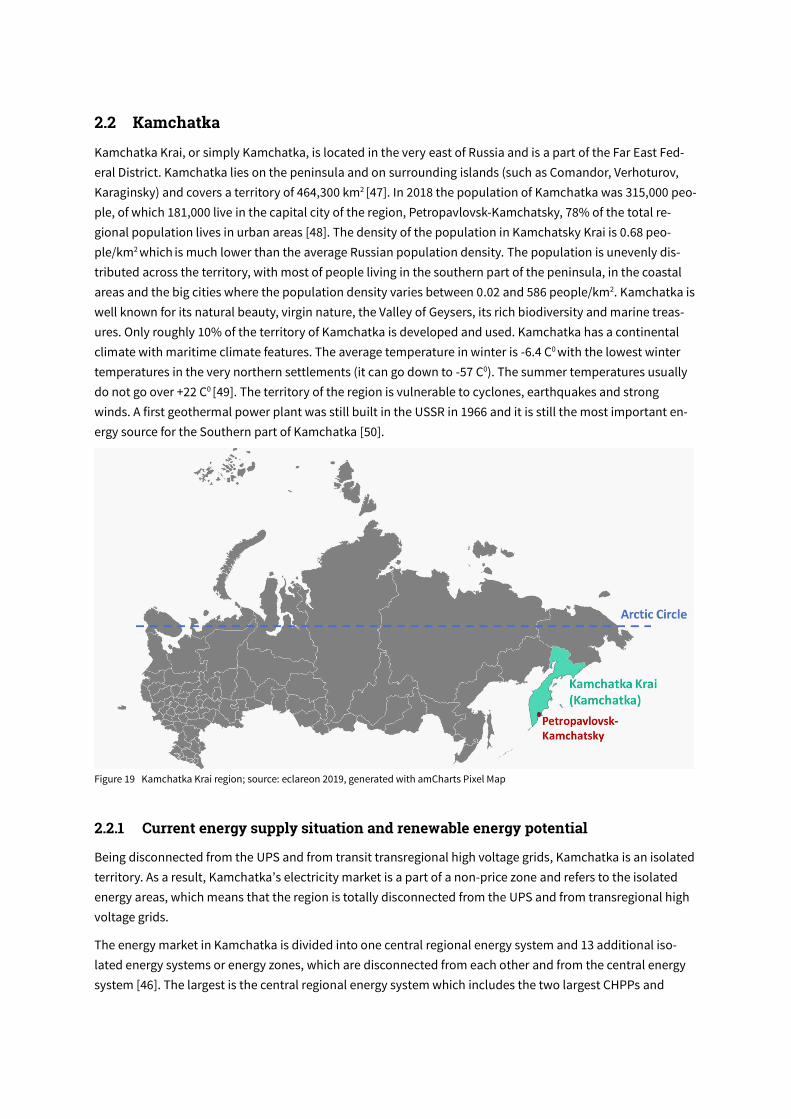
2.2 Kamchatka
Kamchatka Krai, or simply Kamchatka, is located in the very east of Russia and is a part of the Far East Fed-
eral District. Kamchatka lies on the peninsula and on surrounding islands (such as Comandor, Verhoturov,
Karaginsky) and covers a territory of 464,300 km2 [47]. In 2018 the population of Kamchatka was 315,000 peo-
ple, of which 181,000 live in the capital city of the region, Petropavlovsk-Kamchatsky, 78% of the total re-
gional population lives in urban areas [48]. The density of the population in Kamchatsky Krai is 0.68 peo-
ple/km2 which is much lower than the average Russian population density. The population is unevenly dis-
tributed across the territory, with most of people living in the southern part of the peninsula, in the coastal
areas and the big cities where the population density varies between 0.02 and 586 people/km2. Kamchatka is
well known for its natural beauty, virgin nature, the Valley of Geysers, its rich biodiversity and marine treas-
ures. Only roughly 10% of the territory of Kamchatka is developed and used. Kamchatka has a continental
climate with maritime climate features. The average temperature in winter is -6.4 C0 with the lowest winter
temperatures in the very northern settlements (it can go down to -57 C0). The summer temperatures usually
do not go over +22 C0 [49]. The territory of the region is vulnerable to cyclones, earthquakes and strong
winds. A first geothermal power plant was still built in the USSR in 1966 and it is still the most important en-
ergy source for the Southern part of Kamchatka [50].
Figure 19 Kamchatka Krai region; source: eclareon 2019, generated with amCharts Pixel Map
2.2.1 Current energy supply situation and renewable energy potential
Being disconnected from the UPS and from transit transregional high voltage grids, Kamchatka is an isolated
territory. As a result, Kamchatka’s electricity market is a part of a non-price zone and refers to the isolated
energy areas, which means that the region is totally disconnected from the UPS and from transregional high
voltage grids.
The energy market in Kamchatka is divided into one central regional energy system and 13 additional iso-
lated energy systems or energy zones, which are disconnected from each other and from the central energy
system [46]. The largest is the central regional energy system which includes the two largest CHPPs and

dena study „Market study in the context of decentralized energy supply using renewable energy technologies in selected Russian regions“ 53
some cities including the regional capital city, Petropavlovsk-Kamchatsky. Only this energy system includes
grids with the voltages between 110 and 220 kV. Apart from the 13 medium-sized energy systems, there is a
number of smaller systems covering only one settlement and consisting of a power generating facility and
locally stretched low voltage grids. Some of the power plants and two energy systems are presented in Figure
below.
Figure 20 Electricity sector in Kamchatka, location of some power plants and energy systems; source: eclareon 2019, generated with
amCharts Pixel Map, based on Orlov, 2008 [52] and WWF Russia, 2017 [55]
The central regional energy system is located in the southern part of Kamchatka, it supplies the majority of
the population and covers more than 80% of the total annual electricity consumption in Kamchatka. Power
generation consists of the two largest regional combined heat and power plants (CHPP-1 -204 MW of in-
stalled capacity and CHPP-2 - 160 MW), two GPPs, a hydropower plant, a diesel power plant having a func-
tion of a backup reserve power source and a wind park located in the settlement of Oktyabrski.
Subsidiaries of RusHydro dominate the energy value chain of the region. Most of the regional companies are
active in all segments of the energy value chain, generation, transport and distribution. In 2017, there were
more than 15 companies responsible for electricity transportation and supply, among them the largest were:
The public joint stock company “Kamchatskenergo” is the major energy supplier (guaranteeing supplier) of
the region and the major energy producer for the capital city. The company also operates the central electric-
ity grids. It is a subsidiary of RAO EES of the East (RusHydro structure). “Kamchatskenergo” operates more
than half of the region’s power generating facilities and they are also responsible for the energy generation of
more than 50% of the off-grid remote communities. Grids of the central power system are managed by PJSC
“Kamchatskenergo”; grids of 35 kV are managed by JSC “Southern Power Grids of Kamchatka” and “Pauzhet
HPP”; lower voltage grids are managed by JSC “Koryakenergo” [51].

The joint stock company “Southern Power Grids of Kamchatka” (100% owned by “Kamchatskenergo” and
part of the RAO EES of the East) is a power producer, guaranteeing power supplier and distributer. The
company operates beyond the borders of the central energy system, it owns and operates around 10% of
the total regional installed power capacity (namely, 20 large DPPs, a small HPP and a hybrid gas-diesel
power plant) and 813 km of power grids.
JSC “Pauzhet HPP” (part of RusHydro group) operates hydro power plants in the central energy system and
supplies consumers (has a status of a guaranteeing supplier)
PJSC “KamGEK” (Kamchtsky Gas Energy Complex) (RusHydro group) is responsible for constructing gas
power plants and hydro power plants and operating HPPs. Currently it operates 45,4 MW of HPPs (more
than 95% of the total hydropower capacity installed in Kamchatka).
JSC “Koryakenergo” is an independent company owned by regional authorities and private stakeholders,
and has the status “guaranteeing supplier” because it produces, sells and distributes electricity and heat in
17 settlements of Kamchatka. The company operates about one third of DPPs in the north of Kamchatka.
Figure 21 A scheme of relationships between the largest energy companies of Kamchatka; source: based on the research completed by
eclareon and IP Kekelidze
Additionally, there are some companies which are responsible only for energy production. For example, JSC
“Geotherm” (RusHydro group) operates 2 GPPs with an overall capacity of 62 MW, which is more than 80% of
the overall installed geothermal capacity in Kamchatka. Simultaneously, there exists a number of companies
which are responsible for energy generation and distribution in very small areas – isolated energy systems of
Kamchatka, for instance, JSC “Ossora” in Ossorsky isolated energy system and “Kolhoz “Udarnik” Ltd. In
Karaginsky isolated energy system.
In 2017, the overall total installed capacity in Kamchatka was 648.8 MW of which 483.15 MW belong to the
central energy system. The major share of installed capacity refers to combined heat and power plants (pow-
ered mainly by gas), 24% is taken by diesel generation and more than 10% are geothermal based power
plants. The power sector of Kamchatka has a relatively high share of renewable energy sources in its energy
mix, represented by geothermal power, wind and small hydropower (together nearly 20%). The overall struc-
ture of Kamchatka’s installed power capacity is shown in Figure 22. The volume of total installed power ca-
pacity has been growing for the last few years, mainly because of new RES based installations (mainly hydro)
capacity and some new, more efficient, generating facilities on existing DPPs.

dena study „Market study in the context of decentralized energy supply using renewable energy technologies in selected Russian regions“ 55
Figure 22 Structure of the installed capacity by type of power plant in Kamchatka in 2017 (in MW and %); source: Ministry of Housing
and Construction and Energy Sector of Kamchatka, 2018 [51]
The energy balance in Kamchatka is such that it has enough power generating capacity to fully cover the con-
sumption of the region.
Specification Central regional
energy system,
number of PPs
Isolated energy sys-
tems (all remaining ter-
ritory) number of PPs
Owner/operator Installed ca-
pacity in total
Power plants ≥
5WM (all fuel
types)
5 6 “Kamchatskenergo”; “Piskunov
Kamchatka power grids”; “Geo-
therm”; “Pauzhet HPP”;
“KamGEK”; “Koryakenergo”;
“Southern Power Grids of Kam-
chatka”
514.47
Diesel PPs 0,1-6
MW
38 Other owners ≈100
Diesel gensets
<200 kW
290 Local municipalities ≈40
Table 5 Number, capacity and major owners of power generating facilities in Kamchatka; source: Ministry of Housing and Construc-
tion and Energy Sector of Kamchatka, 2018 [51], WWF Russia, 2017 [55]
In 1993, Kamchatka’s government and Ministry of Energy decided to decrease the dependence of the region
from imported fuel by connecting gas pipelines and energy generating facilities to the settlements. Since
2000, several gas pipelines have been built, combining settlements and heat and power plants with gas de-
posits in the region [51]. However, this program could not be successfully completed due to a 40% drop in gas
extraction in the region. In 2011, “Gazprom” launched a new gas deposit on Kamchatka and it was planned
Combined heat and power plants; 364;
56%
Hydro PP; 45.4; 7%
Small hydro; 1.7; 0%
Wind PP; 5.5; 0.852%
Geothermal PP; 74; 11.40%
Diesel PP; 158.2; 24%

to extract about 750 million m3 annually, which should have been enough to supply the regional energy sys-
tem with fuel. However, a de-facto extraction resulted into 400 million m3. Such difference happened due to
an inaccurate geological model and uncertainties during exploration works [85].
100% of oil products (including diesel, petrol, mazut, etc.) and 90% of hard coal consumed in Kamchatka are
imported from other Russian regions [53]. Hence, a number of boiler houses of cities and industrial consum-
ers use gas to produce energy; CHPP-2 also works on gas having mazut as a standby fuel, CHPP-1 uses mainly
gas. The overwhelming majority (about 90%) of power generating facilities in other isolated energy systems
of the region work on diesel and hybrid diesel-gas, some work on geothermal power and small hydropower
[51]. There are 328 DPPs of different installed capacity in the region. The structure of fuel types used by
power plants in the region is presented in Figure 23.
Figure 23 Correlation of fuel types at power plants in Kamchatka; source: Kamchatka Government, official web site, 2018 [53]
Energy consumption has been steadily growing for the last few years. In 2017, the average per capita energy
consumption in Kamchatka was 5,570.6 kWh/capita/year [51]. Meanwhile, per capita consumption in isolated
settlements is much higher and reaches 9,000 kWh/capita/year which is due to the widespread usage of
cooking stoves and heating [55]. The major share of electricity consumption in the region (more than 80%)
occurs in the central region; total electricity consumption in the other regions does not exceed 8% of the
overall consumption; local consumers using private generation do not represent more than 7% of the overall
regional consumption. There are no big power consumers outside the central energy system due to the low
population density and absence of big industrial in other parts of the region.
Total electricity consumption in Kamchatka in 2017 amounted to 1,752.32 million kWh: 30% of electricity was
consumed by rural and urban residential customers, 26% by the mining industry (extraction and mineral pro-
cessing of precious metals, cobalt, copper and other metals; exploitation of the two gas deposits) and 20% by
other industries, mainly fisheries, fish farming and the manufacturing industry. There was an 11% loss of
electricity in the grids [54]. For energy consumption in rural areas, the following two main consumption pat-
terns can be distinguished:
Areas with peak consumption in the winter: Consumption is highest during cold months when loads are 30-
50% higher than between May and August due to illumination and running of heat pumps.
Oil products (incl. Diesel)
28%
RES (incl. Hydro)43%
Natural gas20%
Coal8%
Other solid fuel1%

dena study „Market study in the context of decentralized energy supply using renewable energy technologies in selected Russian regions“ 57
Areas with peak consumption in the summer: in such areas night loads can be 2 to 3 times lower than day
loads. An example would be Ust-Kamchatsk settlement, where the total installed power capacity in 8.2
MW, June loads reach 6.5 MW and January loads are only 3 MW. Peaking summer consumption happens
due to summer tourism and local fish processing industry.
In 2017, the regional power system (both electricity and heat) consumed 401,213 cubic meters of gas,
266,600 tons of coal, 100,729 tons of mazut and 49,241 tons of diesel.
Figure 24 Electricity consumption in Kamchatka by type of consumer, %, 2017; source: Federal State Statistics Service of Russia,
2018 [54]
The Kamchatka energy sector has numerous problems for various reasons, among which are:
Remoteness: Kamchatka is practically isolated from other regions and scarcity of transportation ways
make fuel more expensive.
High deterioration level of the power generation equipment: a large share of this equipment was installed
more than 40 years ago. In 2020-2022, it is awaited that major share of this old equipment is going to break
down-
At the same time, the region is already an active user of RES, as mentioned in the text above. However, there
are no solar power plants in the region which are acknowledged by the Ministry of Energy of Kamchatka and
included in the energy statistics. Nevertheless, there are some small-scale PV arrays, with most installed-on
lighthouses and have capacities between several watts and couple of hundreds of kilowatts. The total esti-
mated installed PV capacity in Kamchatka is below 1 MW [56].
Albeit still small as well, wind power plays a more important role in the region. The following gives an over-
view of wind power plants:
Hybrid diesel-wind power plant in village Nikolskoje, consists of 2 wind turbines with an overall capacity of
550 kW and a DPP of 292 kW, built in 2013
Agriculture1.48%
Mining industry26.96%
Other industries20.62%
Construction of buildings
1.30%
Transport and communications2.91%
Other 5.05%
Population29.87%
Losses in grids11.81%

Wind power plant in the village Ust-Kamchatsk with an installed capacity of 275 kW (French company
Vergnet as a result of an investment program PJSC Mobile Energy (part of RAO EES of the Eas” group)), built
in 2014
3 wind turbines in Ust-Kamchatsk, 300 kW each (total installed capacity 900 kW) constructed by Japan’s
NEDO
Wind power plant in settlement Oktyabrski built in 2008 with an overall installed capacity of 3,3 MW (. The
wind park was a joint project of the current owner, JSC KES Piskunova – Piskunov’s Kamchatka Power
Grids, and Danish MICON (VESTAS) company. In 2015, this power plant generated 6,1 GWh of electricity
[55].
More hybrid wind-diesel power plants are in the planning phase and to be built in 7 isolated from energy sys-
tems settlements in Kamchatka, which have no road connection to the capital city and fuel has to be deliv-
ered by marine transport, making it especially expensive. It is yet unclear, how the wind turbines will be de-
livered there.
With regards to their development potential, the most promising RES in the region are:
Hydropower with an estimated energy potential of 800 MW / 50.6 billion kWh/year;
Geothermal power with an estimated energy potential of 900 MW installed electrical capacity
Wind power with an estimated energy potential of 1 GW / 30-36 billion kWh/year) mainly in the coastal ar-
eas of peninsula.
The potential for solar is lower than in southern Yakutia: horizontal solar radiation in southern parts of Kam-
chatka reaches 1,100 kWh/m2/year in some areas but is around 900 kWh/m2/year on average [164]. Settle-
ments are mainly concentrated along the coasts where cloudy days are more common than sunny days. In
2015, a Czech company Ekotechnik offered to install a PV array for the local government in one of the settle-
ments and was generally well received by the local government. The project also called for financial support
from the government, which delayed the project’s implementation. Currently, preparations are underway in
the target settlement to install the 100 kW PV project [55].
All in all, the potential wind energy market consists of off- and an on-grid parts: The estimated size of the
market inside the grid of the central energy system is 15-20 MW for wind. This capacity is best integrated in
the existing power grid in the capital city, where good wind conditions are available. It will become especially
important in the years after the two CHPPs will be affected by the shortage of supplies, which will lead to a
switch to mazut-based energy generation. It is hard to estimate the size of the off-grid potential wind market
due to scarcity of the research of wind potentials for concrete populated areas.
2.2.2 Electricity tariffs and costs
Kamchatka has the third highest electricity tariffs among the Russian regions. There is no wholesale electric-
ity market in the region due to its disconnection from the UPS. High energy tariffs are one of the most serious
problems in Kamchatka, putting much pressure on the population and burdening the regional economy. For
this reason, production costs for products from Kamchatka are very high for energy intensive industries,
thereby decreasing their competitiveness with similar Russian products from other regions.
Costs of electricity and heat production are very high due to a number of factors:

dena study „Market study in the context of decentralized energy supply using renewable energy technologies in selected Russian regions“ 59
nearly all fuel types need to be imported
poor transport connection of the region with other Russian regions, due to geographical location
no rail, road and pipeline connection to fuel extracting regions of Russia
outdated and inefficient equipment at power plants, especially CHPP-1 and -2
Tariffs for the population differ depending on the group of consumers (night/day tariff; tariffs for people in
rural and urban areas; tariffs for people with/without electrics stoves) and the power supplier. In 2018, resi-
dential electricity tariffs for the main tariff groups were 11% higher than tariffs in 2017 and resulted into [58]:
energy sold by “Kamchatskenergo”; “Southern Power Grids of Kamchatka”; “Koryakenergo” and a number
of smaller suppliers (with VAT):
rural population: night tariff 3.74 RUB/kWh (0.05 EUR/kWh)– day tariff 5.38 RUB/kWh (0.07 EUR/kWh)
urban population (households with gas stoves), night tariff 5.35 RUB/kWh (0.07 EUR/kWh) – day tariff
7.69 RUB/kWh (0.10 EUR/kWh)
single rate tariff (no differentiation by daytime or voltage) rural population 4,68 RUB/kWh (0.06
EUR/kWh) – urban population 6.68 RUB/kWh (0.09 EUR/kWh)
Energy sold by “Pauzhet HPP” in Ozernovsky energy system only:
rural population: night tariff 2.89 RUB/kWh (0.04 EUR/kWh) – day tariff 4.16 RUB/kWh (0.05 EUR/kWh)
urban population (households with gas stoves), night tariff 4.13 RUB/kWh (0.05 EUR/kWh) – day tariff
5.94 RUB/kWh (0.08 EUR/kWh)
single rate tariff (no differentiation by daytime or voltage) rural population 3.62 RUB/kWh (EUR/kWh) –
urban population 5.17 RUB/kWh (0.07 EUR/kWh)
Tariffs for non-residential consumers are calculated differently and may reach 50 RUB/kWh (0.66 EUR/kWh)
for isolated settlements.
These tariffs do not reflect the real electricity price due to strong subsidization. High fuel prices and pay-
ments for transportation increase the generation costs and overstep the ceiling price levels established by
the Federal Tariff Service of Russia. For example, real fuel costs in power generation are between 11 and 25
RUB/kWh (0.15 – 0.33 EUR/kWh). In 2018, the maximal electricity generation costs reached 88 RUB/kWh (1.17
EUR/kWh) [51]. On average, generation costs were 12-50 RUB/kWh (0.16 – 0.66 EUR/kWh) [59]. The differ-
ence between the true costs and end tariffs for consumers is covered by subsidies from the budget, which is,
on average, 2 RUB/kWh (0.02 EUR/kWh) [51]. In 2016, total energy subsidies in the region reached 37 billion
RUB (490 million EUR) which was the third biggest regional energy subsidy in the country [51]. The annual
budget allocation for these targets is about 6% of the regional budget [55].
The region’s gasification program aimed to decrease the costs of electricity and slow down the tariffs’ growth
and this target has been partly achieved in 2012-2013. Gazprom delivers gas directly to customers, including
power plants [51]. Although the programs of gasification have been successfully implemented, their effect
was not enough to fully resolve the problem of high electricity tariffs and has not driven the energy genera-
tion costs down to average Russian. Currently, the price of the imported natural gas sold to “Kamchatsken-
ergo” is lower than its costs, the difference is based on cross-subsidization inside the Gazprom structure. In
2018, this gas price subsidized by Gazprom was 7,167 RUB/cubic meter (95.58 EUR) in Kamchatka, while the

real price without subsidies would have been around 18,000 RUB/cubic meter (240 EUR). Without this subsi-
dization, energy prices for electricity sold by the two CHPPs would increase and make the end customer en-
ergy tariff grow by 10% [51]. For the last few years, Gazprom’s annual losses based on the gas trade with
“Kamchatskenergo” has reached 4 billion RUB (53.35 million EUR).
Due to a combination of the following facts, the two CHPPs are likely to switch to mazut for energy genera-
tion one day, resulting in a drastic growth of energy generation costs:
1. Domestic extraction of natural gas will reduce by 4 times until 2030 and regions will face the problem of
fuel shortages
2. There are no pipelines or suitable road and rail connections between Kamchatka and Russian gas ex-
tracting regions, so importing gas from other regions will be nearly impossible
3. Theoretically, a regasification terminal for a liquified natural gas (LNG) could be built in the region by
“Gazprom” as was done in Kaliningrad (see http://www.gazprom.com/projects/kaliningrad-terminal/ for
more information). In order to do this, large investments are needed, which the regional administration can-
not fulfill. Moreover, that would require marine transportation of LNG which could also mean additional
transportation costs.
4. CHPPs already have generators and turbines aimed at being fueled by mazut and it is likely that this ex-
isting equipment is preferable to additional investments in new facilities and solutions
In 2018, for both CHPPs of Kamchatka working on gas, the electricity cost without service payments for elec-
tricity transportation (payments to grid operators) was 5.3 RUB/kWh (0.07 EUR/kWh) , which is 2 times higher
than the similar average tariff in Russia [51]. For small isolated settlements, the cost for electricity is much
higher and varies between 11 and 88 RUB/kWh (0.15 – 1.17 EUR/kWh). Therefore, the cheapest electricity
prices in Kamchatka is for RES-based energy: geothermal energy price is 3.05 RUB/kWh (0.04 EUR/kWh) and
the hydro power energy price is 4.95 RUB/kWh (0.06 EUR/kWh) which explains the lower energy tariffs in
Ozernovsky’s energy system. Energy from hybrid wind-diesel power stations may be sold to the end con-
sumer for 10-20 RUB/kWh (0.13 – 0.26 EUR/kWh), while small hydro can ensure final consumer energy prices
between 2 and 15 RUB/kWh (0.02 – 0.20 EUR/kWh) [55].
RUB/kWh (EUR/kWh) with VAT All energy systems in
common
Ozernovsky energy
system (hydro)
Isolated settlements,
non-common situa-
tions
Urban population single rate tariff 6.68 (0.09) 5.17 (0.07) _
Rural population single rate tariff 4.68 (0.06) 3.62 (0.05) _
Costs of electricity generation av. 6-15 (0.08 – 0.20) av. 5 (0.06) 12 up to 88 (0.16 –
1.17)
Table 6 Some tariffs for energy consumers in Kamchatka and costs of electricity generation; source : WWF Russia, 2017 [55]; Ministry
of Housing and Construction and Energy Sector of Kamchatka, 2018 [51]; Bashmakov & Dzedzichek, 2017 [59]; outcomes of research by
eclareon and IP Kekelidze

dena study „Market study in the context of decentralized energy supply using renewable energy technologies in selected Russian regions“ 61
Economically justified electricity price (without subsidies), for first and second half of 2019, RUB/kWh (EUR/kWh)
with VAT13, electricity for residential and non-residential consumers in isolated energy system “Ossorsky”, only low
voltage grids exist (0.4 kV and less)
1/1 2019 2/2 2019
Single rate tariff, urban popula-
tion
33.385 (0.45) 49.278 (0.66)
Single rate tariff, double-day
zones, urban population
Day – 38.393 (0.51)
Night – 26.707 (0.36)
Day – 56.670 (0.76)
Night – 39.423 (0.53)
Single rate tariff, three-day
zones, urban population
Peak – 40.062(0.53)
Semi peak – 33.385 (0.45)
Night – 26.707 (0.36)
Peak – 59.134 (0.79)
Semi peak – 49.278 (0.66)
Night – 39.423 (0.53)
Single rate tariff, rural popula-
tion
23.369 (0.31) 34.495 (0.46)
Single rate tariff, two-day zones,
rural population
Day – 26.875 (0.36)
Night – 18.695 (0.25)
Day – 39.669 (0.53)
Night – 27.596 (0.37)
Single rate tariff, three-day
zones, rural population
Peak – 28.043 (0.37)
Semi peak – 23.369 (0.31)
Night – 18.695 (0.25)
Peak – 41.349 (0.55)
Semi peak – 34.495 (0.46)
Night – 27.596 (0.37)
Single rate tariff, non-residential
consumers
27.821 (0.37) 41.065 (0.55)
Single rate tariff, two-day zones,
non-residential consumers
Day – 22.256 (0.30)
Night – 31.994 (0.43)
Day – 32.852 (0.44)
Night – 47.225 (0.63)
Single rate tariff, three-day
zones, non-residential consum-
ers
Peak – 22.256 (0.30)
Semi peak – 27.821 (0.37)
Night – 33.385 (0.45)
Peak – 32.852 (0.44)
Semi peak – 41.065 (0.55)
Night – 49.278 (0.66)
Economically justified electricity price (without subsidies), for first and second half of 2019, RUB/kWh (EUR/kWh)
with VAT in isolated energy system “Karaginski”
Electricity price 30.692 (0.41) 34.611 (0.46)
Electricity tariffs (with subsidies) for the first half of 2019 for non-residential consumers in Kamchatka, incl. voltage
level differentiation, RUB/kWh (EUR/kWh) with VAT
Type of voltage /
type of tariff
High voltage (110
kV and higher)
Middle first volt-
age (35 kV)
Middle second
voltage (20-1 kV)
Low voltage (0,4
kV and less)
Single rate tariff 5.55 (0.07)
Single rate tariff,
double day-zones
Day – 6.38 (0.09)
Night – 4.44 (0.06)
Single rate tariff,
three day-zones
Peak – 6.66 (0.09)
Semi peak – 5.55 (0.07)
Night – 4.44 (0.06)
Table 7 Some economically justified electricity prices and end electricity tariffs (with subsidies) for energy consumers in Kamchatka;
source: “Ossora”, 2018 [153], “Kolhoz “Udarnik”, 2018 [152], Government of Kamchatka, 2018 [154]
13 VAT in 2018 = 18%; VAT since 2019 = 20%

Table 7 contains both economically justified and end consumer prices for electricity. If one compares resi-
dential energy tariffs established in the whole region (see the text above Table 6) with real electricity prices, it
becomes clear, that about 80% of residential price is subsidized. Same situation is for rural consumers and
non-residential consumers of the retail market, like SMEs and industrial facilities – for them, share of subsidi-
zation in the in-bill price is also about 80%. Similar to isolated energy systems in Yakutia, in Kamchatka high
costs of electricity are explained by a large share of fuel expenses in energy price:
In Ossorsky energy system, there is a DPP-12 with an installed capacity of 5 MW, generation is managed by
“Ossora” Ltd. In 2019, the planed expenses for fuel take 44% (19,163 thousand RUB / 255.6 EUR) of overall
planned expenses which at the end form electricity price [155]
In Karaginsky energy system, electricity is generated also on DPP (1.7 MW) by “Kolhoz “Udarnik”, in 2019,
the planed expenses for fuel take 62% (15,292 thousand RUB / 203.9 EUR) of overall planned expenses
which at the end form electricity price [156]
Although the residential tariffs get strongly subsidized, they are still the second highest in Russia. High en-
ergy tariffs are one of the most serious problems in Kamchatka, putting pressure on the population and op-
pressing the regional economy. In 2018, an average citizen of Kamchatka gave out 16.3% [86] of his salary for
housing and communal services, including electricity, water, heating and gas. An average salary in Kam-
chatka is 33.6 thousand RUB (about 442 EUR) and everything, especially fruits, vegetables and dairy prod-
ucts, is much more expensive than in many other Russian regions because of high transportation costs,
therefore such utility bills are putting a lot of pressure on families' budgets.
Often, consumers are not able to pay the electricity and heating bills, causing serious financial problems
among energy supply companies and slowing down the development of energy systems and renovation of
power plants due to a lack of free financial resources.
2.2.3 Regional business environment & specific legal and regulatory framework for energy supply
The most attractive technical RES solution in Kamchatka is seen in the construction of hybrid diesel-wind
power plants. The 2 main factors which could push the development of such projects forward are: the availa-
bility of investment which is often obtained through governmental RES supporting programs and the “readi-
ness” of a local company (power supplier/distributor/producer) to take part in such projects and support
them.
There are around 330 DPPs of different sizes in the region, which usually consume 275 grams of diesel/kWh
and some consuming up to 440 grams/kWh; most of them are outdated and integrated into local small-low-
voltage grids (mainly, 6-10 kV). There is no centralized program aiming to replace the old power capacity and
no concrete timeframe to do that. According to some estimations, the average annual DPPs’ capacity re-
placement or/and renovation is about 2% of the total installed capacity each year which would result in new
installations of 3-5 MW/year. Given that the maximum wind power that can be integrated cannot be more
than of 20% of the DPPs’ maximum load, or 15% of its nominal installed capacity provided that no intelligent
energy management systems are installed, the annual market for wind energy in the region could be as much
as 600kW to 1 MW.
Major activities inside the regional energy system are concentrated in the hands of JSC Southern Power Grids
of Kamchatka (basically, meaning RAO EES of the East) which has enough human resources for such a project

dena study „Market study in the context of decentralized energy supply using renewable energy technologies in selected Russian regions“ 63
implementation. However, RAO EES of the East has not yet shown serious commercial interest in RES devel-
opment. Moreover, the company seems to lack the financial resources to invest in RE. Therefore, it will only
drive the implementation of RES projects in case of receiving additional financial resources from the federal
government (as it does right now with the help of an investment program described in the next subpara-
graph). Nowadays, isolated settlements have surpluses in installed generation capacity (about 50%) but, at
the same time, up to 70% of the equipment is not functional. It is assumed to be more economically effective
to install modern energy efficient diesel power plant rather than a hybrid wind-diesel facility or small hydro
[57]. There is also no motivation for the RES implementation for residential consumers, who only pay a regu-
lated tariff regardless of the real costs of production. Moreover, a grassroots movement criticizing the use of
fuel powered electricity generation for environmental reasons is not a relevant phenomenon. Hence, the par-
ties who are motivated to develop and implement RES projects are the regional energy suppliers like Kam-
chatskenergo because they have to compensate for high generation costs. Therefore, for a RES project to
become attractive for local companies, it has to demonstrate lower generation costs. An investor should sign
an energy supply contract with Kamchatskenergo or its subsidiary Southern Power Grids of Kamchatka. This
contract should include energy costs which will, in the end, make the consumer prices stay below the infla-
tion rate.
Currently, there is a large regional investment project “implementation of energy supply of isolated areas of
Kamchatsky Krai based of renewable energy sources”. The main investor is RAO EES of the East. The overall
project’s budget is around 2 billion RUB (~27 million EUR). This project has several targets:
Decrease of expenses for imported diesel by replacing them with wind power plants
Reduction of electricity tariffs due to cost savings on imported diesel fuel
Improvement of electricity and heat supply to consumers
Improvement of the regional ecological situation
The NEDO wind park project was financed by this investment project and is the result of a memorandum be-
tween “NEDO”, “Rao EES of the East” and the government of Kamchatka [53].
Kamchatka has a regional development strategy implemented by the Decree of the Government of Kam-
chatka № 332- (P) of 27.07.2010 with the following change from 2018: Decree № 1- (p), “Strategy of the so-
cio-economic development of Kamchatka Krai until 2030”. The document includes guidelines on the neces-
sary steps which, at the end, will decrease energy prices in the region and make it more energy independent
[60]. Two of the points of the strategy is construction of new RES-based power generating facilities (based on
hydro energy, geothermal and wind energy) and construction of hybrid diesel-wind power plants in isolated
settlements.
The mentioned targets are to be reached with the help of various mechanisms, including the creation of fa-
vorable economic conditions for RES development; the creation of mechanisms for the return of private in-
vestments; the development of different forms of partnerships between governmental structures and private
companies and the abolishment of administrative barriers slowing down various projects, etc. According to
the plan, the share of RES in the total consumption volume shall increase to more than 30%, meaning an in-
crease of 3.5% between 2013 and 2030.

2.2.4 Regional specific business case
For Kamchatka, a hybrid diesel-wind power plant for isolated settlements was selected as business case. The
installation is in the Ust-Kamchatsk settlement, where a new wind park has been combined with an old die-
sel power plant and integrated into the existing local power grid. The project was a part of a large investment
program of PJSC Mobile Energy (part of Rao EES of the East group), mentioned in the text above (2.2.3) which
aims to construct hybrid wind-diesel power plants in several isolated settlements of Kamchatka, which today
rely fully on diesel-based power. The replacement shall be completed by 2020.
Ust-Kamchatsk is located on the eastern coastal area in the central part of Kamchatka, the population of the
settlement is around 5,000 people. The annual power generation in the settlement fluctuates around 20,600
MWh/year. The diesel power plant supplying this settlement has 8.2 MW of total installed capacity with maxi-
mal loads in July up to 6.4 MW. Currently, the installed wind power capacity is 1.175 MW in total, while the
planned total capacity is 3.4 MW. The project consists of several stages: the first stage was completed in 2013
when a French company Vergnet installed a 55-meter wind turbine with a capacity of 275 kW; the second
stage was completed in 2015 by a Japanese company NEDO (Mitsui & Co. and Komaihaltec Inc.) which in-
stalled three wind turbines produced by Komaihaltec Inc. Each of these wind turbines has a capacity of 300
kW and is 41.5 m high [62]. The plan is that the total installed wind power shall go up to 3 MW (the year of a
project’s final is not specified in open sources). NEDO installed the turbines at its own expense, with an aim
to check the equipment in extreme weather conditions, similar to the project in Tiksi (see chapter on Yakutia:
p. 29).
The wind park is supposed to produce around 2 million kWh annually, which could help save 533 tons of die-
sel each year. Nowadays, the wind park is working in a test regime, but, according to some estimations, has
already saved more than 550 tons of diesel during the period 2013-2016.
2.2.5 Business model description
In the case of a project development, specific steps need to be undertaken to develop a RE array. These steps
are presented in Figure 25 below, the scheme includes actors needed for each of the step and the duration of
these steps. The process of cooperation between different stakeholders while RES project development is
similar to the one for Yakutia.
The overall project’s duration for a wind power plant in Kamchatka is around 2 years and includes the follow-
ing important steps:
Before the project starts, it is essential to approach local authorities, ministries (e.g. Ministry of Construction
and Infrastructure Development) and companies responsible for the local isolated grids (in case the project is
foreseen there) or Kamchatskenergo in case of a project development on the territory covered by the central
regional energy system. Unlike Yakutia where most of negotiations are to be done with Yakutskenergo, in
Kamchatka the partner varies depending on the concrete area of the region. The waiting time for an answer
from local responsible players takes on average 2 weeks, while the overall duration to receive permits may
last 2-3 months. In order to clarify all open questions that may arise during the process it is sometimes rec-
ommended to approach the ministry/administrative body/company several times. Moreover, it makes sense
to approach larger companies, such as RAO EES of the East and cooperate directly with them to accelerate
negotiations “top down” since subsidiary companies such as Kamchatskenergo and Southern Power Grids of
Kamchatka often get directives from RAO EES directly.

dena study „Market study in the context of decentralized energy supply using renewable energy technologies in selected Russian regions“ 65
Figure 25 Scheme of the project’s flow in Kamchatka; source: based on the research completed by eclareon and IP Kekelidze
There is a number of regions in Kamchatka, which are promising for the development of wind projects, but
which have a very poor transport connection. For such cases, logistics should be set before the design of the
project and one should consider existing variants of transport connection. For example, some equipment
may be transported by sea, but in the case a settlement that has no suitable marine port, the hardware
should be transported to the closest settlement with a suitable port and from there be either delivered by
roads or by inland waterways. The northern part of Kamchatka lies in the permafrost zone which means that
roads are in the best condition during the winter.
2.2.6 Profitability analysis (inputs, outputs, scenarios, sensitivities)
In the following, an exemplary profitability analysis for the 900 kW wind project based on diesel power sav-
ings is presented. The reference model for this business case is the installation in the village of Ust-Kam-
chatsk. Expected investment payback period for this project was estimated at 15 years, according to the in-
formation received by “Eurosolar” Russia from REO EES EAST GROUP. This result can according to our calcu-
lations only be achieved by assuming that some investment subsidies/ financial support was provided. This
is likely given that Ust-Kamchatsk is a project with an R&D focus, not a commercial installation. Such support
could have come from both Japanese and Russian sources: as mentioned previously. Given that no exact fig-
ures for the financial support could be found during our research but the 15-year payback were communi-
cated as a fact, the financial support for the project was estimated.
It needs to be noted that the overall wind power project is actually split into 2 wind power installations: be-
sides the three 300kW turbines installed by the Japanese company NEDO there is also an additional 300 kW
Investor/ist turnkey
contractor
Duration: About 1-1.5
years for wind measurments (1 year
full circle + deliveryand
construction)
Site selection
Investor/ist turnkey contractor;
local agencies, administration(e.g. Ministry of Housing and
Public Utilities, Ministry of
Energy of the Republic)
Duration&costs: 2-3 months for
getting permissions fromadministrationin case the land
is not private; 2 months for
geological rospect (preferablyin spring) 10-40 thousandUSD
Geological study and
corresponding
permissions
Investor/ist turnkey contractor;
local agencies, administration(e.g. Ministry of Housing and
Public Utilities, Ministry of
Energy of the Republic)
Duration: ca.2 monthsafter the
design is ready. Costs shouldnot exceed10 thousand USD
and paid to egineeringcompany
to get an approval
Construction
permissions
Project Flow
Steps
Investor/ist turnkey contractor,
construction and transportationsubcontractors
Duration: 1 year +
transportation. Transportation mostly by the sea; if a
settlement does not have on
ows port-sea+winterroads/vessels for shallow water
Construction
Local grid company
(„Kamchatskenergo“ or„Koryakenergo“ in >90% of cases)
2-3 months dependingon
condition of a transformer and availability of grid connectionpoints. Can be done in parallel
with construction works
Utility connection
Investor/ist turnkey contractor,
„Rostechnadzor“*, local gridcompany
Up to 1 month, costs are
included into the contract‘sprice
Commissioning and
testing

wind turbine from a French manufacturer which is not part of these calculations. The main parameters and
results of the base case scenario are presented in the following figure:
Figure 26 Project Overview – Ust-Kamchatsk 900kW diesel wind hybrid; source: eclareon calculations, based on input data researched
by EUROSOLAR Russia, 2018
As was also the case with the previously presented PV business case of Batagai, the specific system costs
seem high but the technical solutions are not standard solutions due to the demanding climatic conditions.
Diesel prices for isolated settlements were reported to be lower than in Yakutia at approx. 44 RUB/ liter (~0.58
EUR/ liter). This is not far away from pump prices that private customers would pay. The main reason for this
fairly low Diesel prices in an isolated territory are the location close to the sea which reduces transportation
costs. Moreover, procurement prices for the operators are lower than for private customers based on the
quantities purchased (economies of scale). The Diesel costs in conjunction with an estimated investment
subsidy of approx. 100 Mio. RUB and with a diesel price escalation of 10% p.a. lead to a positive NPV and a
positive IRR. The payback period for the equity investor using discounted cash flows, corresponds to approx.
15 years. This payback period and the IRR show that the installation is Ust-Kamchatsk was not built based on
economic considerations alone. R&D aspects for the operation of a wind power plant under harsh climatic
conditions played a role as well. Moreover, the business case would improve in terms of IRR and payback pe-
riod if Diesel prices were higher. This may be the case in isolated locations that are not as easily accessible by
waterways as Ust-Kamchatsk.
The next figure shows that under the chosen financing conditions the project revenues suffice to pay back
the equity investment over time.
Wind System System Operation
Project Duration Years 25 Average Yearly Generation kWh/a 1.302.058
Wind Generator Size kWp 900 Direct-Consumption Rate % 80%
Battery Capacity kWh - Genset efficiency kWh/ltr 2,50
Specific System Cost RUB/kWp 340.000 Average Replaced Diesel Consumption ltr/year 416.658
Applied investment subsidy/ support RUB 100.000.000 Diesel Price (1st Ops Year) RUB/ltr 44,00
Total System Cost RUB 206.000.000 Diesel Price Escalation % p.a. 10%
Capacity Utilization Factor % 17% Fixed Operation Costs RUB p.a. 4.120.000
Battery Replacement Interval Years - Longterm Insurance Costs % p.a. -
Total Battery Replacement Costs RUB -
Debt (Gearing) 20% RUB 41.200.000 Net-Present Value RUB 153.612.024
Loan Tenor Years 10 Project IRR % 15%
Grace period Years - Equity IRR % 15%
Debt Interest Rate % 11% Payback Period Years 15,38
Initial Equity RUB 167.255.633 LCOE (no subsidy) RUB/kWh 32,51
Additional Equity RUB 6.452.989 Min DSCR** x 0,07 x
Discount Rate % 10% Min LLCR*** x 2,98 x
Longterm Inflation Rate % 4% * LCOE: Levelized Cost of Electricity
** DSCR: Debt Service Coverage Ratio
*** LLCR: Loan Life Coverage Ratio
Financing Results
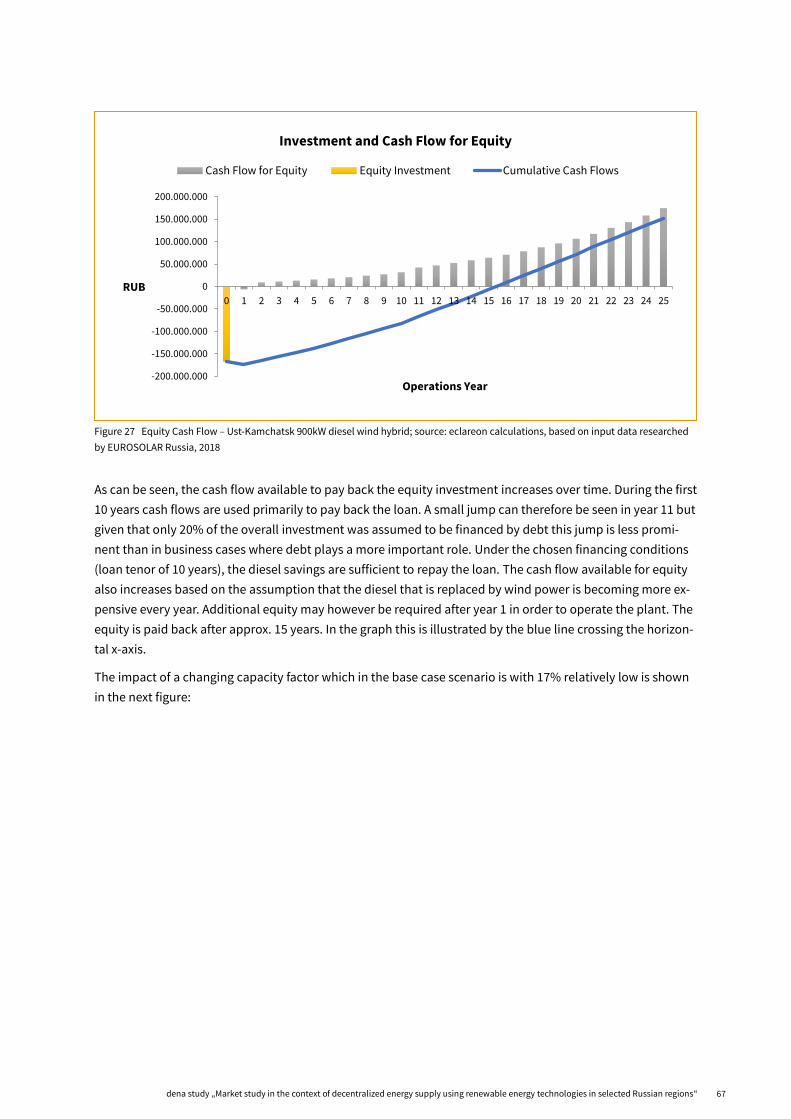
dena study „Market study in the context of decentralized energy supply using renewable energy technologies in selected Russian regions“ 67
Figure 27 Equity Cash Flow – Ust-Kamchatsk 900kW diesel wind hybrid; source: eclareon calculations, based on input data researched
by EUROSOLAR Russia, 2018
As can be seen, the cash flow available to pay back the equity investment increases over time. During the first
10 years cash flows are used primarily to pay back the loan. A small jump can therefore be seen in year 11 but
given that only 20% of the overall investment was assumed to be financed by debt this jump is less promi-
nent than in business cases where debt plays a more important role. Under the chosen financing conditions
(loan tenor of 10 years), the diesel savings are sufficient to repay the loan. The cash flow available for equity
also increases based on the assumption that the diesel that is replaced by wind power is becoming more ex-
pensive every year. Additional equity may however be required after year 1 in order to operate the plant. The
equity is paid back after approx. 15 years. In the graph this is illustrated by the blue line crossing the horizon-
tal x-axis.
The impact of a changing capacity factor which in the base case scenario is with 17% relatively low is shown
in the next figure:
-200.000.000
-150.000.000
-100.000.000
-50.000.000
0
50.000.000
100.000.000
150.000.000
200.000.000
0 1 2 3 4 5 6 7 8 9 10 11 12 13 14 15 16 17 18 19 20 21 22 23 24 25RUB
Operations Year
Investment and Cash Flow for Equity
Cash Flow for Equity Equity Investment Cumulative Cash Flows

Figure 28 Capacity factor Sensitivity – Ust-Kamchatsk 900kW diesel wind hybrid; source: eclareon calculations, based on input data
researched by EUROSOLAR Russia, 2018
The capacity factor, sometimes also referred to as the load factor, refers to the ratio of the generated net elec-
tricity during a certain period to the theoretical maximum of energy during the same period. There are of
course seasonal differences but for standard onshore wind turbines a yearly average efficiency would rather
be between 20% and 30%. But as stressed before, the installation in Ust-Kamchatsk is not standard. Inter-
ruptions of service, some forced by the harsh weather conditions some voluntary to account for R&D related
aspects could have led to this rather low capacity factor. If the experience from Ust-Kamchatsk were used for
future installations, it can be assumed that the capacity factor could be higher. The impact of such a higher
capacity factor can be seen when moving to the right on the horizontal x axis: a capacity factor of 22% could
bring the equity payback down to approx. 12 years, everything else left unchanged.
The influence of the system price is shown in the next graph. Even after the application of subsidies, the ap-
plied system price is still rather high at approx. 230.000 RUB/kWp (approx. 3.700€/kWp in 2015). Standard
wind turbines built in 2015 had on average total installed costs well below 2.000 EUR/kWp14. This means that
a potential for a lower price does not seem unrealistic for future projects. If a price of 200.000 RUB/kWp were
applied payback of equity would be at approx. 13 years. This can be seen in the following graph when moving
to the left on the horizontal axis where system prices are displayed.
14 IRENA “RENEWABLE POWER GENERATION COSTS IN 2018”, page 33, Total installed costs of onshore wind projects and global weighted average by year of
commissioning, 1983–2018
22,5
19,5
17,2
15,413,9
12,711,7
15,4
10%12%
13%15%
16%17%
18%19%
15%
10,00% 12,00% 14,00% 16,00% 18,00% 20,00% 22,00% 24,00%
Capacity Factor [%]
Amortization [a] Equity IRR [%] Base Case

dena study „Market study in the context of decentralized energy supply using renewable energy technologies in selected Russian regions“ 69
Figure 29 System Price Sensitivity – Ust-Kamchatsk 900kW diesel wind hybrid; source: eclareon calculations, based on input data re-
searched by EUROSOLAR Russia, 2018
As shown, the capacity factor and also the system price have a strong influence on the profitability of the in-
stallation because of their strong impact on revenues and overall costs. In comparison to “standard” onshore
systems that are for example used in central Europe, installation costs are very high and the capacity factor is
low. The main factors affecting the cost of the project in Kamchatka (as well as in other isolated systems with
a cold climate) compared to projects in the European part of the country are for example:
Increased logistic costs due to the distance to manufacturing centres and often difficult accessibility of set-
tlements in isolated territories
the use of specific steel which is able to withstand extreme climatic conditions;
electromechanical and electronic products (generators, relays, electromagnets, microcircuits, switching
devices) have a suitable climatic design, which guarantees their trouble-free operation at low temperature;
protection of wind turbine elements against icing, etc.
In addition it should be noted that the installed wind turbines KWT300 in the village Ust-Kamchatsk, are, in
fact, a newly developed product, created on the basis of a serial sample specifically for work in low tempera-
ture conditions of up to minus 40°C and with a temperature of preservation of up to minus 50°C. Due to the
applied technology of hermetic nacelle design, additional heating of components and mechanisms, as well
as due to more precise climatic selection of lubricants, the operating temperature range of wind turbines has
been significantly extended. This adaptation permitted the maintenance of the parameters of the nominal
and maximum wind speeds, but at the same time to increase the power factor of wind power plants due to
them working in the winter months. Thus, only a limited number of wind turbines have the appropriate char-
acteristics to operate at low negative temperatures, which is crucial in the conditions of the Far East.
10,612,2
13,815,4
17,018,7
20,3
15,4
21%19%
17%16%
15% 14%13% 12%
15%
140000 160000 180000 200000 220000 240000 260000 280000 300000 320000
System Price [RUB/kWp]
Amortization [a] Equity IRR [%] Base Case

The impact of the Diesel price and the Diesel cost escalation on the amortization time and the equity IRR is
shown in the following figure:
Figure 30 Diesel Price Ust-Kamchatsk 900kW diesel wind hybrid; source: eclareon calculations, based on input data researched by
EUROSOLAR Russia, 2018
Figure 31 Diesel Price Ust-Kamchatsk 900kW diesel wind hybrid; source: eclareon calculations, based on input data researched by
EUROSOLAR Russia, 2018
22,5
19,5
17,215,4
13,912,7
11,715,4
10%12%
13%15%
16%17%
18%19%
15%
25,00 30,00 35,00 40,00 45,00 50,00 55,00 60,00
Diesel Price [RUB/ltr]
Amortization [a] Equity IRR [%] Base Case
15,4
12,210,4
15,4
2%
5%
8%
13%
18%
22%
26%
15%
-4% -2% 0% 2% 4% 6% 8% 10% 12% 14% 16% 18% 20% 22%
Diesel Cost Escalation [% p.a.]
Amortization [a] Equity IRR [%] Up Case

dena study „Market study in the context of decentralized energy supply using renewable energy technologies in selected Russian regions“ 71
The diesel price in the base case was assumed to be at nearly 44 RUB/ liter. These costs are not very high
compared to those in other isolated territories, e.g. in Batagai. This relatively moderate price for an isolated
territory does not favor the business case: The higher the diesel costs the better the RES business case would
be from the perspective of an investor. If the base case assumption were changed, the diesel price sensitivity
(Figure 31) shows that, with a diesel price higher than 44 RUB/ liter, the payback period would go down while
the equity IRR would go up. At a location with even more challenging logistical conditions than Ust-Kam-
chatsk, diesel prices could be higher and payback periods shorter.
Another sensitivity that has an impact on the key results of a business case is the future development of die-
sel prices. An investment is paid back over time which means that it is necessary to estimate how certain crit-
ical parameters will change over time. Future diesel prices are not assumed to stay as they are today. The an-
nual diesel price escalation in the model was assumed to be at +10%. If this rate were higher the payback pe-
riod and the IRR for the equity would change accordingly: an annual diesel costs escalation of 12% would
decrease the payback period to less than 14 years and increase the equity IRR to 18%. However, it can of
course also be assumed that the diesel price escalation is lower than in the base case. If that were the case,
the payback would increase and the IRR decrease. E.g. if the price escalated only by 6% p.a., the equity could
not be paid pack during the assumed project lifetime of 25 years.
2.2.7 Potential for cooperation/business opportunities
The RES market in the region is in a nascent state and there are both pros and cons for the prospects of RE
deployment in the decentralized energy region of Kamchatka.
The region has no centralized power grid and no connection to the UPS of Russia, all existing settlements
are united by numerous different isolated energy systems with local grids of low voltages. Each of these
energy systems is managed by a concrete energy supplier/grid operator. This fact makes negotiations with
the local responsible actors easier and allows work on a relatively small scale, shortening the duration of
negotiations.
The region has a large coast with good wind potential, opening broad opportunities for on- and off-shore
wind park development.
Currently, gas plays a very important role in the energy supply of the region. Its high price along with “Gaz-
prom” planning to rapidly decline gas extraction in the next few years is causing a growing shortage of gas
for energy generation and increase of the fossil fuel share in energy generation. In the end, that will make
electricity costs higher and increase the need in RES to reduce electricity costs using RES which are eco-
nomically competitive.
Many settlements are located in the coastal areas and most of them have fisheries and fish processing in-
dustries which drive electricity demand up in summer months. Additionally, the region attracts a lot of
tourists creating extra energy demand. Being affected by rapidly growing electricity prices, small and me-
dium size companies are likely to turn towards renewable energy sources.
Having a large share of hydro power and geothermal, Kamchatka already has experience with the usage of
RES. Therefore, the overall attitude towards wind, PV and other types of RES is already more open and pos-
itive than would be the case in many other Russian regions, hence, less work to raise awareness regarding
RES is required.

Existing diesel power plants in Kamchatka are outdated and in need of replacement/renovation. That is
supposed to increase the demand and interest in small hydro, hybrid diesel-wind and diesel-PV power
plants.
Kamchatskenergo owns a majority of diesel power plants serving the needs of a bulk of isolated settle-
ments of Kamchatka. Rising oil products’ costs is motivating the company to invest in RES to decrease
electricity costs.
RAO EES of the East and regional authorities have a plan to build up to 120 MW of RES capacity in Kam-
chatka which means allocating financial resources and a qualified working force and know-how for the
program. This is where foreign entities could contribute.
2.2.8 Risks and barriers
Along with positive factors, there are a number of difficulties which can make RES project development chal-
lenging:
Kamchatka gets subsidies from the federal government, as well as cross-subsidies and gas prices which are
subsidized by “Gazprom”. It can happen that electricity prices are kept stable and that OPEX remains rela-
tively low, even after a decline of gas volume and increase of diesel in energy generation, artificially
through a further growth in subsidies. This would keep wind and PV power plants from price competitive
with other energy sources.
The climate conditions are extreme, meaning that standardized RE solutions cannot be used. The installed
equipment needs be designed to withstand very low temperatures. These prerequisites make initial invest-
ment costs for wind power plants in the region extremely high.
Due to the geographic location of the region, the transportation of equipment from Europe is very expen-
sive. At the same time, Japan and China are much closer to the region and are interested in the regional
market. European companies may however have niche knowledge regarding know-how and qualified O&M
providers.
Typical PV business cases in the region are the ones where settlements are currently supplied by diesel and
are upgraded with wind. Diesel will remain the main energy source, with wind or PV will only supply max.
10- 20% of the energy due to technical reasons and difficulties in a RES power facility implementation into
the existing power system of a specific settlement.
Despite a positive attitude towards RES, knowledge about wind, PV and other RES is not yet commonplace.
That means that an investor needs to conduct a research in the area before starting project’s design.
In order to get partnerships and support from the regional energy supply/grid and energy generating com-
panies, it is essential to build relationships with these organizations, using contacts from the official com-
pany website is often not enough for successful cooperation.
The largest energy companies in Kamchatka are managed by “RAO EES of the East” which often has
enough financial resources for a potential project, but lacks the motivation to develop it. At the same time,
its subsidiaries, have the motivation and but lack the money. That means that a foreign company needs to
care about the largest share of investments for the project.

dena study „Market study in the context of decentralized energy supply using renewable energy technologies in selected Russian regions“ 73
Conflicts of interest between different branches of local administration. For example, there might be differ-
ent opinions on the same issue from municipal and federal levels of government, however such conflicts
are often thinly veiled
All in all, the RE market in Kamchatka is dominated by large hydro and geothermal power plants, owned by
large companies. Markets for other RE sources have started to develop as can be seen by several completed
and planned wind/hybrid diesel-wind projects. These projects are the often the result of an existing partner-
ship between Russian and foreign companies. Due to the predicted decline of gas supply and high costs for
oil products in Kamchatka, the development of RES is essential for the region. Wind is much more promising
in the region than PV, however the potential for the wind market is not clearly known. This creates a possibil-
ity for foreign companies to enter the region via research activities. There are several important players in the
region, offering a choice of partners for an investor, however major activities are controlled by “RAO EES of
the East”, “RusHydro” and their subsidiaries. For a non-Russian company, the best way to enter the region
would be to approach the targets both top-down through “RAO EES” and bottom-up through local subsidiar-
ies.

2.3 Republic of Altai
The Altai Republic is part of the Siberian Federal District and is located in the mountains of Altai. The territory
of the Republic of Altai is 92,900 km2. The region is divided into ten municipal districts, uniting 92 rural ad-
ministrations, comprising 248 settlements and the city district of Gorno-Altaisk. The climate is harsh-conti-
nental where in the winter the temperature drops to -30 C0 while in summer it can go up to just +19 0C. Ac-
cording to the federal state statistics service 218,063 people inhabit the region, but only roughly one third of
the population lives in urban areas - the population density is 2.3 people per 1 km2 [102].
The territory is mainly agricultural with the main branch of agriculture being animal husbandry, particularly
breeding of: red deer, sheep, horses and beef and dairy cattle. In all municipalities, enterprises process agri-
cultural products and wild plants which are low in energy intensity and thereby electricity consumption is
minimal. There are also gold mining enterprises and logging and timber processing is carried out in almost
all municipalities. The competitive products in the region are: wood, lumber, cheese, oil, meat processing
products, building materials, phytoproducts (teas, balsams, fees), non-ferrous metallurgy products (gold,
copper, silver) [127].
Figure 32 Map of Russia, Republic of Altay highlighted; source: eclareon 2019, generated with Charts Pixel Map
2.3.1 Current energy supply situation and renewable energy potential
The Republic of Altai is located in the second price zone (the north-western territories close to the border
with the Biysk power district of the Altai Krai), with the exception of the territories that are not technologi-
cally connected to the UPS of Russia and technologically isolated territorial electric power systems [128] .
All power grids in the region are united in one net and these centralized power grids only cover 30% of the
territory. Some areas are remote while others are barely accessible (e.g. mountainous areas), others, like the

dena study „Market study in the context of decentralized energy supply using renewable energy technologies in selected Russian regions“ 75
Altay State Nature Reserve, are prohibited for grid construction Currently, there are 12 villages with no cen-
tralized power supply. Figure 33 illustrates the schematic energy system of the region and major known
power plants of the region.
Figure 33 Largest SPPs of Republic of Altai and known location of some small off-grid energy generating; source: eclareon 2019, gener-
ated with amCharts Pixel Map, Head of Republic of Altai, 2018 [81], Gavrischenko, V.P. [82]
There are several players in the energy market of the region:
All grids in the region are under control of ROSSETI through their local grid operator “Altaienergo”, which is
a subsidiary of “Gorno-Altaisk Electrical Grids”
Energy supply is committed by JSC “Altaienergosbyt” which is the only energy sales company in the Re-
public of Altai. “Altaienergosbyt” is a subsidiary of “Altaienergo” (ROSSETI group) and serves the needs of
Altai Krai and the Republic of Altai.
The only relatively large energy generating company is Hevel
“Solar Energy” Ltd., the administration of the Chelushman rural settlement and the administration of the
Saratan rural settlement of the Ulagan district of the Altai Republic are the guaranteeing suppliers of elec-
tric energy in less accessible and remote settlements of the region [129].
Gorno-Altaisk
Altai Krai
Small Hydro Power PlantSmall Wind Power plantSolar Power Plant „Hevel“Small PV (sometimes hybrid with petrol/diesel)Regions with centralizedpower gridAltay State Nature Reserve
Teletskoye Lake
Mayminskaya solar PP
Ust-Kanskaya solar PP
Kosh-Agach solar PP-1Kosh-Agach solar PP-2
Ongudaj solar PP

Figure 34 Scheme of the relations between major active in Republic of Altai energy companies; source: research by eclareon
Until 2015, there was no domestic generation in the Republic of Altai with the exception of ten small diesel
power plants (installed capacity between 30 and 150 kW), a number of small WPPs and two small HPPs
which together had an installed capacity of around 1.3 MW. There is additional RES installed off-grid capacity
which supplies local consumers in natural reserves and cordons (such as hybrid wind-solar and small PV in
cordons Katarash, Kamga, Chiri). Its overall volume is hard to estimate. Those energy generating facilities are
still in operation and are examples of pure off-grid generation. They supply 12 remote settlements and local
applications.
The five villages isolated from the grid are located in the Turachak municipal region, where energy is gener-
ated by diesel gensets and hybrid solar-diesel power plants (PV part is small), e.g. in Yaylu village, the terri-
tory of a state nature reserve, a hybrid PP has 80 kW diesel and 20 kW PV installed capacity [78] [86]; in
Artabash (also nature reserve); wind turbines in cordon Kokshi.
Two villages in the Kosh-Agach municipal region, where energy is produced by a 30 kW diesel genset and a
small HPP of 630 kW [83]
Five villages in the Ust-Ulagan region supplied by diesel and hybrid solar-diesel power facilities and a HPP
Kairu, in operation since 2002 and has 400 kW installed power capacity; cordon Bele has a hybrid petrol-
wing generator (6 kW wind) [79]; cordon Chelyush is supplied by a hybrid PV-wind power plan; village Kok-
Pash has a wind genset of 6 kW supplying 10 families living there with energy [80].
Power generation by these plants was only 4.4 % of the overall energy consumption in the Republic of Altai.
After 2015, the situation changed with the launch of the four large SPPs: Kosh-Agach SPP-1 and SPP-2, with 5
MW capacity each, both built in 2015; Ust-Kanskaya SPP, 5 MW, launched in 2016; Mayminskaya SPP, 20 MW,
opened in 2017; Ongudaj SPP, 5 MW, also launched in 2017.
The installed power capacity in the region is shown Figure 35. It is important to note that the data presented
on the chart for wind and diesel and hybrid PV-diesel most likely differs slightly from the real numbers.
“ROSSETI“
PJSC „Interregional Distributive Grid Company of
Siberia“ – transportation and distribution of energy on the territories of Republic of Altay, Buryatia,
Khakassia, Trans-Baikal Region, Krasnoyarsk Krai, Kemerovo,
Omsk Oblast
Gorno-Altaisk
Electrical Grids
JSC “Altayenergo“
JSC
“Altayenergosbyt“
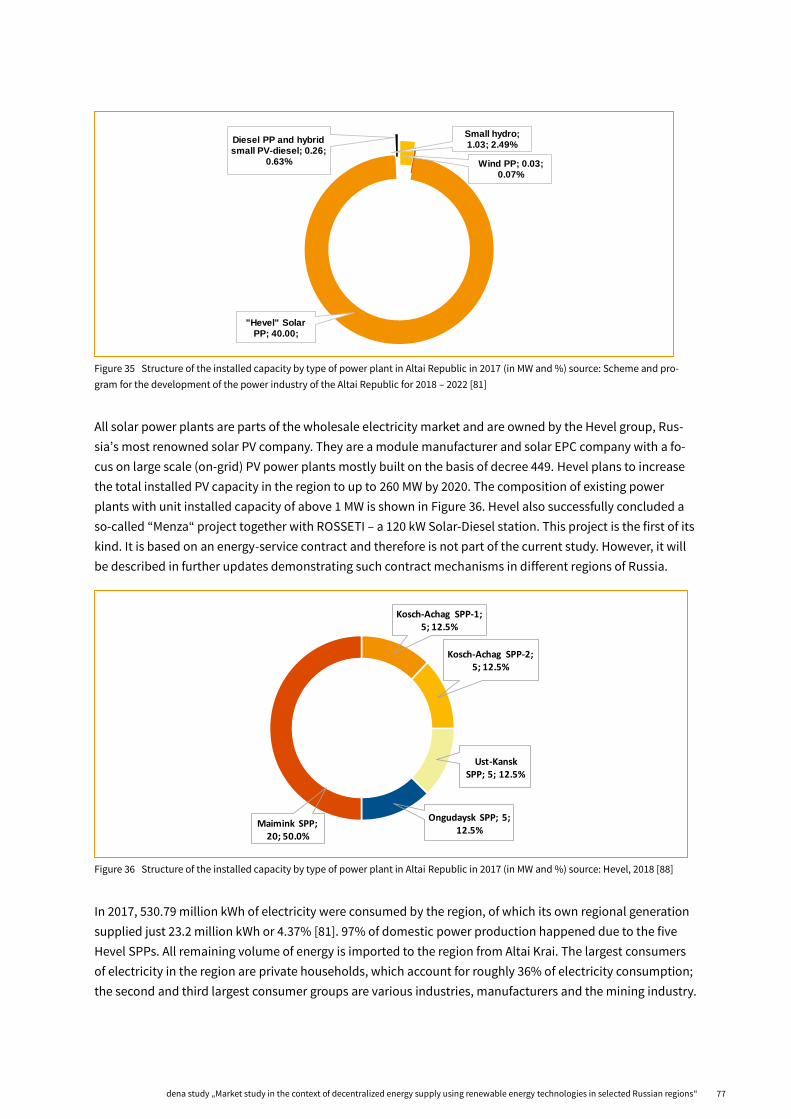
dena study „Market study in the context of decentralized energy supply using renewable energy technologies in selected Russian regions“ 77
Figure 35 Structure of the installed capacity by type of power plant in Altai Republic in 2017 (in MW and %) source: Scheme and pro-
gram for the development of the power industry of the Altai Republic for 2018 – 2022 [81]
All solar power plants are parts of the wholesale electricity market and are owned by the Hevel group, Rus-
sia’s most renowned solar PV company. They are a module manufacturer and solar EPC company with a fo-
cus on large scale (on-grid) PV power plants mostly built on the basis of decree 449. Hevel plans to increase
the total installed PV capacity in the region to up to 260 MW by 2020. The composition of existing power
plants with unit installed capacity of above 1 MW is shown in Figure 36. Hevel also successfully concluded a
so-called “Menza“ project together with ROSSETI – a 120 kW Solar-Diesel station. This project is the first of its
kind. It is based on an energy-service contract and therefore is not part of the current study. However, it will
be described in further updates demonstrating such contract mechanisms in different regions of Russia.
Figure 36 Structure of the installed capacity by type of power plant in Altai Republic in 2017 (in MW and %) source: Hevel, 2018 [88]
In 2017, 530.79 million kWh of electricity were consumed by the region, of which its own regional generation
supplied just 23.2 million kWh or 4.37% [81]. 97% of domestic power production happened due to the five
Hevel SPPs. All remaining volume of energy is imported to the region from Altai Krai. The largest consumers
of electricity in the region are private households, which account for roughly 36% of electricity consumption;
the second and third largest consumer groups are various industries, manufacturers and the mining industry.
Small hydro; 1.03; 2.49%
Wind PP; 0.03; 0.07%
"Hevel" Solar PP; 40.00;
Diesel PP and hybrid small PV-diesel; 0.26;
0.63%
Kosch-Achag SPP-1; 5; 12.5%
Kosch-Achag SPP-2; 5; 12.5%
Ust-Kansk SPP; 5; 12.5%
Ongudaysk SPP; 5; 12.5%
Maimink SPP; 20; 50.0%

Unlike other regions described in this study, where losses of energy in grids do not exceed 13% of the overall
energy consumption, in the Republic of Altai losses are much higher and represent close to 20% of total con-
sumption. This occurs because power lines of 110 kV stretch long distances from energy generating facilities
located in Altai Krai until it reaches end consumers in the Republic of Altai, especially those located in south-
ern parts of the region. The longest power lines stretch for more than 600 km from Bijsk in Altai Krai (and its
big CHPPs) to Kosh-Agach region in the Republic of Altai. Figure 37 illustrates consumption of energy in the
region in 2017. Energy consumption in the region is uneven throughout a year and peaks of consumption
happen in winter the main reason being heating needs.
In the Republic of Altay, there are still areas which have no electricity supply at all and where it is too expen-
sive to stretch the power grid. Simultaneously, a large part of the regional territory borders with a state na-
ture reserve where it is prohibited to build grids. Still, these areas are often inhabited and sometimes settle-
ments are very small, about ten households. An illustrating solution for such settlements, would be a case of
Kok-Pash. The settlement is currently supplied with energy by a 6-kW wind park consisting of three small
wind turbines built in 2010 and combined with an energy storage system [80]. Before 2010, energy needs of
this settlement had been covered by a diesel genset and exploitation of the wind park saved about 6 tons of
diesel within the first ten months [84].
Figure 37 Electricity consumption in Altai by type of consumer, %, 2017; source: Federal State Statistics Service of Russia, 2018 [54]
The Republic of Altai has significant solar energy resources [89] with roughly 300 sunny days annually and an
average annual solar irradiation of 1,200 – 1,300 kWh/m2/year [164]. The total potential of wind energy in the
Republic of Altai is about 50 billion kWh/year.
2.3.2 Electricity tariffs and costs
The Republic of Altai (its territories covered by UPS) is located in the second price zone of electricity market
of Russia. However, its disconnected areas are considered isolated zones and are therefore regulated by
other price formation rules.
The power grids in the region stretch unevenly throughout the territory and energy has to travel long dis-
tances until it reaches the end consumer resulting in large losses (up to one fifth of electricity). As a result,
Agriculture1.81% Mining industry
14.41%
Other industries
18.42%
Construction of buildings
1.87%
Transport and communications
3.38%Other 4.96%
Private households/ residential customers
35.90%
Losses in grids19.25%

dena study „Market study in the context of decentralized energy supply using renewable energy technologies in selected Russian regions“ 79
costs of energy transition and distribution in the region are especially high and seriously influence the end
price for electricity.
In 2018, the Altai Republic had the eighth most expensive tariffs for electricity for private households [91],
despite the fact that in 2016 the region ranked seventh [92]. Taking into account the high level of losses in the
grids (19.25%), the cost of transport and distribution of electrical energy becomes prohibitive. As a result,
more than two thirds of the costs that form electricity tariffs for end users are accounted to its transmission,
distribution and sales within the Republic of Altai.
On the territory of the region, the state regulation of tariffs (prices), including electricity, is carried out by the
tariff committee of the Altai Republic. For population and categories of consumers equated to it, the tariff for
electricity is set at regulated tariffs established by the tariff committee of the Republic of Altai, within the lim-
its of the range established by the FTS (Federal Tariff Service) of the Russian Federation.
In 1/1 of 2019, tariffs for private consumers were [157]:
Rural population, night tariff 2.88 RUB/kWh (0.04 EUR/kWh) – day tariff 4.14 RUB/kWh (0.05 EUR/kWh)
Urban population (households with gas stoves), night tariff 4.04 RUB/kWh (0.05 EUR/kWh) – day tariff 5.83
RUB/kWh (0.07 EUR/kWh)
Single rate tariff (no differentiation by daytime or voltage) rural population 3.60 RUB/kWh (0.05 EUR/kWh)
– urban population (households with gas stoves) 5.06 RUB/kWh (0.07 EUR/kWh)
For a group of other consumers in the price zone, which includes all organizations and entities, the tariff for
electricity is set at unregulated tariffs [93]. The unregulated price is formed under the influence of market fac-
tors of the wholesale market and may change from month to month under wholesale market conditions. Ta-
ble 8 presents the limit levels of nonregulated prices for electricity for January 2019 as first and second price
categories:
Type of voltage / type of
tariff
High voltage (110
kV and higher)
Middle first volt-
age (35 kV)
Middle second
voltage (20-1 kV)
Low voltage
(0,4 kV and
less)
The first price category, RUB / kWh (EUR/kWh) (with VAT), for January 2019, non-residential consumers under 670
kW loads
Single-rate tariff 5.72 (0.08) 6.6 (0.09) 6.77 (0.09) 7.4 (0.10) The second price category, double day zone tariff, RUB / kWh (EUR/kWh) (with VAT), for the January 2019, non-resi-
dential consumers under 670 kW loads
Day zone 7.73 (0.10) 8.65 (0.12) 8.78 (0.12) 9.43 (0.13)
Night zone 4.48 (0.06) 5.40 (0.07) 5.54 (0.07) 6.18 (0.08)
The second price category, three day-zones tariff, RUB / kWh (EUR/kWh) (with VAT), for January 2019, non-residen-
tial consumers under 670 kW loads
Peak zone 9.72 (0.13) 10.64 (0.14) 10.77 (0.14) 11.42 (0.15)
Semi-peak zone 5.79 (0.08) 6.71 (0.09) 6.85 (0.09) 7.49 (0.10)
Night zone 4.48 (0.06) 5.40 (0.07) 5.54 (0.07) 6.18 (0.08)
Table 8 Tariff for electricity for other consumers in the price zone of the Republic of Altai for October 2018; source: “Altayenergosbyt”
JSC, 2018 [95], Time2Save [130]
For consumers in regions with decentralized energy supply the size of payments is determined on the basis of
regulated electricity prices, established by the executive authority of the state tariff regulation [96].

Electricity tariffs for companies in the second price zone may differ from tariffs in isolated areas by three to
seven times. In an attempt to make the tariff payable and to level the difference in tariffs for the population
in different price zones local municipalities get subsidies. In 2017, this subsidy amounted to 7.3 million RUB
(95,200 EUR) [97]. In 2018, three unofficially disclosed municipalities received subsidies of 7.6 million RUB
(about 102,870 EUR) [98]. Simultaneously, there is a cross-subsidization: costs associated with energy supply
of the respective consumer group in the isolated zones are transferred to other consumers of the price zone.
In the first half of 2018, the value of cross-subsidization amounted to 109.6 million RUB in total (about 1.4
million EUR), in the second half of 2018 it was 108.1 million RUB (about 1.45 million EUR) [99].
2.3.3 Regional business environment & specific legal and regulatory framework for energy supply
The main off-grid consumers of electricity and heat in the region are enterprises in the housing and utilities
sector. The most promising consumers of off-grid and RES-based systems are remote rural settlements and
animal husbandry and woodworking enterprises. In all regions of the republic, enterprises process agricul-
tural products and wild plants, but the share of agriculture in total energy consumption is very low at roughly
2%. A motivation for the local administrations to implement RES in off-grid areas is to reduce losses in grids
as well as reduce costs needed to stretch new grids to the settlements. Investments and equipment for solar
power plants in the Republic of Altay mainly come from Hevel LLC. The company LLC Solar Energy, designs,
installs and maintains power plants. A local utility company operates generation facilities.
The Altai Republic is subject to the basic laws focused on the renewable energy sources listed in section 1 of
the report. Currently, there are no specific schemes to support the development of renewable energy in the
region. However, some schemes may appear in future due to the growing popularity of RE. The “Strategy of
Social and Economic Development of the Altai Republic for the Period until 2035” contains recommenda-
tions for necessary steps that will ultimately lead to lower prices for energy carriers in the region and make it
less energy-dependent by developing domestic power generation that is affordable and reliable. The docu-
ment provides the following steps aimed at meeting the goal:
further diversification of the production of RES-based electricity (PV and hydro):
creation of an economically favourable environment for private investments into RES and supporting en-
ergy projects on terms of a public-private partnership
modernization of existing generating equipment;
reduction of losses in grids;
creation of conditions for technological connection of new consumers.
Meeting the challenges of energy development will allow the Republic of Altai to achieve the following sys-
temic effects by 2035:
reduction of energy shortage during winter periods
increase of energy and environmental safety;
easier consumer access and reliability of power supply
reduction of power losses and improved grid efficiency

dena study „Market study in the context of decentralized energy supply using renewable energy technologies in selected Russian regions“ 81
2.3.4 Regional specific business case
In 2013, the first autonomous hybrid PV-diesel system in Russia was constructed in the region – the project
“Autonomous hybrid power plant in the village of Yaylu” [87]. It was implemented within the framework of a
state contract of the Ministry of Education and Science of the Russian Federation to create PV pilot projects
carried out under the “Federal Target Program for Research and Development in Russia for 2007-2013”. The
objectives of the project were: round-the-clock supply of the 200 inhabitants of the village and R&D of an au-
tonomous hybrid system. Before this project, outages happened daily and could last from several hours to
the whole night.
A hybrid installation in Yaylu has a capacity of 100 kW and is located on the territory of the Altai State Bio-
sphere Reserve. The system was amended to compliment an outdated diesel generator and reduce diesel
consumption by 50-60%. An engineering design of the system combined modern technologies and allowed
to effectively distribute the load between the photovoltaic system, storage devices and diesel generators.
The Ministry of Education and Science of the Russian Federation provided major investments, while Hevel
LLC co-financed the project. The project was design and constructed by Hevel, Avelar Solar Technology (part
of Renova GC), Solar Energy (Altai Republic local company that installed the system) and “Ioffe Physical-
Technical Institute of the Russian Academy of Sciences”. Hevel owns the system, while Avelar Solar Technolo-
gies is a system operator.
The power plant is controlled automatically but there is a remote backup diesel genset that can be switched
on in case of energy shortages. 30 to 40% of energy comes from a PV system, while the rest is supplied by a
diesel generator. This system generates up to 1,400 kWh/kWp, which is one of the highest values in Russia.
The warranty period of the power plant is 25 years.
Composition of the installation:
photovoltaic system consists of thin-film solar modules - 60 kW;
diesel generators with a unit capacity of 40 kW;
energy storage;
remote control.
The contractual relationship between key project stakeholders is illustrated by the scheme shown in Figure
38.

Figure 38 Scheme of relations between different stakeholders while implementing a new project; source: based on the research com-
pleted by eclareon and IP Kekelidze
For now, it is the only automated power plant of such a large size in Russia, which is able to cover the energy
demand of a whole village 24 hours a day. In the Republic of Altai, a potential market for such plants is esti-
mated to be 1-3 MW.
2.3.5 Business model description
To successfully develop a PV plant specific steps need to be undertaken. These steps are presented in Figure
39 below and include the actors needed to complete each step. The process of cooperation between different
stakeholders while RES project development is described in 2.4.4. The overall duration of the project’s imple-
mentation is usually about 1.5 years for a solar power plant and 2.5 years for a wind farm.
Before starting a project, it is necessary to negotiate with local authorities, the local distribution grid compa-
nies and the ministries responsible for various granting permits (e.g. Ministry of Regional Development).
These negotiations usually take about two weeks; however, the process may last longer. Delays may happen
due to the poor communication between different agencies, ministries and administration departments and
because one has to address each unit separately and sometimes several approaches are necessary. Moreo-
ver, despite the connection of the power plant to the grid being step 5 the negotiations with the grid com-
pany (for most of the territory it is “IDGC of Siberia - Gorno-Altai Power Grids”) should be completed before
the project starts. This is essential because of the “technical conditions” requested by the grid company: it is
important to discuss the connection voltage and specifications of the transformer, agree on the capacity of
the RES power unit for its compatibility with an existing DPP and discuss other operational and connection
peculiarities prior to launching a project.

dena study „Market study in the context of decentralized energy supply using renewable energy technologies in selected Russian regions“ 83
Figure 39 Scheme of the project's flow; source: based on the research completed by eclareon and partners of the project
It is important to take into consideration that due to climatic conditions, there is only a short period between
May and October that is suitable for construction activities. Should a project not be completed in this period
construction will have resume the following year.
2.3.6 Profitability analysis (inputs, outputs, scenarios, sensitivities)
In the following, an exemplary profitability analysis for the RES share of an autonomous hybrid power plant
with battery storage in the village of Yaylu is presented. The input parameters and results of the calculated
base case are shown in the following figure:

Figure 40 Project Overview – Yaylu diesel-PV hybrid with storage; source: eclareon calculations, based on input data researched by
EUROSOLAR Russia, 2018
The graph shows that the installation in Yaylu is viable from a financial perspective but the payback period is
rather long with less than 15 years. Battery replacement has been assumed to take place in years 9 and 17
and 25 under the assumption of declining battery prices which explains the decrease of cash flow available
for equity in those years, see following figure:
Figure 41 Equity Cash Flow – Project Overview – Yaylu diesel-PV hybrid with storage; source eclareon calculations, based on input data
researched by EUROSOLAR Russia, 2018
The cash flow available for equity also increases year by year with the exception of those years when the bat-
tery is replaced. This general increase is based on the assumption that the diesel that is replaced by solar
PV System System Operation
Project Duration Years 25 Applied Yield kWh/kWp/a 1.200
PV System Size kWp 60,00 Average Yearly Generation kWh/a 65.139
PV Battery Capacity kWh 20,00 Self-Consumption Rate % 90%
PV System Costs RUB/kWp 118.000 Genset efficiency kWh/ltr 3,00
Total System Cost RUB 7.622.800 Average Replaced Diesel Consumption ltr/year 19.107
Performance Factor % 80% Diesel Price (1st Ops Year) RUB/ltr 43,37
Degradation % p.a. 1% Diesel Price Escalation % p.a. 6%
Battery Replacement Interval Years 8 Fixed Operation Costs RUB p.a. 114.342
Total Battery Replacement Costs RUB 757.497 Longterm Insurance Costs % p.a. -
Debt (Gearing) 30% RUB 2.286.840 Net-Present Value RUB 3.182.258
Loan Tenor Years 5 Project IRR % 14,16%
Grace period Years - Equity IRR % 14,19%
Debt Interest Rate % 11% Payback Period Years 14,88
Initial Equity RUB 5.410.971 LCOE (no subsidy) RUB/kWh 15,89
Additional Equity RUB 49.716 Min DSCR** x 0,92 x
Discount Rate % 10% Min LLCR*** x 1,33 x
Longterm Inflation Rate % 4% * LCOE: Levelized Cost of Electricity
** DSCR: Debt Service Coverage Ratio
*** LLCR: Loan Life Coverage Ratio
Financing Results
-6.000.000
-5.000.000
-4.000.000
-3.000.000
-2.000.000
-1.000.000
0
1.000.000
2.000.000
3.000.000
4.000.000
0 1 2 3 4 5 6 7 8 9 10 11 12 13 14 15 16 17 18 19 20 21 22 23 24 25
RU
B
Operations Year
Investment and Cash Flow for Equity
Cash Flow for Equity Equity Investment Cumulative Cash Flows

dena study „Market study in the context of decentralized energy supply using renewable energy technologies in selected Russian regions“ 85
power is becoming more expensive every year. Under the chosen financing conditions (loan tenor of 5 years
no grace period), the diesel savings are sufficient to repay the loan. Additional equity may however be re-
quired after year 1 in order to operate the plant. The equity is paid back after approx. 15 years. In the graph
this is illustrated by the blue line crossing the horizontal x-axis.
Changes in the irradiation conditions (specific yield), the system prices as well as the diesel price have an im-
portant impact on the business case as shown in the following sensitivity analyses (the base case values are
shown in rectangles):
The “Specific Yield” sensitivity shows how the equity payback period and the equity IRR would change if the
same installation were installed in an area with different solar irradiation. When the specific yield increases,
meaning if there is more irradiation available that can be converted into electricity, the equity IRR increases
and the payback period decreases. The respective values can be found when moving from left to right on the
X axis. In the base case the global tilted irradiation was at 1.500 kWh/kW/pa. The fact that not all of this irradi-
ation can be converted into electricity is accounted for by the performance factor that is set to 80%. The base
case therefore assumes 1.200 kWh/kWp/a that can be converted into electricity. If this value were higher, for
instance at 1.400 kWh/kWp/a, equity payback could already be reached after approx. 12 years and the equity
IRR would increase to approx. 16%.
Figure 42 Specific Yield Sensitivity – Project Overview – Yaylu diesel-PV hybrid with storage; source: eclareon calculations, based on
input data researched by EUROSOLAR Russia, 2018
Another sensitive factor is of course the system price. This is illustrated in the next graph. In this case, the
payback period increases when the costs are higher than in the base case calculation. The researched price
per kWp for the PV part of the Yaylu installation was at 118.000 RUB/ kWp (approx. 2.700€ with 2013 conver-
sion rates). To come up with the systems price, the storage costs need to be added which were assumed to be
as high as 27.140 RUB/kWh. The resulting systems price including storage is therefore as high as 127.000
RUB/kWp. These prices may seem rather high even for a small 60 kWp PV system with storage. However, it
22,0
17,8
14,9
12,911,4
10,2
14,9
8%
10%12%
13%15%
16%18%
19%
14%
600 800 1.000 1.200 1.400 1.600 1.800
Specific Yield [kWh/kWp/a]
Amortization [a] Equity IRR [%] Base Case

needs to be reminded, that the systems described in this report are no standard solutions but can rather be
regarded as pioneering installations. A factor that can explain a rather high price is that the installation of PV
and other RES in Russia is a rather recent phenomenon which means that actors did not yet have the chance
to accumulate years of experience and that, as a consequence, there is room for improvement along the de-
velopment of similar projects today. As projects become more standard and more experience is accumu-
lated, costs are likely to go down. What this means for an equity investor can for example be seen when look-
ing at the results for the payback period and the equity IRR if the system price were assumed to be at 100.000
RUB/kWp: in that case, payback would decrease to approx. 11 years and equity IRR would increase to approx.
18%. This can be seen in the following graph when moving to the left on the horizontal axis where system
prices are displayed.
Figure 43 System Price Sensitivity – Project Overview – Yaylu diesel-PV hybrid with storage; source: eclareon calculations, based on
input data researched by EUROSOLAR Russia, 2018
Moreover, the diesel price today and its development over time play an important role for the business case.
This is shown in the following two graphs.
9,110,8
12,7
14,9
17,4
20,2
23,5
14,9
22%
19%
17%15%
13%12%
11%10%
14%
80.000 100.000 120.000 140.000 160.000 180.000
System Price [RUB/kWp]
Amortization [a] Equity IRR [%] Base Case

dena study „Market study in the context of decentralized energy supply using renewable energy technologies in selected Russian regions“ 87
Figure 44 Diesel Price Project Overview – Yaylu diesel-PV hybrid with storage; source: eclareon calculations, based on input data re-
searched by EUROSOLAR Russia, 2018
Figure 45 Diesel Cost Escalation Project Overview – Yaylu diesel-PV hybrid with storage; source: eclareon calculations, based on input
data researched by EUROSOLAR Russia, 2018
22,0
17,8
14,9
12,911,4
10,2
14,9
8%
10%12%
13%15%
16%18%
19%
14%
25,00 30,00 35,00 40,00 45,00 50,00 55,00 60,00
Diesel Price [RUB/ltr]
Amortization [a] Equity IRR [%] Base Case
23,2
16,6
13,712,0
10,8
14,9
3%
6%
9%
12%
17%
19%
21%
14%
-4% -2% 0% 2% 4% 6% 8% 10% 12% 14%
Diesel Cost Escalation [% p.a.]
Amortization [a] Equity IRR [%] Up Case

The diesel price in the base case was assumed to be at approx. 43 RUB/ liter. These costs are not high com-
pared to those in isolated territories, e.g. in Batagai. This relatively moderate price does not favor the busi-
ness case: The higher the diesel costs the better the RES business case would be from the perspective of an
investor. If the base case assumption were changed, the diesel price sensitivity (Figure 44) shows that, with a
diesel price higher than 43 RUB/ liter, the payback period would go down while the equity IRR would go up.
Another sensitivity that has an impact on the key results of a business case is the future development of die-
sel prices. An investment is paid back over time which means that it is necessary to estimate how certain crit-
ical parameters will change over time. Future diesel prices are not assumed to stay as they are today. The an-
nual diesel price escalation in the model was assumed to be at +6% for Yaylu. This is the lowest value for all
business cases presented in this report: for truly isolated areas (business cases in Yakutsk and Kamchatka)
increases were at 10%. For non-isolated but installations in remote areas (business cases for Altai, Bashkor-
tostan and Krasnodar) values between 6% and 8% were chosen in order to reflect the difference in logistical
challenges between the regions. If diesel costs were escalated with more than 6% p.a. in Yaylu the payback
period and the IRR for the equity would change accordingly: an annual diesel costs escalation of 10% would
decrease the payback period to approx. 11 years and increase the equity IRR to 19%. However, it can of
course also be assumed that the diesel price escalation is lower than in the base case. If that were the case,
the payback would increase and the IRR decrease.
2.3.7 Potential for cooperation/business opportunities
The RES market in the region is developing relatively quickly and there are both pros and cons for the per-
spective of RE deployment in the decentralized energy region of Republic of Altai:
The Republic Altai has a good relationship with PV and small hydro power, so the overall attitude towards
wind, PV and other types of RES is positive, and thus awareness raising and advertising of RES is less re-
quired;
Electricity for mining enterprises, agriculture, tourism, recreation facilities, and social facilities in the
southern regions of the country will require the further development of generating complexes based on
renewable energy sources;
The government of the Republic of Altai plans to achieve a total installed capacity of 145 MW of renewable
energy by 2022, which should solve the problem of the region’s energy shortage.
There is promising potential for PV in Altai because of modern technology, the vast available land and the
300 sunny days a year the region has. As a result, centralized, decentralized and individual energy supply
all have great potential.
The total technical potential of small hydropower industry of the Altai Republic is 5.20-6 billion kWh / year.
The construction of a cascade of small hydropower stations on Chuya may initiate interest in building a
wind farm in this valley, to compensate for the reduction in hydropower capacity in the low-water winter
season. Twelve remote settlements that are off-grid, will be isolated for years and need alternative energy
sources. These settlements have high diesel costs due to transportation and the risk of blackouts is high if
the diesel cannot be delivered on time - RES would partially decrease this risk. Economically, the high die-
sel costs make the payback of PV investments possible because there is a positive IRR and NPV;

dena study „Market study in the context of decentralized energy supply using renewable energy technologies in selected Russian regions“ 89
Existing DPPs are outdated and most of them will need to be replaced or enhanced in the next 10 years - a
viable alternative could be RES. The older the diesel generators are, the smaller the installable PV capacity
is, assuming that no further technical upgrades are done (fuel save controllers etc.);
Diesel costs have been rising, driving diesel-based electricity prices up further and thereby leading to fur-
ther growth of subsidization and cross-subsidization to keep the prices low for end-consumers;
Hevel is well represented in Altai and has ambitious plans to construct 145 MW of solar based power. This
will attract more investments into the region and will likely push local policy-makers towards creating leg-
islative framework to make PV and wind in Altai more feasible;
Both existing mining sites and planned ones need a stable electricity supply, RES could provide this stable
supply for mining companies that usually operate in remote areas. Such solutions could decrease opera-
tional costs of extraction, leading to lower costs for the final goods and an increase in the net profit.
2.3.8 Risks and barriers
Despite the positive factors, there remain a number of challenges impeding the development of RES projects:
Logistics is a challenge: access to the region is difficult and the region is located far from European borders.
Harsh climate conditions mean that neither PV, nor wind is considered standard. A new supplier who has
no prior experience in severe climate conditions (similar to Canada, Alaska etc.) needs to take this into con-
sideration;
There is no mature RES market in the region and foreign entities need to cooperate with Russian partners
for marketing and logistics operations;
The market size for the next 5-10 years is 1-3 MW - the larger the share of renewables in a hybrid solution,
the larger upfront CAPEX is needed to upgrade existing diesel power plants and import modern control
technologies;
The current Russian subsidy system (cross-subsidies and direct subsidies) targets the reduction of operat-
ing costs, such as expensive diesel fuel, however, there are no direct investment subsidies that would re-
duce the high initial CAPEX needs;
The current absence of long-term tariffs creates additional risks for investors;
Due to geographical location of the region, transportation of equipment from Europe becomes rather ex-
pensive. At the same time, China is much closer to the borders and is interested in the regional market. Eu-
ropean companies may however get a niche of know-how and qualified O&M providers.
To get partnerships and support from local PV and energy companies, it is essential to develop relation-
ships with these organizations. Using common contact information published on official company web-
sites is often not enough to develop successful cooperation and partnerships.

2.4 Bashkortostan
The Republic of Bashkortostan (or Bashkortostan) is located in the southern part of the Ural Mountains on
the border to Europe and Asia. Bashkortostan covers 142,900 km2. With more than 4 million people living in
Bashkortostan the region is the seventh largest by population density in Russia, with 28.5 people/km2[63],
and overall population. There are 21 cities and 4,532 villages in the region, however more than 60% of the
population lives in cities. The continental climate of Bashkortostan gives the region a warm summer with an
average July temperature of+20 C0 and a long and cool winter with -15 C0 in January [64]. More than 1 million
people which is 27.5% of the overall population live in Ufa, the region’s capital city.
Figure 46 Map of Russia, Bashkortostan highlighted; source: generated with amCharts Pixel Map
Bashkortostan is one of the leading industrial and agricultural regions of Russia; oil and gas extraction re-
gions and also a center for chemical industry and machinery. The fuel and energy industries play a key role in
the economy: they generate 70% of the region’s total profit and represent 85% of its export to other regions
[65].
2.4.1 Current energy supply situation and renewable energy potential
Bashkortostan is part of the UPG of Ural which again is a part of the UPS of Russia. In Bashkortostan, there
are 10 power grid systems (energy systems), that are connected with the UPS and with each other. Energy
consumption is highest in the central power grid. The region consumes slightly more energy than it pro-
duces: a bit more than 85% of electricity demand is supplied by the region’s own energy generation capaci-
ties. Some energy is imported from the neighbouring regions: Chelyabinsk and Orenburg.
The main players of the regional energy market are the following [66]:
Republik ofBashkortostan
Ufa

dena study „Market study in the context of decentralized energy supply using renewable energy technologies in selected Russian regions“ 91
One energy supplier or the “guaranteeing supplier” (default provider of electricity) – “Bashelectrosbyt” Ltd.
(Electricity Supplier of Bashkortostan), subsidiary of “INTERRAO EES” (in other words, State-owned com-
pany).
21 energy supply companies having contracts with “Bashelectrosbyt”; among them are “MagnitEnergo”,
“Energy Supply Company of RusHydro”, “Mosenergosbyt” (Moscow energy company)
JSC “BESK” – Bashkortostan’s electricity grid company, a private corporation, managing power grids in the
region and owning three further companies (see Figure 47). Currently, there are negotiations between the
owners and “FSK EES” (ROSSETI group) about purchasing of “BESK” by “FSK EES”
Several energy generating companies, the largest being “BGC” Ltd. (Bashkortostan generating company) a
subsidiary of “INTERRAO EES”. The company owns 4,423.2 MW (1 Condensing power plant (working on
gas), 10 CHPPs, 7 Hydropower plants and 1 wind park) of generating capacity in the region, which is 86% of
overall regional installed electrical capacity; smaller companies own and manage other power plants.
Figure 47 Organization chart of “BESK”; source: official web site of “BESK” [69]
In 2017, the overall installed electrical capacity in Bashkortostan reached 5,140.33 MW, slightly more than in
2016. The largest power plants in the region are [66]:
Condensation Electric Power Plant Karmanovskayja (electrical installed capacity 1,821.1 MW, generates
electricity only)
Ufa’s CHPP-2 (519 MW)
Sterlitamakskayja CHPP (320 MW)
Ufa’s CHPP-4 (270 MW)
Novo- Sterlitamakskayja CHPP (255 MW)
Priufimskayja (near Ufa) CHPP (210 MW)
Figure 48 shows information about the types of power plants in 2016.More than 94% of the overall installed
power capacity in the region refers to combined heat and power plants (CHPP), which are mainly powered by
gas and represent more than 95% of total fuel types used at CHPPs. The share of mazut in energy generation
is around 3.5% and the share of coal is less than 0.5% [67]. Hydropower plants account for 4% of the total
installed capacity of the region.

Figure 48 Structure of the installed capacity by type of power plant in Bashkortostan in 2017, in MW and %; source: Ministry of Industry
and Innovation Politics of the Republic of Bashkortostan, 2019 [66]
RES (wind and PV) only have a share of less than 1% of installed capacity. Some large industrial companies,
specifically the chemical industry, oil refinery and oil and gas extraction, use their own, decentralized energy
generating facilities which are sometimes fueled by diesel. The installed PV capacity is mainly split between
the following solar power plants: Buribajevskayja (20 MW); Isyangulovskaya (9MW); Buchul’chanskayja (par-
tially under construction, 3 arrays of 5 MW each, one of them is located in another place than the two and is
called Buchul’chanskayja-1).
All of them belong to “Avelar Solar Technology” (a subsidiary of “Hevel”). The only wind power plant
“Tyupkildyi” was launched in 2002 and built by “Bashkirenergo”.
Figure 49 Largest power plants of Bashkortostan; source: eclareon 2019, generated with amCharts Pixel Map, “BGC” Ltd. [70], “Hevel”
Combined heat and power plants;
4,817; 94%
Hydro PP; 223.4; 4%
Wind PP; 1.7; 0.03% Solar PP; 44.0; 0.86%
Own power plants of industries; 54.0; 1%

dena study „Market study in the context of decentralized energy supply using renewable energy technologies in selected Russian regions“ 93
23,799 million kWh of electricity was generated in 2017. 95.4 % of energy was generated by combined heat
and power plants; RES, including hydro, generated 4.63 % of energy; the remainder was generated by indus-
trial companies’ own generation facilities. The overall per capita electricity consumption in Bashkortostan in
2017 was 6,668.7 kWh/capita [66]. The electricity consumption in 2017 was 27,234 million kWh, with the larg-
est consumer in the region being the mining and refinery industry, which accounted for more than 60 % of
the total consumption (see Figure 50). Slightly more than 6% of overall consumption refers to other indus-
tries and a similar share of energy is consumed by the transport sector and used for communication needs.
11% of the total energy consumption is attributable to private households.
Figure 50 Electricity consumption in Bashkortostan by type of consumer, %, 2017; source: Federal State Statistics Service of Russia,
2018 [54]
The off-grid generation in the region is of little importance: the estimated off-grid RES installed capacity in
Bashkortostan is around 300 kW. This capacity is formed by small private generation. Other off-grid power
generators mostly work on diesel and gasoline, rarely on liquified gas. According to our research, there are
about 1,400 petrol and diesel based gensets of different installed capacity (between 3 and 500 kW) owned by
various regional municipalities, state organizations, energy companies and local branches of the Ministry of
the Russian Federation for Civil Defence, Emergencies and Elimination of Consequences of Natural Disasters.
Their total cumulative installed capacity reaches 60.7 MW. This capacity is, however, not included in the re-
gional energy generation figures since these gensets are only used in case of emergencies.
The territory of Bashkortostan gets 1,700-2,000 hours of sunshine annually, which corresponds to 1,150
kWh/m2/year [164]. The majority of PV projects in the region were built and operated by “Hevel”. In 2018, the
total cumulated installed PV capacity in the region reached 44 MW [73] and all solar power plants are inte-
grated in the wholesale electricity market. In addition, there are 2 small hybrid projects: a hybrid power gen-
erating facility consisting of a wind turbine, PV panels, energy storage and a petrol genset with an overall ca-
pacity of 21.5 kW in the village of Severny and a 600 kW installation consisting of PV panels, a wind turbine, a
petrol generator and energy storage capacity. However, both of these facilities are not functioning properly
due to the failure of inverters. Moreover, in 2014, “Hevel” installed 3 kW rooftop PV panels in a child sanato-
rium, generating up to 3,500 kWh annually and partly covering the sanatorium’s energy needs.
Agriculture1.80%
Mining industry63.61%Other industries
6.14%
Construction of buildings
1.39%
Transport and communications
5.69%
Other 1.99%
Privat households/residential customers
11.31%
Losses in grids8.08%

The market size for off-grid RES in Bashkortostan can be divided into four parts: small settlements, commer-
cial consumers, tourism, methodological equipment. The total potential capacity needed to serve the four
groups is estimated to be around 300 kW:
1. Residential sector: around 15 settlements with 3-7 households each where grids are very old and of bad
quality. Energy companies do not have the right to disconnect these settlements from the grid as they are
legally obliged to supply all households with electricity. At the same time, renovating and repairing exist-
ing grids is very costly, requiring investments of up to several millions RUB. Therefore, it is often more
economically efficient to provide these settlements with autonomous hybrid power plants between 5-
and 15-kW capacity depending on the size of the village. Currently, “Hevel” is developing a solution for
the village of Starosubkhangulovo which frequently suffers from power outages (in total, about 10 days
without energy annually).
2. Commercial consumers: An estimated number of 3 to 5 telecommunication equipment spots (transmis-
sion towers) need a more stable energy supply between 3 and 10 kW each.
3. Tourism: There are three large national parks and protected areas in Bashkortostan: South-Ural, Sulgan-
Tash and Altyn-Solok (a center of honeybee keeping). It is forbidden to build a grid through their territo-
ries, however energy is still needed there, for instance, for mobile phones charging, lighting, payment ter-
minals and other applications. Each of these application sites needs on average 10 kW of installed capac-
ity.
4. Weather equipment and traffic control systems: around 7 sites in the north-east of the region and Trans-
Ural region that need on average installed capacity of approx. 1 kW per site.
2.4.2 Electricity tariffs and costs
Bashkortostan is in the first price zone and is among Russian regions with relatively low electricity tariffs. In
2019, some tariffs for private customers for the main tariff groups were [158]:
rural population, night tariff 1.71 RUB/kWh (0.02 EUR/kWh)– day tariff 2.47 RUB/kWh (0.03 EUR/kWh)
urban population (households with gas stoves), night tariff 2.45 RUB/kWh (0.03 EUR/kWh) – day tariff 3.52
RUB/kWh (0.05 EUR/kWh)
single rate tariff (no differentiation by daytime or voltage) rural population 2.14 RUB/kWh (0.03 EUR/kWh) –
urban population 3.06 RUB/kWh (0.04 EUR/kWh)
Prices for non-residential consumers, again, differ. Due to the fact, that Bashkortostan is located in the first
prize zone of the electricity market of Russia, the electricity price changes each month depending on many
factors including wholesale energy and capacity price. However, there are ceiling prices, which are estab-
lished by the Federal Antimonopoly Service of Russia and some of them are presented in Table 9 below.

dena study „Market study in the context of decentralized energy supply using renewable energy technologies in selected Russian regions“ 95
Type of voltage / type of tariff High voltage (110
kV and higher)
Middle first
voltage (35 kV)
Middle sec-
ond voltage
(20-1 kV)
Low voltage
(0,4 kV and
less)
Ceiling electricity prices for February 2019, RUB/kWh (EUR/kWh) with VAT15, electricity for non-residential consum-
ers with loads under 670 kW, first price category
Single rate tariff 4.49 (0.06) 5.34 (0.07) 5.30 (0.07) 5.86 (0.08)
Ceiling electricity prices for February 2019, RUB/kWh (EUR/kWh) with VAT, electricity for non-residential consumers
with loads under 670 kW, second price category
Double day time tariffs
Night tariff 2.90 (0.04) 3.75 (0.05) 3.71 (0.05) 4.27 (0.06)
Day tariff 6.88 (0.09) 7.77 (0.10) 7.69 (0.10) 8.25 (0.11)
Tree day-time tariff
Night tariff 2.90 (0.04) 3.75 (0.05) 3.71 (0.05) 4.27 (0.06)
Semi-peak zone 4.68 (0.06) 5.54 (0.07) 5.49 (0.07) 6.05 (0.08)
Peak zone 11.10 (0.15) 11.96 (0.16) 11.91 (0.16) 12.47 (0.17)
Table 9 Some ceiling prices for the retail market’s consumers (non-residential consumers) of the electricity provided by “Bashel-
ektrosbyt” in 2019; source: “Bashelektrosbyt”, 2019 [159]
Other non-residential consumers which have energy receivers with the maximum capacity over 670 kW, have
different energy prices which are changing every hour and in accordance to the rules of the 3rd-6th price cate-
gories (see section 1.3).
Costs of RES-based electricity in the region are higher than costs of an energy produced by large power
plants fueled by gas: existing solar power plants feed electricity into the regional grid, and, according to an
ex-vice Minister of the Government of Bashkortostan, Dmitry Sharonov, in 2016, 1 kWh of energy produced by
“Hevel’s” solar plants costed around 8 RUB [75] ( approx. 0.1 EUR) which was 4 times higher than the average
market price [73]. At the same time, there are opinions that the price for solar energy was even as high as 25
RUB/kWh (0.33 EUR/kWh) [75]. The dominant solar company in the region “Hevel” does not officially publish
such information, so the real numbers are unknown. For various HPPs owned by “BGC” Ltd., electricity costs
in 2017 varied between 2.46 and 5.86 RUB/kWh (0.03 – 0.08 EUR/kWh) which is higher than the average elec-
tricity tariff in the region. The generation company “BGC” is planning to stop the exploitation of all their
small HPPs due to low economic effectiveness. The only regional wind park, also belonging to “BGC”, gener-
ates electricity for an estimated cost of around 11 RUB/kWh (0.15 EUR/kWh). At the same time, the cost of
energy generation by traditional CHPPs is on average 1.49 RUB/kWh (0.02 EUR/kWh) [75]. Due to the fact that
the volume of electricity generated by renewable energy sources is very small and its share in the overall en-
ergy mix of the region is tiny, such high costs of energy generation do not affect the end customer price for
electricity. There are no subsidies, which aim to drive the energy price down, allocated to these power plants.
Based on decree 47, the local grid company BESK is legally obliged to cover up to 5% of their grid losses with
RE-based electricity. Hence, the grid provider is the one who has to pay RE companies such as “Hevel”.
15 VAT in 2018 = 18%; VAT since 2019 = 20%

According to some estimations, were all electricity in the region to be produced by RES, citizens of Bashkor-
tostan would have to pay up to 4-5 times more for their energy bills monthly. Meanwhile, were heat to be pro-
duced by RES, the bills would become 7 times more expensive than they are now, which is, at current condi-
tions, unacceptable for the majority of the population [73].
2.4.3 Regional business environment & specific legal and regulatory framework for energy supply
With regards to solar PV there are currently no companies other than “Hevel” in the region. “Hevel” built all
their PV installations using Decree 449, and signed a contract with the regional government for the construc-
tion of 44 MW of solar capacity for the wholesale electricity market [66]. Apart from “Hevel’s” projects, no
other RE projects are planned in the region for the upcoming years.
In Bashkortostan, efforts were made to implement Decree 47 at the regional level: In 2017, the Government
of Bashkortostan published a Decree № 124 of March 29th about the terms and conditions of the competitive
processes aimed to include the RES based power generation in the retail market of Bashkortostan’s power
sector. This decree created the framework for companies to develop RES power plants in the region and it
provided guidance to local authorities and decision-makers. In Bashkortostan, a roadmap targeting the im-
provement of energy and gas infrastructure was implemented: this roadmap deals with the development of
the existing electric power facilities, the construction of new generation capacities and grid related ques-
tions.
In the region, ideas to modernize existing technologies and traditional energy sources have become popular
with time. For example, “BGC” Ltd. created an energy savings and energy efficiency program at its power
plants for the period 2018-2022- The goal is to replace and/or renovate equipment at existing CHPPs to de-
crease gas consumption. As a result of this program, fuel consumption decreased by 4.91 g/kWh to 313.95
g/kWh from 2016 to 2017. The target is to reach 301.26 g/kWh of fuel consumption by the end of 2022 [73].
Some new medical assistant stations are also being planned in villages and small settlements in Bashkorto-
stan in the next few years. These require energy and the best solution is seen to be diesel gensets due to their
low CAPEX. For this aim, modern efficient diesel and petrol gensets are planned to be purchased by the local
Government.
2.4.4 Regional specific business case
In 2015, a very first hybrid power plant was built in the Bashkortostan settlement Severny. This power station
uses various technologies:
grid connection
wind turbine – 3 kW installed capacity
PV panels – 12 kW
petrol genset – 6.5 kW
energy storage – 50 kWh
The overall installed capacity reached 21.5 kW. The power plant generated up to 15,000 kWh annually and
was aimed to supply the settlement with energy. For this project, the local grid operator “GIP-Energo” Ltd.

dena study „Market study in the context of decentralized energy supply using renewable energy technologies in selected Russian regions“ 97
was a customer and an investor. The existing grid in the area was outdated and the settlement frequently
suffered from power outages. Upgrading the grid with new technology was estimated to cost about 20 mil-
lion RUB (266,745 EUR), while a hybrid RES facility costed 10 times cheaper. The company tendered the pro-
ject, which was finally awarded to the local RES installer “Energoengineering” Ltd. From Ufa. This company
already has experience in constructing similar hybrid power stations in Bashkortostan: they have completed
several residential hybrid projects for private customers with an overall capacity of 300 kW since 2015. Other
project participants were the grid operator “GIP-Energo” as an initiator, the Ministry of Industry and Innova-
tive Policy of the Republic of Bashkortostan (local executive authority office agreed to a technical solution)
and “STR Alpha” Ltd. As a subcontractor.
During exploitation of the system, it occurred, that the location of PV modules was not optimal, as well as the
location of a wind turbine. In case they have been located with another inclines or direction of solar panels’
surface, they could have been working more effective. The village is tiny and has no own financial resources,
while investments from “GIP-Energo” covered only CAPEX and did not consider maintenance of the system.
Thus, sometime after the system had been launched, PV inverters broke, and as nobody could repair or ex-
change them, the system stopped supplying the village with electricity.
2.4.5 Business model description
For a typical hybrid project similar to the one in the Severny settlement, the following stakeholders should
be involved:
investors: local administration/municipalities; local grid operators; private investors
owners: territorial grid operator; local administration
engineering and distribution company/main contractor: “STR Alpha” Ltd.
equipment delivery by: Russian/German/Korean companies
O&M services: local grid operator/engineering company
consumers: households, telecommunication companies, municipalities
financial sources: local grid operator
There could be two different variants of contractual relationship between key stakeholders. The first is in
case financial sources come the regional budget in accordance to the current investment program in the re-
gion. The scheme is presented below.

Figure 51 Hybrid power plant business model with government support; source: own research [54]
For Severny there was no additional financial support. All investments were made by the grid operator.
Figure 52 Severny: Hybrid power plant business model without government support; source: own research [54]
For projects similar to Severny, a scheme presented in Figure 53 below is common: The average project’s du-
ration from the first official step to the launch of the system is 3 to 12 months. In the case of Severny, this was
12 months. All processes between the start of construction and sending the station to the operation takes
between 1 and 2 months.

dena study „Market study in the context of decentralized energy supply using renewable energy technologies in selected Russian regions“ 99
Figure 53 Project development steps; source: own research
For such projects, it is important to negotiate with the local administration and ministries in order to get all
licenses and permits required, specifically a license for energy generation and ecological permissions, and an
allowance to connect the power plant to the grid (in case of necessity). Before designing a project, research
regarding the effect on the environment is also to be submitted.
2.4.6 Profitability analysis (inputs, outputs, scenarios, sensitivities)
In the following, an exemplary profitability analysis for the RES share of the 15 kW wind /PV/ diesel project
with battery storage based is presented. The calculations refer to the RE parts of the installation only. The
reference model for this business case is the installation in Severny. It needs to be noted that this case is one
of the few installations in the regions for which data could be obtained. However, as described above, the
real installation is not functional at the moment and could rather be seen as an installation with a lot of im-
provement potential for future off-grid installations in the region. The base case parameters and calculation
results are shown in the following figure.

Figure 54 Project Overview – Severny Diesel-PV-Wind hybrid; source: eclareon calculations, based on input data researched by
EUROSOLAR Russia, 2018
Given that the installation in Severny is not located in an isolated territory system costs for both wind and
solar, without the storage, are lower than the costs of the business cases in Sakha and Kamchatka. Diesel
costs are also lower than in Batagai. The installation is also equipped with battery storage which increases
the initial investment requirements. Debt leverage is lower (30%) and interest rates are higher based on
higher perceived risk.
The graph shows that the installation in Severny could be, leaving aside the technical problems that ceased
operations of the “real” project, viable from a financial perspective but only just: even assuming that the dis-
count rate is only at 8%, equity payback takes as long as 19,5 years and this also only based on the assump-
tion that Diesel will increase by 8% every year.
As can be seen, the cash flow available to pay back the equity investment is low in years 1-10 when cash
flows are primarily used to pay back debt which accounts for 30% of the overall investment. After all debt has
been paid back after year 10 the cash-flow available for the equity investor increases. The cash flow available
for equity also increases year by year based on the assumption that the diesel that is replaced by solar and
wind power is becoming more expensive every year. Under the chosen financing conditions (loan tenor of 10
years no grace period), the diesel savings are sufficient to repay the loan. Additional equity may however be
required after year 1 in order to operate the plant. The equity is paid back after approx. 20 years. In the graph
this is illustrated by the blue line crossing the horizontal x-axis.
RE System: PV & Wind System Operation
Project Duration Years 25 Average Yearly Generation kWh/a 13.008
Wind Generator Size kWp 3 Direct-Consumption Rate % 80%
Wind Capacity Utilization Factor % 10% Genset efficiency kWh/ltr 2,50
Wind Specific System Costs RUB/kWp 120.000 Average Replaced Diesel Consumption ltr/year 4.163
PV Generator Size kWp 12 Diesel Price (1st Ops Year) RUB/ltr 46
PV Specific System Costs RUB/kWp 100.000 Diesel Price Escalation % p.a. 8%
Specific PV Generation KWh/kWp 960 Fixed Operation Costs RUB p.a. 51.200
Battery Capacity kWh 50,00 Longterm Insurance Costs % p.a. -
Total System Cost RUB 2.560.000
Battery Replacement Interval Years -
Total Battery Replacement Costs RUB -
Debt (Gearing) 30% RUB 768.000 Net-Present Value RUB 823.645
Loan Tenor Years 10 Project IRR % 11%
Grace period Years - Equity IRR % 11%
Debt Interest Rate % 14% Payback Period Years 19,50
Initial Equity RUB 1.821.405 LCOE (no subsidy) RUB/kWh 26,97
Additional Equity RUB 50.671 Min DSCR** x 0,65 x
Discount Rate % 8% Min LLCR*** x 1,37 x
Longterm Inflation Rate % 4% * LCOE: Levelized Cost of Electricity
** DSCR: Debt Service Coverage Ratio
*** LLCR: Loan Life Coverage Ratio
Financing Results

dena study „Market study in the context of decentralized energy supply using renewable energy technologies in selected Russian regions“ 101
Figure 55 Equity Cash Flow – Severny Diesel-PV-Wind Hybrid; source: eclareon calculations, based on input data researched by
EUROSOLAR Russia, 2018
The capacity factor, sometimes also referred to as the load factor, refers to the ratio of the generated net elec-
tricity during a certain period to the theoretical maximum of energy during the same period. There are of
course seasonal differences but for standard onshore wind turbines a yearly average efficiency would rather
be between 20% and 30%. But as stressed before, the wind turbine of the installation in Severny is not stand-
ard, at the moment it is not even functional. Longer periods of interrupted operations due to technical prob-
lems and/ or missing spare parts could explain this rather low capacity factor. If the experience from Severny
were taken into account, we believe that the capacity factor could be higher. The impact of such a higher ca-
pacity factor of the wind turbine can be seen when moving to the right on the horizontal x axis which displays
different capacity factors with base case results being shown in rectangles: a capacity factor of 22% could
bring the equity payback down to approx. 15 years, everything else left unchanged.
-2.500.000
-2.000.000
-1.500.000
-1.000.000
-500.000
0
500.000
1.000.000
1.500.000
0 1 2 3 4 5 6 7 8 9 10 11 12 13 14 15 16 17 18 19 20 21 22 23 24 25
RU
B
Operations Year
Investment and Cash Flow for Equity
Cash Flow for Equity Equity Investment Cumulative Cash Flows

Figure 56 Capacity factor Sensitivity – Severny Diesel-PV-Wind Hybrid; source: eclareon calculations, based on input data researched by
EUROSOLAR Russia, 2018
Another sensitive factor is of course the system price. This is illustrated in the next graph. The base case val-
ues are again shown in rectangles. In this case, the payback period increases when the costs are higher than
in the base case calculation. The researched system price per kWp for the Severny installation including stor-
age were high at approx. 171.000 RUB/kWp. The costs of the 50 kWh battery system assumed to be as high as
20.000 RUB/ kWh contributes substantially to the high system costs. Moreover, the fact that the installation
of PV and other RES in Russia were, especially at the time when Severny was built in 2015, a rather recent
phenomenon which means that actors did not yet have the chance to accumulate years of experience. How-
ever, once these very specific projects become more standard and more experience is accumulated, costs
may go down and, as a consequence, payback time will be shorter and the equity IRR will be higher. This can
be seen in the following graph when moving to the left on the horizontal axis where system prices are dis-
played.
20,019,0
18,217,4
16,7 16,1 15,5
19,5
10%11%
11%12% 12% 13% 13% 13%
11%
6,00% 8,00% 10,00% 12,00% 14,00% 16,00% 18,00% 20,00% 22,00% 24,00%
Capacity Factor [%]
Amortization [a] Equity IRR [%] Up Case

dena study „Market study in the context of decentralized energy supply using renewable energy technologies in selected Russian regions“ 103
Figure 57 System Price Sensitivity – Severny Diesel-PV-Wind Hybrid; source: eclareon calculations, based on input data researched by
EUROSOLAR Russia, 2018
Moreover, the diesel price today and its development over time play an important role for the business case.
This is shown in the following two graphs.
Figure 58 Diesel Price Sensitivity – Severny Diesel-PV-Wind Hybrid; source: eclareon calculations, based on input data re-
searched by EUROSOLAR Russia, 2018
12,8
14,9
17,2
19,5
21,9
24,4
19,517%
15%
13%11%
10%9%
8%7%
11%
100.000 120.000 140.000 160.000 180.000 200.000 220.000 240.000
System Price [RUB/kWp]
Amortization [a] Equity IRR [%] Base Case
22,2
19,5
17,415,7
14,3
19,5
5%
7%
9%
10%11%
12%14%
15%
11%
25,00 30,00 35,00 40,00 45,00 50,00 55,00 60,00 65,00
Diesel Price [RUB/ltr]
Amortization [a] Equity IRR [%] Base Case

Figure 59 Diesel Cost Escalation Sensitivity – Severny Diesel-PV-Wind Hybrid; source: eclareon calculations, based on input data re-
searched by EUROSOLAR Russia, 2018
The diesel price in the base case was assumed to be at approx. 46 RUB/ liter. These costs are not as high as in
isolated territories such as Batagai. This relatively moderate price does not favour the business case: The
higher the diesel costs the better the RES business case would be from the perspective of an investor. If the
base case assumption were changed, the diesel price sensitivity shows that, with a diesel price higher than
43 RUB/ liter, the payback period would go down while the equity IRR would go up.
Another sensitivity that has an impact on the key results of a business case is the future development of die-
sel prices. An investment is paid back over time which means that it is necessary to estimate how certain crit-
ical parameters will change over time. Future diesel prices are not assumed to stay as they are today. The an-
nual diesel price escalation in the model was assumed to be at +8% for Severny. If diesel costs were esca-
lated with more than 8% p.a. the payback period and the IRR for the equity would change accordingly: an
annual diesel costs escalation of 10% would decrease the payback period to approx. 16 years and increase
the equity IRR to 13%. However, it can of course also be assumed that the diesel price escalation is lower
than in the base case. If that were the case, the payback would increase and the IRR decrease.
2.4.7 Potential for cooperation/business opportunities
The RES market of Bashkortostan is small, nevertheless, there are some niches and prospective branches
which may be of interest for foreign investors and project developers:
Although the territory of the region is covered by the power grid, there are about 15 settlements which suf-
fer from bad power quality and outages and need alternative power generation, which is complimentary to
the existing grid. Replacing outdated cables is often more expensive than installing a hybrid RES power
21,9
17,7
15,3
19,5
2%
5%
8%
11%
13%
15%
11%
-4% -2% 0% 2% 4% 6% 8% 10% 12% 14%
Diesel Cost Escalation [% p.a.]
Amortization [a] Equity IRR [%] Up Case

dena study „Market study in the context of decentralized energy supply using renewable energy technologies in selected Russian regions“ 105
plant. At the same time, energy companies and grid operators are obliged to supply the citizens with en-
ergy, thus for them investing into RES would be a suitable solution.
The region is planning to develop a net of medical aid stations in remote corners of the region, as well as
mobile first aid stations. They need energy supply and currently the government is getting ready to invest
in modern mobile diesel and petrol gensets to fulfil this aim.
Small RES projects may be suitable for regional national parks and reserved areas where the grid cannot
be built, diesel generation is unperformable and pure usage of energy accumulators is costly.
2.4.8 Risks and barriers
Similar to the situation in other Russian regions, there are a number of barriers which must be climbed on
the way to RES project implementation in Bashkortostan:
There is lack of financial sources in the region which can be used for RES or hybrid projects. Even the case
of the hybrid power plant in Severny faced financial problems and cannot launch due to the broken inver-
tor which cannot be replaced by the owner.
There is a lack of legal framework which defines steps of organization of metering for electricity generated
by RES. Simultaneously, there is no legal framework which creates a mechanism of how should consumers
of the retail market pay for such RES based energy. Currently, local grid operators have no official rights to
build RES based power plants to supply consumers. Exceptions would be the construction of a backup en-
ergy facility.
“Hevel” is already active in the region and local authorities and companies are familiar with its projects
and operations. There is a risk, that local companies/consumers/investors would contact a known PV com-
pany rather than trust a new player in the market.
The region is connected to the UPS and a market for autonomous generation is small and not comparable
to the one existing in Yakutia or Kamchatka. Although some settlements have bad electricity quality, they
are at least connected to the grid, even if it is an old one.

2.5 Krasnodar Krai
The Krasnodar Krai region is located in the southwest of Russia and is part of the Southern Federal District,
with a territory spanning 75,500 km2 [101], the capital city is Krasnodar. The mountain system of the Cauca-
sus stretches roughly one third of the territory, and there are several off-grid settlements and natural re-
serves in the mountainous area. The regional climate is mostly temperate continental, with average temper-
atures between -8 and +5 °C in January, and fluctuating between + 22 and + 350C in the summer - tempera-
tures at the Black Sea only dip below zero for a few days a year. In 2018, population of the region was 5.5 mil-
lion people, of which 55% lived in urban areas [102], and the population density was 74 people/km2.
Figure 60 Map of Russia, Krasnodar Krai region is highlighted; source: eclareon 2019, generated with amCharts Pixel Map
The Krasnodar Krai economy subsists of: food production, fuel industry (annual extraction: 2 million tons of
oil and 3 billion m3 of natural gas), engineering and metalworking, construction materials industry (e.g. ce-
ment production), chemical industry, forestry and woodworking.
Krasnodar Krai is one of the fastest growing and simultaneously most energy deficient regions of Russia. Un-
like most other Russian regions, the peak electricity consumption in Krasnodar Krai occurs in summer due to
its warm climate conditions. The high use of air-conditioning in industrial buildings, offices and private
households puts pressure on the electricity grid and power generating facilities, the result being that black-
outs occur regularly. On August 8th 2018, the regional electricity consumption reached new levels with a con-
sumption of 5.03 GW, 433 MW higher than the previous peak load in July 2016.
Another pressure on the regional power system is Crimea: after the Ukrainian power system stopped supply-
ing the peninsula with electricity, Crimea became fully dependent on the UPS. The Krasnodar Krai power sys-
tem has become a bridge between Crimea and the Russian mainland and occasionally has to share its energy
with Crimea.

dena study „Market study in the context of decentralized energy supply using renewable energy technologies in selected Russian regions“ 107
2.5.1 Current energy supply situation and renewable energy potential
The region is part of the UPS and currently produces only roughly 45% of the electricity it consumes annu-
ally. In 2017, its electricity generation was 11,489 million kWh and electricity consumption was 25,495 million
kWh. Experts and analysts expect further growth in power consumption due to expanding industries, devel-
opment of seaports and intensive housing construction. The annual growth of electricity consumption is ex-
pected to reach 1.7%, which may result in an overall increase of 12.4% for the period 2016-2023. The region
has a developed but outdated grid. Therefore, there are no large autonomously working diesel power plants
in the region and only several off-grid settlements.
Figure 61 Largest power plants of Krasnodar Krai; source: eclareon, 2019, generated with amCharts Pixel Map, based on ”Scheme and
Program of development of energy sector of Krasnodar Krai in 2019-2023” [105]
The electricity market in the region has several stakeholders:
Electricity retail companies (suppliers): “TNS energo Kuban”, which covers about 55% of the territory, and
“NESK” JSC, which covers about 30% of the territory and was founded in 2003 with the aim to compete
with “TNS Kubanenergo” to avoid a monopoly in the market. Both companies purchase electricity whole-
sale from retail markets and sell it to consumers in the retail market (private households and industry).
“TNS energo Kuban” and “NESK” are guaranteeing suppliers of the region. Other small energy retailers
cover the remaining 16% of the territory.
Major electricity transmission (grid) companies: “Kubanenergo” (ROSSETI group) (responsible for the grid
0.4-110 kV and having 11 branches in the region), and “NESK-electroseti” with 26 branches. “Kubaenergo”
serves urban areas and NESK is responsible for electricity transmission in rural areas.
Dozens of small grid operators, active for: Russian Railways PJSC, Kuban Enterprise MES branch of FGC UES
JSC, Sochi Enterprise MES PJSC FGC UES.
Energy-generating companies: the largest are “Lukoil-Kubanenergo”, OGK-2 (basically Gazprom)”, “Inter
RAO”

Some energy blocks of industries with own generation facilities (entities and private) (e.g. “MagnitEnergo”
has their own gas turbines serving greenhouses, etc.)
In early 2018 the region had a total installed capacity of 2.3 GW (including 23 power plants with a cumulative
installed capacity 422.8 MW; 2 HPPs and 5 independent supplier stations with 42.9 MW). Figure 62 shows the
structure of installed power capacity in the region at the end of 2017. The largest CHPPs are: Krasnodar CHPP
with an installed capacity of over 1 GW (owned and operated by Lukoil-Kubanenergo); CHPP in Adler (364
MW) owned and operated by “OGK-2”, Dzubginsk CHPP (198 MW) and CHPP in Sochi (160.5 MW), both owned
by Inter RAO; CHPP in Tuapse (141 MW). All CHPPs are fueled by natural gas.
Figure 62 Structure of the installed capacity by type of power plant in Krasnodar Krai in 2017; source: Ministry of fuel and energy of
Krasnodar Krai, 2018
In 2017, according to Federal State Statistics Service of Russia, 23,233 million kWh of electricity was consumed
in the region16. Numbers from this statistical database usually differ slightly from internal databases because
different calculation methodologies and sources are used. Electricity consumption by type of consumer is pre-
sented on Figure 63. The major energy consumers in the region are the mining industry and residential con-
sumers. A large share of electricity (17% or 3,900 million kWh) is lost in grids while transmitting, mainly due to
a high deterioration of electrical equipment, including grids and transformer stations. Nearly 100% of regional
substations have exhausted their amortization period and need to be replaced or majorly overhauled [104].
16 According to Federal State Statistics Service of Russia, information differs from the “Scheme and Program of development of energy sector of Krasnodar
Krai in 2019-2023” differs, structure of electricity consumption for 2017 is not available in the document.
Hydro PPs; 69.6; 3%
Combined heat and power plants;
1906.5; 83%
Own power plants of industries; 324.7; 14%

dena study „Market study in the context of decentralized energy supply using renewable energy technologies in selected Russian regions“ 109
Figure 63 Electricity consumption in Krasnodar Krai by type of consumer, %, 2017; source: Federal State Statistics Service
of Russia, 2018 [54]
In Krasnodar Krai, uninterrupted power supply of some districts remains problematic. Due to the lack of in-
stalled power capacity and low quality of grid connection, power outages occur frequently in the following
regions: Timashevsky, Ust-Labinsky, Krasnoarmeysky, Seversky, Tikhoretsky, Anapa and Armavir.
Aging grid and lack or generating facilities in the region are the major reasons of the low electricity quality
and regular outages in the region. Such problems are particularly frequent in rural and coastal areas. which
are popular among tourists. Small diesel and petrol generators become an alternative solution and are often
used by hotels and private households, despite being connected to the grid. According to estimations of
some local experts, there are about 1,000 diesel gensets of different sizes, varying from 3 to 500 kW installed
capacity each, in hotels across the region. Official statistics on that does not exist due to the fact, that there
are no requirements to register such gensets.
Krasnodar Krai is known as a sunny region: around 280 days a year are sunny [164]. The average yield
reaches 1,400 kWh/m2/year or 109, 669.2 billion kWh [89] [164]. Currently, there are no large solar power
plants in the region, solar energy only used locally in some small projects. However, there are proposals for
the construction of SPPs with a total installed capacity of 90 MW by 2023 in Krasnodar Krai. These projects
are to be divided into smaller PV systems with an installed capacity of 4-5 MW each [104]. Although the RES
are not that widespread in Russia yet, there are already many private and pilot installations in the region.
They are not included in the official regional energy balance and omit registration; thus, it is tough to esti-
mate their real installed capacity. Examples of such small projects are: a PV system in Sochi, Olympic Park
with 127.5 kW in installed capacity; 70 kW of rooftop PV at the railway station in Anapa; and a 31 kW PV sys-
tem in Apart-Hotel, Sochi, among others [103]. In 2014, there were about 70 solar installations (both PV and
solar thermal) in use by social facilities (e.g. sanatoriums, hospitals) as well as industrial entities. The overall
installed PV capacity in the region is estimated to be about 4-5 MW: all are small private installations of differ-
ent capacities varying between 5 and 300 kW (based on a research done by eclareon and IP Kekelidze).
Krasnodar Krai has also very good wind power potential, the technical potential of wind energy (for the alti-
tude of 30 meters) is about 322 MWh/year reaching 455 MWh/year on the coats of the Azov sea (especially Ta-
man peninsula) and 500 MWh/year on the coastal areas of the Black sea.
Agriculture3.91%
Mining industry28.92%
Other industries
7.59%
Construction of buildings
1.49%Transport and
communications9.15%
Other 4.96%
Privat households/residential customers
26.86%
Losses in grids17.13%

2.5.2 Electricity tariffs and costs
Krasnodar Krai is a part of the wholesale electricity market’s first price zone. In 2018, Krasnodar Krai rated
11th among territories with the highest electricity tariffs for private households [92]. A stable growth of tariffs
has been present since 2016. Electricity tariffs in the region are controlled and established by an executive
authority, the Regional Energy Commission, which is part of the Department of Prices and Tariffs of the Kras-
nodar Krai. This authority also falls under the regulation and control of the Krasnodar Krai administration
and the Federal Antimonopoly Service of Russia [105].
In 2019, the major tariffs for private households were:
Rural population, night tariff - 1.97 RUB/kWh (0.03 EUR/kWh) - day tariff - 3.66 RUB/kWh (0.05 EUR/kWh)
Urban population (households with gas stoves), night tariff - 2.82 RUB/kWh (0.04 EUR/kWh)- day tariff -
5.24 RUB/kWh (0.07 EUR/kWh)
Single rate tariff (no differentiation by time or voltage) rural population - 3.28 RUB/kWh (0.04 EUR/kWh);
urban population (households with gas stoves) - 4.69 RUB/kWh (0.06 EUR/kWh)
For non-residential consumers, including all industries and guaranteeing suppliers, the electricity tariff is set
at unregulated prices within the limits (ceiling prices). Table 10 presents marginal levels of unregulated elec-
tricity prices for “TNS energo Kuban”, prices for “NESK” are kept at nearly the same level.
Type of voltage /
type of tariff
High voltage (110 kV
and higher)
Middle first volt-
age (35 kV)
Middle second
voltage (20-1 kV)
Low voltage (0,4
kV and less)
Ceiling electricity prices for February 2019, RUB/kWh (EUR/kWh) with VAT, electricity for non-residential consumers
with loads under 670 kW, first price category
Single rate tariff 6.31 (0.08) 6.67 (0.09) 8.10 (0.11) 9.46 (0.13)
Ceiling electricity prices for February 2019, RUB/kWh (EUR/kWh) with VAT, electricity for non-residential consumers
with loads under 670 kW, second price category
Double day time tariffs
Night tariff 4.09 (0.05) 4.46 (0.06) 5.88 (0.08) 7.24 (0.10)
Day tariff 8.47 (0.11) 8.83 (0.12) 10.26 (0.14) 11.62 (0.16)
Tree day-time tariff
Night tariff 4.09 (0.05) 4.46 (0.06) 5.88 (0.08) 7.23 (0.10)
Semi-peak zone 6.35 (0.08) 6.72 (0.09) 8.14 (0.11) 9.50 (0.13)
Peak zone 13.01 (0.17) 13.37 (0.18) 14.80 (0.20) 16.16 (0.22)
Table 10 Some ceiling prices for the retail market’s consumers (non-residential consumers) of the electricity provided by “TNS Energo
Kuban” in 2019; source: “TNS Energo Kuban”, 2019[160]
Other non-residential consumers which have energy receivers with the maximum capacity over 670 kW, have
different energy prices which are changing every hour and in accordance to the rules of the 3rd-6th price cate-
gories (see section 1.3).
Cross-subsidization also occurs in Krasnodar Krai, despite there being many attempts to phase it out. In
2018, the total amount of cross-subsidization was about 8,904.6 million RUB (approx.118.7 million EUR)
[107].

dena study „Market study in the context of decentralized energy supply using renewable energy technologies in selected Russian regions“ 111
2.5.3 Regional business environment & specific legal and regulatory framework for energy supply
Krasnodar Krai is known for being energy deficient and lacking in modern high-quality grids. This causes
power outages and energy shortages, forcing consumers to use decentralized power generation (both auton-
omous and combination with grid supply). Major consumers of off-grid energy generation or combined grid
generation are: shops, recreational enterprises, private households and garden houses, catering facilities
and infrastructure facilities such as gas pipe stations and mobile communication stations. Although a con-
crete number of off-grid gensets or installed off-grid capacity is unknown, the issue is important for the re-
gion.
Local authorities are interested in RES development and are attracted to the idea of energy independence
from other regions. An additional motivation for the administration of the region to develop RES in off-grid
areas is reduction of losses in grids and costs of grid construction. In the case of a settlements located in
mountainous areas and far from the major grid line, grid construction has to travel several dozen kilometers
before reaching consumers.
Regarding the regulatory framework, Krasnodar Krai is subject to the basic laws focused on the renewable
energy sources listed in section 1.3 of the report. In addition, there are other legislative acts supporting RES
in the region.
In 2004, the Legislative Assembly of Krasnodar Krai enacted law No. 723-KZ "On the Utilization of Renewed
Sources of Energy in Red Army Krai"[131], which contained the following directives:
Local government can assist legal entities and individuals in the production of equipment for the use of
renewable energy sources and RES usage.
Priority places for using renewable energy sources are:
1. decentralized energy supply zones, with low population density, and where construction of tradi-
tional power plants and high-voltage grids is economically unprofitable;
2. zones which do have power supply but of a low quality and with frequent outages, which leads to a
significant economic damage and negative social consequences
3. settlements and places of mass recreation of the population with a difficult ecological situation
4. natural protected areas and reserves where grid construction is prohibited but where some de-
mand in energy exists (e.g. recreational zones inside national parks)
In 2013, Decree No. 1183 approved the state program “Development of the fuel and energy complex” [132].
The goal of the program is to reduce energy costs, payments for energy supply services and ensure the im-
provement of competitiveness and financial stability of the regional economy, also with the help of develop-
ment and usage of energy-efficient equipment and implementation of renewable energy facilities. The pro-
gram is coordinated by the Ministry of Industry and Energy of Krasnodar region.
This program also includes a subprogram: “Energy Saving and Increasing the Energy Efficiency of Krasnodar
Krai for the Period 2014–2020”, which lists the following activities aimed to develop RES and EE: introduction
of solar collectors, PV installations, WPPs, geothermal PPS, use of biogas in agriculture, solid domestic waste
recycling, use of heat pumps

Krasnodar Krai has also a regional development strategy, approved by the Law N 3930-KZ “On the Krasnodar
Krai’s Social and Economic Development Strategy until 2030” [133]. According to the law, the goal of the
power industry development of the Krasnodar Krai is to provide population and entities with accessible and
affordable energy through a combination of innovative development of conventional energy technologies
and the active implementation of RES.
This goal is to be achieved through:
formation of an effective legislative framework ensuring the development of the fuel and energy complex
with the help of a public-private partnership
active interaction of industry associations, businesses and authorities while solving problems of industrial
development
increasing the availability of financial resources for the fuel and energy industry development
attraction of relevant investors and applying state support mechanisms (preferential loans for priority pro-
jects and areas at the discount rate of the Central Bank)
establishment of a grace period for the land lease
active use of renewable energy sources, especially solar thermal systems, PV and wind power plants.
2.5.4 Regional specific business case
In Russia, there are several mobile operators, providing communication and internet services to the popula-
tion and entities. One of the largest is “Beeline” (owned by PJSC “VimpelKom”), which in 2004 installed the
first hybrid PV-wind-diesel power generating facility on one of its mobile phone transfer towers in Molda-
vanka settlement. In the area, the mobile signal was weak due to mountainous terrain, thus an additional
tower was needed [134]. Connecting the tower to the grid was problematic due to estimated high costs and
rocky slopes with frequent rockfalls, which made stretching the power grid nearly impossible. In these condi-
tions RES power stations are the ideal solution. The named system contains a combination of wind, PV and
diesel genset along with an energy storage system lets the system function during all types of weather condi-
tions. The project is called “Autonomous hybrid power plant in Moldavanka village” and was financed by
“Beeline”. The company is also an owner and operator of the power facility. Design and construction works
were carried out by engineering company “Clever Energy”.
The composition of the installation is the following:
PV system consists of 7 solar modules (Micromorphic, Pramac (Switzerland) 125W x 26pcs) with total in-
stalled capacity 3,25 kW;
wind turbine of 2 kW capacity
diesel generator with rated capacity of 40 kW;
energy storage system 420Ah, 20 kWh;
remote control.
Construction of the station took 7 days. The contractual relationship between key project stakeholders is il-
lustrated by the scheme on the Figure 64.

dena study „Market study in the context of decentralized energy supply using renewable energy technologies in selected Russian regions“ 113
Figure 64 Scheme of relations between different stakeholders while implementing a new project; source: eclareon 2019
2.5.5 Business model description
The hybrid PV-wind-diesel installation with energy storage in Moldavanka settlement which serves base
transmitting station of company “Beeline” represents the diesel savings and revenues from the PV installa-
tion. “Beeline” is simultaneously the power consumer, investor and the plant operator. The system was built
with an aim to cover the energy needs of this investor and to make him fully energy autonomous.
The overall duration of the project’s implementation in the region is usually about 3 months. Before starting
a project, it is important to negotiation with the local authorities and responsible ministries (e.g. the Ministry
of Fuel and Energy Complex, Housing and Communal Services of Krasnodar Krai). This takes on average 2
weeks or longer.
Delays may happen due to the poor communication between different agencies, ministries and administra-
tion departments, one needs to address each utility separately and sometimes several approaches are
needed before the necessary reply is received. These steps are presented on the scheme (Figure 65):

Figure 65 Project steps for Krasnodar Krai RES projects; source: eclareon 2019
Climate conditions permit construction and installation works to be carried out throughout the year. To
transport the necessary equipment both roads and marine ways (the Black Sea) are necessary and these are
accessible year-round – only the Azov Sea can be covered with ice in winter, so shipping is possible only after
the route has been laid by an icebreaker [135].
2.5.6 Profitability analysis (inputs, outputs, scenarios, sensitivities)
In the following, an exemplary profitability analysis for the RES share of a PV-wind diesel hybrid installation
with 20kWh battery storage is presented as the regional specific business case. This an example of a project
that was already realized in 2004 which limits the comparability to installations that could be built today sub-
stantially However, based on further analysis in the region of Krasnodar, the authors of this report believe
that especially PV hybrid cases can be economically more attractive than this particular installation combin-
ing wind, PV and Li-ion storage on a rather small scale. For PV business cases in the region of Krasnodar
please do refer to BSW Solar’s “Enabling PV Russia” report [136].
The base case assumptions and results can be found in the following figure:
Customer/ engineering
company
Site selection
Energy sales company, grid
operator and customer
Duration: up to 2 months
Issuance of technical
specificytions for
connection of RES
system to the grid
Engineering companyand a
customer
Duration: ca.1 months
About 1 million RUB
Purchase of equipment
and materials
Project Flow
Steps
Investor/ist turnkey contractor,
engineeringcompany; Department of Architecture and
Urban Land Planning of the
Krasnodar Krai for issuing building permits for off-grid
generating units
Duration: 7 -14 days
Construction, permits
Investor/ist turnkey contractor
1 day
Commissioning and
testing
Lease or purchaseof a
land plot (MunicipalAdministration in case of
municipal property;
Department of Property Relations of the regional
administration in case the land is regional), and registrationof the land at
the Cadastral Chamber of the region

dena study „Market study in the context of decentralized energy supply using renewable energy technologies in selected Russian regions“ 115
Figure 66 Project Overview – diesel -PV – wind- hybrid Krasnodar; source: eclareon calculations, based on input data researched by
EUROSOLAR Russia, 2018
The graph shows that the installation is viable from a financial perspective but that the payback period is
very long with > 23 years. No debit finance is assumed given this long payback period. The Li-ion battery and
the battery replacements every 8 years are cost drivers as shown in the cash flow for equity graph below. It
can also be seen that the cash flow available for equity also increases year by year based on the assumption
that the diesel that is replaced by solar power is becoming more expensive every year. The equity is paid
back after approx. 23 years. In the graph this is illustrated by the blue line crossing the horizontal x-axis.
The capacity factor of the wind installation was again reported to be rather low which means that there may
be potential to improve project attractiveness for future installations in the region: a yearly average effi-
ciency of a standard onshore wind turbines would rather be between 20% and 30%. But as stressed before,
the installation Krasnodar is not standard. Longer periods of interrupted operations due to technical prob-
lems and/ or missing spare parts could explain this rather low capacity factor. If the experience from this in-
stallation were taken into account, we believe that the capacity factor could be higher. The impact of such a
higher capacity factor can be seen in the following figure when moving to the right on the horizontal x axis: a
capacity factor of 20% could bring the equity payback down to approx. 20 years, everything else left un-
changed.
RE System System Operation
Project Duration Years 25 Average Yearly Generation kWh/a 6.350
Wind Generator Size kWp 2,00 Direct-Consumption Rate % 90%
Wind Capacity Utilization Factor % 15% Genset efficiency kWh/ltr 3,00
PV Generator Size kWp 3,25 Average Replaced Diesel Consumption ltr/year 1.863
Specific PV Generation KWh/kWp 1.280 Diesel Price (1st Ops Year) RUB/ltr 44
Battery Capacity kWh 20,00 Diesel Price Escalation % p.a. 8%
Total System Cost RUB 978.887 Fixed Operation Costs RUB p.a. 19.578
Battery Replacement Interval Years 8 Longterm Insurance Costs % p.a. -
Total Battery Replacement Costs RUB 710.170
Debt (Gearing) - RUB - Net-Present Value RUB 65.755
Loan Tenor Years - Project IRR % 12%
Grace period Years - Equity IRR % 11%
Debt Interest Rate % 12% Payback Period Years 23,25
Initial Equity RUB 978.887 LCOE (no subsidy) RUB/kWh 24,98
Additional Equity RUB 210.873 Min DSCR** x -
Discount Rate % 10% Min LLCR*** x -
Longterm Inflation Rate % 4% * LCOE: Levelized Cost of Electricity
** DSCR: Debt Service Coverage Ratio
*** LLCR: Loan Life Coverage Ratio
Financing Results

Figure 67 Equity Cash Flow – diesel-PV–wind- hybrid Krasnodar; source eclareon calculations, based on input data researched by
EUROSOLAR Russia, 2018
Figure 68 Capacity factor Sensitivity – diesel-PV–wind-hybrid Krasnodar; source: eclareon calculations, based on input data researched
by EUROSOLAR Russia, 2018
Another sensitive factor is of course the system price. This is illustrated in the next graph. The base case val-
ues are again shown in rectangles. In this case, the payback period increases when the costs are higher than
in the base case calculation. The researched system price per kWp for the installation in Krasnodar were very
-1.200.000
-1.000.000
-800.000
-600.000
-400.000
-200.000
0
200.000
400.000
600.000
0 1 2 3 4 5 6 7 8 9 10 11 12 13 14 15 16 17 18 19 20 21 22 23 24 25
RU
B
Operations Year
Investment and Cash Flow for Equity
Cash Flow for Equity Equity Investment Cumulative Cash Flows
23,222,0
20,819,8
23,2
9%9%
10%10%
11%11%
12%12%
11%
8,00% 10,00% 12,00% 14,00% 16,00% 18,00% 20,00% 22,00%
Capacity Factor [%]
Amortization [a] Equity IRR [%] Base Case

dena study „Market study in the context of decentralized energy supply using renewable energy technologies in selected Russian regions“ 117
high at approx. 185.000 RUB/kWp. The costs of the 20 kWh battery system assumed to be as high as 25.000
RUB/ kWh contributes substantially to the high system costs. Moreover, the fact that the installation of PV
and other RES in Russia were a rather recent phenomenon which means that actors did not yet have the
chance to accumulate years of experience. However, once these very specific projects become more standard
and more experience is accumulated, costs may go down and, as a consequence, payback time will be
shorter and the equity IRR will be higher. This can be seen in the following graph when moving to the left on
the horizontal axis where system prices are displayed.
Figure 69 System Price Sensitivity – Project Overview – diesel-PV–wind-hybrid Krasnodar; source: eclareon calculations, based on input
data researched by EUROSOLAR Russia, 2018
Moreover, the diesel price today and its development over time play an important role for the business case.
This is shown in the following two graphs.
The diesel price in the base case was assumed to be at approx. 44 RUB/ liter. These costs are not as high as in
isolated territories such as Batagai. This relatively moderate price does not favor the business case: The
higher the diesel costs the better the RES business case would be from the perspective of an investor. If the
base case assumption were changed, the diesel price sensitivity (Figure 70) shows that, with a diesel price
higher than 44 RUB/ liter, the payback period would go down while the equity IRR would go up.
Another sensitivity that has an impact on the key results of a business case is the future development of die-
sel prices. An investment is paid back over time which means that it is necessary to estimate how certain crit-
ical parameters will change over time. Future diesel prices are not assumed to stay as they are today. The an-
nual diesel price escalation in the model was assumed to be at +8% in Krasnodar. If diesel costs were esca-
lated with more than 8% p.a. the payback period and the IRR for the equity would change accordingly: an
annual diesel costs escalation of 10% would decrease the payback period to approx. 19 years and increase
the equity IRR to 13%. However, it can of course also be assumed that the diesel price escalation is lower
than in the base case. If that were the case, the payback would increase and the IRR decrease.
14,5
17,8
20,4
23,223,2
16%
14%13%
11%10%
9%8%
7%
11%
100.000 120.000 140.000 160.000 180.000 200.000 220.000 240.000 260.000
System Price [RUB/kWp]
Amortization [a] Equity IRR [%] Base Case

Figure 70 Diesel Price diesel-PV–wind-hybrid Krasnodar; source: eclareon calculations, based on input data researched by EUROSOLAR
Russia, 2018
Figure 71 Diesel Cost Escalation diesel-PV–wind-hybrid Krasnodar; source: eclareon calculations, based on input data researched by
EUROSOLAR Russia, 2018
23,2
20,3
18,0
15,5
23,2
5%
7%
8%
10%11%
12%14%
15%
11%
25,00 30,00 35,00 40,00 45,00 50,00 55,00 60,00
Diesel Price [RUB/ltr]
Amortization [a] Equity IRR [%] Base Case
20,6
17,1
23,2
0%
5%
8%
11%
13%
15%
11%
-4% -2% 0% 2% 4% 6% 8% 10% 12% 14%
Diesel Cost Escalation [% p.a.]
Amortization [a] Equity IRR [%] Up Case

dena study „Market study in the context of decentralized energy supply using renewable energy technologies in selected Russian regions“ 119
2.5.7 Potential for cooperation/business opportunities
Krasnodar Krai is a very promising region for the development of RES, especially solar, but lacks experience
in the sector. However, there are a range of potential customers investing in the region, thereby making the
region more interesting for foreign investors and PV project developers. The region is covered by the central-
ized grid, but due to its high level of deterioration, the quality of electricity supply is often low and power
outages occur frequently. The region is known for its hot summers, therefore, even short outages of a couple
of hours often lead to food spoilage at central warehouses and profit losses for companies.
Krasnodar Krai is an energy deficient region which needs additional energy generating capacity. RES could
provide the region with energy, especially considering the perceptiveness of PV, wind and other RES in the
region (see section 2.5.1 ).
Krasnodar Krai is not comparable to Moscow in terms of wealth and business development perspectives.
However, the economy of the region is developing quickly, creating new business opportunities. Due to the
peculiarities of the Russian, and especially southern Krasnodar Krai mentality, many people are eager to
invest in private PV system in private households.
The region is relatively wealthy, with a significant portion of the population being “snowbirds”. Many of
these individuals have private cottages in Krasnodar Krai and have PV modules on their roofs because it is
seen as a sign of personal success.
Krasnodar Krai is called the “breadbasket of Russia” due to its vast wheat fields and highly developed crop,
vegetable and fruit production. Numerous manufacturers, canneries, oil and dairy producers have their
facilities close to fields and greenhouses. They consume a lot of energy for different purposes, such as cool-
ing in case of goods’ storage and heating for conservation and pasteurization. Additionally, some unpro-
cessed crops such as green beans must be processed and canned in the first couple of days after harvest,
which means, that factories sometimes have to work 24 hours to prevent quality losses. Some of these
companies are now starting to consider alternative energy solutions. PV is not the only electricity source
being considered for electricity generation, with solar thermal technology being considered for steam and
hot water production and solar cooling.
New farms keep developing in the region with some being established in undeveloped areas which often
have no grid connection. In this case, it is economical for them to install PV modules instead of stretching a
grid to their facilities, as grid connection costs can be very high.
Krasnodar Krai is famous for its sun, heat, sea and picturesque sceneries and therefore attracts lots of tour-
ists. Most of the tourist areas are at the seashore, where hotels vary in size and quality. After Sochi hosted
the Olympic Games in 2014, the region became even more popular. Since then, hotels have had to ensure
their power supply during outages with autonomous power supply solutions, which are nearly primarily
petrol and diesel gensets.
Local authorities are open minded and already include RES in official programs and scenarios of the re-
gional energy system development. This process supports RES and gives a reason to be rather optimistic
about the development of renewable energy sources in the region.

2.5.8 Risks and barriers
The following risks and barriers exit when developing RE in Krasnodar Krai:
As is the case in other Russian regions, Krasnodar Krai lacks the financial resources to support the develop-
ment of RES projects and private investors are often hesitant to invest in new technologies, such as solar
PV, in Russia.
Krasnodar Krai, also known as Kuban, is a specific region with a kind of “southern mentality” that is differ-
ent to Moscow or Saint-Petersburg, leading to private companies and public authorities not always “walk-
ing their talk” in Krasnodar Krai. This could be the cause of a range of difficulties during a project’s imple-
mentation, as negotiations (the talk) may be deemed successful and promising but with the implementa-
tion (the walk) often being more cumbersome. This should be considered during a project’s initial negotia-
tions phase with local partners. Personal contacts with local authorities and companies would be of help.
As in other regions, there is a lack of supporting schemes and suitable legal framework for PV project de-
velopment.
There is a lack of information and data on regions with decentralized power supply and/or without the grid
connection, slowing down research and efforts to understand the stand of off-grid generation in Krasnodar
Krai. The analysis of the current situation and data collection should be undertaken on site before each
large RES project.
There is no mature RES market in the region and the largest CHPPs are gas-fired. The exception is small
business companies which offer complex RES solutions for the power supply of private houses. Conse-
quently, foreign organizations need to cooperate with Russian partners in the field of marketing, logistics
and search for partners among local players.
The shores of the Azov Sea are rather unsuitable for RES projects due to a strong humidity in winter and
intensive icing of the grids and generating facilities. Another region where one could meet problems is No-
vorossijsk city, where harsh winds happen on a frequent basis. This makes it complicated to develop wind
power projects in this region.

dena study „Market study in the context of decentralized energy supply using renewable energy technologies in selected Russian regions“ 121
Conclusions and Recommendations
This report has shown that there is significant potential in using RES in remote areas that are not connected
to a central or larger local electricity grid, and could provide relief to at least 10 million Russians. RES, such as
wind and PV, were introduced to these areas in 2014, so are still very much infants in regard to their market
development. Wind and PV installations are used to complement existing fuel-based installations, which are
mostly run on diesel. The motivation behind installing RE solutions differs between regions because, while
there are regions that are completely isolated with no connection to any type of grid, such as the Far North,
Far East and Siberia, there are also regions that are serviced by the central grid but where areas can be found
that are only serviced by distributed energy generators, most often gensets running on diesel.
In this report, Sakha Yakutia and Kamchatka were selected to present typical business cases for isolated ter-
ritories. The situation today is such that installed diesel generators in these territories are frequently old and
inefficient and need to be modernized and/or replaced. Traditionally, isolated settlements were only pow-
ered by fossil fuel generators but more recently RE technologies have emerged in these regions. The reason
for this is mostly economic: project initiators are state-owned regional utilities. They are called “guarantee-
ing suppliers” who have the legal mandate to assure the energy supply in remote settlements. These utilities
often suffer from a lack of investment capital and are therefore interested in installing energy solutions,
which are the most economically viable and affordable. As a result, public investors have opted to comple-
ment existing diesel installations with RE solutions to reduce the dependence on expensive diesel deliveries
to the settlements in remote areas. A potential to decrease the share of the diesel power in the hybrid energy
installations further is to increase the share of RE by introducing modern energy management systems and
storage solutions. These are however, often not made due to investment capital constraints. The business
case calculations in this report have confirmed that high diesel costs make the payback of RE investments
possible, but a number of challenges should be taken into consideration, such as, the extreme climate condi-
tions that the equipment needs to be able to withstand and the high demands on logistics. In the past, some
technical solutions failed because they did not take into account the challenging environment of these iso-
lated/remote territories to the extent necessary. In remote areas that are not isolated territories the situation
is different. This report looked into RE off-grid applications in the regions Bashkortostan, Altai and Krasno-
dar. Diesel prices in these areas are not as high as in the isolated territories. Here, fossil fuel savings need to
be supplemented by low initial capital expenditures and other motivations, such as, high opportunity costs
for alternative energy solutions and the costs associated with connecting an off-grid area to the grid.
The use of RES is a young and small phenomenon in Russia’s energy landscape. Following several dormant
years, RES have started to appear, even if only as a centralized energy source. The distribution of RES, be it in
isolated territories or other off-grid areas, needs to be promoted to deliver success stories. The latter can be
realized with pilot projects which have the potential to show that RE can be a reliable and economically via-
ble alternative. The development of new RES markets is not stable in Russia but the potential is most cer-
tainly there. To exploit this further and accelerate the momentum of recent developments, capacity-building
and stakeholder discussions, as well as a positive pioneering spirit, will be needed by all public and private,
Russian and non-Russian stakeholders alike.

Figures
Figure 1 Map of the modern electrification of Russia; source: Elistarov, 2016 [38], based
on Fortov & Popel’, 2011 [44] ............................................................................... 12
Figure 2 Prize, non-prize zones and isolated areas of the wholesale electricity market of
Russia, target regions highlighted; source: eclareon 2019, based on Ernst &
Young, 2018 [163] ................................................................................................. 17
Figure 3 The procedure for the sale of electricity produced by qualified generating
facilities in energy systems disconnected from the UPS; source: Barkin O.G.
[112] ..................................................................................................................... 18
Figure 4 CAPEX, OPEX and FINEX for RES (yellow) and conventional energy sources
(grey); source: eclareon, 2018 ............................................................................. 27
Figure 5 Map of renewable energy potentials in Russia and highlighted target regions of
the study; source: eclareon 2019, generated with amCharts Pixel Map, based on
Renewable Energy Maps, [161], NIPOM, 2018 [162] ........................................... 28
Figure 6 Map of Russia, Yakutia highlighted; source: eclareon 2019, generated with
amCharts Pixel Map ............................................................................................. 29
Figure 7 Current status of the electricity sector of Sakha Republic (Yakutia); source:
eclareon 2019, generated with amCharts Pixel Map, based on Ministry of
Economy of Sakha Republic (Yakutia), 2006 [8], RusHydro [148] and WWF
Russia [55] ............................................................................................................ 30
Figure 8 Structure of the installed capacity by type of power plant in Yakutia in 2017, *-
estimations of eclareon based on the initial data; source: Head of the Sakha
Republic (Yakutia), 2018 [10 ................................................................................ 32
Figure 9 Electricity consumption in Yakutia by type of consumer, %, 2016; source: Head
of the Sakha Republic (Yakutia), 2018 [10] ......................................................... 33
Figure 10 A common scheme of relations between different stakeholders while
implementing a new project; source: Eurosolar Russia Research, 2018 ........... 39
Figure 11 Scheme of the project's flow; source: based on the research completed by
eclareon and partners of the project .................................................................. 42
Figure 12 Project Overview – Batagai 1 MW diesel PV hybrid; source: eclareon
calculations, based on input data researched by EUROSOLAR Russia, 2018 .... 43
Figure 13 Equity Cash Flow – Batagai 1 MW diesel PV hybrid; source: eclareon
calculations, based on input data researched by EUROSOLAR Russia, 2018 .... 44
Figure 14 Project Cash Flows – Batagai 1 MW diesel PV hybrid; source: eclareon
calculations, based on input data researched by EUROSOLAR Russia, 2018 .... 45
dena study „Market study in the context of decentralized energy supply using renewable energy technologies in selected Russian regions“ 123
Figure 15 Specific Yield Sensitivity – Batagai 1 MW diesel PV hybrid; source: eclareon
calculations, based on input data researched by EUROSOLAR Russia, 2018 .... 46
Figure 16 System Price Sensitivity – Batagai 1 MW diesel PV hybrid; source: eclareon
calculations, based on input data researched by EUROSOLAR Russia, 2018 .... 47
Figure 17 Diesel Price Batagai 1 MW diesel PV hybrid; source: eclareon calculations,
based on input data researched by EUROSOLAR Russia, 2018 .......................... 47
Figure 18 Diesel Cost Escalation Batagai 1 MW diesel PV hybrid; source: eclareon
calculations, based on input data researched by EUROSOLAR Russia, 2018 .... 48
Figure 19 Kamchatka Krai region; source: eclareon 2019, generated with amCharts Pixel
Map ...................................................................................................................... 52
Figure 20 Electricity sector in Kamchatka, location of some power plants and energy
systems; source: eclareon 2019, generated with amCharts Pixel Map, based on
Orlov, 2008 [52] and WWF Russia, 2017 [55] ....................................................... 53
Figure 21 A scheme of relationships between the largest energy companies of
Kamchatka; source: based on the research completed by eclareon and IP
Kekelidze .............................................................................................................. 54
Figure 22 Structure of the installed capacity by type of power plant in Kamchatka in 2017
(in MW and %); source: Ministry of Housing and Construction and Energy
Sector of Kamchatka, 2018 [51] .......................................................................... 55
Figure 23 Correlation of fuel types at power plants in Kamchatka; source: Kamchatka
Government, official web site, 2018 [53] ............................................................ 56
Figure 24 Electricity consumption in Kamchatka by type of consumer, %, 2017; source:
Federal State Statistics Service of Russia, 2018 [54] .......................................... 57
Figure 25 Scheme of the project’s flow in Kamchatka; source: based on the research
completed by eclareon and IP Kekelidze ............................................................ 65
Figure 26 Project Overview – Ust-Kamchatsk 900kW diesel wind hybrid; source: eclareon
calculations, based on input data researched by EUROSOLAR Russia, 2018 .... 66
Figure 27 Equity Cash Flow – Ust-Kamchatsk 900kW diesel wind hybrid; source: eclareon
calculations, based on input data researched by EUROSOLAR Russia, 2018 .... 67
Figure 28 Capacity factor Sensitivity – Ust-Kamchatsk 900kW diesel wind hybrid; source:
eclareon calculations, based on input data researched by EUROSOLAR Russia,
2018 ...................................................................................................................... 68
Figure 29 System Price Sensitivity – Ust-Kamchatsk 900kW diesel wind hybrid; source:
eclareon calculations, based on input data researched by EUROSOLAR Russia,
2018 ...................................................................................................................... 69
Figure 30 Diesel Price Ust-Kamchatsk 900kW diesel wind hybrid; source: eclareon
calculations, based on input data researched by EUROSOLAR Russia, 2018 .... 70

Figure 31 Diesel Price Ust-Kamchatsk 900kW diesel wind hybrid; source: eclareon
calculations, based on input data researched by EUROSOLAR Russia, 2018 .... 70
Figure 32 Map of Russia, Republic of Altay highlighted; source: eclareon 2019, generated
with Charts Pixel Map .......................................................................................... 74
Figure 33 Largest SPPs of Republic of Altai and known location of some small off-grid
energy generating; source: eclareon 2019, generated with amCharts Pixel Map,
Head of Republic of Altai, 2018 [81], Gavrischenko, V.P. [82] ............................. 75
Figure 34 Scheme of the relations between major active in Republic of Altai energy
companies; source: research by eclareon ........................................................... 76
Figure 35 Structure of the installed capacity by type of power plant in Altai Republic in
2017 (in MW and %) source: Scheme and program for the development of the
power industry of the Altai Republic for 2018 – 2022 [81] .................................. 77
Figure 36 Structure of the installed capacity by type of power plant in Altai Republic in
2017 (in MW and %) source: Hevel, 2018 [88] ..................................................... 77
Figure 37 Electricity consumption in Altai by type of consumer, %, 2017; source: Federal
State Statistics Service of Russia, 2018 [54]........................................................ 78
Figure 38 Scheme of relations between different stakeholders while implementing a new
project; source: based on the research completed by eclareon and IP
Kekelidze .............................................................................................................. 82
Figure 39 Scheme of the project's flow; source: based on the research completed by
eclareon and partners of the project .................................................................. 83
Figure 40 Project Overview – Yaylu diesel-PV hybrid with storage; source: eclareon
calculations, based on input data researched by EUROSOLAR Russia, 2018 .... 84
Figure 41 Equity Cash Flow – Project Overview – Yaylu diesel-PV hybrid with storage;
source eclareon calculations, based on input data researched by EUROSOLAR
Russia, 2018 ......................................................................................................... 84
Figure 42 Specific Yield Sensitivity – Project Overview – Yaylu diesel-PV hybrid with
storage; source: eclareon calculations, based on input data researched by
EUROSOLAR Russia, 2018 .................................................................................... 85
Figure 43 System Price Sensitivity – Project Overview – Yaylu diesel-PV hybrid with
storage; source: eclareon calculations, based on input data researched by
EUROSOLAR Russia, 2018 .................................................................................... 86
Figure 44 Diesel Price Project Overview – Yaylu diesel-PV hybrid with storage; source:
eclareon calculations, based on input data researched by EUROSOLAR Russia,
2018 ...................................................................................................................... 87
Figure 45 Diesel Cost Escalation Project Overview – Yaylu diesel-PV hybrid with storage;
source: eclareon calculations, based on input data researched by EUROSOLAR
Russia, 2018 ......................................................................................................... 87

dena study „Market study in the context of decentralized energy supply using renewable energy technologies in selected Russian regions“ 125
Figure 46 Map of Russia, Bashkortostan highlighted; source: generated with amCharts
Pixel Map .............................................................................................................. 90
Figure 47 Organization chart of “BESK”; source: official web site of “BESK” [69] ............. 91
Figure 48 Structure of the installed capacity by type of power plant in Bashkortostan in
2017, in MW and %; source: Ministry of Industry and Innovation Politics of the
Republic of Bashkortostan, 2019 [66] ................................................................. 92
Figure 49 Largest power plants of Bashkortostan; source: eclareon 2019, generated with
amCharts Pixel Map, “BGC” Ltd. [70], “Hevel” .................................................... 92
Figure 50 Electricity consumption in Bashkortostan by type of consumer, %, 2017;
source: Federal State Statistics Service of Russia, 2018 [54] .............................. 93
Figure 51 Hybrid power plant business model with government support; source: own
research [54] ........................................................................................................ 98
Figure 52 Severny: Hybrid power plant business model without government support;
source: own research [54] ................................................................................... 98
Figure 53 Project development steps; source: own research ............................................ 99
Figure 54 Project Overview – Severny Diesel-PV-Wind hybrid; source: eclareon
calculations, based on input data researched by EUROSOLAR Russia, 2018 .. 100
Figure 55 Equity Cash Flow – Severny Diesel-PV-Wind Hybrid; source: eclareon
calculations, based on input data researched by EUROSOLAR Russia, 2018 .. 101
Figure 56 Capacity factor Sensitivity – Severny Diesel-PV-Wind Hybrid; source: eclareon
calculations, based on input data researched by EUROSOLAR Russia, 2018 .. 102
Figure 57 System Price Sensitivity – Severny Diesel-PV-Wind Hybrid; source: eclareon
calculations, based on input data researched by EUROSOLAR Russia, 2018 .. 103
Figure 58 Diesel Price Sensitivity – Severny Diesel-PV-Wind Hybrid; source: eclareon
calculations, based on input data researched by EUROSOLAR Russia, 2018 .. 103
Figure 59 Diesel Cost Escalation Sensitivity – Severny Diesel-PV-Wind Hybrid; source:
eclareon calculations, based on input data researched by EUROSOLAR Russia,
2018 .................................................................................................................... 104
Figure 60 Map of Russia, Krasnodar Krai region is highlighted; source: eclareon 2019,
generated with amCharts Pixel Map ................................................................. 106
Figure 61 Largest power plants of Krasnodar Krai; source: eclareon, 2019, generated with
amCharts Pixel Map, based on ”Scheme and Program of development of
energy sector of Krasnodar Krai in 2019-2023” [105] ....................................... 107
Figure 62 Structure of the installed capacity by type of power plant in Krasnodar Krai in
2017; source: Ministry of fuel and energy of Krasnodar Krai, 2018 .................. 108
Figure 63 Electricity consumption in Krasnodar Krai by type of consumer, %, 2017;
source: Federal State Statistics Service of Russia, 2018 [54] ............................ 109
Figure 64 Scheme of relations between different stakeholders while implementing a new
project; source: eclareon 2019 .......................................................................... 113
Figure 65 Project steps for Krasnodar Krai RES projects; source: eclareon 2019 ............ 114
Figure 66 Project Overview – diesel -PV – wind- hybrid Krasnodar; source: eclareon
calculations, based on input data researched by EUROSOLAR Russia, 2018 .. 115
Figure 67 Equity Cash Flow – diesel-PV–wind- hybrid Krasnodar; source eclareon
calculations, based on input data researched by EUROSOLAR Russia, 2018 .. 116
Figure 68 Capacity factor Sensitivity – diesel-PV–wind-hybrid Krasnodar; source:
eclareon calculations, based on input data researched by EUROSOLAR Russia,
2018 .................................................................................................................... 116
Figure 69 System Price Sensitivity – Project Overview – diesel-PV–wind-hybrid
Krasnodar; source: eclareon calculations, based on input data researched by
EUROSOLAR Russia, 2018 .................................................................................. 117
Figure 70 Diesel Price diesel-PV–wind-hybrid Krasnodar; source: eclareon calculations,
based on input data researched by EUROSOLAR Russia, 2018 ........................ 118
Figure 71 Diesel Cost Escalation diesel-PV–wind-hybrid Krasnodar; source: eclareon
calculations, based on input data researched by EUROSOLAR Russia, 2018 .. 118

dena study „Market study in the context of decentralized energy supply using renewable energy technologies in selected Russian regions“ 127
Tables
Table 1 Terms of return of investment capital, provided for by measures of support in
tariff regulation in relation to qualification objects of renewable energy;
source: Barkin O.G. [112] ..................................................................................... 18
Table 2 Some limits for CAPEX and OPEX for RES power plants constructed within the
framework of the Decree 47; source: Order of the Government of Russian
Federation No. 1472-p [139] ................................................................................ 20
Table 3 Target regions, long list; source: eclareon .......................................................... 24
Table 4 Some tariffs for the retail market’s consumers (except from population) of the
electricity provided by “Yakutskenergo” and energy price purchased by
“Yakutskenergo” from “Sakhaenergo” according to the sales contracts ; source:
Yakutskenergo, 2018 [21], Sakhaenergo, 2019 [137], Yakutskenergo, 2019
[151] ..................................................................................................................... 37
Table 5 Number, capacity and major owners of power generating facilities in
Kamchatka; source: Ministry of Housing and Construction and Energy Sector of
Kamchatka, 2018 [51], WWF Russia, 2017 [55] ................................................... 55
Table 6 Some tariffs for energy consumers in Kamchatka and costs of electricity
generation; source : WWF Russia, 2017 [55]; Ministry of Housing and
Construction and Energy Sector of Kamchatka, 2018 [51]; Bashmakov &
Dzedzichek, 2017 [59]; outcomes of research by eclareon and IP Kekelidze .... 60
Table 7 Some economically justified electricity prices and end electricity tariffs (with
subsidies) for energy consumers in Kamchatka; source: “Ossora”, 2018 [153],
“Kolhoz “Udarnik”, 2018 [152], Government of Kamchatka, 2018 [154] ............ 61
Table 8 Tariff for electricity for other consumers in the price zone of the Republic of
Altai for October 2018; source: “Altayenergosbyt” JSC, 2018 [95], Time2Save
[130] ..................................................................................................................... 79
Table 9 Some ceiling prices for the retail market’s consumers (non-residential
consumers) of the electricity provided by “Bashelektrosbyt” in 2019; source:
“Bashelektrosbyt”, 2019 [159] ............................................................................. 95
Table 10 Some ceiling prices for the retail market’s consumers (non-residential
consumers) of the electricity provided by “TNS Energo Kuban” in 2019; source:
“TNS Energo Kuban”, 2019[160] ........................................................................ 110

Bibliography
[1] KCBUX, 2018: “My Country-Territorial Content of Russia”, online: http://kcbux.ru/Statyy/ZA_zizny/za-
016_karta-RF.html , Accessed October 10th 2018
[2] ORV, 2018: Assessment of the Regulatory Impact: Republic of Sakha, Main about the Region. Online:
http://orv.gov.ru/Regions/Details/3 , Accessed October 1st 2018
[3] EMERCOM of Russia, 2018: Characteristics of the Region, Short characteristics of the Sakha Republic (Ya-
kutia). Online: http://14.mchs.gov.ru/folder/537793 , Accessed October 1st 2018
[4] Yakutia Media, 2018: Population of Yakutia may reach 1 Million by 2025. Online: https://yakutiame-
dia.ru/news/676084/, Accessed October 1st 2018
[5] Cities of Russia, 2018: City of Yakutsk. Online: http://города-россия.рф/sity_id.php?id=65 ,Accessed Oc-
tober 1st 2018
[6] ORV, 2018: Main Page. Online: http://orv.gov.ru/ , Accessed October 1st 2018
[7] Financial Reports of Sakhaenergo, 2015, 2016, 2017. Online: http://sakhaenergo.ru/index.php?op-
tion=com_content&task=blogcategory&id=0&Itemid=40, Accessed November 7th 2018
[8] Ministry of Economy of Sakha Republic (Yakutia), 2006: Scheme of the Complex Development of Indus-
try, Transport and Energy sector of Republic of Sakha (Yakutia) until 2020. Online:
http://old.sakha.gov.ru/node/3975 , Accessed October 1st 2018
[9] Yakutia, Info, online newspaper, “Three new solar power plants are being built in Yakutia”, Online:
http://yakutia.info/article/180837 , Accessed November 7th 2018
[10] Head of the Sakha Republic (Yakutia), 2018: Scheme and the Program of Development of the Energy
Market of Sakha Republic (Yakutia) for the Period 2018-2022. Online: http://publica-
tion.pravo.gov.ru/Document/View/1400201804250005?index=13&rangeSize=1 , Accessed October 1st
2018
[11] Yakutia Media, 2018: Alternative Energy Sources develops in Yakutia. Online: https://yakutiame-
dia.ru/news/679966/ , Accessed October 2st 2018
[12] Ykt.Ru – online newspaper, 2018: Launching the Wind park in Yakutia will Allow to Check the Equipment
in the Arctic Conditions. Online: http://news.ykt.ru/article/69137 , Accessed October 2st 2018
[13] RAO EES of the East, 2018: Solar Power Plants. Online: http://www.rao-esv.ru/activity/renewable-en-
ergy/solar-power/ , Accessed October 2st 2018
[14] Sakha News, newspaper, “A Unique wind power plant started to operate beyond the Arctic Circle in
Tiksi”, 2018. Online: http://www.1sn.ru/219027.html , Accessed November 7th 2018
[15] Sakha News, 2018: Central Energy Region of Yakutia will be Connected with the UNP of the East. Online:
http://www.1sn.ru/216374.html , Accessed October 2st 2018
[16] SO UPS, 2018: official web site Filial Structure of the Company. Online: https://so-ups.ru/in-
dex.php?id=structure , Accessed October 2st 2018
[17] Energo 24, 2018: Electricity Tariffs for the Sakha Republic (Yakutia) from July 1st 2018- Online: https://en-
ergo-24.ru/tariffs/electro/2018-elektro/12818.html, Accessed October 2st 2018
[18] Bashmakov, I.A., Dzedzichek, M.G., “Assessment of Cost of Energy Supply in the Regions of Extreme
North” in “Energy Savings” Journal №4 2017. Online: https://www.abok.ru/for_spec/arti-
cles.php?nid=6664, Accessed November 7th 2018
[19] REGNUM, 2018: In Yakutia, the Growth of Electricity Tariffs in not being Slowed down due to Cata-
strophic Outcomes. Online: https://regnum.ru/news/2431118.html , Accessed October 2st 2018
[20] Yakutsk.Ru, 2016: In 2017, Energy sector of Yakutia will Pay 7,2 Billion RUB for Subsidies. Online:
http://yakutsk.ru/news/economy/v_2017_godu_na_perekrestnoe_subsidirovanie_energetiki_v_ya-
kutii_potratyat_7_2_mlrd_rubley/ , Accessed October 2st 2018
[21] Yakutskenergo, 2018: Electricity tariffs, “ENERGY TARIFFS (POWER) (applicable to sales contracts, energy
supply contracts)”, 2018. Online: https://yakutskenergo.ru/opening_information/reg_goods/elec-
tro.php?year=2018#yearanch , Accessed October 4th 2018

dena study „Market study in the context of decentralized energy supply using renewable energy technologies in selected Russian regions“ 129
[22] EastRussia, 2015: RES is the Necessity, Dictated by the Time. Online: https://www.eastrussia.ru/mate-
rial/vie-eto-neobkhodimost-prodiktovannaya-vremenem/ , Accessed October 4th 2018
[23] Law of the Sakha Republic No 1380-3 N 313-V „About the Renewable Energy Sources of Republic of
Sakha (Yakutia) “of November 27th 2014 with changes from February 28th 2017, online:
http://docs.cntd.ru/document/445029370 , Accessed October 4th 2018
[24] Vesti, news portal, 2015: “The largest beyond the Arctic Circle SPP was launched in Batagai, Yakutia”-
Online: https://www.vesti.ru/doc.html?id=2633389 , Accessed October 8th 2018
[25] Dmitrienko, V.N. & Lukutin, B.V., 2015: “Choice of the Capacity for Energy Generating Equipment for a
Hybrid Solar-Diesel Power Plant”, article in the magazine “Fundamental Research” № 4 pp. 61-62,
online: https://www.fundamental-research.ru/ru/article/view?id=37124 , Accessed October 8th 2018
[26] Lenta.ru, 2016, news online source: “Until the Oil Ends – When will Russia Begin to Develop RES” ,
online: https://lenta.ru/articles/2016/06/29/energy1/, Accessed October 8th 2018
[27] Kommersant, 2015; newspaper, “An Unprecedented Megawatt” , online: https://www.kommer-
sant.ru/doc/2747880 , Accessed October 9th 2018
[28] AmCharts, PixelMap, 2018, Online tool, JAVA script maps’ creation, online: https://pixelmap.am-
charts.com/ , Accessed October 10th 2018
[29] Ria News, news portal, 2017: “Rating of Russian Regions: Quality of Life 2016”, online: https://ria.ru/info-
grafika/20170220/1488209453.html Accessed October 10th 2018
[30] INANCE – Information and analytical center, 2017: “GOELRO – The great project of the Russian civiliza-
tion: dream-plan-reality (part 1 of 2)”, online: http://inance.ru/2017/02/goelro-01/ , Accessed October
10th 2018
[31] RG.RU – Russian Newspaper, 2011: “If only the Wind Blew”, online: https://rg.ru/2011/09/30/en-
ergo.html , Accessed October 10th 2018
[32] Vedomosti – newspaper, 2012: “Does Renewable Energy have a Future in Russia?”, Dokukina, K., Terent-
jeva, A.: online: https://www.vedomosti.ru/business/articles/2012/10/31/energetika_ne_zeleneet , Ac-
cessed October 10th 2018
[33] Rosenergoservice – electronic library about energetics, 2004: “Renewable energy in Russia”, Duraeva, E.
, online: http://lib.rosenergoservis.ru/2011-07-20-04-56-55.html?start=4 , Accessed October 10th 2018
[34] The Scientific Notes of the KNAST University № III-1 (3) 2010: Power Engineering, “Transformation of
the Sea Wave Energy”, Chizhimov, S.D.: http://www.uzknastu.ru/files/pdf/III-1(3)2010/16-24.pdf , Ac-
cessed October 10th 2018
[35] Science and Life, № 1б 2005: “Energy is brought by wind”, Maltinskyj, M., Svyatij, V., online:
https://www.nkj.ru/archive/articles/1110/ , Accessed October 10th 2018
[36] REGNUM – Information Agency, 2018 “A Novgorodian Village without Electricity Seeks to getting the
“Benefits of Civilization” in Court”: https://regnum.ru/news/2384209.html , Accessed October 10th 2018
[37] Analytical Center of the Government of Russian Federation, Energy Bulletin 2017. Online:
https://www.google.com/url?sa=t&rct=j&q=&esrc=s&source=web&cd=5&ved=2ahUKEwjogJuwy_vdAh-
WmlYsKHaIiBUEQFjAEegQIAhAC&url=http%3A%2F%2Fac.gov.ru%2Ffiles%2Fpublica-
tion%2Fa%2F14142.pdf&usg=AOvVaw2Fqk4cXiHzafgk_jblRrAF , Accessed October 10th 2018
[38] Elistarov, V.V., 2016: “Autonomous Electrical Supply by the Energy Systems based on RES”, in “COK”
magazine,No.3 2016. Online: https://www.c-o-k.ru/articles/avtonomnoe-energosnabzhenie-ener-
gokompleksami-na-baze-vozobnovlyaemyh-istochnikov-energii , Accessed October 10th 2018
[39] RusCable.ru, 2017: ”Power Sector of Russia at the end of 2017” . Online:https://www.ruscable.ru/arti-
cle/Electric_power_industry_of_Russia/ , Accessed October 10th 2018
[40] “Energy and Industry of Russia” – magazine, № 01-02 (309-310) Jan. 2017: “Converting Peculiarities into
Advantages”, online: https://www.eprussia.ru/epr/309-310/5928400.htm , Accessed October 10th 2018
[41] Energy Policy 120 (2018), pages 600-609, “The slow expansion and renewable energy in Russia: Compet-
itiveness and regulation issues”
[42] Russia Beyond, 2017: “Russia among Top-3 Global Leaders in Solar Module Production”, online:
https://www.rbth.com/science-and-tech/326128-russia-solar-energy , Accessed October 10th 2018

[43] Gzenger, S., Elistratov, VV., & Denisov, R.S., 2016 „Wind Energy in Russia: Perspectives, Possibilities and
Barriers“, pp. 218-220 in the Materials of the International Renewable Energy Congress-XXI: Energy and
Economic Efficiency REENCON-XXI 2016, ISSN 2409-3149
[44] Fortov, V.E. & Popel’ O.S., 2011 “Energy in the Modern World”, ISBN 978-5-91559-095-2
[45] Bashmakov, I.A., 2017 “Energy Supply Efficiency Improvement in Northern Regions of Russia”, in “En-
ergy Efficiency” magazine № 2 2017, Online: https://www.abok.ru/for_spec/articles.php?nid=6616, Ac-
cessed October 11th 2018
[46] Yakutia Media, 2017, “Electricity prices for entities dropped by two times in Yakutia” online: https://ya-
kutiamedia.ru/news/618398/ Accessed October 29th 2018
[47] ORV, 2018: Assessment of the Regulatory Impact: Kamchatka, Main about the Region. Online:
http://orv.gov.ru/Regions/Details/80 , Accessed October 30th 2018
[48] Territorial branch of the Federal State Statistics Service of Russia, Kamchatsky Krai, Official statistics,
Population. Online: http://kamstat.gks.ru/wps/wcm/connect/rosstat_ts/kamstat/ru/statistics/popula-
tion/ , Accessed October 30th 2018
[49] Ecosystema, web page on ecological and climatic information, Online: http://www.ecosys-
tema.ru/07referats/kam/03klimat.htm Accessed October 30th 2018
[50] RG.RU Russian Newspaper, “More Steam”, Aug.28, 2014. Online: https://rg.ru/2014/08/28/reg-
dfo/stanciya.html Accessed October 30th 2018
[51] Ministry of Housing and Construction and Energy Sector of Kamchatka, “Scheme and Program of Elec-
tricity Market Development of Kamchatka for 2018-2022”, Online:
https://www.kamgov.ru/minzkh/shema-i-programma-razvitia-energetiki-kamcatskogo-kraa, Accessed
October 31st 2018
[52] Orlov, V.P., “Natural Resources in the Development of the North (example of Kamchatka)”, 2008, pub-
lished on “Fish of Kamchatka Krai”, Online: http://fishkamchatka.ru/library/books/2760/ , Accessed Oc-
tober 31st 2018
[53] Kamchatka Government, official web site of Kamchatka, Online: https://www.kamgov.ru/socio-eco-
nomic-situation, Accessed October 31st 2018
[54] Federal State Statistics Service of Russia, 2016 “Electricity Balances 2017”. Online:
http://www.gks.ru/wps/wcm/connect/rosstat_main/rosstat/ru/statistics/enterprise/industrial/# , Ac-
cessed November 1st 2018
[55] WWF Russia, “Renewable Energy Sources in Isolated Settlements of the Russian Arctic”, by Berdin, V.H.,
Kokorin, A.O., Ulkin, G.M., and Ulkin, M.A., 2017
https://www.google.com/url?sa=t&rct=j&q=&esrc=s&source=web&cd=2&ved=2ahUKEwi6q9ujpLPeA-
hXssosKHUdwAooQFjABegQIB-
BAC&url=https%3A%2F%2Fnew.wwf.ru%2Fupload%2Fiblock%2F826%2Frenewable_rus.pdf&usg=AOv-
Vaw1jQblD6mnWTZMjf9nHhAO8 , Accessed November 1st 2018
[56] GIS Renewable Energy Sources of Russia, Map of the Solar Power Plants in Russia, 2018. Online:
http://www.gisre.ru/maps/maps-obj/ses , Accessed November 1st 2018
[57] Ministry of Housing and Construction and Energy Sector of Kamchatka, “Scheme and Program of Elec-
tricity Market Development of Kamchatka for 2016-2020”, Online:
https://www.kamgov.ru/minzkh/shema-i-programma-razvitia-energetiki-kamcatskogo-kraa, Accessed
November 1st 2018
[58] Energo 24, 2018: Electricity Tariffs for Kamchatka from July 1st 2018- Online: https://energo-24.ru/tar-
iffs/electro/2018-elektro/12845.html, Accessed November 5th 2018
[59] Bashmakov, I.A., Dzedzichek, M.G., “Assessment of Cost of Energy Supply in the Regions of Extreme
North”, 2017, in Magazine “Energy Savings №4 2017”, Online: https://www.abok.ru/for_spec/arti-
cles.php?nid=6664, Accessed November 5th 2018
[60] Government of Kamchatsky Krai, 09.01.2018, “Decree of the Government of Kamchatka”, “Strategy of
socio-economic development of Kamchatsky Krai until 2030”,
Online:https://www.google.com/url?sa=t&rct=j&q=&esrc=s&source=web&cd=2&ved=2ahUKEwj5t9e42b
_eAhWtposKHR0kCcUQFjABegQIBBAC&url=https%3A%2F%2Fwww.kamgov.ru%2Fminecon%2Fdocu-
ment%2Ffile%2Fdownload%3Fid%3D64454&usg=AovVaw1r8oXW1RseyORPZ6Y9wLRf , Accessed No-
vember 6th 2018

dena study „Market study in the context of decentralized energy supply using renewable energy technologies in selected Russian regions“ 131
[61] Investment Portal of Kamchatka, “Electricity supply for isolated territories of Kamchatka Krai, based on
RES”, Information about the company – initiator of the project. http://investkam-
chatka.ru/%D0%BE%D0%B1%D0%B5%D1%81%D0%BF%D0%B5%D1%87%D0%B5%D0%BD%D0%B8
%D0%B5-
%D1%8D%D0%BD%D0%B5%D1%80%D0%B3%D0%BE%D1%81%D0%BD%D0%B0%D0%B1%D0%B6
%D0%B5%D0%BD%D0%B8%D1%8F-%D0%B8%D0%B7%D0%BE%D0%BB%D0%B8%D1%80%D0%BE/
, Accessed November 6th 2018
[62] “Mobile Energy” PJSC Web page, “WPP in Ust-Kamchatsk”, Online: http://передвижная-
энергетика.рф/projects/veu-v-pos-ust-kamchatsk/ , Accessed November 6th 2018
[63] ORV, 2018: Assessment of the Regulatory Impact: Republic of Bashkortostan, Main about the Region.
Online: http://orv.gov.ru/Regions/Details/46 , Accessed November 19th 2018
[64] UralGeo, Climate of Bashkortostan. Online: http://www.uralgeo.net/klimat_ba.htm , Accessed Novem-
ber 19th 2018
[65] Neftegaz.RU, online magazine, “Fuel and energy complex of Bashkortostan in the economy of Russia”,
Online: https://neftegaz.ru/science/view/1490-Bashkirskiy-toplivno-energeticheskiy-kompleks-v-
ekonomike-Rossii , Accessed November 20th 2018
[66] Ministry of Industry and Innovation Politics of the Republic of Bashkortostan, “Scheme and Program of
Electricity Market Development of Bashkortostan for 2019-2023”. Online: https://industry.bashkorto-
stan.ru/documents/active/131620/ , Accessed March 28th 2019
[67] Ministry of Industry and Innovation Politics of the Republic of Bashkortostan, “Scheme and Program of
Electricity Market Development of Bashkortostan for 2018-2022. Heat supply of the cities. Fuel Supply”.
Online: https://industry.bashkortostan.ru/documents/active/43785/ , Accessed November 20th 2018
[68] Hevel Solar, “Generation of solar power plants under the management of Hevel exceeded 146 GWh”,
2018. Online: http://www.hevelsolar.com/about/news/vyrabotka-solnechnykh-elektrostantsiy-pod-up-
ravleniem-gruppy-kompaniy-khevel-prevysila-146-gvt-ch/?sphrase_id=3140 , Accessed November 20th
2018
[69] “BESK” official web page, About the company, 2018. Online: https://bashes.ru/about/structure/ , Ac-
cessed November 22nd 2018
[70] “BGC” Ltd., “Map of generating capacities”, Online: https://www.bgkrb.ru/activities/business/ , Ac-
cessed November 22nd 2018
[71] Energo 24, 2018: Electricity Tariffs for the Republic of Bashkortostan (Bashkortostan) from July 1st 2018-
Online: https://energo-24.ru/tariffs/electro/2018-elektro/12806.html , Accessed November 22nd 2018
[72] “Bashelectrosbyt” Ltd., “Electricity tariffs in Bashkortostan in 2018 for private consumers”, Online:
https://www.bashesk.ru/tariffs/current/, Accessed November 22nd 2018
[73] RBC News, online news portal, “Research: Does Bashkortostan need RES?”, 2018. Online:
http://www.rbcplus.ru/news/5a9ccda07a8aa907a1395653?ruid=uUjlC1rfCtMOt9uCCM5bAg== , Ac-
cessed November 22nd 2018
[74] http://www.bashinform.ru/news/1237729-stoimost-elektroenergii-ot-vozobnovlyaemykh-istochnikov-
bashkirii-v-4-raza-vyshe-traditsionnoy/ , Accessed November 22nd 2018
[75] Bashinform, online newspaper, “Costs of electricity from RES in Bashkortostan is 4 times higher than
from traditional energy sources”, 2018, Online: http://www.bashinform.ru/news/1237729-stoimost-el-
ektroenergii-ot-vozobnovlyaemykh-istochnikov-bashkirii-v-4-raza-vyshe-traditsionnoy/ , Accessed No-
vember 22nd 2018
[76] Republic of Altay, official web site of the region, “Passport of the region” Online: http://www.altai-re-
public.ru/about-the-region/pasport/ , Accessed November 28th 2018
[77] ORV, 2018: Assessment of the Regulatory Impact: Republic of Altay, Main about the Region. Online:
http://orv.gov.ru/Regions/Details/67 , Accessed November 28th 2018
[78] Hevel, “A largest in Russia Solar Power Plant of 5 MW capacity Launched in Republic of Altai”, Online:
http://www.hevelsolar.com/about/news/v-respublike-altay-vvedena-v-stroy-krupneyshaya-v-rossii-
solnechnaya-elektrostantsiya-moshchnostyu/ , Accessed November 28th 2018
[79] Elektroas.ru, “A Regular Energy Supply of Bele will be Possible Thanks to a Win Power Plant”. Online:
http://elektroas.ru/regulyarnoe-energosnabzhenie-bele-obespechit-novaya-vetroelektrostanciya , Ac-
cessed November 28th 2018

[80] Exmork blog, “In Gorny Altay a second wind power plant was launched”. Online: https://inver-
tory.ru/blog/2/ , Accessed November 28th 2018
[81] Head of Republic of Altay, “Scheme and Program of Development of Energy Sector of the Republic for
the Period 2019-2023”, 2018. Online:
https://www.google.com/url?sa=t&rct=j&q=&esrc=s&source=web&cd=1&cad=rja&uact=8&ved=2ahUKE
wiJneKqjffeAhUN-aQKHXfXBksQFjAAegQICRAC&url=http%3A%2F%2Fwww.altai-repub-
lic.ru%2Fupload%2Fiblock%2F5d9%2F116_u_2018.pdf&usg=AOvVaw1bKNkyE5mM10LXx3ocg3zo , Ac-
cessed November 28th 2018
[82] Gavrischenko, V.P., Altay State University, “History Of Development And The Experience Of The Imple-
mentation Of Wind Power Technologies In The Altai Region” in online scientific magazine “Modern Sci-
entific Research and Innovation”, section “Geographical Science”. Online: http://web.snauka.ru/is-
sues/2016/11/74169 , Accessed November 28th 2018
[83] Energy Advice, “Small Hydropower Plant for a Remote Settlement”, 2015. Online: http://www.energoso-
vet.ru/bul_stat.php?idd=509 , Accessed November 28th 2018
[84] Center of Ecological Awareness of the Sakha Republic (Yakutia), “Experience of Altay Republic may be
included into the National report of Russia of sustainable development”, 2011. Online:
http://www.eyge.ru/topic.php?id=388, Accessed November 28th 2018
[85] “Kommersant” Newspaper; “Kamchatka lacks gas”, Online: https://www.kommersant.ru/doc/3447265,
Accessed February 04th 2019
[86] News of Communal and Housing Services of Kamchatka, “Kamchatka is a leader in terms of costs of
Communal and Housing services in 2018: Russians do not pay enough for living services and pay too
much for housing and communal services”, online: http://kamzkh.ru/10423-kamchatka-lider-po-
razmeru-platezha-zhkkh-za-2018-god-rossiiane-ne-doplachivaiut-za-zhilishchnye-uslugi-i-perepla-
chivaiut-za-kommunalnye.html, Accessed February 04th 2019
[87] ROSNANO official web site, “One of the first in the world hybrid PV-diesel power station is build in the
Republic of Altay”, 2013. Online: http://www.rusnano.com/about/press-centre/news/20130305-hevel-
postroena-odna-iz-pervykh-gibridnykh-dizel-solnechnykh-elektrostantsiy, Accessed February 05th 2019
[88] “Hevel” official web site, “Generation”. Online: http://www.hevelsolar.com/about/generation/, Accessed
February 05th 2019
[89] Lomonosov Moscow State University, Higher School of Economics (Moscow), United Institute of High
Temperatures of the Russian Academy of Sciences, “Atlas of Renewable Energy Sources on the Territory
of Russia”, 2015. Online: https://istina.msu.ru/publications/book/11596712/, Accessed February 05th
2019
[90] Energy Advice, Toshlokov, U.I., “Potentials of RES in the Republic of Altay”, Online: http://www.ener-
gosovet.ru/stat497.html, Accessed February 05th 2019
[91] Energo-24, “Rating of electricity tariffs in Russia from July 1, 2018”, Online: https://energo-24.ru/au-
thors/energo-24/12887.html, Accessed February 05th 2019
[92] Izvestija, Online newspaper, “Electricity tariffs: comparison by Russian regions”, Online:
https://iz.ru/news/644310 , Accessed February 05th 2019
[93] Resolution of the Government of the Russian Federation dated May 4, 2012 No. 442, clause 5, clause 116
paragraph 3. Online: http://docs.cntd.ru/document/902349816 , Accessed February 05th 2019
[94] Order of the Tariff Committee of the Altai Republic No. 49/20 of December 11, 2017, Online:
http://komitet-tarifov.ru/attachments/article/2971/prikaz_49-20_11.12.2017.pdf , Accessed February
05th 2019
[95] “Altayenergosbyt” JSC, “Tariff for electricity for other consumers in the price zone of the Republic of Al-
tai for October 2018”, Online: https://www.altaiensb.com/organization/neregul_price/ , Accessed Febru-
ary 05th 2019
[96] Decree of the Government of the Russian Federation; May 4, 2012 No. 442, paragraph 83. Online:
http://docs.cntd.ru/document/902349816, Accessed February 05th 2019
[97] Order of the Ministry of Regional Development of the Altai Republic No. 120 dated March 15, 2017.
Online: http://altai-republic.ru/upload/iblock/44e/minregion_120_2017.pdf, Accessed February 05th
2019

dena study „Market study in the context of decentralized energy supply using renewable energy technologies in selected Russian regions“ 133
[98] Order of the Ministry of Regional Development of the Altai Republic No. 376-D of July 25, 2018. Online:
http://docs.cntd.ru/document/550147739 , Accessed February 05th 2019
[99] Order of the Tariff Committee of the Altai Republic No. 53/4 of December 28, 2017 Online:
http://komitet-tarifov.ru/attachments/article/2971/prikaz_53-4_28.12.2017.pdf , Accessed February 05th
2019
[100] EastRussia Magazine, “Yakutian bulbs got secured from a blackout”, February 2019. Online:
https://www.eastrussia.ru/material/yakutskie-lampochki-podstrakhovali-ot-blekauta/, Accessed Febru-
ary 05th 2019
[101] Federal State Statistics Service of Russia, Krasnodar Department, “Krasnodar in Numbers – statistical
report 2017”, 2018. Pp-8-9
[102] Federal State Statistics Service of Russia, “Population size and composition”, 2018. Online:
http://www.gks.ru/wps/wcm/connect/rosstat_main/rosstat/ru/statistics/population/demography/#,
Accessed February 06th 2019
[103] Hevel, “Hevel Group of Companies”, Online: http://www.hevelsolar.com/about/for_inves-
tors/HEVEl_%D0%9A%D0%BE%D1%80%D0%BF%D0%BE%D1%80%D0%B0%D1%82%D0%B8%D0%B2
%D0%BD%D0%B0%D1%8F%20%D0%BF%D1%80%D0%B5%D0%B7%D0%B5%D0%BD%D1%82%D0%
B0%D1%86%D0%B8%D1%8F.pdf , Accessed February 07th 2019
[104] Government of Krasnodar Krai, “Scheme and Program of development of energy sector of Krasnodar
Krai in 2019-2023”, 2018
[105] Head of the Administration of Krasnodar Krai, Decree 652 of June 14th 2002, “About the regional energy
commission – department of prices and tariffs of Krasnodar Krai”. Online: http://docs.cntd.ru/docu-
ment/424061115 , Accessed February 07th 2019
[106] “TNS Kubanenergo”, „The parity of the electric power (capacity) market subject“, Nov 2018. Online:
https://kuban.tns-e.ru/disclosure/report-
ing/?PARAMS={%22MONTH%22:[12],%22YEAR%22:[%222018%22]} , Accessed February 07th 2019
[107] Department of prices and tariffs of Krasnodar Krai, Order of 28th December 2017 N63/2017-э
http://docs.cntd.ru/document/537899819 , Accessed February 07th 2019
[108] RG – Russian Newspaper, “Decree of the Government of the Russian Federation of December 29, 2011 N
1178 Moscow "On pricing in the field of regulated prices (tariffs) in the electric power industry”, 2012.
Online: https://rg.ru/2012/01/24/ee-regulirovanie-site-dok.html , Accessed on February 17th 2019
[109] Government of the Russian Federation, Decree No. 854 of 27 December 2004 Moscow “On approval of
the Rules of Operations and Dispatching Control in the Electric Power Industry”, 2018. Online:
http://pravo.gov.ru/proxy/ips/?docbody=&prevDoc=102119990&backlink=1&&nd=102090365, Accessed
February 17th 2019
[110] Federal Law of the Russian Federation N35-FZ “On electric power industry (as amended on 27 Decem-
ber 2018) (version effective from 1 January 2019)”, 2019. Online: http://www.consultant.ru/docu-
ment/cons_doc_LAW_41502/ , Accessed February 17th 2019
[111] Decree of the Government of the Russian Federation of 04.05.2012 N 442 (edition of 30.01.2019) "On the
operation of retail electricity markets, full and (or) partial limitation of the mode of consumption of
electric energy" (together with the "Basic provisions of the functioning of retail electricity markets",
"Rules of full and (or) partial limitation of the mode of consumption of electric energy"), 2019. Online:
http://www.consultant.ru/document/cons_doc_LAW_130498/ , Accessed February 18th 2019
[112] Barkin O.G. NP “Market Council” - Presentation “Generation on the basis of renewable energy sources:
the expediency of development taking into account the interests of market participants”, 2015. Online:
http://www.reenfor.org/up-
load/files/%D0%91%D0%B0%D1%80%D0%BA%D0%B8%D0%BD%D0%9E.%D0%93.pdf, Accessed Feb-
ruary 17th 2019
[113] Decree of the Government of the Russian Federation of January 23, 2015 N 47 "On Amendments to Cer-
tain Acts of the Government of the Russian Federation on the Promotion of Renewable Energy Sources
in Retail Electricity Markets, 2015. Online: http://base.garant.ru/70853050/, Accessed: February 17th
2019
[114] Order of the Government of the Russian Federation of 08.01.2009 N 1-r (ed. of 15.05.2018) "On the main
directions of the state policy in the field of increasing energy efficiency of the electric power industry on

the basis of renewable energy sources for the period up to 2024". Online: http://rulaws.ru/gover-
ment/Rasporyazhenie-Pravitelstva-RF-ot-08.01.2009-N-1-r/, Accessed February 17th 2019
[115] Federal Law N 261-FZ of November 23rd 2009 “Energy Saving And Energy Efficiency The Effectiveness Of
And Changes To The Individual Legislative Acts Of The Russian Federation”. Online: http://www.consult-
ant.ru/document/cons_doc_LAW_93978/ , Accessed February 17th 2019
[116] President of Russia, official web site, “List of instructions following the results of the meeting of the
State Council”, 2017. Online: http://www.kremlin.ru/acts/assignments/orders/53775, Accessed February
17th 2019
[117] Government of Russia, “Instruction from the Ministry of Economic Development and Trade in pursu-
ance of the instructions of the President of Russia following the results of the State Council meeting on
December 27, 2016” Online: http://government.ru/dep_news/26412/, Accessed February 17th 2019
[118] Federal Law "On Energy Saving and Energy Efficiency and on Amendments to Certain Legislative Acts of
the Russian Federation" of 23.11.2009 N 261-FZ (last edition), Online: http://www.consultant.ru/docu-
ment/cons_doc_LAW_93978/, Accessed February 17th 2019
[119] RG – Russian Newspaper, “The government has submitted a draft law on microgeneration to the State
Duma”, 2018. Online: https://rg.ru/2018/11/07/pravitelstvo-vneslo-v-gosdumu-zakonoproekt-o-mikro-
generacii.html, Accessed February 17th 2019
[120] Government of Russia, “The Law Commission approved a draft law on the legal regulation of electricity
generation at microgeneration facilities”, 2018. Online: http://government.ru/dep_news/34326/, Ac-
cessed February 17th 2019
[121] RIA News, “Government to discuss project on microgeneration in electric power industry”, 2018. Online:
https://ria.ru/20181031/1531822356.html, Accessed February 17th 2019
[122] Government of Russia, “Decisions adopted at the Government meeting on 31 October 2018”, 2018.
Online: http://government.ru/news/34534/, Accessed February 17th 2019
[123] Government of Russia “On the introduction of a draft law to the State Duma on the legal regulation of
electricity generation at microgeneration facilities”, 2018. Online: http://govern-
ment.ru/dep_news/34594/, Accessed February 17th 2019
[124] Betaenergy, “How to calculate a mains solar power plant”, online: https://www.betaenergy.ru/arti-
cle/kak_rasschitat_setevuyu_solnechnuyu_elektrostantsiyu/2018
[125] “Yakutskenergo” web site, “Price (tariff) for electricity (capacity) supplied by PJSC Yakutskenergo to
customers in retail markets in territories not technologically related to the Unified Energy System of
Russia and technologically isolated territorial power systems, as well as in technologically isolated terri-
torial power systems under power supply contracts for 2017 (Applicable in case of conclusion of power
supply contracts)”, 2017. Online: https://www.yakutskenergo.ru/opening_information/reg_goods/elec-
tro.php?year=2017#yearanch, Accessed February 16th 2019
[126] “Bashenergosbyt” local energy supplier, “Limit levels of unregulated prices for electricity (capacity)
supplied to consumers (buyers) of ESCB LLC (with maximum capacity of power receiving devices up to
670 kW) in January 2019”. Online: https://www.bashesk.ru/corporate/tariffs/unregulated/685533/ , Ac-
cessed February 19th 2019
[127] Republic of Altay, official web site, “Passport of the Region”, 2018. Online: http://altai-repub-
lic.ru/about-the-region/pasport/, Accessed February 16th 2019
[128] Decree of the Government of the Russian Federation of December 27, 2010 N 1172 (ed. September 27,
2018) "On Approving the Rules of the Wholesale Electricity and Capacity Market and Amending Certain
Acts of the Government of the Russian Federation on Organizing the Operation of the Wholesale Market
of Electricity and Capacity", Appendix1, Online: http://government.ru/docs/20168/, Accessed February
16th 2019
[129] Head of Republic of Altay, “Scheme and Program of Development of Energy Sector of the Republic for
the Period 2018-2022”, 2018. Online: http://www.altai-republic.ru/upload/iblock/5d9/116_u_2018.pdf,.
Accessed: February 17th 2019
[130] Time2Save, online tool and tariff database, “Base of electricity tariffs for enterprises” Online:
http://time2save.ru/calculaters/nereguliruemie-ceni-na-elektroenergiu, Accessed February 19th 2019
[131] Law of Krasnodar Krai of June 7, 2004, No. 723-KZ "On the Utilization of Renewed Sources of Energy in
Red Army Krai".Online: http://docs.cntd.ru/document/461607253 , Accessed February 18th 2019

dena study „Market study in the context of decentralized energy supply using renewable energy technologies in selected Russian regions“ 135
[132] The Decision of the Head of Administration (governor) of Krasnodar Krai from 14.10.2013 N 1183 “De-
velopment of fuel and energy complex”, Online: http://pravo.gov.ru/proxy/ips/?doc_itself=&in-
fostr=xO7q8+zl7fIg7vLu4fDg5uDl8vH/IO3lIOIg7+7x6+Xk7eX-
pIPDl5ODq9ujo&nd=140020283&page=1&rdk=0#I0, Accessed: February 18th 2019
[133] Law of Krasnodar Krai N 3930-KZ “On the Krasnodar Krai’s Social and Economic Development Strategy
until 2030”, 2018. Online: http://docs.cntd.ru/document/550301926, Accessed: February 18th 2019
[134] Habr, “Solar powered base station”, 2011. Online: https://habr.com/ru/company/beeline/blog/128256/,
Accessed: February 18th 2019
[135] Inosmi – online magazine, “Consequences of the construction of the Kerch Bridge”, 2017. Online:
https://inosmi.ru/politic/20170808/239998732.html, Accessed February 18th 2019
[136] BSW Solar “Enabling PV Russia”, Online: https://www.solarwirtschaft.de/fileadmin/user_upload/Ena-
bling_PV_Russia_EN.pdf; Accessed April 9th, 2019
[137] Sakhaenergo, “On setting stationary tariffs for electricity generated by Sakhaenergo JSC for 2019”,
2019. Online:
https://www.google.com/url?sa=t&rct=j&q=&esrc=s&source=web&cd=1&ved=2ahUKEwin49uMntzgAhW
GY1AKHbtVATsQFjAAegQIB-
BAC&url=http%3A%2F%2Fsakhaenergo.ru%2Ffiles%2Fpp225_28122018.pdf&usg=AOvVaw3QkkWtAi2z-
tSYq7jIqXdd , Accessed February 27th 2019
[138] Lukutin, B.V., & Kiushkina, V.R., “Wind Power Plants in the autonomous energy supply of Yakutia”|
«Ветроэлектростанции в автономной энергетике Якутии», Tomsk, TPU, 2006, УДК 621.548
[139] Government of Russian Federation, Order No 1472-p of July 21st 2015. Online:
https://www.google.com/url?sa=t&rct=j&q=&esrc=s&source=web&cd=1&ved=2ahUKEwjg2tLmsJPhA-
hUEblAKHefSB_4QFjAAegQIBhAC&url=http%3A%2F%2Fstatic.govern-
ment.ru%2Fmedia%2Ffiles%2FgoomAd8bkYkAzjAwAOpRJ5pt2mjqbviW.pdf&usg=AOv-
Vaw06wpAE2DOTCmApuVinf4cY , Accessed March 21st 2019
[140] Government of Russian Federation, Decree No 961 of September 23rd 2016 “On the procedure for grant-
ing subsidies from the federal budget for technological connection of generating facilities operating on
the basis of renewable energy sources”. Online: http://government.ru/docs/24684/ , Accessed March
25th 2019
[141] Government of Russian federation, Decree No 610 of May 23rd 2017 “On amendments to the Rules of
qualification of a generating facility operating on the basis of renewable energy sources”. Online:
http://government.ru/docs/27798/ , Accessed March 25th 2019
[142] “ATS”, “Forecasts of free (unregulated) prices for electricity (capacity) by constituent entities of the Rus-
sian Federation for 2019 and initial data for building forecasts”. Online: http://www.atsenergo.ru/re-
sults/statistic/fcast/fcorem?year=2019&load=second, Accessed March 25th 2019
[143] “Just Russia/Spravedlivaya Rossiya” political party web site, “Deputies of the SR faction on the devel-
opment of microgeneration”. Online: http://www.spravedlivo.ru/9421710 , Accessed March 25th 2019
[144] Head of the Republic of Sakha, “About the sheme and program of the energy sector development of the
Sakha Republic (Yakutia) for 2018-2022”. Online: https://glava.sakha.gov.ru/ot-23-aprelya-2018-g-----
2515 , Accessed: March 26th 2019
[145] NG.ru, Newspaper, “Yakutia is searching for the most effective way of energy generation”, March 11th
2019, Nifontova, M.S. Online: http://www.ng.ru/energy/2019-03-11/15_7527_electricity.html, Accessed:
March 26th 2019
[146] “Sakhaneftegassbyt”, liquid fuel retailer in Yakutia, “Wholesale selling prices of petroleum products
(from 01.01.2019)”. Online: http://www.sngs.ykt.ru/node/91, Accessed: March 26th 2019
[147] “Sakhaenergo”, “Energy Passport 2017”. Online: http://sakhaenergo.ru/index.php?option=com_con-
tent&task=view&id=822 , Accessed: March 26th 2019
[148] “RusHydro” web site, “Location of facilities of the South Yakutia Hydropower Complex”. Online:
http://www.yakutia.rushydro.ru/hpp/general/ , Accessed: March 27th 2019
[149] Yakutia Media, 2018, “Starting from January 1, 2019, Yakutia's power districts will move to the "non-
price zone" of the Far East wholesale market”. Online: https://yakutiamedia.ru/news/763282/ , Ac-
cessed: March 27th 2019

[150] Bashmakov, I.A., Dzedzichek, M.G, in “Energy Efficiency Centre XXI century (CENEF)”, Publication “Low-
carbon solutions for isolated regions of Russia with high energy costs”, 2018,
http://www.cenef.ru/art_11212_119_node2.html , Accessed: March 27th 2019
[151] “Yakutskenergo”, “On setting tariffs for electricity supplied to consumers of PJSC Yakutskenergo for
2019”. Online: https://yakutskenergo.ru/opening_information/reg_goods/electro.php?year=2019#year-
anch, Accessed: March 27th 2019
[152] “Kolhoz “Udarnik” energy company, “Approval of an economically feasible electricity tariff in 2019”,
2019. Online: http://kolhoz-udarnik.appspot.com/ , Accessed: March 27th 2019
[153] “Ossora” Ltd., “Resolution of economically justified electricity tariff for 2019”, 2018. Online:
http://www.ossorateplo.ru/electro , Accessed: March 27th 2019
[154] Government of Kamchatka, “Resolution of the Regional Tariffs and Prices Service of the Kamchatka Ter-
ritory No. 439 dd. 20.12.2018 "On Approval of Basic Tariffs for Electric Power, taking into Account Subsi-
dies from the Regional Budget, Supplied by Energy Supplying Organizations to Consumers of Electric
Power (Capacity) of "Other Consumers" Category in the Territory of the Kamchatka Territory (except for
"Population" Category) for 2019". Online: https://www.kamgov.ru/sltarif/document/frontend-docu-
ment/view-npa?id=19845, Accessed: March 27th 2019
[155] “Ossora” Ltd., “Estimated electricity costs for 2019”, 2018. Online: http://www.ossorateplo.ru/electro ,
Accessed: March 27th 2019
[156] “Kolhoz “Udarnik” energy company, “Electric power calculates the tariff for 2019”, 2019. Online:
http://kolhoz-udarnik.appspot.com/ , Accessed: March 27th 2019
[157] “Altayenergosbyt”, “Order N 49/9 on setting prices (tariffs) for electricity (capacity) supplied to the pop-
ulation and categories of consumers of the Republic of Altai equivalent, 2019”, 2018. Online:
https://www.altaiensb.com/organization/tarifs/ , Accessed: March 27th 2019
[158] “Bashelektrosbyt”, “Electricity tariffs in the Republic of Bashkortostan for 2019 for individuals”. Online:
https://www.bashesk.ru/tariffs/current/ , Accessed: March 28th 2019
[159] “Bashelektrosbyt”, “Limit levels of unregulated prices for electricity (capacity) supplied to consumers
(buyers) of ESCB LLC (with a maximum capacity of power receiving devices up to 670 kW) in February
2019”. Online: https://www.bashesk.ru/corporate/tariffs/unregulated/ , Accessed: March 28th 2019
[160] “TNS energo Kuban”, “Limit levels of unregulated prices for electricity (capacity) supplied to consumers
(buyers)”, 2019. Online: https://kuban.tns-e.ru/disclosure/report-
ing/?PARAMS={%22MONTH%22:[%2202%22],%22YEAR%22:[%222019%22]} , Accessed: March 28th 2019
[161] Renewable Energy Maps. Online: http://renewableenergymaps.blogspot.com/p/research-and-pricing-
russian-federation.html, Accessed: March 28th 2019
[162] NIPOM, “Renewable energy sources in the gas industry”, 2018. Online: http://nipom.ru/me-
dia/news/vozobnovlyayemyye-istochniki-energii-v-energetike-gazovoy-otrasli-2 . Accessed: March 28th
2019
[163] Ernst & Young Global Limited “Overview of the electricity and power industry in Russia”. Online:
https://www.google.com/url?sa=t&rct=j&q=&esrc=s&source=web&cd=1&ved=2ahUKEwji5ZCMiMXgA-
hUE36QKHQL_CjcQFjAAegQIABAC&url=https%3A%2F%2Fwww.ey.com%2FPublication%2FvwLUAs-
sets%2FEY-power-market-russia-2018%2F%24File%2FEY-power-market-russia-2018.pdf&usg=AOv-
Vaw3W0wEDX5zFAmUq1MQQ9--C , Accessed: February 27th 2019
[164] GIS RES – GIS Renewable energy sources of Russia, “Solar radiation on the horizontal surface (year)”.
Online: http://gisre.ru/maps/sun-radiation/gor/gor-year , Accessed: April 4th 2019.
[165] Government of Russia, “ The Government has submitted to the State Duma a draft law on exemption
from taxation of income from the sale of electricity produced at microgeneration facilities”, 2019, online:
http://m.government.ru/dep_news/37702/ , Accessed: August 29th 2019.

dena study „Market study in the context of decentralized energy supply using renewable energy technologies in selected Russian regions“ 137
Abbreviations
Acronym Definition
BSW Bundesverband Solarwirtschaft (German Solar Industry Association)
CAPEX Capital Expenditures
CHPP Combined Heat and Power Plant
DC Direct Current
Dcode Distribution Code
DENA (dena)Deutsche Energie Agentur – German Energy Agency
DPP Diesel Power Plant
DPP Diesel Power Plant
DSCR Debt Service Coverage Ratio
DVGK Far Eastern Generating Company
EEG Erneuerbare Energien Gesetz (Renewable Energy Source Act, Germany)
EIA Environmental Impact Assessment
EIRR Economic Internal Rate of Return
EPC Engineering, Procurement and Construction
ESIA Environmental and Social Impact Assessment
EU European Union
FIT Feed-in Tariff
FOREX Foreign Exchange
FSA Fuel Supply Agreement
FX Foreign Exchange
GDP Gross Domestic Product
GHG Green House Gas
GIZ Gesellschaft für Internationale Zusammenarbeit
GPP Geothermal Power Plant
GWp Giga Watt peak
HPP Hydro Power Plant
HV High Voltage
ICT Information and Communication Technology
IEA International Energy Agency
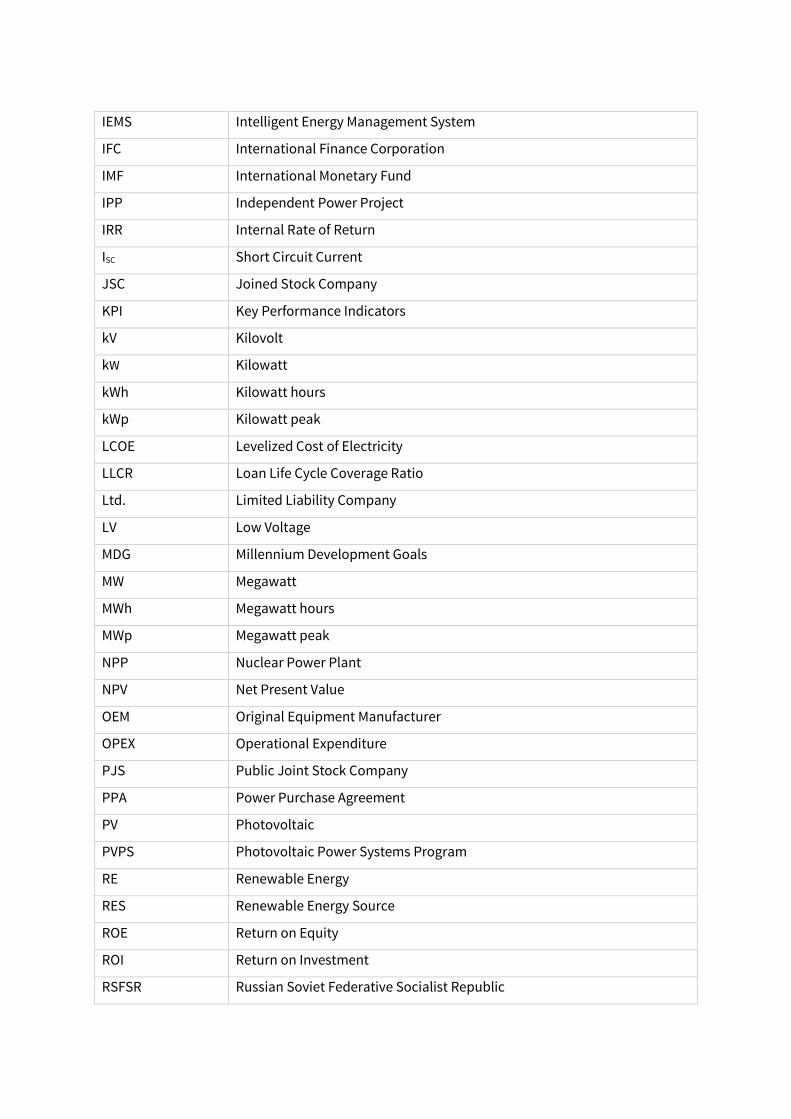
IEMS Intelligent Energy Management System
IFC International Finance Corporation
IMF International Monetary Fund
IPP Independent Power Project
IRR Internal Rate of Return
ISC Short Circuit Current
JSC Joined Stock Company
KPI Key Performance Indicators
kV Kilovolt
kW Kilowatt
kWh Kilowatt hours
kWp Kilowatt peak
LCOE Levelized Cost of Electricity
LLCR Loan Life Cycle Coverage Ratio
Ltd. Limited Liability Company
LV Low Voltage
MDG Millennium Development Goals
MW Megawatt
MWh Megawatt hours
MWp Megawatt peak
NPP Nuclear Power Plant
NPV Net Present Value
OEM Original Equipment Manufacturer
OPEX Operational Expenditure
PJS Public Joint Stock Company
PPA Power Purchase Agreement
PV Photovoltaic
PVPS Photovoltaic Power Systems Program
RE Renewable Energy
RES Renewable Energy Source
ROE Return on Equity
ROI Return on Investment
RSFSR Russian Soviet Federative Socialist Republic

dena study „Market study in the context of decentralized energy supply using renewable energy technologies in selected Russian regions“ 139
RUB Russian Rubles
SHS Smart Home Systems
SME Small and medium-sized enterprises
SO UPS System Operator of the United Power System
SPP Solar Power Plant
SPV Special Purpose Vehicle
SRS Solar Residential Systems
UN United Nation
UPS United Power System of Russia
USD United States Dollar
VAT Value Added Tax
WACC Weighted Average Cost of Capital


www.dena.de