Embed Size (px)
Citation preview

Market Structure, Efficiency, and Performance in the European Property-Liability Insurance Industry
Thomas R. Berry-Stölzlea
Mary A. Weissb
Sabine Wendec
July 2011
Abstract
Restructuring and consolidation of the European insurance marketplace is occurring due to the creation of a single integrated European insurance market. Consolidation raises public policy questions concerning the impact on consumers from consolidation. The structure-conduct-performance (SCP) hypothesis states that a decrease in the number of firms within a market may lead to collusion among firms, while the relative market power hypothesis states that firms that accrue market power may use this power adversely for consumers (e.g., to raise price and increase profit). Finally, the efficient structure hypothesis states that more efficient firms can charge lower prices than competitors, allowing them to capture a larger market share. In this case, consolidation may benefit both firms and consumers because the more efficient firms can charge lower prices and earn higher profits. The purpose of this research is to test these three hypotheses in the European property-liability insurance market. Panel data covering twelve countries and the years 2003 to 2007 are used to test the hypotheses. Both group and company data are tested. The results strongly support the efficient structure hypothesis, and there is extremely little or no support for the SCP hypothesis or the relative market power hypothesis.
a Terry College of Business, University of Georgia, 206 Brooks Hall, Athens, GA 30602, Tel.: +1-706-542-5160,
Fax: +1-706-542-4295, [email protected] b Department of Risk, Insurance, and Healthcare Management, Temple University, Alter Hall, 1801 Liacouras Walk,
Philadelphia, PA 19122, Tel.: +1-215-204-1916, [email protected] c Department of Risk Management and Insurance, University of Cologne, Albertus-Magnus-Platz, 50923 Cologne,
Germany, Tel.: +49-221-470-2330, Fax: +49-221-428-349, [email protected]

1
Market Structure, Efficiency, and Performance in the European Insurance Industry
INTRODUCTION
Since the founding of the European Community (EC) in 1957, its member states have been
working on the creation of an integrated economic market. With respect to the insurance industry
in particular, the EC adopted twenty-one directives to achieve a minimum level of harmonization
and create a more level playing field.1 The most significant change came in 1994 with the
introduction of the single license that allows insurers licensed in their state of origin to write
business in all member states.
The creation of a single, integrated European insurance market has led to increased competition
(Cummins and Weiss, 2004). As a result, the European financial services industry in general,
and the European insurance industry in particular, have been in the midst of consolidation and
restructuring. In particular, at least part of the motivation for this consolidation is stated as
achieving cost economies of scale (Fenn et al., 2008). The increase in mergers and acquisitions
within the insurance industry following this deregulation raises important public policy
questions: What is the effect of consolidation on consumers? Are government actions warranted
to prevent too much consolidation? For example, are antitrust or other regulatory actions
needed?
The traditional structure-conduct-performance (SCP) paradigm suggests that effective collusion
between firms increases with industry concentration because concentration lowers the cost of
collusion. Prices that are less favorable to consumers positively impact firm performance such as
profitability (Stigler, 1964). Similarly, the relative market power (RMP) hypothesis predicts a
positive relationship between a firm’s market share and its performance. That is, if consumers
rely on a firm’s position in the market as an indicator of quality, larger firms have market power
simply by virtue of their position in the market, allowing them to earn rents (Rhoades, 1985).
1 For a complete list of directives related to the creation of the Single Insurance Market and a detailed description of its legal and regulatory framework see Hogan (1995) and Mueller (1995).

2
Therefore, the traditional SCP and RMP hypotheses provide an argument for antitrust regulation
prohibiting actions that reduce the number of viable competitors.
However, both the SCP and the RMP hypotheses ignore the possibility of market entry by new
firms. Hence, Demsetz (1973, 1974) and Peltzman (1977) propose an alternative view, the
efficient-structure (ES) paradigm. According to the ES paradigm, more efficient firms can
charge lower prices than their competitors and still earn economic rents. Their comparative
advantage allows more efficient firms to capture a larger market share, which will lead to an
increase in market concentration. Thus, higher market concentration may benefit both firms and
consumers; (efficient) firms can earn higher profits while consumers can benefit from lower
prices.
Despite the economic importance of the European insurance market, we are not aware of any
research jointly testing the SCP paradigm, the RMP hypothesis and the ES hypothesis for the
European insurance market.2 Therefore, the goal of this research is to examine the efficiency-
structure-performance relationship for the European property-liability insurance market. Group
and company-level data for property-liability insurance companies from 12 major European
countries for the years 2003 through 2007 are analyzed. Cost, revenue and scale efficiency
scores are estimated using data envelopment analysis (DEA); these efficiency scores are then
used as independent variables in regressions measuring performance. Following Choi and Weiss
(2005), we use two different performance measures, price and profit, to analyze whether
consolidation benefits consumers and firms. Overall, our results are consistent with the
prediction of the ES hypothesis that firm efficiency lowers prices and, hence, benefits consumers.
The remainder of this paper is organized as follows. In the next section the model is specified
and we consider how this model can be used to discriminate between the SCP, RMP and ES
hypotheses. Following this, the methodology is explained, including econometric considerations
2 In general, there is little empirical research on the joint effects of market structure and efficiency on the performance of insurance companies. To our knowledge, only Choi and Weiss (2005) and Weiss and Choi (2008) provide such analyses, focusing on the U.S. property-liability insurance market and the U.S. auto insurance market, respectively.

3
and specification of model variables. The data are discussed in the succeeding section. The
results are discussed next, followed by the section with the conclusion.
MODEL SPECIFICATION AND HYPOTHESIS TESTS
The relationship between firm performance and market structure and efficiency in the European
insurance market is investigated in this research using the approach of Choi and Weiss (2005).
We test three specific hypotheses SCP, RMP, and ES. We use cost (revenue) efficiency and cost
(revenue) scale-efficiency to examine the ES hypothesis, decomposing this hypothesis into the
efficient-structure (ES1) hypothesis and scale efficient-structure (ES2) hypothesis. While ES1
states that overall cost and revenue efficiency is related to profit and prices, ES2 suggests that a
component of overall cost and revenue efficiency, scale efficiency, is an important determinant of
prices and profit. (See also Berger, 1995; Goldberg and Rai, 1996.) This subcomponent of
efficiency is singled out in this study because economies of scale has been used to justify the
consolidation occurring (Fenn et al., 2008).3 Thus, we examine the relationships between
efficiency and prices and profit as well as the relationships of scale efficiency with prices and
profit separately to analyze the ES hypothesis.
Relationship Between Price, Profit, and Performance
To test the SCP, RMP, ES1, and ES2 hypotheses, two main equations are estimated:
Profitict = β0 + β1Concentrationct + β2Market Shareict + β3Cost Efficiencyit
+ β4Cost Scale Efficiencyit + β5Revenue Efficiencyit
+ β6Revenue Scale Efficiencyit + γ´Xict + ρ’Countryc + λ’Yeart + εict (1)
Priceict = δ0 + δ1Concentrationct + δ2Market Shareict + δ3Cost Efficiencyit
+ δ4Cost Scale Efficiencyit + δ5Revenue Efficiencyit
+ δ6Revenue Scale Efficiencyit + ξ´Xict +τ’Countryc+ υ’Yeart + ωict (2)
3 That is, cost efficiency=pure technical efficiency * scale efficiency * allocative efficiency. Revenue efficiency can be broken down analagously.

4
where i refers to insurer i, c refers to country c, and t is time t. Xict is a vector of control variables
for insurer i in market c at time t, and εict and ωict are error terms for insurer i in market c at time
t. Fixed country and year effects are included in the model. The coefficients on key explanatory
variables (i.e., β(δ)1, β(δ)2, β(δ)3, β(δ)4, β(δ)5, and β(δ)6) are used to evaluate the SCP, RMP, ES1,
and ES2 hypotheses. Predicted signs for the key model coefficients are explained below.
The Structure-Conduct-Performance Hypothesis. The SCP hypothesis posits a positive
relationship between concentration and performance (Stigler, 1964). Positive and significant
signs for β1 and δ1 in equations (1) and (2) would provide evidence in favor of the SCP
hypothesis. That is, higher concentration would be associated with higher prices and profit.
Furthermore, if only the SCP hypothesis holds, the market share variable should have only a
small impact (at best), and efficiency effects should be small or insignificant.
The Relative-Market-Power Hypothesis. The RMP hypothesis states that a high market share is
associated with relatively more market power (see Rhoades, 1985; Shepherd, 1986; Berger and
Hannan, 1993; Berger, 1995). Hence the key variable is market share when investigating the
relative market power hypothesis. Positive coefficients for the market share variable in
Equations (1) and (2) would provide support for the RMP hypothesis since it would signify that
firms with relatively more market power are associated with higher prices and profit. In addition,
if only RMP holds, the coefficient for concentration should be insignificant, and the efficiency
variables should be relatively unimportant.
The Efficiency Hypothesis. Under ES1, overall cost efficiency is the driving force for profit and
price after controlling for the effects of other variables. Firms that are more cost efficient operate
with lower relative costs, and they are hypothesized to charge lower prices as a result. In
addition, they can earn economic rents from their cost advantage (i.e., earn higher profits). A
negative sign for the cost efficiency coefficient (δ3) would be consistent with ES1 in equation 2,
while a positive coefficient for cost efficiency in the profit equation would be consistent with
ES1 (i.e., β3 is expected to be positive).
Also according to ES1, firms that are relatively more revenue efficient may charge different
prices than competitors and potentially earn economic rents. Revenue efficiency can arise from
5
establishing the ease of “one-stop shopping” for customers. Alternatively, revenue efficiency
may derive from using detailed customer information to cross-sell products and/or establishing a
brand name. Firms that are more revenue efficient are expected to earn higher profits. Thus the
coefficient for revenue efficiency in the profit equation (β5) is expected to be positive and
significant. Revenue efficiency, however, may affect prices positively or negatively. Customers
may be willing to pay more for the convenience of one-stop shopping, for example. Therefore
the sign for the revenue efficiency coefficient in the price equation (i.e., δ5) may be positive or
negative. Finally, if the ES1 hypothesis is supported, the coefficients for the market share and
concentration variables should be insignificant.
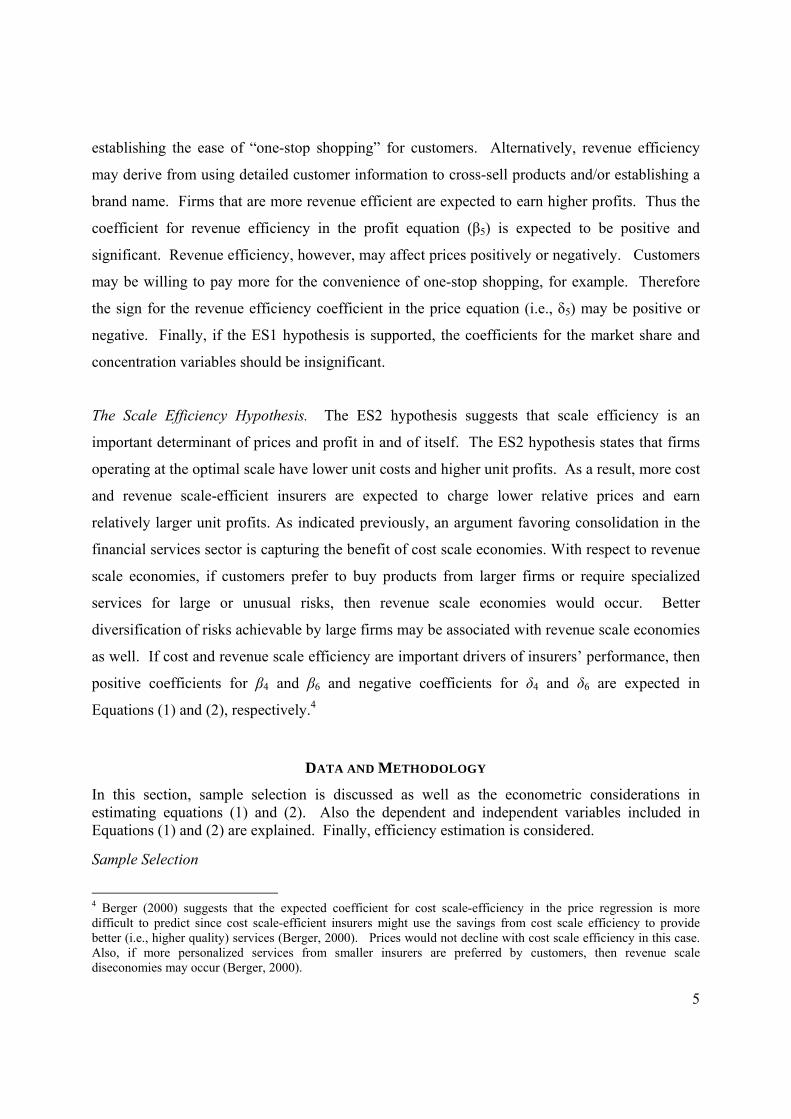
The Scale Efficiency Hypothesis. The ES2 hypothesis suggests that scale efficiency is an
important determinant of prices and profit in and of itself. The ES2 hypothesis states that firms
operating at the optimal scale have lower unit costs and higher unit profits. As a result, more cost
and revenue scale-efficient insurers are expected to charge lower relative prices and earn
relatively larger unit profits. As indicated previously, an argument favoring consolidation in the
financial services sector is capturing the benefit of cost scale economies. With respect to revenue
scale economies, if customers prefer to buy products from larger firms or require specialized
services for large or unusual risks, then revenue scale economies would occur. Better
diversification of risks achievable by large firms may be associated with revenue scale economies
as well. If cost and revenue scale efficiency are important drivers of insurers’ performance, then
positive coefficients for β4 and β6 and negative coefficients for δ4 and δ6 are expected in
Equations (1) and (2), respectively.4
DATA AND METHODOLOGY
In this section, sample selection is discussed as well as the econometric considerations in estimating equations (1) and (2). Also the dependent and independent variables included in Equations (1) and (2) are explained. Finally, efficiency estimation is considered.
Sample Selection
4 Berger (2000) suggests that the expected coefficient for cost scale-efficiency in the price regression is more difficult to predict since cost scale-efficient insurers might use the savings from cost scale efficiency to provide better (i.e., higher quality) services (Berger, 2000). Prices would not decline with cost scale efficiency in this case. Also, if more personalized services from smaller insurers are preferred by customers, then revenue scale diseconomies may occur (Berger, 2000).

6
The data used in the analysis are at the group level. While based on the European Union’s Third
Direct Non-life Insurance Directive insurance companies only need a single license from their
state of origin to write all types of insurance business in all member states, the insurance contract
law and the tax law of the host country still apply, making cross-border services difficult.
Therefore, hardly any insurance companies write business across borders.5 Group level activities,
however, paint a completely different picture. There are multiple European insurance groups,
like the AXA Group, which operate in multiple European countries. These multinational
insurance groups have separate subsidiaries in each country they operate in. Such subsidiaries
are full-fledged insurance companies with a license issued by the regulatory authority in their
country of domicile. Hence, we argue that there exists a single integrated European property-
liability insurance market for insurance groups and we use property-liability insurance groups as
our main unit of analysis.
Market structure (such as concentration and market shares) varies by country, hence using group
data allows us to see how the same insurance group operates under different market structures.
Use of group data implies that strategic decisions and market power are associated with the
group. For example, groups such as ING market their group name, rather their individual
subsidiary names. On the other hand, it might be argued that regulation occurs at the company
level within each country. Therefore, as a robustness test, the analysis is conducted also using
company data. The remainder of this section discusses how data for the analysis was selected.
The insurer data used in the analysis are obtained from A.M. Best’s Statement File Global for the
years 2003 through 2007. The initial sample consisted of all listed nonlife insurance companies
operating in European countries. However several screens are applied to the data. First, all
insurers classified as reinsurers or pure holding companies are excluded. Second, insurers with
negative premiums written, premiums earned, total assets, policyholder surplus, or invested
assets are excluded. The third screen is used to exclude insurers with missing data for basic
accounting variables, including total assets, policyholder surplus, net provisions, operating
expenses, profit before- and after-tax, technical reserves, investments, and losses incurred. The
last screen excludes countries which joined the European Union within the last ten years. The
5 For example, the market share of cross-border business from European insurers in Germany is negligible: it was less than 3% in 2004 (yearbook of the BaFin).

7
insurance markets in these countries are not likely to be as well integrated in the EU and tend to
be less developed.
Further screening occurred due to the efficiency analysis. Insurers with negative or missing
values for the input and output variables for the efficiency analysis are deleted.6 Extreme outliers
are also excluded.7 Finally, small insurers (losses incurred less than five million euros) were
eliminated. Data in Statement File Global are at the company level, hence insurer company data
are aggregated for the group level analysis, controlling for potential double counting of intra-
group shareholdings.
The final sample consists of aggregated insurance groups and single unaffiliated insurers; there
are 1,463 firm-year observations with a maximum of 304 unique firms in 2006. This group
sample is used to compute efficiency scores for the insurers. The subsequent regression analysis
is based on group-country-year observations and, hence, treats, a group’s business in France and
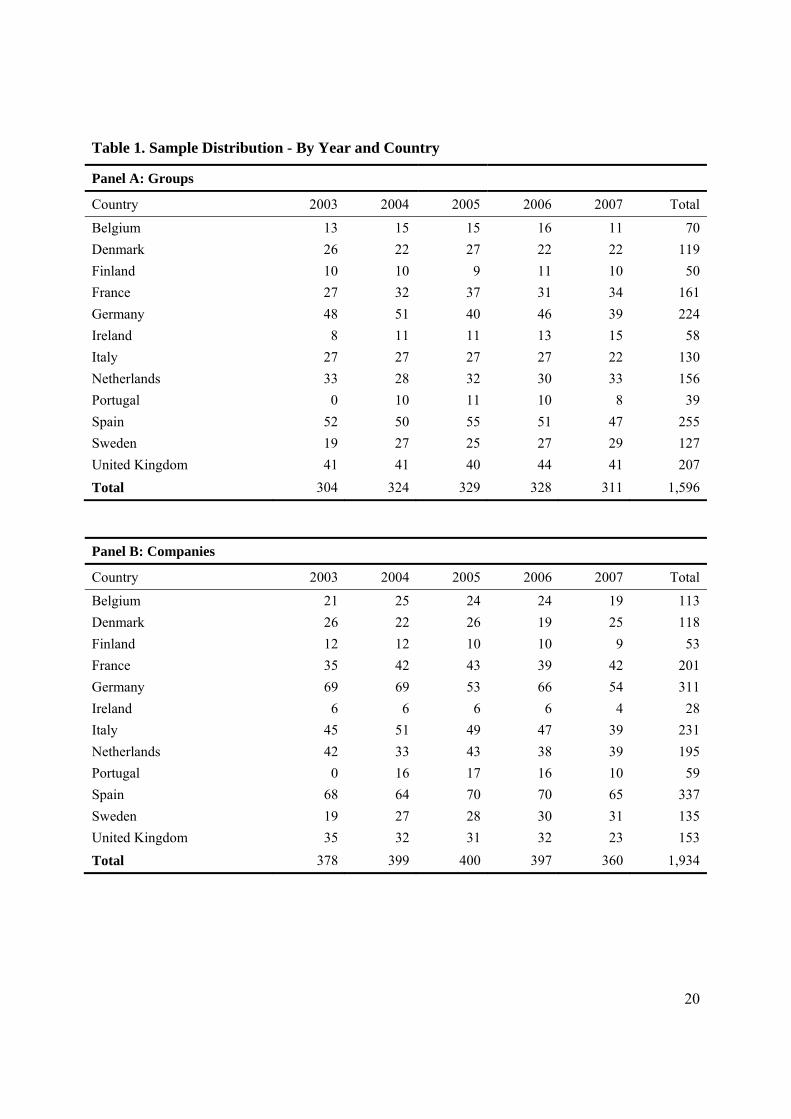
Italy as two separate observations. Panel A of Table 1 presents summary statistics for the sample
distribution. The alternative company sample used as a robustness check has 1,934 firm-year
observations with a maximum of 400 unique companies in 2005 (see Panel B of Table 1). The
samples include insurers from twelve different European countries over the period 2003 through
2007.8
Econometric Considerations
First ordinary-least squares (OLS) regressions are used to estimate Equations (1) and (2), with the
standard errors adjusted for heteroscedasticity. Note that the SCP hypothesis states that the
relationships between market structure, firm conduct, and firm performance are simultaneous
cause-and-effect relationships (see Clarke and Davies, 1982; Jung 1987; Carroll, 1993). Hence
there may exist a simultaneous equation bias in using OLS regression analysis to estimate
Equations (1) and (2). To test whether endogeneity exists with respect to market share,
concentration as well as to the efficiency variables, Wooldridge’s (1995) score test is performed 6 Observations are deleted if the return on equity (ROE) has value above one or below minus one (Berger and Ofek, 1995) for the predicted value regression for the equity input price. 7 That is, all groups where the ratio of operating expenses to losses incurred is lower than 5 percent and higher than 200 percent are excluded, as these were deemed extremely unreasonable. 8 The twelve countries included in our sample are: Belgium, Denmark, Finland, France, Germany, Ireland, Italy, Netherlands, Portugal, Spain, Sweden, and the United Kingdom.

8
for all models. Unlike the original Durbin-Wu-Hausman test for endogeneity, Wooldridge’s
score test can accommodate heteroscedasticity. For all variables found to be endogenous,
instrumental variables are used to estimate a two-stage-least squares (2SLS) regression model.9
Specification of Regression Variables
Dependent and independent variables, used to assess the SCP, RMP and ES hypotheses discussed
above, are specified for Equations (1) and (2) below. Included in the discussion of model
variables are additional variables used to control for insurer and market characteristics that might
be related to price and profitability.
Dependent Variables. To measure insurers’ performance we use profitability and price as
dependent variables in analyzing the relationship between market structure and performance. A
form of the underwriting profit margin is used to estimate an insurer’s profitability. The profit
margin used is
Losses Incurred Expenses1- -
Premiums Earned Premiums Written.
Price is estimated as premiums earned divided by losses incurred.10
Market Structure Variables. We use the market share of the eight largest insurance companies in
a country each year as a measure of concentration.11 We calculate this variable by dividing the
9 The set of possible instrumental variables consists of all exogenous variables, the exogenous variables squared, the natural logarithm of total assets, the ranks of the efficiency variables, a country’s political risk index, a country’s corruption index, a country’s insurance penetration, a country’s population density and the country’s credit rating. We use the political risk index, the corruption index, insurance penetration and a country’s credit rating as instrumental variables for concentration and market share since the political and business environment as well as the availability of capital could influence concentration and market share in the insurance industry. Data for the Political Risk Index variable is from the PRS International Country Risk Guide Researchers dataset. This index is an assessment of government accountability and stability, quality of bureaucracy and law enforcement, investment climate, and various sources of political and social conflicts. Data for the Corruption Perception Index are from Transparency International’s website. Data for insurance penetration are from Swiss Re’s Sigma publications; the variable is calculated as a country’s aggregate insurance market premium divided by GDP. Population density is defined as population per square kilometre; data are from the World Bank’s World Development Indicators database. We use the average of the two ratings published semi-annually by Institutional Investor to capture a country’s credit rating. F-tests for partial R-squared values of the excluded instruments were conducted. Only instruments with significant F-statistics in excess of the value 10 were included in the final models. 10 Sometimes the present value of losses incurred is used to calculate profit and price (as in Choi and Weiss, 2005). In this study, payout patterns for losses are not available, hence the present value of losses incurred cannot be estimated.

9
total premium volume of each country’s largest eight insurance companies in our sample by the
country’s non-life industry’s premium volume as reported in Swiss Re’s Sigma publications for
the corresponding year. Market share is defined as the proportion of total premiums accounted
for by insurer i in country c at time t, and is computed by dividing the insurer’s gross premiums
written by the country’s non-life industry’s premium volume as reported in Swiss Re’s Sigma
publications for the corresponding year.
Other Control Variables. Other factors might affect prices and profit besides the SCP, RMP and
ES variables. Hence additional control variables are included in the regressions, and these are
related to the control variables in Choi and Weiss (2005). More specifically, variables measuring
market growth, reinsurance utilization, stock ownership form, and group status are included in
the regression models.
Market growth is measured using growth of a country’s aggregate non-life gross premiums
written (GPW).12 Growth is defined as [(GPW)c,t - (GPW)c,t-1]/(GPW)c,t-1. It is included as a
control variable because it reflects insurance market conditions in each country. For example,
high market growth may lead to new entry by insurers, reducing profitability. On the other hand,
market growth might be associated with less price competition, allowing firms to increase
profitability and expand their operations.
Reinsurance may affect the overall performance of the insurer. Hence reinsurance ceded
(reinsurance assumed), defined as the ratio of the sum of reinsurance ceded (assumed) to direct
premiums written, is included in the profit and price equations. The signs of the coefficients for
the reinsurance variables are uncertain. Reinsurance may result in a better diversification of risk
for the insurer, leading to lower prices and/or higher profits. On the other hand, reinsurance is
associated with loading/expense costs, acting to increase cost and, hence, affect profit negatively
and price positively.
11 Due to data limitations, we are unable to use the standard measure of market concentration: the Herfindahl index. The Herfindahl index only captures market concentration correctly when its calculation is based on all companies in the market. Our data source, A.M. Best’s Statement File Global, however, only contains the most important market players. A Herfindahl index based concentration measure would, hence, lead to biased results. Since AM Best collects data from larger insurers, we do not expect a measurement problem with respect to measuring concentration as the market share of the top 8 insurers. 12 Data are from Swiss Re’s Sigma publications.

10
To control for stock ownership and group affiliation, two dummy variables are included in the
regression models. Stock Ownership is a dummy variable that has the value one if an insurer in
the sample is a stock company and zero otherwise. The Group dummy indicates whether a
company is a member of a group, with a value of one denoting membership in a group, and zero
otherwise. We have no priors on the coefficients of these variables.
Finally, the ratio of losses incurred to total provisions for losses is used as a proxy for the extent
of long-tail business conducted by the company. The technical provisions for loss established for
long-tail business should stay on the company’s balance sheets over several years, making
current incurred losses relatively smaller when expressed in a ratio to total technical provisions
for loss. If price and profit vary systematically with long-tail business, a significant coefficient
for this variable is expected, although the sign cannot be predicted.
Table 2 summarizes the variables used in the study. Expected coefficient signs and rationales for
including the variables are presented as well. Table 3 shows the summary statistics for all
variables used in the regression, including instrumental variables.
Efficiency Estimation
A non-parametric approach, Data Envelopment Analysis (DEA), is used to estimate cost and
revenue efficiency as well as cost and revenue scale efficiency. The DEA approach is based on
the work of Farrell (1957) and Färe, Grosskopf, and Lovell (1985) and has been widely used to
measure insurer efficiency. To measure cost efficiency, a two-step procedure is used. First, the
following linear programming problem must be solved for each firm, i = 1,2, …, I (time
superscripts are suppressed):
Min xi : wi
Txi (3)
Subject to Yλi ≥ ys, s= 1, 2, …, N, Xλi ≤ xj, j=1,2,…, M, and λi ≥ 0,
where Y is an N x I output matrix, and X is a M x I input matrix for all firms in the sample; yi is a
N x 1 output vector and x is an M x 1 input vector for firm i, and λi is an I x 1 intensity vector for
firm i. T stands for a vector transpose. Constant returns to scale are imposed by the constraint
λi ≥ 0. The solution vector is xi* (i.e., the cost-minimizing input vector corresponding to price
vector wi and output vector yi). Next firm i’s cost efficiency is expressed as the ratio ηi =

11
wiTxi
*/wiTxi, which is the ratio of costs if the firm were on the cost frontier to the firm’s actual
costs. Cost efficiency is greater than zero and less than or equal to one, and a cost efficiency
score equal to one signifies full efficiency.
Revenue efficiency is estimated analogously to cost efficiency except that an output orientation is
used, and revenues are maximized in the linear programming problems instead of minimizing as
with cost (Lovell, 1993). To estimate scale efficiency, technical efficiency must be estimated
(which involves solving additional linear programming problems). Then technical efficiency is
separated into pure technical efficiency and scale efficiency.13 DEA scores are estimated using
EU wide data by year.
To estimate efficiency, inputs, outputs, and their prices must be specified. Consistent with the
recent insurance and banking literature, we adopt the well-established value-added approach to
measure property-liability insurers’ outputs and inputs (Berger and Humphrey, 1992; Yuengert,
1993; Cummins and Zi, 1998; Cummins, Tennyson, and Weiss, 1999; Cummins, Weiss, and Zi,
1999; Cummins, Xie, 2009; Cummins, Weiss, Xie, and Zi 2010).14
Under the value-added approach, property-liability insurers provide three principal outputs
(services): real services related to insured losses, risk-pooling and risk-bearing, and
intermediation (Cummins, Weiss, Xie, and Zi, 2010). We use real total losses incurred net of
reinsurance to proxy for the aggregate amount of risk-pooling and real insurance services
provided by an insurance company.15 The price of losses incurred is the difference between real
premiums earned and real losses incurred net of reinsurance for output divided by real losses
incurred net of reinsurance. We select real total invested assets as a second output variable to
13 Specifically, to estimate technical efficiency the following linear programming problems must be solved for each firm: T(yi,xi) = min θi subject to Yλi ≥ yi, Xλi ≤ θixi, and λi ≥ 0. Pure technical efficiency can be estimated by re-calculating the latter linear programming problem after adding the constraint that the sum of the λi’s is equal to one (to obtain a variable returns to scale frontier). The variable returns to scale measure can be interpreted as pure technical efficiency. Once technical and pure technical efficiency are known, scale efficiency can be estimated from the relationship (technical efficiency)i = (pure technical efficiency)i * (scale efficiency)i. 14 We did not use the financial intermediation approach because property-liability insurers’ services are not limited to financial intermediation (see, e.g., Cummins, Weiss, and Zi, 1999; Jeng and Lai, 2005). 15 Since information about the lines of business is not available in the dataset we cannot break down the output measure by lines of business (e.g., long-tail versus short-tail or commercial versus personal business). However, a proxy for long-tail business is included as an independent variable in the specification of equations (1) and (2).
12
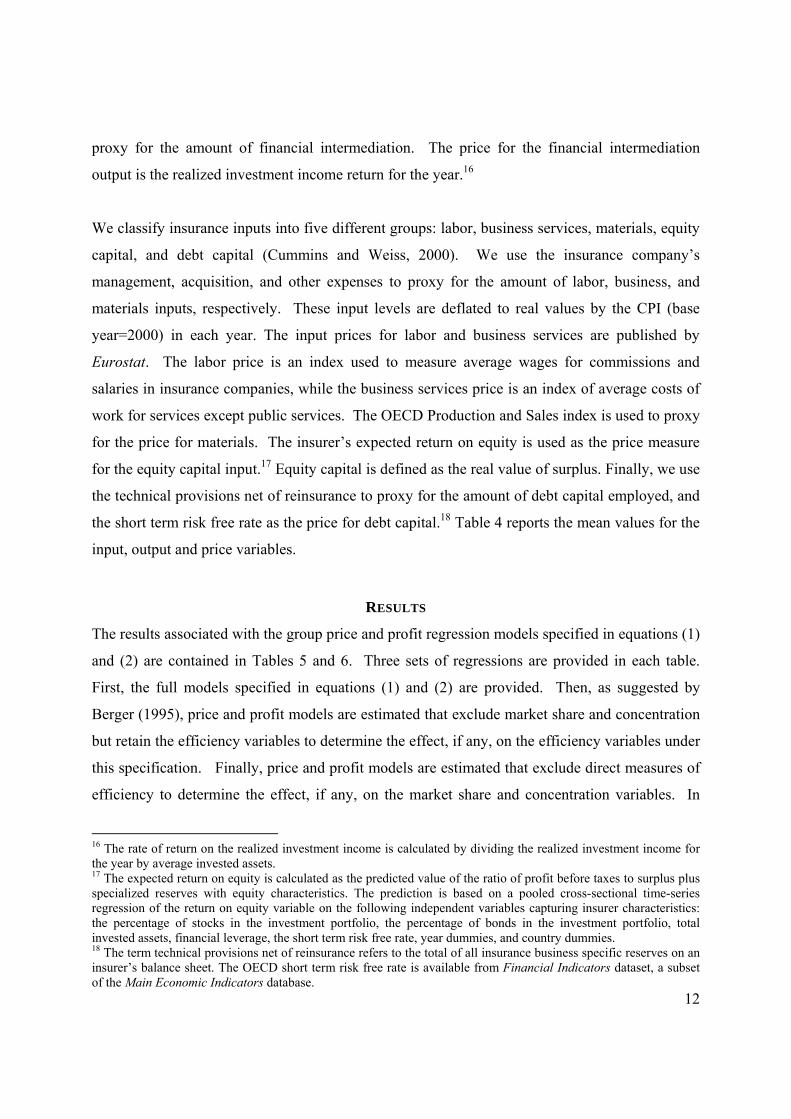
proxy for the amount of financial intermediation. The price for the financial intermediation
output is the realized investment income return for the year.16
We classify insurance inputs into five different groups: labor, business services, materials, equity
capital, and debt capital (Cummins and Weiss, 2000). We use the insurance company’s
management, acquisition, and other expenses to proxy for the amount of labor, business, and
materials inputs, respectively. These input levels are deflated to real values by the CPI (base
year=2000) in each year. The input prices for labor and business services are published by
Eurostat. The labor price is an index used to measure average wages for commissions and
salaries in insurance companies, while the business services price is an index of average costs of
work for services except public services. The OECD Production and Sales index is used to proxy
for the price for materials. The insurer’s expected return on equity is used as the price measure
for the equity capital input.17 Equity capital is defined as the real value of surplus. Finally, we use
the technical provisions net of reinsurance to proxy for the amount of debt capital employed, and
the short term risk free rate as the price for debt capital.18 Table 4 reports the mean values for the
input, output and price variables.
RESULTS
The results associated with the group price and profit regression models specified in equations (1)
and (2) are contained in Tables 5 and 6. Three sets of regressions are provided in each table.
First, the full models specified in equations (1) and (2) are provided. Then, as suggested by
Berger (1995), price and profit models are estimated that exclude market share and concentration
but retain the efficiency variables to determine the effect, if any, on the efficiency variables under
this specification. Finally, price and profit models are estimated that exclude direct measures of
efficiency to determine the effect, if any, on the market share and concentration variables. In
16 The rate of return on the realized investment income is calculated by dividing the realized investment income for the year by average invested assets. 17 The expected return on equity is calculated as the predicted value of the ratio of profit before taxes to surplus plus specialized reserves with equity characteristics. The prediction is based on a pooled cross-sectional time-series regression of the return on equity variable on the following independent variables capturing insurer characteristics: the percentage of stocks in the investment portfolio, the percentage of bonds in the investment portfolio, total invested assets, financial leverage, the short term risk free rate, year dummies, and country dummies. 18 The term technical provisions net of reinsurance refers to the total of all insurance business specific reserves on an insurer’s balance sheet. The OECD short term risk free rate is available from Financial Indicators dataset, a subset of the Main Economic Indicators database.

13
other words, whether a variable such as market share proxies for efficiency when direct measures
of efficiency are eliminated from the analysis can be determined by estimating the model without
the efficiency variables and comparing the new results with the full model. The latter results are
contained in the third set of models in Tables 5 and 6.
The first set of regression results in Table 5 strongly show cost and revenue efficiency to be
negatively and significantly related to price in both the OLS and two-stage-least-squares (2SLS)
models, as the coefficients for these variables are negative and significant at the 1 percent level.
Thus cost and revenue efficiency are associated with lower prices for consumers, supporting the
efficient structure hypothesis. On the other hand, the coefficient for the cost scale efficiency
variable is mostly insignificant in the regression results in Table 5. Revenue scale efficiency is
positively and significantly related to price in all models, signifying that consumers are willing to
pay more for the products of revenue scale efficient firms.
Concentration is not significantly related to price, and market share is unexpectedly negatively
related to price in the 2SLS regression results in Model 1 in Table 5, contrary to the relative
market power hypothesis. Therefore, no support for the relative market power hypothesis and the
SCP hypothesis is found in the first set of regression results.
When market share and concentration are omitted from the equation, the signs and significances
of the efficiency variables remain the same, except that cost scale efficiency becomes
insignificant in the 2SLS model. This provides very limited support for the idea that efficiency
may proxy for market share and/or concentration. It is interesting to note that the explanatory
power of the models is not very much affected by the omission of the market share and
concentration variables. For example, the R-squared in the OLS model with the full specification
of variables is 0.486, and the R-squared in the OLS regression results for Model 2 is also equal to
0.486.
In the third set of equations (in which the efficiency variables are omitted from the model),
market share becomes negative and more highly significant in both the 2SLS and OLS models.
This indicates that price decreases with market share. This provides support for the notion that
when efficiency is omitted as a variable, market share proxies for these variables. That is, it is

14
reasonable that the set of most efficient firms will become larger due to their efficiency advantage
and garner more market share because they charge lower prices. Thus the presence of firms with
high market share is not in and of itself indicative of problems in the market. Further, the
concentration variable remains insignificant in Model 3 in Table 5, providing no support for the
SCP hypothesis.
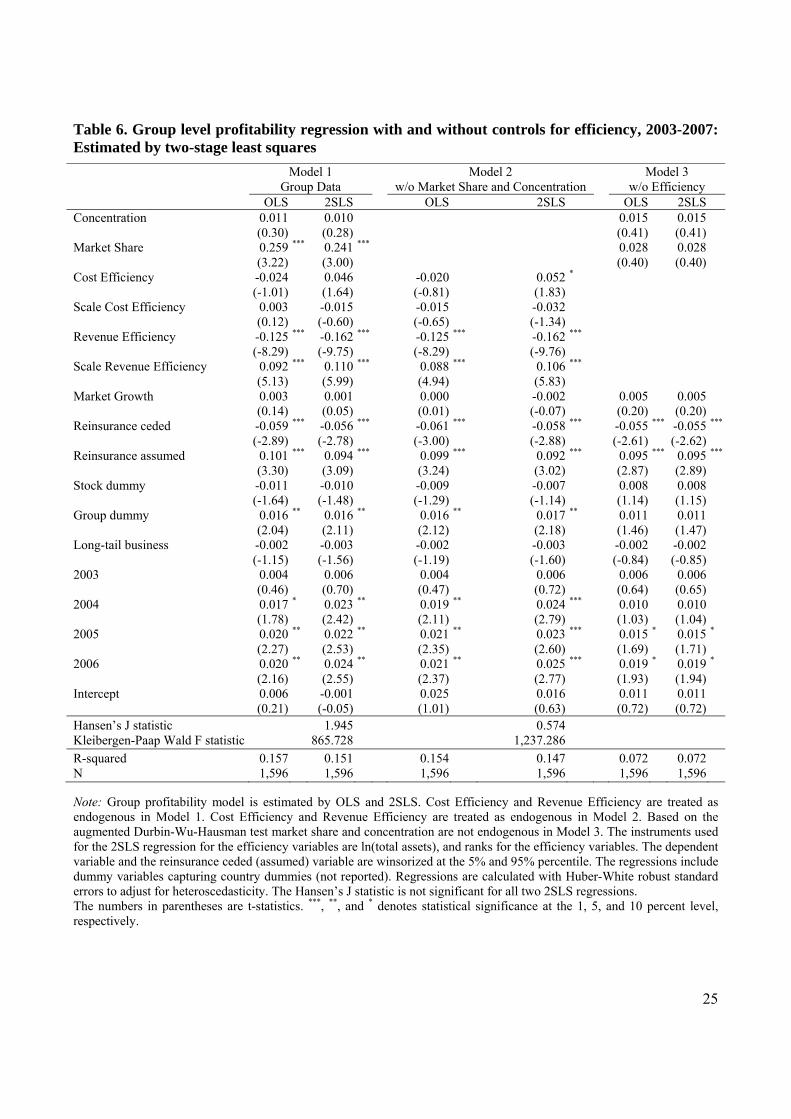
In Table 6, the same models appear as in Table 5 except that profit is now the dependent variable.
Cost efficiency and cost scale efficiency are not significantly related to profit in the first set of
regression results. Also, in the first set of regression results, revenue efficiency is negative and
significant at the 1 percent level. These results indicate that firms that are more revenue efficient
earn lower per unit profits. This result occurs even though, according to Table 5, more revenue
scale efficient firms charge higher prices. This may indicate that the effort spent by the insurer to
become more revenue efficient (e.g., one stop shopping) outweighs the benefit of the additional
revenue on profit. On the other hand the 2SLS results in Table 6 indicate that firms that are more
revenue scale efficient earn higher profits since the coefficient for the revenue scale efficiency
variable is positive and significant in all models in Table 6. Therefore the negative impact on
profit associated with revenue efficiency is not associated with the scale of the firm.
It is interesting to note also that cost efficiency is associated with lower prices only, not higher
profit, as the coefficient for cost efficiency is negative in the price equation in Table 5 and
insignificant in the profit model in Table 6. Market share is positively related to profit in both the
OLS and 2SLS models in the first set of results. This provides some support for the RMP
hypothesis.
In the second set of results in Table 6, revenue efficiency remains significant and negative, while
cost efficiency now becomes positive and significant in the 2SLS results. These results suggest
that cost efficiency and concentration and/or market share may be related. As in the results for
Table 5, the absence of the market share and concentration variables do not affect very much the
R-squareds of the models in the second set of regressions, signifying that concentration and
market share do not explain very much of the variability in profitability among insurers.
15
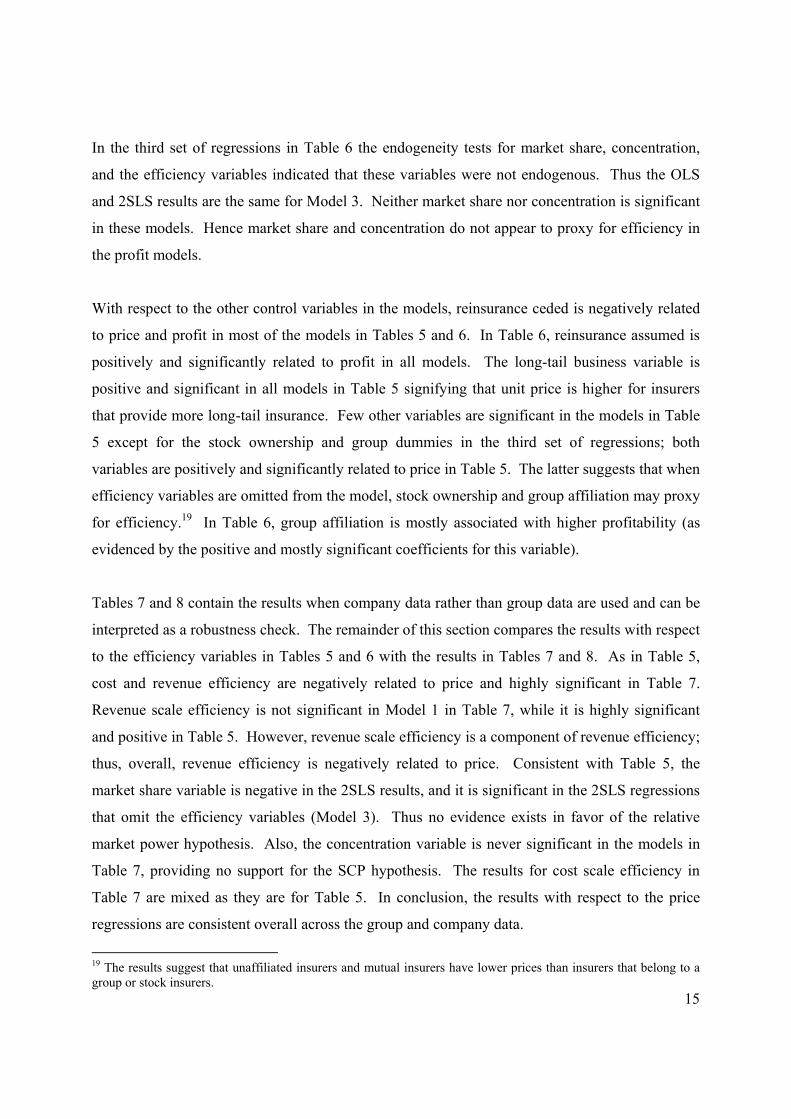
In the third set of regressions in Table 6 the endogeneity tests for market share, concentration,
and the efficiency variables indicated that these variables were not endogenous. Thus the OLS
and 2SLS results are the same for Model 3. Neither market share nor concentration is significant
in these models. Hence market share and concentration do not appear to proxy for efficiency in
the profit models.
With respect to the other control variables in the models, reinsurance ceded is negatively related
to price and profit in most of the models in Tables 5 and 6. In Table 6, reinsurance assumed is
positively and significantly related to profit in all models. The long-tail business variable is
positive and significant in all models in Table 5 signifying that unit price is higher for insurers
that provide more long-tail insurance. Few other variables are significant in the models in Table
5 except for the stock ownership and group dummies in the third set of regressions; both
variables are positively and significantly related to price in Table 5. The latter suggests that when
efficiency variables are omitted from the model, stock ownership and group affiliation may proxy
for efficiency.19 In Table 6, group affiliation is mostly associated with higher profitability (as
evidenced by the positive and mostly significant coefficients for this variable).
Tables 7 and 8 contain the results when company data rather than group data are used and can be
interpreted as a robustness check. The remainder of this section compares the results with respect
to the efficiency variables in Tables 5 and 6 with the results in Tables 7 and 8. As in Table 5,
cost and revenue efficiency are negatively related to price and highly significant in Table 7.
Revenue scale efficiency is not significant in Model 1 in Table 7, while it is highly significant
and positive in Table 5. However, revenue scale efficiency is a component of revenue efficiency;
thus, overall, revenue efficiency is negatively related to price. Consistent with Table 5, the
market share variable is negative in the 2SLS results, and it is significant in the 2SLS regressions
that omit the efficiency variables (Model 3). Thus no evidence exists in favor of the relative
market power hypothesis. Also, the concentration variable is never significant in the models in
Table 7, providing no support for the SCP hypothesis. The results for cost scale efficiency in
Table 7 are mixed as they are for Table 5. In conclusion, the results with respect to the price
regressions are consistent overall across the group and company data.
19 The results suggest that unaffiliated insurers and mutual insurers have lower prices than insurers that belong to a group or stock insurers.

16
Table 8 contains regression results for companies when profit is the dependent variable.
Consistent with Table 6, revenue efficiency is negative and significant in all models in Table 8.
However, cost scale efficiency becomes significant in Model 1 in Table 8 while it was
insignificant in Table 6. But cost scale efficiency is just one component of overall cost
efficiency, and the overall results with respect to cost efficiency are the same in Tables 6 and 8.
Market share is positive and significant in Model 1 in the profit regressions in Tables 6 and 8
which supports the relative market power hypothesis, but market share is negative and significant
in the 2SLS results in Model 3. So the results in Tables 6 and 8 provide very limited support for
the relative market power hypothesis. As in Table 6, the concentration variable is never
significant in the models in Table 8, indicating there is no support for the SCP hypothesis. In
conclusion, the profit regressions results in Tables 6 and 8 are consistent; the overall results are
consistent across group and company data.
CONCLUSION
Mergers and acquisitions have accompanied the creation of an integrated economic market for
insurance in the European Union. But the resulting consolidation in the insurance markets raises
questions as to whether there are deleterious impacts on consumers from a concentrated market.
For example, the structure-conduct-performance (SCP) hypothesis suggests that collusion among
industry participants can occur when concentration in the industry increases. Similarly, the
relative market hypothesis suggests that insurers that gain a substantial share of a market may
accrue market power and use this power to affect consumers adversely. A competing theory, the
efficient structure hypothesis, posits that high concentration or market share may not be harmful
to the market if more efficient insurers dominate a market.
This research uses panel data for insurers in twelve developed European countries over the period
2003 to 2007 to determine whether the relative market power, SCP hypothesis or the efficient
structure hypothesis is consistent with the dynamics of the European property-liability insurance
market. The results strongly support that the efficient structure hypothesis. In particular, more
cost and revenue efficient insurers charge lower prices than their less efficient counterparts. No
support for the SCP hypothesis is found, and only extremely limited support for the relative
market power hypothesis exists in the results. Therefore, insurance regulators in the European
17
countries studied should not be unduly concerned with the increasing consolidation occurring in
the insurance industry.
REFERENCES
Bain, J.S., 1951, Relation of Profit-Rate to Industry Concentration: American Manufacturing, 1936-1940, Quarterly Journal of Economics, 65: 293-324.
Bajtelsmit, V.L., and R. Bouzouita, 1998, Market Structure and Performance in Private Passenger Automobile Insurance, Journal of Risk and Insurance, 65: 503-514.
Berg, S.A., and M. Kim, 1994, Oligopolistic Interdependence and the Structure of Production in Banking: An Empirical Evaluation, Journal of Money, Credit, and Banking, 26: 309-322.
Berger, A.N., 1995, The Profit-Structure Relationship in Banking -Tests of Market- Power and Efficient-Structure Hypotheses, Journal of Money, Credit, and Banking, 27: 404-431.
Berger, A.N., 2000, The Integration of the Financial Services Industry: Where Are the Efficiencies?, North American Actuarial Journal, 4(3): 25-45.
Berger, A.N., and D.B. Humphrey, 1992, Measurement and Efficiency Issues in Commercial Banking, in: Zivi Griliches, ed., Output Measurement in the Service Sector (Chicago: University of Chicago), 245-279.
Berger, A.N., and T.H. Hannan, 1993, Using Efficiency Measures to Distinguish Among Alternative Explanations of the Structure-Performance Relationship in Banking, Finance and Economics Discussion Series (FEDS) No. 93-18, Board of Governors of the Federal Reserve System.
Berger, A.N., and T.H. Hannan, 1998, The Efficiency Cost of Market Power in the Banking Industry: A Test of the “Quiet Life” and Related Hypotheses, Review of Economics and Statistics, 80: 454-465.
Bouzouita, R., and V.L. Bajtelsmit, 1997, The Impact of Rate Regulation on the Residual Market for Automobile Insurance, Journal of Insurance Regulation, 16: 61-72.
Brozen, Y., 1982, Concentration, Mergers, and Public Policy (New York: MacMillan Publishing).
Carroll, A.M., 1993, An Empirical Investigation of the Structure and Performance of the Private Workers’ Compensation Market, Journal of Risk and Insurance, 60: 185-207.
Chidambaran, N.K., T.A. Pugel, and A. Saunders, 1997, An Investigation of the Performance of the U.S. Property-Liability Insurance Industry, Journal of Risk and Insurance, 64: 371-381.
Choi, B.P., and M.A. Weiss, 2005, An Empirical Investigation of Market Structure, Efficiency, and Performance in Property-Liability Insurance, Journal of Risk and Insurance, 72: 635-673.

18
Clarke, R., and S. Davies, 1982, Market Structure and Price-Cost Margins, Economica, 49: 277-287.
Cummins, J.D., and H. Zi, 1998, Comparison of Frontier Efficiency Methods: An Application to the Life Insurance Industry, Journal of Productivity Analysis, 10: 131-152.
Cummins, J.D., and P.M. Danzon, 1997, Price, Financial Quality, and Capital Flows in Insurance Markets, Journal of Financial Intermediation, 6: 3-38.
Cummins, J.D., M.A. Weiss, and H. Zi, 1999, Organizational Form and Efficiency: The Coexistence of Stock and Mutual Property-Liability Insurers, Management Science, 45(9): 1254-1269.
Cummins, J.D., M.A. Weiss, X. Xie, and H. Zi, 2010, Economies of scope in financial services: A DEA efficiency analysis of the US insurance industry, Journal of Banking and Finance, 34: 1525–1539.
Cummins, J.D., S. Tennyson, and M.A. Weiss, 1999, Consolidation and Efficiency in the U.S. Life Insurance Industry, Journal of Banking and Finance, 23: 325-357.
Cummins, J.D., Weiss, M.A., 2000, Analyzing firm performance in the insurance industry using frontier efficiency and productivity methods, in: Georges Dionne, ed., Handbook of Insurance. Kluwer Academic, Boston.
Cummins, J.D., Weiss, M.A., 2004. Consolidation in the European Insurance Industry: Do Mergers and Acquisitions Create Value for Shareholders? Wharton Financial Institutions Center Working Paper, University of Pennsylvania.
Cummins, J.D., Xie, X., 2009, Efficiency, productivity, and scale economies in the US property-liability insurance industry, Working paper, Temple University, Philadelphia.
Davidson, R., and J.G. MacKinnon, 1993, Estimation and Inference in Econometrics (New York: Oxford University Press).
Demsetz, H., 1973, Industry Structure, Market Rivalry, and Public Policy, Journal of Law and Economics, 16: 1-9.
Demsetz, H., 1974, Two Systems of Belief About Monopoly, in: H.J. Goldschmid, H.M. Mann, and J. F. Weston, eds., Industrial Concentration: The New Learning (Boston: Little, Brown), 164-184.
Evanoff, D.D., and D.L. Fortier, 1988, Reevaluation of the Structure-Conduct-Performance Paradigm in Banking, Journal of Financial Services Research, 1: 277-294.
Fähe, R., S. Grosskopf, and C.A.K. Lovell, 1985, The Measurement of Efficiency of Production (Bosten: Kluwer-Nijhoff).
Farrell, M., 1957, The Measurement of Productive Efficiency, Journal of the Royal Statistic Society, 120: 253-281.
Gilbert, R. A., 1984, Bank Market Structure and Competition: A Survey, Journal of Money, Credit, and Banking, 16: 617-645.
Goldberg, L.G., and A. Rai, 1996, The Structure-Performance Relationship for European Banking, Journal of Banking & Finance, 20: 745-771.
19
Hogan, A.M.B., 1995, Regulation of the Single European Insurance Market, Journal of Insurance Regulation, 13(3): 329-358.
Jeng, V., G.C. Lai, and M.J. McNamara, 2007, Efficiency and Demutualization: Evidence from the U.S. Life Insurance Industry in 1980s and 1990s, Journal of Risk and Insurance, 74: 683-711.
Jung, B.D., 1987, Market Structure, Conduct, and Performance of the U. S. Property and Liability Insurance Industry: A Theoretical and Empirical Examination, Ph.D. Dissertation (University of Texas at Austin).
Lloyd-Williams, D.M., P. Molyneux, and J. Thornton, 1994, Market Structure and Performance in Spanish Banking, Journal of Banking and Finance, 18: 433-444.
Mason, E.S., 1939, Price and Production Policies of Large-Scale Enterprise, American Economic Review, 29: 61-74.
Maudos, J., 1998, Market Structure and Performance in Spanish Banking Using a Direct Measure of Efficiency, Applied Financial Economics, 8: 191-200.
Molyneux, P., and W. Forbes, 1995, Market Structure and Performance in European Banking, Applied Economics, 27: 155-159.
Mueller, H., 1995, Versicherungsbinnenmarkt, C. H. Beck, München.
Peltzman, S., 1977, The Gains and Losses From Industrial Concentration, Journal of Law and Economics, 20: 229-263.
Rhoades, S.A., 1985, Market Share as a Source of Market Power: Implications and Some Evidence, Journal of Economics and Business, 37: 343-363.
Shepherd,W.G., 1986,Onthe Core Concepts of Industrial Economics, in: H.W. de Jong, and W. G. Shepherd eds., Mainstreams in Industrial Organization (Boston: Kluwer Academic).
Smirlock, M., 1985, Evidence on the (Non) Relationship Between Concentration and Profitability in Banking, Journal of Money, Credit, and Banking, 17: 69-83.
Stigler, G. L., 1964, A Theory of Oligopoly, Journal of Political Economy, 72: 44-61.
Weiss, L.W., 1989, Why Study Concentration and Price? In: L. W. Weiss, ed., Concentration and Price (Cambridge, MA: MIT Press), 1-4.
Weiss, M.A., and B.P. Choi, 2008, State regulation and the structure, conduct, efficiency and performance of US auto insurers, Journal of Banking & Finance, 32: 134–156.
Winter, R.A., 1994, The Dynamics of Competitive Insurance Markets, Journal of Financial Intermediation, 3: 378-415.
Wooldridge, J.M., 1995, Score Diagnostics for Linear Models Estimated by Two Stage Least Squares. In: Maddala, G.S., P.C.B. Phillips, and T.N. Srinivasan (eds.), Advances in Econometrics and Quantitative Economics: Essays in Honor of Professor C. R. Rao, 66-87 (Oxford: Blackwell).
Yuengert, A., 1993, The Measurement of Efficiency in Life Insurance: Estimates of Mixed Normal-Gama Error Model, Journal of Banking and Finance, 17: 483-496.
20
Table 1. Sample Distribution - By Year and Country
Panel A: Groups
Country 2003 2004 2005 2006 2007 Total
Belgium 13 15 15 16 11 70
Denmark 26 22 27 22 22 119
Finland 10 10 9 11 10 50
France 27 32 37 31 34 161
Germany 48 51 40 46 39 224
Ireland 8 11 11 13 15 58
Italy 27 27 27 27 22 130
Netherlands 33 28 32 30 33 156
Portugal 0 10 11 10 8 39
Spain 52 50 55 51 47 255
Sweden 19 27 25 27 29 127
United Kingdom 41 41 40 44 41 207
Total 304 324 329 328 311 1,596
Panel B: Companies
Country 2003 2004 2005 2006 2007 Total
Belgium 21 25 24 24 19 113
Denmark 26 22 26 19 25 118
Finland 12 12 10 10 9 53
France 35 42 43 39 42 201
Germany 69 69 53 66 54 311
Ireland 6 6 6 6 4 28
Italy 45 51 49 47 39 231
Netherlands 42 33 43 38 39 195
Portugal 0 16 17 16 10 59
Spain 68 64 70 70 65 337
Sweden 19 27 28 30 31 135
United Kingdom 35 32 31 32 23 153
Total 378 399 400 397 360 1,934

21
Table 2. Description of variables
Expected Sign
Variable Definition Profit Price Reason
Dependent variables
Profit 1 - economic loss ratio - expense ratio Measure of profitability
Price Ratio of premiums earned to the present value of losses incurred Measure of insurance price
Independent variables
Concentration Market share of the eight largest insurance companies in a country + + To test the SCP Hypothesis
Market share Ratio of insurer’s premium written in a country to total premiums + + To test the RMP Hypothesis
Cost efficiency Cost efficiency score + - To test the ES1 hypothesis
Revenue efficiency Revenue efficiency score + ? To test the ES1 hypothesis
Cost scale-efficiency Cost scale-efficiency score + - To test the ES2 hypothesis
Revenue scale-efficiency Revenue scale-efficiency score + ? To test the ES2 hypothesis
Control variables
Market growth Growth in market premiums = (DPW)c,t – (DPW)c,t-1/(DPW)c,t-1 ? ? To control for differences across markets
Reinsurance ceded Ratio of reinsurance ceded to direct premiums written ? ? To control for supply of insurance
Reinsurance assumed Ratio of reinsurance assumed to direct premiums written ? ? To control for supply of insurance
Stock ownership dummy Dummy variable, equal to 1 if an insurer is a stock company + ? To control for risk and supply factors
Group dummy Dummy variable, equal to 1 if an insurer is a member of a group ? ? To control for risk and supply factors
Long-tail business Ratio of losses incurred to total provisions for losses ? ? To control for the extent of long-tail business conducted by the company

22
Table 3. Summary statistics for variables used in regressions, sample period: 2003-2007
Group Company
Variable Mean Standard Deviation Mean Standard Deviation
Profit Margin 0.040 0.115 0.041 0.096
Price 1.458 0.323 1.443 0.278
Concentration (Herfindahl Index) 0.263 0.181 0.268 0.183
Market Share 0.012 0.033 0.012 0.034
Cost Efficiency 0.368 0.160 0.377 0.162
Cost Scale-Efficiency 0.859 0.166 0.902 0.111
Revenue Efficiency 0.491 0.280 0.510 0.268
Revenue Scale-Efficiency 0.862 0.209 0.922 0.159
Market Growth 0.082 0.142 0.083 0.145
Reinsurance ceded proportion 0.147 0.184 0.138 0.166
Reinsurance assumed proportion 0.040 0.092 0.045 0.106
Stock ownership dummy (=1 if stock insurer) 0.744 0.437 0.812 0.391
Group dummy (=1 if group member) 0.402 0.490 0.504 0.500
Long-tail business 2.480 2.736 2.279 2.192
Size ln(total assets) 19.118 1.655 19.119 1.546
Population density 174.054 110.506 178.841 109.818
Political Risk Index 83.671 4.451 83.146 4.378
Corruption Index 7.833 1.230 7.628 1.307
Insurance density 0.088 0.028 0.084 0.025
Observation 1,596 1,934

23
Table 4. Summary statistics for efficiency variables
Group Company
Variable Mean Standard Deviation Mean Standard Deviation
Inputs (millions €)
Surplus 3,801.362 30,971.170 219.394 1,359.771
Net provision 2,610.243 11,861.050 381.699 1,122.911
Management expenses 172.620 665.789 21.770 68.507
Acquisitions expenses 273.637 1,822.051 30.432 79.834
Other expenses 13.447 121.484 0.002 0.089
Input Price
Price of surplus 0.148 0.035 0.170 0.046
Price of net provision 0.030 0.010 0.029 0.009
Price of management expenses 1.047 0.063 1.043 0.060
Price of acquisitions expenses 1.034 0.044 1.033 0.043
Price of other expenses 1.012 0.031 1.014 0.030
Output (millions €)
Losses incurred 1,155.670 5,129.958 167.670 393.434
Invested assets 6,035.622 37,632.270 604.241 2,787.187
Output Price
Price of losses incurred 0.467 0.355 0.460 0.335
Price of invested assets 0.038 0.031 0.037 0.019

24
Table 5. Group level price regression with and without controls for efficiency, 2003-2007: Estimated by two-stage least squares
Model 1 Group Data
Model 2 w/o Market Share and Concentration
Model 3 w/o Efficiency
OLS 2SLS OLS 2SLS OLS 2SLSConcentration 0.031 0.098 0.042 0.121 (0.42) (1.18) (0.47) (1.22)Market Share 0.141 -1.960 ** -0.731 *** -3.216 ***
(0.89) (-2.37) (-4.59) (-5.16)Cost Efficiency -0.824 *** -0.977 *** -0.821 *** -1.008 ***
(-14.81) (-14.69) (-14.80) (-15.84)
Scale Cost Efficiency -0.010 -0.171 ** -0.020 -0.076
(-0.18) (-2.05) (-0.39) (-1.42)
Revenue Efficiency -0.388 *** -0.394 *** -0.388 *** -0.416 ***
(-11.30) (-10.44) (-11.31) (-10.41)
Scale Revenue Efficiency 0.212 *** 0.204 *** 0.210 *** 0.296 ***
(5.27) (4.93) (5.25) (5.48)
Market Growth 0.015 0.012 0.010 0.010 0.012 0.010 (0.26) (0.22) (0.18) (0.17) (0.15) (0.13)Reinsurance ceded -0.090 ** -0.116 *** -0.091 ** -0.102 ** -0.049 -0.073 (-2.08) (-2.62) (-2.11) (-2.38) (-0.91) (-1.30)Reinsurance assumed 0.039 0.045 0.037 0.048 -0.080 -0.084 (0.59) (0.68) (0.57) (0.72) (-0.88) (-0.94)Stock dummy 0.019 0.026 0.020 0.007 0.125 *** 0.135 ***
(1.48) (1.59) (1.61) (0.49) (7.79) (7.96)Group dummy 0.029 * 0.028 0.030 * 0.026 0.059 *** 0.102 ***
(1.77) (1.63) (1.80) (1.57) (3.05) (4.59)Long-tail business 0.023 *** 0.023 *** 0.022 *** 0.023 *** 0.018 *** 0.018 ***
(6.26) (6.52) (6.25) (6.83) (3.17) (3.18)2003 -0.084 *** -0.095 *** -0.084 *** -0.096 *** -0.043 * -0.037 (-4.13) (-4.60) (-4.17) (-4.73) (-1.68) (-1.43)2004 -0.039 * -0.050 ** -0.036 * -0.048 ** -0.019 -0.015 (-1.84) (-2.30) (-1.84) (-2.46) (-0.70) (-0.54)2005 -0.004 0.001 -0.004 -0.004 -0.019 -0.015 (-0.22) (0.04) (-0.19) (-0.20) (-0.77) (-0.63)2006 -0.012 -0.015 -0.010 -0.015 0.013 0.015 (-0.57) (-0.70) (-0.50) (-0.74) (0.47) (0.54)Intercept 1.774 *** 1.969 *** 1.790 *** 1.856 *** 1.392 *** 1.349 ***
(30.92) (25.65) (34.24) (34.37) (38.01) (33.56)Hansen’s J statistic 2.827 6.000 0.993Kleibergen-Paap Wald F statistic 33.762 342.277 66.411
R-squared 0.486 0.451 0.486 0.476 0.139 0.093N 1,596 1,596 1,596 1,596 1,596 1,596
Note: Group price model is estimated by OLS and 2SLS. Market Share, Cost Efficiency and Revenue Efficiency are treated as endogenous in Model 1. Cost Efficiency, Revenue Efficiency and Scale Revenue Efficiency are treated as endogenous in Model 2. Market Share is treated as endogenous in Model 3. The instruments used for the 2SLS regression for market share and the efficiency variables are ln(total assets), political risk index, population density, and ranks for the efficiency variables. The dependent variable and the reinsurance ceded (assumed) variable are winsorized at the 5% and 95% percentile. The regressions include dummy variables capturing country dummies (not reported). Regressions are calculated with Huber-White robust standard errors to adjust for heteroscedasticity. The Hansen’s J statistic is not significant in all three 2SLS regressions. The numbers in parentheses are t-statistics. ***, **, and * denotes statistical significance at the 1, 5, and 10 percent level, respectively.
25
Table 6. Group level profitability regression with and without controls for efficiency, 2003-2007: Estimated by two-stage least squares
Model 1 Group Data
Model 2 w/o Market Share and Concentration
Model 3 w/o Efficiency
OLS 2SLS OLS 2SLS OLS 2SLSConcentration 0.011 0.010 0.015 0.015 (0.30) (0.28) (0.41) (0.41)Market Share 0.259 *** 0.241 *** 0.028 0.028 (3.22) (3.00) (0.40) (0.40)Cost Efficiency -0.024 0.046 -0.020 0.052 *
(-1.01) (1.64) (-0.81) (1.83)
Scale Cost Efficiency 0.003 -0.015 -0.015 -0.032
(0.12) (-0.60) (-0.65) (-1.34)
Revenue Efficiency -0.125 *** -0.162 *** -0.125 *** -0.162 ***
(-8.29) (-9.75) (-8.29) (-9.76)
Scale Revenue Efficiency 0.092 *** 0.110 *** 0.088 *** 0.106 ***
(5.13) (5.99) (4.94) (5.83)
Market Growth 0.003 0.001 0.000 -0.002 0.005 0.005 (0.14) (0.05) (0.01) (-0.07) (0.20) (0.20)Reinsurance ceded -0.059 *** -0.056 *** -0.061 *** -0.058 *** -0.055 *** -0.055 ***
(-2.89) (-2.78) (-3.00) (-2.88) (-2.61) (-2.62)Reinsurance assumed 0.101 *** 0.094 *** 0.099 *** 0.092 *** 0.095 *** 0.095 ***
(3.30) (3.09) (3.24) (3.02) (2.87) (2.89)Stock dummy -0.011 -0.010 -0.009 -0.007 0.008 0.008 (-1.64) (-1.48) (-1.29) (-1.14) (1.14) (1.15)Group dummy 0.016 ** 0.016 ** 0.016 ** 0.017 ** 0.011 0.011 (2.04) (2.11) (2.12) (2.18) (1.46) (1.47)Long-tail business -0.002 -0.003 -0.002 -0.003 -0.002 -0.002 (-1.15) (-1.56) (-1.19) (-1.60) (-0.84) (-0.85)2003 0.004 0.006 0.004 0.006 0.006 0.006 (0.46) (0.70) (0.47) (0.72) (0.64) (0.65)2004 0.017 * 0.023 ** 0.019 ** 0.024 *** 0.010 0.010 (1.78) (2.42) (2.11) (2.79) (1.03) (1.04)2005 0.020 ** 0.022 ** 0.021 ** 0.023 *** 0.015 * 0.015 *
(2.27) (2.53) (2.35) (2.60) (1.69) (1.71)2006 0.020 ** 0.024 ** 0.021 ** 0.025 *** 0.019 * 0.019 *
(2.16) (2.55) (2.37) (2.77) (1.93) (1.94)Intercept 0.006 -0.001 0.025 0.016 0.011 0.011 (0.21) (-0.05) (1.01) (0.63) (0.72) (0.72)Hansen’s J statistic 1.945 0.574
Kleibergen-Paap Wald F statistic 865.728 1,237.286
R-squared 0.157 0.151 0.154 0.147 0.072 0.072N 1,596 1,596 1,596 1,596 1,596 1,596
Note: Group profitability model is estimated by OLS and 2SLS. Cost Efficiency and Revenue Efficiency are treated as endogenous in Model 1. Cost Efficiency and Revenue Efficiency are treated as endogenous in Model 2. Based on the augmented Durbin-Wu-Hausman test market share and concentration are not endogenous in Model 3. The instruments used for the 2SLS regression for the efficiency variables are ln(total assets), and ranks for the efficiency variables. The dependent variable and the reinsurance ceded (assumed) variable are winsorized at the 5% and 95% percentile. The regressions include dummy variables capturing country dummies (not reported). Regressions are calculated with Huber-White robust standard errors to adjust for heteroscedasticity. The Hansen’s J statistic is not significant for all two 2SLS regressions. The numbers in parentheses are t-statistics. ***, **, and * denotes statistical significance at the 1, 5, and 10 percent level, respectively.

26
Table 7. Company level price regression with and without controls for efficiency, 2003-2007: Estimated by two-stage least squares
Model 1 Company Data
Model 2 w/o Market Share and Concentration
Model 3 w/o Efficiency
OLS 2SLS OLS 2SLS OLS 2SLSConcentration -0.079 -0.063 -0.052 0.045 (-1.35) (-1.03) (-0.74) (0.53)Market Share 0.425 *** -0.175 -0.626 *** -3.060 ***
(3.37) (-0.32) (-4.31) (-5.89)Cost Efficiency -0.771 *** -1.034 *** -0.769 *** -1.028 ***
(-14.86) (-19.25) (-14.91) (-19.00)
Scale Cost Efficiency 0.115 ** 0.112 0.072 0.117 **
(2.17) (1.34) (1.52) (2.11)
Revenue Efficiency -0.356 *** -0.291 *** -0.351 *** -0.302 ***
(-12.23) (-8.87) (-12.14) (-9.37)
Scale Revenue Efficiency 0.044 0.036 0.046* 0.084 **
(1.59) (1.29) (1.65) (2.11)
Market Growth 0.029 0.026 0.040 0.039 0.031 0.029 (0.69) (0.64) (0.99) (0.99) (0.48) (0.46)Reinsurance ceded -0.127 *** -0.148 *** -0.130 *** -0.146 *** -0.018 -0.052 (-3.84) (-4.44) (-3.94) (-4.44) (-0.40) (-1.10)Reinsurance assumed 0.136 *** 0.133 *** 0.131 *** 0.134 *** 0.076 0.058 (3.25) (3.25) (3.12) (3.25) (1.13) (0.86)Stock dummy 0.023 ** 0.019 0.027 ** 0.017 0.103 *** 0.124 ***
(1.96) (1.45) (2.39) (1.38) (6.66) (7.22)Group dummy 0.014 0.019 * 0.018 * 0.017 * 0.027 * 0.059 ***
(1.36) (1.75) (1.75) (1.75) (1.87) (3.76)Long-tail business 0.021 *** 0.025 *** 0.021 *** 0.025 *** 0.011 ** 0.012 **
(5.71) (6.57) (5.60) (6.48) (1.99) (2.08)2003 -0.083 *** -0.090 *** -0.083 *** -0.087 *** -0.070 *** -0.068 ***
(-5.68) (-5.91) (-5.71) (-5.87) (-3.58) (-3.41)2004 -0.021 -0.033 ** -0.024 * -0.036 ** -0.030 -0.030 (-1.45) (-2.29) (-1.66) (-2.50) (-1.55) (-1.48)2005 0.001 -0.001 0.001 -0.005 -0.030 -0.031 (0.06) (-0.10) (0.04) (-0.37) (-1.56) (-1.58)2006 -0.030 ** -0.042 *** -0.031 ** -0.043 *** -0.003 -0.003 (-2.07) (-2.87) (-2.09) (-2.98) (-0.17) (-0.13)Intercept 1.800 *** 1.869 *** 1.819 *** 1.817 *** 1.420 *** 1.382 ***
(32.71) (26.86) (36.59) (31.69) (41.77) (37.12)Hansen’s J statistic 4.367 0.141 3.133Kleibergen-Paap Wald F statistic 33.385 332.853 39.295
R-squared 0.549 0.532 0.547 0.533 0.108 0.047N 1,934 1,934 1,934 1,934 1,934 1,934
Note: Company price model is estimated by OLS and 2SLS. Market Share, Cost Efficiency, Scale Cost Efficiency and Revenue Efficiency are treated as endogenous in Model 1. All efficiency variables are treated as endogenous in Model 2. Market Share is treated as endogenous in Model 3. The instruments used for the 2SLS regression for market share and the efficiency variables are ln(total assets), political risk index, population density, corruption index, insurance density, and ranks for the efficiency variables. The dependent variable and the reinsurance ceded (assumed) variable are winsorized at the 5% and 95% percentile. The regressions include dummy variables capturing country dummies (not reported). Regressions are calculated with Huber-White robust standard errors to adjust for heteroscedasticity. The Hansen’s J statistic is not significant in all three 2SLS regressions. The numbers in parentheses are t-statistics. ***, **, and * denotes statistical significance at the 1, 5, and 10 percent level, respectively.

27
Table 8. Company level profitability regression with and without controls for efficiency, 2003-2007: Estimated by two-stage least squares
Model 1 Company Data
Model 2 w/o Market Share and Concentration
Model 3 w/o Efficiency
OLS 2SLS OLS 2SLS OLS 2SLSConcentration -0.014 -0.013 -0.014 0.001 (-0.55) (-0.50) (-0.51) (0.02)Market Share 0.283 *** 0.288 *** 0.026 -0.327 **
(4.43) (4.47) (0.48) (-2.03)Cost Efficiency -0.014 0.034 -0.014 0.034
(-0.78) (1.62) (-0.76) (1.62)
Scale Cost Efficiency 0.064 *** 0.043 * 0.034 0.021
(2.72) (1.81) (1.59) (0.98)
Revenue Efficiency -0.102 *** -0.131 *** -0.099 *** -0.125 ***
(-8.94) (-10.17) (-8.68) (-9.98)
Scale Revenue Efficiency -0.010 0.017 -0.010 -0.003
(-0.84) (0.94) (-0.78) (-0.23)
Market Growth 0.012 0.013 0.013 0.013 0.012 0.011 (0.70) (0.73) (0.76) (0.77) (0.59) (0.58)Reinsurance ceded -0.049 *** -0.047 *** -0.050 *** -0.049 *** -0.032 ** -0.037 **
(-3.26) (-3.16) (-3.37) (-3.32) (-2.03) (-2.31)Reinsurance assumed 0.073 *** 0.073 *** 0.070 *** 0.070 *** 0.060 *** 0.058 ***
(4.18) (4.18) (3.96) (4.00) (3.13) (2.99)Stock dummy -0.016 *** -0.016 *** -0.013 ** -0.013 ** -0.004 -0.001 (-2.60) (-2.60) (-2.14) (-2.08) (-0.66) (-0.17)Group dummy 0.006 0.006 0.009 * 0.009 ** 0.007 0.012 **
(1.35) (1.35) (1.95) (1.97) (1.45) (2.21)Long-tail business -0.002 -0.003 ** -0.002 -0.003 ** -0.002 -0.002 (-1.36) (-2.17) (-1.44) (-2.14) (-1.27) (-1.17)2003 -0.018 *** -0.017 ** -0.019 *** -0.018 *** -0.020 *** -0.020 ***
(-2.66) (-2.50) (-2.80) (-2.67) (-2.93) (-2.90)2004 0.007 0.009 0.006 0.009 -0.003 -0.003 (0.98) (1.38) (0.86) (1.35) (-0.42) (-0.41)2005 0.009 0.009 0.010 0.011 * 0.001 0.001 (1.41) (1.42) (1.43) (1.66) (0.20) (0.17)2006 0.012 * 0.013 ** 0.012 * 0.014 ** 0.010 0.010 (1.72) (1.98) (1.71) (2.05) (1.44) (1.45)Intercept 0.059 ** 0.050 ** 0.079 *** 0.080 *** 0.041 *** 0.035 ***
(2.52) (2.04) (3.61) (3.66) (3.32) (2.79)Hansen’s J statistic 0.041 1.145 7.836Kleibergen-Paap Wald F statistic 402.971 1,318.801 32.851
R-squared 0.174 0.169 0.169 0.165 0.088 0.077N 1,934 1,934 1,934 1,934 1,934 1,934
Note: Company profitability model is estimated by OLS and 2SLS. Cost Efficiency, Revenue Efficiency and Scale Revenue Efficiency are treated as endogenous in Model 1. Cost Efficiency and Revenue Efficiency are treated as endogenous in Model 2. Market Share is treated as endogenous in Model 3. The instruments used for the 2SLS regression for market share and the efficiency variables are ln(total assets), squared market growth, political risk index, population density, corruption index, insurance density, and ranks for the efficiency variables. The dependent variable and the reinsurance ceded (assumed) variable are winsorized at the 5% and 95% percentile. The regressions include dummy variables capturing country dummies (not reported). Regressions are calculated with Huber-White robust standard errors to adjust for heteroscedasticity. The Hansen’s J statistic is not significant in all three 2SLS regressions. The numbers in parentheses are t-statistics. ***, **, and * denotes statistical significance at the 1, 5, and 10 percent level, respectively.