Embed Size (px)
Citation preview

Market Structure and Exchange Rate Pass-Through∗
Raphael A. Auer and Raphael S. Schoenle†
Swiss National Bank and Brandeis University
September 29, 2013
Abstract
In this paper, we study the effect of market structure on price-setting through the lens ofexchange rate pass-through. We first document that two predictions of the heterogeneous firmversion of the Dornbusch (1987) pricing model are confirmed in micro data on US importprices: while the rate at which a firm reacts to changes in its own cost is U-shaped in mar-ket share, the rate at which it reacts to competitors’ prices is hump-shaped in market share.Second, using this theory as a guidance, we present an expression for price changes in indus-try equilibrium that can be broken down into a component due to the direct cost response atthe firm level, and another one due to price complementarities faced by the firm at the indus-try level. We show empirically that taking into account a sector’s market structure and theinterplay of heterogeneity in reaction to own cost and reaction to the competition can substan-tially improve our understanding of the variation in pass-through rates across sectors and tradepartners. The direct cost pass-through channel and the indirect price complementarity channelplay approximately equally important roles in determining pass-through but partly offset eachother. Omission of either channel in an empirical analysis results in a failure to explain howmarket structure affects price-setting in industry equilibrium.
JEL Classification: E3, E31, F41Keywords: Exchange Rate Pass-Through, U.S. Import Prices, Market Structure, Price Com-
plementarities.
∗This research was conducted with restricted access to the Bureau of Labor Statistics (BLS) data. The views expressedhere are those of the authors and do not necessarily reflect the views of the BLS or the Swiss National Bank. Wethank project coordinators Kristen Reed and Rozi Ulics for their substantial help and effort and Rawley Heimer andMiao Ouyang for excellent research assistance. We also thank Gita Gopinath, Oleg Itskhoki, Anthony Landry, andRomain Ranciere, as well as participants at the Milton Friedman Institute Conference on Pricing at the University ofChicago, the University of Geneva, the University of Berne, the University of Munich, the Microeconomic Aspects ofthe Globalization of Inflation Conference at the Swiss National Bank, the 2011 Midwest Macro Meetings at VanderbiltUniversity, the 2011 European Economic Association Meetings at the University of Oslo, the 2012 meetings of theAustrian Economic Association at the Technical University of Vienna, the 2012 meetings of the Society for EconomicDynamics in Limmasol, the 2012 CEPR Summer Symposium in International Macroeconomics in Tarragona, the 2012NBER Summer International Finance and Macroeconomics workshop and in particular an anonymous referee at theSNB Working Paper series for helpful comments and suggestions.
†Contact: Raphael Auer, Swiss National Bank, Borsenstr. 15 P.O. Box Ch-8022 Zurich Switzerland. Phone: +41 44631 38 84, e-mail: [email protected]. Raphael Schoenle, Mail Stop 021, Brandeis University, P.O. Box 9110, 415 SouthStreet, Waltham, MA 02454. Phone: +1-617-680-0114, email: [email protected].

1 Introduction
Studying firms’ pricing-to-market decisions is one of the important research topics in internationalmacroeconomics because it relates to the movement of international relative prices, the adjustmentof global imbalances, and business cycle co-movements. Moreover, this line of research can alsoinform us about the nature of price-setting, which features prominently in most macro-economicmodels.
The recent empirical literature estimating exchange rate pass-through (ERPT) at the good levelhas yielded important insights into firms’ pricing behavior following exchange rate shocks.1 Acommon finding in the literature is that pass-through of cost shocks into prices is incompleteeven in the long run. One leading explanation for such incomplete pass-through is that firmsadjust their markups to accommodate the local market environment, a channel first pointed outin Krugman (1986), Helpman and Krugman (1987), and Dornbusch (1987) and more recently forthe case of heterogeneous firms in Melitz and Ottaviano (2008), Atkeson and Burstein (2008), Chenet al. (2009), Berman et al. (2012), and Amiti et al. (2012).2 Atkeson and Burstein (2008) in particularhave emphasized that modeling within-sector firm heterogeneity in pricing behavior is essentialin order to generate realistic aggregate pricing behavior.
In this paper, we show that in order to explain aggregate price responses, it is not enoughto only take into account heterogeneity in the response of firms to cost shocks, documented forexample in Berman et al. (2012). In fact, there is a hitherto undocumented type of firm-levelheterogeneity: We show that exactly the firms that react the most to changes in their own cost arealso the ones that react the least to changing competitor prices. Due to this pattern, the interactionof these two dimensions of heterogeneity has important implications for how “market structure”– as measured by the distribution of the size and origin of firms – affects a sector’s exchange ratepass-through and pricing behavior in industry equilibrium. If we ignore this interaction and focus
1While some of these studies focus on structural analysis of exchange rate pass-through in single industries (seeKnetter (1989) and Knetter (1992) and the analysis of pricing-to-market practices in Feenstra et al. (1996), Verboven(1996), Goldberg and Verboven (2001, 2005) for the car industry, Hellerstein (2008) for the beer industry, and Nakamuraand Zerom (2010) for the case of the coffee industry), our approach is more closely related to the reduced-form analysisof pass-through rates in datasets spanning many industries (see Gopinath and Rigobon (2008), Gopinath and Itskhoki(2010), Gopinath et al. (2010), and Nakamura and Steinsson (2008)). It is also related to the work of Fitzgerald and Haller(2010), who use plant-level prices of identical goods sold on different markets to study pricing-to-market decisions.
2Firm heterogeneity is only one of many dimensions along which pass-through rates differ. When evaluating pricesat the dock (that is, net of distribution costs), other important dimensions include the currency choice of invoicing as inGopinath et al. (2010), Goldberg and Tille (2009), Bacchetta and van Wincoop (2005), inter- versus intra-firm trade as inNeiman (2010), sectoral import composition as in Campa and Goldberg (2005); Goldberg and Campa (2010), and input-use intensity. When evaluating retail prices, the share of the distribution costs may matter for pass-through as found byBacchetta and van Wincoop (2003) and Burstein et al. (2003), while the movement of margins seems to play only a minorrole as shown in Goldberg and Hellerstein (2012). Generally, also the size and origin of the exchange rate movementmatter for pass-through (see Michael et al. (1997) and Burstein et al. (2005, 2007)) as does the general equilibriuminteraction between exchange rate volatility, invoicing currency choice, and pass-through rates (see Devereux et al.(2004)).
2

only on the heterogeneity in cost pass-through, we do not properly account for price changes andpass-through.
To arrive at our result, we first establish that firms’ pricing responses are heterogeneous alongtwo dimensions. Using U.S. firm-level micro data, we document that while the rate at whicha firm reacts to changes in its own cost is U-shaped in market share, the rate at which it reactsto competitors’ prices is hump-shaped in market share. These results expand on the work ofBerman et al. (2012) and Amiti et al. (2012), who uncover a monotonic relationship between marketshare and exchange rate or respectively, cost pass-through. Based on their findings and those ofGopinath and Itskhoki (2011), we document that market share also affects the rate at which firmsreact to changing competitor prices, and we show that exactly the firms that react the most tochanges in their own cost react the least to changing competitor prices.
Second, we show that the interaction of these two dimensions of firm heterogeneity is impor-tant for our understanding of how market structure affects industry equilibrium pricing behavior.Using the model of Atkeson and Burstein (2008) that is based on the preferences of Dornbusch(1987) to guide our further empirical analysis, we present an expression for the industry equilib-rium rate of exchange rate pass-through that can be broken down into a component due to thedirect cost response at the firm level, and another one due to price complementarities faced by thefirm at the industry level. We show empirically that taking into account a sector’s market struc-ture and the interplay of heterogeneity in reaction to own cost and reaction to the competition cansubstantially improve our understanding of the variation in pass-through rates across sectors andtrade partners. The direct cost pass-through component and the indirect price complementaritycomponent play approximately equally important roles in determining pass-through but partlyoffset each other. Omission of either component in an empirical analysis results in a failure toexplain how market structure affects price-setting in industry equilibrium.
The mechanisms of the model that underlie our empirical results can easily be understoodfrom the point of view of competition: first, the direct cost response of the firm to exchange ratemovements depends on its own market share. Therefore, the average direct price response ofall firms affected by a given exchange rate shock depends on the distribution of their marketshares. Second, price complementarities matter because price changes of firms from a specifictrade partner affect the industry’s general price level and the pricing decisions of all firms in theindustry. The impact on the general price level is proportional to the combined market shareof firms from that trade partner and the correlation structure of exchange rates. However, ourexpressions show that there is further amplification since all other firms in the industry react to thechanging general price level, multiplying the initial impact. In this sense, pass-through is affectedby the sector’s entire market structure even if only few firms are affected by a given exchange ratemovement.
How do we test these predictions of the model? First, we note that one key ingredient to be
3

able to do so is the availability of market share data at the firm level. One innovation of our paperlies in how we obtain these data, even though the micro data only contain prices. To this purpose,we combine ten-digit market share information from trade data, micro price data and structuralequations from our model.
We then use these market share data and data on exchange rate movements in two ways to testthe predictions of the heterogeneous firm version of the pricing model of Dornbusch (1987) devel-oped by Atkeson and Burstein (2008). First, we verify the two firm-specific predictions, namelythat import prices exhibit a hump-shaped reaction to competitor prices in market share while theresponse to an exchange rate is U-shaped in market share. We corroborate these two stylized factsfurther using various ways of estimating pass-through and also accounting for imported inputuse as in Amiti et al. (2012). Second, we fully utilize the information contained in the distributionof market shares to gauge the importance of the two channels – direct cost responses and pricecomplementarities – and to validate additional model predictions.
To gauge the importance of the two channels, we construct overall predicted price changesas well as their two components that are due to the two channels: We first take exchange ratemovements to identify cost shocks in our model-implied expression for firms’ equilibrium priceresponses. Together with the distribution of firms’ market shares and origins, this allows us toconstruct overall predicted price changes for all firms. At the same time, as implied by the model,we can construct one component of these predicted price changes as coming from price comple-mentarities, another from a firm’s direct cost response. When we regress observed price changeson these two components, we find that not only are both statistically significantly related to pricechanges but also have the same economic importance. Next, we also show that the actual andoverall predicted price changes are related to each other. Regressions deliver highly significantcoefficients.
We find that the heterogeneous firm version of Dornbusch (1987) is also able to deliver highpredictive power for ERPT at the aggregate level. To demonstrate this, we estimate sector andtrade partner specific pass-through rates, and compare them to our theoretical benchmark and itstwo components. First, we find that estimated and predicted pass-through rates are significantlyrelated, like for our result on price changes: a regression of estimated on predicted pass-throughrates gives us a statistically highly significant coefficient of 0.73 for sector-country pairs, and 0.82at the country level. Second, we find that both direct cost responses as well as price complementar-ities are equally important for understanding pass-through. Again, this finding mimics the resulton observed and predicted price changes discussed above. Overall, we find that the calibratedmodel can explain approximately 29% of the variation in pass-through rates across countries.
We emphasize that underlying this overall good fit of the theory, the direct cost pass-throughchannel and the indirect price complementarity channel play approximately equally importantroles but partly offset each other. We demonstrate that if we include only one of these channels in
4

an empirical analysis, this results in a failure to explain variation in the aggregate equilibrium rateof pass-through. This finding sheds some light on why Gopinath and Itskhoki (2010) find sectoral”market structure”, as measured by a Herfindahl index, to have no impact on estimated rates ofERPT. Their empirical exercise is motivated by firm-specific findings relating firm size to the rate ofERPT, such as in Berman et al. (2012), who predict a correlation between sectoral concentration andthe average rate of ERPT. In this paper, we document that the effect of market structure on ERPTis not adequately captured by such measures of sectoral concentration: sectors that are dominatedby firms that react strongly to changes in their own cost also tend to be characterized by a lowdegree of price complementarities. Documenting these two forces separately in microeconomicdata and showing how they interact in industry equilibrium constitutes the main contribution ofour paper.
The balance of this paper is the following. We first briefly outline a model to guide our analysisin Section 2. Section 3 describes how we construct market shares and establishes our two stylizedfacts at the firm level. Section 4 examines pass-through in the industry equilibrium. Section 5concludes.
2 Market Structure and Pass-Through: Theory
To guide our empirical analysis, we review the firm-specific pricing-to-market predictions derivedfrom the variable markup model of Dornbusch (1987). This model is based on Dixit and Stiglitz(1977), but focuses on the case in which firms are large compared to their industry. This differen-tiation is important because large firms can influence a sector’s overall price level and thus facea less elastic demand than small firms. In this preference setup, a firm’s market share and itsmarkup depend on its own cost of production and on the prices of competing goods. As a result,it holds that pass-through is generally less than one and also, that prices react to each other.
We focus on the Dornbusch (1987) model instead of alternative theoretical foundations forpricing-to-market decisions since in our data many sectors are dominated by one or a few bigfirms that coexist with a large number of smaller firms. This feature of heterogeneous firm sizemakes the class of models based on Dornbusch (1987) – in particular its heterogeneous firm ver-sion in Atkeson and Burstein (2008) – the natural modeling strategy to analyze our data. We notethat many other previous studies have used this setup to analyze pricing-to-market decisions, forexample Feenstra et al. (1996) or Yang (1997).3
3Many alternative pricing-to-market theories exist that derive variable markups for example by adopting a prefer-ence framework that intrinsically allows for variable markups (see Kimball (1995), Melitz and Ottaviano (2008), Berginand Feenstra (2001), Simonovska (2010), Gust et al. (2010), and Auer et al. (2012)), by modeling costly consumer searchand inventories (see Alessandria (2009) and Alessandria and Kaboski (2011)), or by customer accumulation (see Krug-man (1986) and Drozd and Nosal (2012)).
5

2.1 The Dornbusch (1987) Model
Preferences are given by a two-tiered “love of variety” utility/production function in which con-sumers consume the output of sectors k, and the output of each sector is produced by combiningvarieties i within each sector. As in Dixit and Stiglitz (1977), consumers have constant-elasticitydemand for each sector’s total output. Final consumption c is produced by competitive firms
aggregating input goods into c =(∫ 1
0 y(η−1)/ηk dk
)η/(η−1).
In each sector k, each input is produced by a set of i ∈ Nk monopolists, while the sector it-self is competitive and produces using only inputs with a production function given by yk =(
∑Nki=1 q(ρ−1)/ρ
i,k
)ρ/(ρ−1). Cost minimization implies a price of the sector-composite of Pi,k =
(∑Nk
i=1 p(1−ρ)i,k
)1/(1−ρ)
and demand for each individual input i of qi,k = yk (Pi,k /Pk )−ρ where yk = (Pk /P )−η c is equal
to the total consumption of the sector’s output. P is the unit price of the final output and equal to(∫ 10 P(1−η)
k dk)1/(1−η)
. A key assumption in this preference framework is that ρ > η > 1, that is, ifwe think of two sectors “trousers” and “shoes” and two shoe varieties “Reebok” and “Nike,” theassumption is that it is easier to substitute away from Reebok to Nike than it is to substitute fromshoes to trousers. The assumption that η > 1 ensures that markups are finite also for monopolistswithin a sector.
2.2 Price Setting and Cost Pass-Through
Since firms are non-negligible in size within a sector, each firm has an impact on Pk, the aggregateprice index of the sector, which it takes into account when setting its price. Each producer of avariety faces a constant marginal cost wi, which may include iceberg transportation costs. Giventhe two-tiered utility/production setup and the fact that the production elasticity ρ differs fromthe demand elasticity over sector composites η, the first order condition of a firm with a non-negligible market share in sector k implies a pricing rule of that is dependent on the firm’s marketshare si,k:
p∗i,k =ε (si,k)
ε (si,k)− 1wi,k, (1)
where ε (si,k) =(
1ρ (1− si,k) +
1η si,k
)−1if firms compete in quantities and ε (si,k) = (ρ (1− si,k) + ηsi,k)
if they compete in prices. Since ρ > η, a firm’s perceived demand elasticity decreases in its marketshare. Consequently, the equilibrium markup increases in a firm’s market share.
Within this framework, Atkeson and Burstein (2008) show that a log-linearization around thesteady state results in a straight-forward calibration of how cost changes translate into priceschanges depending on a firm’s market share. Denoting deviations in logs from the steady state by, this log-linearization relates a firm’s price change to changes in its marginal cost of production
6

and to changes in its market share:
pi,k = Γ (si,k) si,k + wi,k (2)
where wi,k is the percentage cost change of firm i and Γ (si,k) measures the log-linearized respon-siveness of the markup to the market share, a concept closely related to the “super elasticity” ofdemand in Klenow and Willis (2007) and Gopinath et al. (2010).
We note that the markup sensitivity is strictly increasing in a firm’s market share. If firmscompete in quantities, Γ (sn,k) is equal to (1/η−1/ρ)sn,k
1−(1−sn,k)/ρ−sn,k/η. If firms compete in prices it is equal to
(ρ−η)sn,kρ(1−sn,k)+ηsn,k
. Given this monotonicity, how can the reaction to own costs be non-monotonic? The
answer lies in the effect that firm i has on the overall price index Pk. It holds that
si,k = (ρ− 1)(
Pk − pi,k
)= (ρ− 1) (1− si,k)
(Pk,−i − pi,k
),
where Pk,−i is the weighted price change index of all competitors.4 A firm’s market share can thuschange either because its own price changes, or because the prices of competitors change. Anychange in relative prices is mitigated by a factor si,k, the fraction of the overall price index thatfirm i accounts for in sector k.
With these two forces in mind, we next describe how the firm-specific rate of cost pass-throughand the rate of reaction to competitor prices depend on a firm’s market share. Corresponding toour empirical analysis below, we focus on the conditional rate of cost pass-through and the rate ofreaction to the competition.
Proposition 1 Let CPTi denote the elasticity of firm i’s price with respect to its own cost for given com-petitor prices and RCPi denote the elasticity of firm i’s price to the price index of its competitors for a givenown cost. It holds that pi,k = RCPi Pk,−i + CPTiwi,k. If η > 1, CPTi and RCPi take values in the interval0 to 1. It holds that 1) CPTi is U-shaped in market share, that is, it is monotonically decreasing up toan inflexion point and thereafter monotonically increasing; 2) RCPi is hump-shaped in market shares, thatis, it is monotonically increasing up to an inflexion point and thereafter decreasing in firm market share.The inflexion point is the same for RCPi and CPTi. If firms compete in quantities, the inflexion point is
1−√(1− 1/η)
/(1− 1/ρ) . If firms compete in prices, the inflexion point is 1−
√η/
ρ .
As the proposition shows, a firm’s rate of cost pass-through is hump-shaped in its market shareconditional on competitor prices.5 This hump-shaped relation derives directly from price changesof large firms affecting the sector’s price index. If the market share approaches one, pass-through
4Pk = ∑jεNksj pi,k and Pk,−i = ∑jεNk ,−i sj pi,k
5We note that Proposition 1 is not new to the literature (see, for example, the description in Burstein and Gopinath(2013)).
7

is nearly complete as the firm dominates the sectoral price index. It holds that
CPTi ≡∂p∗i,k∂ωi,k
ωi,k
p∗i,k
∣∣∣∣∣Pk,−i=0
= (1 + Γ (si,k) (ρ− 1) (1− si,k))−1 and
RCPi ≡∂p∗i,k
∂Pk,−i
Pk,−i
p∗i,k
∣∣∣∣∣wi,k=0
= Γ (si,k) (ρ− 1) (1− si,k) ∗ CPTi
For the purpose of our empirical analysis, it is relevant that the inflexion point under Cournotcompetition is always smaller than under Bertrand competition and that the latter is close to onefor realistic parameters.
The class of Dornbusch (1987) variable markup models also allows for a different compara-tive static in which monotonic relations between market share and the rate of cost pass-throughemerge:
Corollary 1 Conditional on the sector’s overall price index, the rate of cost pass-through is monotonicallydecreasing in market share. That is, pi,k = γi,kPk + αi,kwi,k where αi,k = (1 + Γ (si,k) (ρ− 1))−1 andγi,k = Γ (si,k) (ρ− 1) αi,k = 1− αi,k.
We do not empirically test Corollary 1 below because the sectoral price index Pk is constructedincluding pi,k, that is, such a regression could be argued to be spurious.6 However, the corollarystill proves convenient when solving for the industry-wide equilibrium pass-through rate, whichwe do next.
2.3 Equilibrium Pass-Through
In industry equilibrium, all prices react to own cost changes and also react to other prices. Itfollows from the log-linearized recursive pricing equation in Corollary 1 that firm i’s price changeis a function of all cost changes in the sector and equal to
pi,k = γi,k∑jεNk,−TP
sjαjwj,k
∑jεNksjαj
+
(γi,ksi
∑jεNksjαj
+ 1
)αi,kwi,k, (3)
where γi,k, the rate at which a firm’s price is reacting to cost shocks of all other firms is monotoni-cally increasing in its market share.
(γi,ksi
∑jεNksjαj
+ 1)
αi,k, the rate at which it reacts to its own cost, isequal to 1 if the market share is either 0 or 1. For interior market shares, it is smaller than one.
With our empirical strategy in mind, we are not only interested in such firm-specific predic-tions of the theory, but also in the implications for the average rate of exchange rate pass-through.
6Amiti et al. (2012) develop an empirically meaningful monotonic comparative static by normalizing price changesby the changes of the price index of all goods originating from the same trade partner.
8
To build up to our second main testable expression in Proposition 2, we therefore first examinepass-through in a special case in which the two heterogeneities at the level of the firm cancel outexactly. Then, the rate of pass-through in industry equilibrium is unaffected by market structure:for a given sectoral price index, large firms react only little to changes in own cost but they reactstrongly to the sectoral price index for given own cost. The interplay of these two forces can beseen most clearly in the example of random cost shock.
Lemma 1 In industry equilibrium, the weighted average price change Pk is equal to ∑jεNksjαjwj,k
/∑jεNk
sjαj .A cost shock of mean w that is uncorrelated with market shares (wi,k = w + εi,k ; εi,k ⊥ si,k) is fully passedthrough irrespective of the market share of firm i, the number of competitors, and the distribution of theirmarket shares.
Lemma 1 states a strong result: Market structure – as measured by the distribution of firmmarket shares – may have no effect on the equilibrium rate of pass-through. This may appearcounter-intuitive: based on the empirical findings of Berman et al. (2012) or Amiti et al. (2012)that the firm-specific rate of cost pass-through is strictly decreasing in the firm’s market share,one might expect the industry equilibrium rate of cost pass-through to be a decreasing function ofsectoral concentration. However, this specific example demonstrates that the direct cost responseand price complementarities can even exactly offset each other. The underlying intuition is thatif a cost shock affects all firms in exactly the same proportion, it does not affect the market shareof any firm. Consequently, there is no markup response, and the cost shock is passed throughfully by all firms. The same holds true if the shock is noisy, but the noise is uncorrelated withfirm-specific market shares.
To understand more generally how market structure does affect the average rate of pass-through in industry equilibrium, one needs to take into account the interaction of firm-specificheterogeneity in both cost pass-through and reaction to competition and the fact that exchangerates only affect the cost of production of a certain subset of firms. We properly isolate the costelement of exchange rate changes by following Amiti et al. (2012) and taking into account that ex-change rate changes are cost changes at a rate of less than one because not all costs are paid in thelocal currency of the exporter. Denoting by ei,TP the percentage change of the bilateral exchangerate of country TP that firm i originates from and by θl
i the rate at which a bilateral exchange ratechange affects the cost of firm i
(wi,k = θl
i ei,TP + εi,t), we can define the equilibrium rate of cost
pass-through:
Definition 1 Equilibrium pass-through rate of exchange rate-induced cost shocks. ECPTi,k denotes thefirm i’s industry equilibrium rate of pass-through of exchange rate induced cost shocks, equal to the un-conditional elasticity of firm i’s price with respect to the exchange rate-induced cost shock: θl
i ei,TP, that is,
ECPTi,k ≡∂pi,k
∂(θli ei,TP)
θli ei,TPpi,k
.
9

We focus on the equilibrium rate of cost pass-through rather than on the rate of equilibriumexchange rate pass-through because we want to highlight the effect of variable markups whileabstracting as much as possible from the importance of imported intermediate inputs, a channelthat has been analyzed elsewhere. At the same time, the pass-through rates are related: the equi-librium exchange rate pass-through rate ( ∂pi,k
∂ei,TP
ei,TPpi,k
) is equal to ECPTi,k times θli , the local cost share.
In the context of our model, the firm-specific equilibrium pass-through rate is equal to
ECPTi,k ≡pi,k
θli ei,TP
= γi
∑jεNksjαjθ
lj
ej,TP
θli ei,TP
∑jεNksjαj
+ θli αi + εi,t (4)
With our empirical section in mind, we are not only interested in the firm-specific rate of exchangerate pass-through, but in the sector- and firm specific average rate of pass-through. Aggregationof (4) across all the firms originating from TP implies the following.7
Proposition 2 Let ECPTTP,k denote the market share-weighted average of ERPTi,k in the set of all firmsthat originate from TP in sector k (iεNk,TP). It holds that
ECPTTP,k ≡∑jεNTP,k
sjECPTi,k
∑jεNTP,ksj
= γTP
(∑cεC
mc,kec
eTP
)+ αTP + εTP, (5)
where γTP, αTP and εTP correspond to the market share-weighted averages of(θl
i)−1
γi, αi, and εi,t in theset of firms from TP and in industry k and mc,k is the elasticity of the price index in sector k with respect tothe exchange rate of country c.
Proposition 2 shows how the industry equilibrium rate of exchange rate pass-through can bebroken down into a component due to the direct cost response at the firm level, and another dueto price complementarities faced by the firm at industry level. On the one hand, it relates theequilibrium rate of cost pass-through to a direct cost pass through channel reflecting the averagerate at which firms from country TP react to changes in their own cost. As ∂αi,k
/∂si,k > 0, this
rate is increasing in the average market share of firms from that country. On the other hand, thesecond channel captures the effect of price complementarities: the firm also reacts to changes inthe general price level. As ∂γi,k
/∂si,k > 0, this rate is decreasing in the average market share of
firms from TP.8
Importantly, γTP multiplies ∑cεC mc,kec
eTP, which is a function of the entire sector’s market struc-
ture: the price complementarity response also incorporates how the sectoral price index changes
7εi,t = γi∑jεNk
sjαj(wj,k−θj,TP ej,TP,t)1−∑jεNk
sjγj+ αi
(wj,k − θi,TP ei,TP,t
)8Note that corresponding to our definition of ECPTi,k, the average γTP normalizes individual γi by local cost
intensity, that is, γTP = ∑iεNk,TPsTP
i γi
(θl
i
)−1where sTP
i = si
/∑jεNk,TP
si . For the other averages, it holds that
εTP = ∑iεNk,TPsTP
i εi,t and αTP = ∑iεNk,TPsTP
i αi.
10

for a given distribution of firm market shares and imported input intensities, origins, and ex-change rate movements. The change in the sectoral price index is the sum over all relative ex-change rate movements times mc,k, the equilibrium elasticity of the sectoral price index with re-spect to the exchange rate of country c. This term is equal to
mc,k ≡ ∑jεNk,c
sjαjθlj
/(1− ∑
jεNk
sjγj
). (6)
The term in the numerator of equation (6) captures how the prices of all firms from countryc react on impact to a change in their exchange rate for a given overall price level. The termof equation (6) captures how this initial “price impulse” is then multiplied as all prices react toeach other. In particular, equation (6) incorporates how firms of heterogeneous size vary in theirαjθ
lj , how exchange rates are correlated with eTP (a channel highlighted in Bergin and Feenstra
(2009), Naknoi (2013), and Pennings (2012)), and on the ”mass” of firms originating from TP (achannel highlighted in Feenstra et al. (1996)). Unless we are in a special case like Lemma 1, thefirst, price-complementarity channel, and the second, cost pass-through channel, will not allowfor pass-through to be 1 independently of market structure.
In the empirical section below, we take realized exchange rate changes for the construction ofthe predicted rates of equilibrium cost pass-through ECPTTP,k. This way, we do not require anyassumptions on the underlying exchange rate process. To highlight the intuition at work, it ishowever informative to further examine (5) theoretically under the assumption that exchange ratechanges are normally distributed.
Corollary 2 Assume that for any country c, it holds that ec = βcew + ec with ew ∼ N(µW , σW) andec ∼ N(0, σc), where εc, ec, and eW are independent from each other and so are all ej and ei for i 6= j. Asecond-order Taylor approximation of the expected rate of ECPTTP,k is given by the following expression:
E [ECPTTP,k] ≈ γTP,k
(mTP,k +
(1 +
σ2TP
β2TPµ2
W
)∑
cεC−TP
mc,kβc
βTP
)+ θl
i αTP. (7)
In this corollary, exchange rate changes have a global component with country-specific load-ings βc, as well as orthogonal country-specific shocks. Then, what matters for pass-throughare two factors: first mTP,k, the direct impact of eTP on the sector’s price index and second, theelasticity-weighted relative loading of the global shock ∑cεC−TP
mc,kβc
βTP. Estimated pass-through
rates will be affected most by the presence of price complementarities if βTP is small in absolutemagnitude.
Overall, we take away for our empirical analysis that two elements of market structure areimportant determinants of the trade partner and sector-specific rate of equilibrium pass-through:on the one hand, the market share of each individual firm affects its responsiveness to own costs
11

and to the general price level. On the other hand, the combined market share of all firms froma trade partner, how exchange rates are correlated, and the sector’s entire market structure affecthow the general price level evolves. Below, we empirically investigate the importance of thesetwo channels.
3 Market Share, Pass-Through, and Responsiveness to Competitor Prices.
In this section, we first describe our methodological innovation of constructing firm-specific mar-ket shares, describe the construction of indices of competitor prices, and account for the effect ofimported inputs. We then use confidential U.S. micro data to establish our two stylized facts thatare robust across a variety of pass-through specifications: the rate at which a firm reacts to com-petitors’ prices is hump-shaped in market share while the rate at which it reacts to changes in itsown cost is U-shaped in market share.
3.1 Data
We use data from three sources: we take exchange rates and inflation data from the IMF’s Interna-tional Financial Statistics database, trade data at the Harmonized System (HS) ten-digit level fromthe U.S. Census Bureau, and import prices at the good level from the BLS import price database.These micro price data have been the topic of intense study since the original analysis of thisdataset by Gopinath and Rigobon (2008).
We refer the reader to Gopinath and Rigobon (2008) for a detailed description of the U.S. importprice micro data. In this paper, we analyze the years from 1994 through 2005. We apply ouranalysis to the 34 largest trade partners in the data. In manipulating the data, we follow themain steps taken in Gopinath and Rigobon (2008). In particular, we drop net price data which areflagged by the BLS as not usable, not index usable or for which a price has been estimated. Thereare 771872 usable prices in our sample. In addition, we pull forward a last observed price whena price is missing as in Nakamura and Steinsson (2012). We also disregard an entire price seriesif more than 10% of prices of a series have been flagged as price records with no trade. All of ourprices are market price transactions invoiced in USD.9
3.2 Constructing Market Shares and Competitor Prices
One of the major limitations of the BLS micro price data is that it does not include informationon the sales of individual firms, which we need to predict firm-specific price responses from the
9As Gopinath and Rigobon (2008) have documented, almost all U.S. imports are priced in USD. For example, 93.4%of all import prices are in USD in 2004. Neiman (2010) explicitly studies the behavior of intra-firm prices which accountfor approximately 40% of the data.
12
model. We overcome this limitation in the following way. First, we merge in country-specifictrade flows that are highly disaggregated. This gives us the actual market share of most (but notall) firms at an already narrow level of disaggregation. Second, if necessary, we infer the exact sizedistribution of firms. We do this by using information contained in prices in the BLS dataset toinfer market shares.
To construct market share, we note that the model structurally implies that market shares arepinned down by relative prices. We use this relationship to infer the size distribution of firmsfrom prices in conjunction with available disaggregated data on bilateral imports and domesticproduction by sector: Within each ten-digit HS sector, the market share of a given firm nεNTP,k
from country TP and sector k is equal to
sn,k = mTP,kp(1−ρ)
n,k
∑jεNk,TP
p(1−ρ)j,k
, (8)
where mTP,k is the sectoral import share of country TP.To compute sectoral import shares, we merge in extremely disaggregated, country-specific US
import data at the HS ten-digit level from Feenstra et al. (2002), who update the data of Feenstra(1996). The main advantage of using these highly disaggregated data is that there are only veryfew firms from a specific trade partner in a specific HS ten–digit code. There are 18320 differentHS ten-digit codes in the Feenstra data, which is comparable in the order of magnitude to the BLSsample size. We therefore expect to have very precise information on firm-specific market sharesfrom the trade data alone, when the firm-level market share factor, the fraction in (8), implied byrelative prices equals 1.
Indeed, for 61.2% of the observations in our sample, there is only one active firm per trade-partner-HS-year-month combination, and we thus precisely know that firm’s market share withinits industry. We can use this subsample to gauge whether quality heterogeneity is an issue ofimportance by running a robustness test of our analysis in which we only consider sectors wherethere is one firm per trade-partner-year-month. Since we find that it is not, we subsequently useour full sample that includes trade-partner-HS-year-months with more than one firm.
If we consider TP-HS-year-month combinations with more than one firm, we find that thereare typically very few firms per combination. For example, for 18% of the observations, there are2 firms per combination and there are 6 or more firms per combination for fewer than 2% of theobservations, with the maximum being 54. The average number of firms per combination is 1.92.For the cases in which there is more than one firm, we use the structurally implied relationship ofprices and market shares, incorporated into (8), to compute firm-level market shares.10
10As an alternative, in the working paper version of this paper, we simulate firm market shares rather than inferringthem from prices, following Atkeson and Burstein (2008). To do so, we first generate productivity draws and as-sume that each firm n draws its idiosyncratic productivity zn from a log-normal distribution (log zn ∼ N(0, σ2), where
13

We find the estimates of market shares computed by using our main method to be quite plau-sible and consistent with what we know from the Feenstra et al. data. On average, firms havea 22.7% market share in a given ten-digit sector. We note that our data is also characterized by alarge number of small firms. For example, the median market share is 4.3%. In the bottom quintileof firms, market share is approximately zero, while in the top quintile, market share is 80.7%. Table1 summarizes these results. We also consider the evolution of these market shares over time. Wefind that the mean market share has remained fairly constant from 1998 to 2005 while the medianshare has fallen somewhat. Figure 2 summarizes these results.
Finally, we follow Gopinath and Itskhoki (2011) and compute an index of competitors’ logprice changes in each HS-year-month combination for our subsequent analysis as follows:
∆Pcomi,k,t =
Nk,t
∑j 6=i
ωj,k,t∆pj,k,t
where ∆pi,k,t denotes firm-specific log price changes for firm i at time t and ωi,k,t market-shareweights. To avoid endogeneity issues, we omit firm i from the Nk,t firms in sector k. Therefore,∆Pcom
i,k,t varies across firms in sector k.
3.3 Baseline Results: The Response of Individual Prices
In this subsection, we establish our two stylized facts relating price setting and a firm’s marketshare. First, we show that the direct response of import prices to an exchange rate shock is U-shaped in market share. This finding underlies the result of Berman et al. (2012) that ERPT is –on average – negatively related to a firm’s market share. It relates to the result of Feenstra et al.(1996) that exchange rate pass-through is U-shaped in the country’s aggregate market share.11
Second, we present our key salient fact that is new to the literature to the best of our knowledge:the response of import prices to competitors’ prices is hump-shaped in a firm’s market share. Thisfinding extends the insights from the regression in Gopinath and Itskhoki (2011) to the dimensionof firm heterogeneity.
We build up to the first result in three steps. First, we confirm conventional estimates of ERPT:pass-through of exchange rate shocks is incomplete, with an elasticity of prices to exchange ratesof 0.15. We obtain this result from estimating a specification of price changes on 12-month laggedexchange rate movements, as follows:
∆pi,TP,t = αTP +12
∑j=0
β j∆ei,TP,t−j + ηZt + εi,TP,t. (9)
σ2 = 0.385 as in Atkeson and Burstein (2008). For the given realizations of zn within each sector, we then computenumerically the optimal price of each firm and its market shares as implied by (8).
11In the working paper version of this paper, we examine the relation between country-specific market share andpass-through.
14
where i denotes a good and TP the country the good is exported from (the trade partner). ControlsZt include inflation in the source country plus 12 lags thereof, and various sets of fixed effects. Thesum of estimated coefficients, ∑12
j=0 β j, gives us the degree of ERPT, shown in the first row of Table2.
Second, we show that controlling for market share implies a lower degree of exchange ratepass-through. We obtain this result from estimating a specification that is augmented with aninteraction of market share and exchange rate movements:
∆pi,TP,t = αTP +12
∑j=0
β j∆ei,TP,t−j +12
∑j=0
γjmiei,TP,t−j + ηZt + εi,TP,t. (10)
where mi denotes the firm specific market shares. Again, we estimate this using 12-month lags.Choosing a 12-month lag structure closely reflects the annual unit value approach in Berman et al.(2012), and also matches the annual specification in Amiti et al. (2012).
Our estimates of the interaction effect, ∑12j=0 γj, confirm the finding of Berman et al. (2012) that
the degree of exchange rate pass-through is decreasing in market share. The second column ofTable 2 summarizes this result. In particular, our estimates imply that the rate of pass-through fora firm with negligible market share is nearly three times as large as that of a monopolist: 19.4%vs. 19.4%− 12.5% = 6.9%. Incidentally, since Berman et al. (2012) obtain their result using finelydisaggregated unit value data, this also validates our approach of using the BLS micro price datathat is survey-based.12
Third, we refine the result of Berman et al. (2012) on the role of market share by documentingthat underlying the relation which on average is decreasing is in fact a U-shaped relationship.When we add an interaction of the squared market share with the exchange rate to the abovespecification, we find that the response of prices is U-shaped in the firm-specific market share.The coefficients of the linear and quadratic terms significantly estimated at −0.56 and 0.39 implythat the degree of exchange rate pass through reaches its minimum of 0.02 around a market shareof 72% (=0.564/(2 ∗ 0.39)) and thereafter increases in market share. Column 3 shows the coefficientestimates. The rate of exchange rate pass-through implied by the estimates is 18% for very smallfirms and 21.5% for near monopolists.
While we do not view uncovering this U-shaped relationship as our main empirical finding,the uncovered shape of the relationship is conceptually important: it underlines that the quali-tative predictions of the class of models based on Dornbusch (1987) are supported by the data.In this class of models, incomplete pass-through follows from a firm’s markup changing with its
12Our result as well as that in Berman et al. (2012) seem to oppose that in Garetto (2012) that the degree of ERPT isincreasing in a firm’s market share. However, this discrepancy may simply be due to the particular industry examinedin Garetto (2012).
15

market share. This mechanism necessarily entails that the degree of pass-through is decreasingin market share up to a certain size, but it must be increasing in market share as a firm begins todominate its industry. We also note that in terms of model fit, adding the quadratic interactionterm is as important as is including the linear interaction term (compare the R2 in columns 1, 2,and 3).
Our key, new salient fact is that the rate at which firms react to changes in the prices of com-petitors is hump-shaped in market share. To establish this fact, we draw on Gopinath and Itskhoki(2010) and examine how firms react to changes in their competitors’ prices. Following their ap-proach, we estimate a regression of price changes on exchange rates, and the index of competitor’sprice changes ∆Pcom
j,k,t . We then augment this specification with interactions with market share andsquared market share. Columns 4 and 5 in Table 2 summarize our results.
We find that the index of competitor prices has strong predictive power when added to theregression. This is shown in column 4. The large estimate of the coefficient is similar in magnitudeto Gopinath and Itskhoki (2010).13 Moreover, we find that there is a hump-shaped relationshipbetween a firm’s market share and the extent to which it reacts to competitors’ prices. The rateof reaction takes the values of 0.42 for a tiny firm with approximately zero market share, is max-imized at around 0.61 for a market share of 36% and is thereafter decreasing in market share toaround 0 for near-monopolists (see column 5).14
Finally, we note that the uncovered U-shaped relationship between the degree of exchange ratepass-through and market share holds both conditionally on conditioning on competitor prices andthe heterogeneous response to it (see column 5) and also unconditionally (see column 3). However,this U-shape is more pronounced (in terms of comparing the linear to the two interaction terms)when conditioning on competitor prices and the heterogeneous response to it.
3.4 Accounting for Imported Inputs
Here, we show that both the pattern of U-shaped pass-through and that of hump-shaped re-sponsiveness to competitor prices are robust and even more pronounced when we filter out costchanges of imported intermediate inputs from exchange rate changes.
We construct the cost change due to an exchange rate movement by netting out the effect ofimported intermediate inputs. First, we construct a sector and trade partner specific measureof imported input intensity from the World Input Output Tables Database (WIOD). The latterdatabase tells us how imported-input-intensive production abroad is. For example, this databaseallows us to construct a measure of how imported input intensive the Italian leather industry is.
13Note that Gopinath and Itskhoki (2010) construct an unweighted index of competitor prices since the BLS microdata do not include firm-specific market shares. Since we have constructed the latter, we construct the weighted indexof competitor prices, which corresponds to the theoretically relevant index (see Section 2).
14We exclude full monopolists from this exercise as it is not possible to construct an index of competitors’ prices insuch cases.
16

We then allocate it to heterogeneous firms using the microeconomic insights of Amiti et al. (2012).Proceeding in this way, we construct each firm’s imported-input-intensity θ
ImInpi,TP,t as
θImInpi,TP,t =
cost of imported inputsi,TP,t
total variable costs i,TP,t.
The appendix describes our procedure of constructing θImInpi,TP,t in detail.
Second, we use the imported input intensity to construct our measure of cost change: Whencounted in US dollars, the percentage cost change of foreign firm i from trade partner TP to servicethe US market is equal to the exchange rate change times 1− θ
ImInpi,TP,t−1, the lagged proportion of
firm i’s costs that are paid in local currency (we use the lagged imported input intensity as thecontemporaneous one might react to exchange rate movements). Our estimate of the cost changeof firm i that is driven by the exchange rate is equal to
∆ci,TP,t = ∆ei,TP,t
(1− θ
ImInpi,TP,t−1
)(11)
We estimate cost pass-through exactly as in the previous section, but now using the cost change∆ci,TP,t instead of the exchange rate change as independent variable. Correspondingly, also theinteractions with market share and market share squared are based on ∆ci,TP,t instead of the ex-change rate change. Table 3 summarizes the results.
We find – consistent with the results of Amiti et al. (2012) – that accounting for input useintensity has a major impact on the estimated rate of pass-through. The rate of cost pass-throughis on average much larger than the rate of exchange rate pass-through, and the U-shape of therelation between market share and cost pass-through is more pronounced.15
Moreover, we also find evidence for our second, main, stylized fact: the hump-shaped re-sponse to competitor prices is both economically and statistically highly significant, conditionalon the U-shaped cost pass-through. This presents an important empirical finding: the large eco-nomic magnitude of this heterogeneity and the simultaneously opposing shapes of the relationssuggest that it is important to examine their interactions in industry equilibrium.
Finally, following Amiti et al. (2012), we construct an alternative measure of cost changes thattakes into account that imported inputs might be priced to market in the trade partner countries.This may be a concern because pricing-to-market of inputs imported in the trade partners may becorrelated with exchange rate movements. Our alternative cost measure ∆calt
i,TP,t is equal to
∆calti,c,t = ∆ei,c,t
(1− θ
ImInpi,TP,t−1
)+ (∆ei,c,t + ∆I IPITP,k,t) θ
ImInpi,TP,t−1.
15We note that the empirical finding that the absolute rate of cost pass-through is U-shaped in market share doesnot conflict with the theoretical result and empirical finding of Amiti et al. (2012) that the rate of cost pass-through ismonotonically decreasing in a firm’s market share when evaluating relative prices in a particular environment. Amitiet al. evaluate the response of the price of firm i relative to all competitor prices from the same origin in the samedestination market and in the same industry (also see the discussion of this issue in Amiti et al.).
17

where ∆I IPITP,i,t is the percentage change of the price index for imported inputs in trade partnerTP and the sector k that firm i is active in. ∆I IPITP,i,t is taken from Auer and Saure (2013) whoconstruct it by using industry-specific import price indices and information on the sectoral com-position of the inputs used by each industry. Because ∆I IPITP,i,t is measured in the trade partner’slocal currency, we add to it the movement of the relative exchange rate to our cost measure.
Again, we find that our stylized facts are robust when taking into account cost fluctuations ofimported inputs in the trade partners: the relationship between the rate of cost pass-through anda firm’s market share is U-shaped, while the relationship between the rate of responsiveness to thecompetition a firm’s market share is hump shaped. Table 3 column 2 summarizes these results.
3.5 Further Robustness Tests
Two additional refinements show the robustness of our stylized facts. First, we find that our resultsare invariant to second-order effects of market shares on prices that are assumed away in theloglinearization of Atkeson and Burstein (2008). We control for such effects directly by includingmarket share into the regression: we add the change of the market share as well as 12 lags thereofto the estimation. This modification has no effect on the coefficients of interest, as shown in Table3 column 3 (coefficients of market share changes are not reported). The result is expected becausewe know from Figure 2 that average market shares have remained rather constant over time.
Second, we find that including various fixed effects does also not change the qualitative shapeof the presented relations. In column 4, we add time fixed effects to the estimation, thus controllingfor all aggregate variation. In column 5, we add time fixed effects for each HS two-digit stratain the data. When we thus absorb all average price developments in each strata, the U-shaperesponse to cost shocks and the hump-shaped response to competitor prices are economicallypronounced and statistically significant (the linear interaction term is significant only at the 10%level; however, a joint test that the linear and square interactions are insignificant is rejected at the1% level). We find the latter robustness test especially strong since it filters out all time-varyingstrata specific patterns that could be caused by sector specific technological developments.
Overall, we conclude from this and the previous estimations that our two stylized facts arequite robust: conditional on accounting for firm-specific heterogeneity in imported input intensityand conditional on absorbing all common variation over time, both the hump-shaped responseand the U-shaped response are strongly present in the data.
3.6 Alternative Pass-Through Estimates from Non-Parametric Specifications
Next, we demonstrate that the linear and quadratic interactions adequately capture the non-linearities between market shares and the rate of pass through. Moreover, we show that the uncov-ered non-linearities also emerge when employing alternative estimation methods of pass-throughrates and the reaction to the competition.
18

To show our first point, we split our sample into quintiles and estimate the average rate ofcost pass-through and responsiveness to competitor prices within each quintile, thereby demon-strating that the quadratic specification employed above is not an artifact of some higher orderrelations. To show our second point, we estimate by quintiles the 12-months dynamic regressionspresented in the previous section, but also estimate specifications that condition on price changes(see Gopinath and Rigobon (2008)), as well on lifetime price changes of goods (also see Gopinathand Rigobon (2008)).
In addition to the above-explained 12-months dynamic regressions, we estimate the followingmedium-run pass-through specification that conditions the estimation on a price changes actuallyhappening:
∆pi,ti−t−1i
= β0 + β1∆ci,ti−t−1i+ β2∆Pcom
i,ti−t−1i+ β3Zti + εi,ti
and for the long-run:∆pi = β0 + β1∆ci + β2∆Pcom
i + β3Zti + εi,ti
where ∆pi,ti−t−1i
denotes the good-specific log price changes between the most recent and thepenultimate price changes, ∆ci,ti−t−1
ithe corresponding log cost changes (constructed as in equa-
tion (11)), ∆Pcomi,ti−t−1
ithe corresponding price change of competitors, and Zti the set of controls.
The long-run specification has the same form, but here all changes are cumulated over the life-time of a good: ∆pi = ∆pi,T−t0 . Following Gopinath and Rigobon (2008), we require that there isat least one price change during the life of a good.
While resulting in a smaller sample size, employing conditional pass-through methods has theadvantage of eliminating periods of price stickiness. This brings our empirical approach closer tothe flex-price environment of our model. In particular, conditioning on life-time price changestakes into account several rounds of price adjustments. This is important especially in a modelingcontext with price complementarities, because not all firms may adjust at the same time. A singleprice change may therefore not fully take into account the effect of complementarities. Thus, ifthis were indeed going on, one would expect stronger results from our model for the long-runpass-through specification.
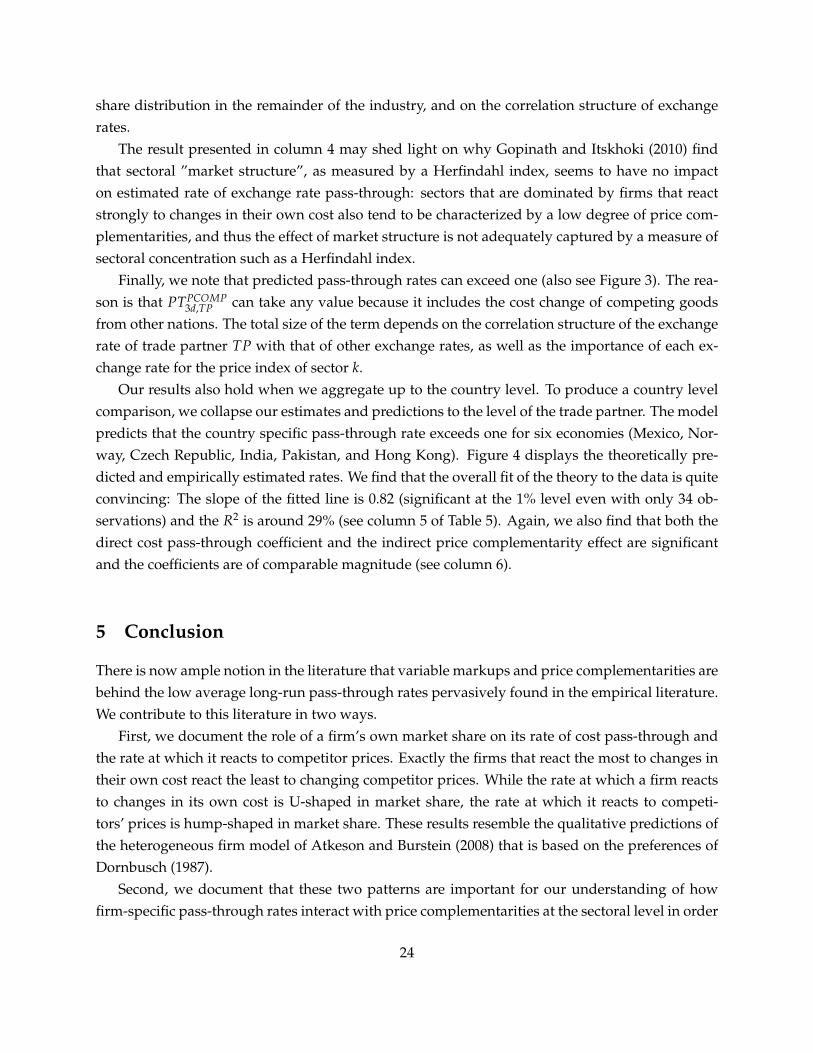
When we estimate these specifications across the five quintiles of market shares, we find thatpass-through is robustly U-shaped for the cases of the dynamic regression, the conditional re-gression, and the lifelong regressions. Figure 1 Panel A shows this result: for all three estimationmethods, the minimum pass-through rate is interior, and it is monotonically decreasing up to theminimum and monotonically increasing after the minimum. As found by Gopinath and Rigobon(2008), the long-run rate of cost pass-through is the highest of the three rates across all bins.
Similarly, the upper panel documents that the responsiveness to competitors’ prices is hump-shaped for these three cases. Figure 1 Panel B shows this result: for all three estimation methods,the maximum rate of responsiveness is interior, it is monotonically increasing up to the maximum
19

and monotonically decreasing after the maximum.
4 Pass-Through in Industry Equilibrium
In this section, we use the above-developed version of the Dornbusch (1987) model as guidanceto highlight the aggregate implications of the uncovered microeconomic patterns.
To build up to our main result, we first examine the firm-specific predictions of this theory inindustry equilibrium, that is, incorporating that all firms react to their cost shock and that pricesreact to each other. Using the model as a guidance for this empirical exercise allows us to study theindustry-equilibrium rate of pass-through directly based exclusively on cost shocks, avoiding theuse of any information in competitors’ actual price changes. It also allows us to examine whetherthe Dornbusch (1987) model accurately captured the nonlinearities of the data that we uncover inSection 3 above.
We note that we do not view this first exercise as our main empirical finding: we know fromprevious work that most price changes in the data arise due to firm or product-level factors beyondexchange rate movements. Given that the developed model is not designed to explain these firm-or product-specific price movements, we have little hope that it can explain a substantial fractionof the variation of price changes in the data.
Instead of focusing on good-specific price changes that are dominated by idiosyncratic noise,in the second and main exercise, we thus focus on aggregated pass-through rates to demonstratethe aggregate implications of the uncovered microeconomic patterns. We aggregate our theoret-ically predicted price changes up to the sector-trade partner dimension and examine how welltheory and data correlate at this level. Our main finding is that the direct cost pass-through chan-nel and the indirect price complementarity channel play approximately equally important rolesin determining pricing but partly offset each other. Including only one of these channels in anempirical analysis results in a failure to explain variation in the aggregate equilibrium rate ofpass-through.
4.1 Firm-level Price Changes
We begin by establishing the empirical relevance of the model at the firm level: We show thatactual and predicted price changes are significantly related to one another. Predicted price changesin this comparison are only based on market shares, input intensities, and primitive exchangerate shocks. We do not include competitor prices in the construction of predicted price changes.We find that our model is exhaustive in the sense that cost changes and interaction of changeswith a firm’s market share and market share squared are no longer informative when added to aspecification that includes theoretically predicted price changes as regressor.
20
We construct predictions only taking into account how the exchange rates of all partners evolveand how this should affect a firm’s pricing decisions based on the model and each firm’s inputintensity. That is, our prediction is the one in (4) based on the constructed cost shocks (11), wherewe are using the parametrization of Atkeson and Burstein (2008). The predicted price change∆ppred
i,k of firm i is equal to
∆ppredi,k,t = γi,kPpred
k + αi,k∆ci,TP,t + εi,TP,t (12)
where Ppredk is the predicted change in the sector’s price index as solved for in Lemma 1. We focus
on the case of Cournot competition for these predictions.16
Using these predicted price changes, we estimate the following comparison specification toexamine the fit of the theory:
∆pi,k,t = αTP +12
∑j=0
δj∆ppredi,k,t−j + ηZt + εi,k,t
We find that the theoretically predicted price change ∆ppredi,k,t comes out highly significant. At the
same time, conditional on the inclusion of this prediction neither the cost change nor the costchange interacted with market share and market share squared – included into the set of controlsZt – add information to the model. Table 4 summarizes our results. Column 1 only includesthe theoretical prediction (12) as independent variable as well as the set of time fixed effects foreach strata. Next, in column 2 we add the change in the cost of production, and column 3 adds theinteractions of the cost change with the firm’s market share and the square of the market share. Forall three specifications, the theoretical prediction is highly significant, while all other variables arenot. We note that throughout columns 1 to 3, the sum of estimated the coefficient of the predictedprice changes, ∑12
j=0 δj, is rather low, implying that actual price changes are smaller than predictedones. We explain why this is the case in the next subsection.
Second, we find that movements in direct costs and price complementarity effects are approx-imately equally important in explaining equilibrium price changes. We show this by regressingobserved price changes on the two components that underlie the predicted price changes: thecomponent that is associated with costs at the firm level and the one component that is associatedwith the mass of competitors changing prices. We estimate the following specification:
16The reason for this choice is that the assumption of Cournot competition generates a theoretically predicted shapethat follows the shape of the data more closely than under the alternative assumption of Bertrand competition. Figure5 in Appendix C plots the theoretically predicted rate of cost pass-through as a function of market share for a value of10 for the elasticity of substitution between varieties and 2 for the elasticity of substitution between sectors. AssumingBertrand competition typically generates a relation between market share and cost pass-through that is monotonicallydecreasing until very large market shares. We thank Oleg Itskhoki for bringing this to our attention. See also thediscussion in the online appendix of Amiti et al. (2012).
21

∆pi,TP,t = αTP +12
∑j=0
δotherj
(γi,kPpred
k
)+
12
∑j=0
δownj (αi,k∆ci,TP,t) + ηZt + εi,TP,t
We report the significance of both components of the prediction that derive from cost changes ofother firms facing cost shocks (∑12
j=0 δotherj ) and from the own cost shock (∑12
j=0 δownj ) in column 5 of
4. We find that both are statistically highly significant and that the coefficients are of comparablemagnitude.
4.2 Aggregate Pass-Through Rates
Here, we substantiate our main result at the aggregate level: the direct cost pass-through channelis quantitatively slightly less important than the price complementarity channel when it comesto explaining variation in pass-through across sectors and trade partners. Moreover, includingonly one of these channels results in a failure to explain variation in aggregate pass-through. Theunderlying reason is that the two channels are negatively correlated. This aggregate implication isconsistent with the firm-specific finding that firms characterized by high price sensitively to owncosts react only little to changing competitor prices.
To establish these results, we compare empirically estimated and theoretically predicted ratesof pass-through at the trade-partner-sector level. Because such estimation requires a minimumnumber of observations, we estimate pass-through at the three-digit NAICS level rather than atfiner levels of disaggregation. This results in pass-through estimates for 205 three-digit NAICS-trade partner combinations. For each such sector-TP combination, we also construct the theo-retically predicted pass-through rate. In this step, we use Equation (12), the constructed marketshares, and the benchmark parameters from Atkeson and Burstein (2008) while also accountingfor imported input use abroad as described above.
We define the average pass-through rate for each sector-TP combination as the following av-erage of firm-specific rates:
PT3d,TP = N−13d,TP ∑
iεN3d,TP
∆ppredi,3d
∆ci,t= N−1
3d,TP ∑iεN3d,TP
α−1i,3d︸ ︷︷ ︸
=PTCPT3d,TP
+ N−13d,TP ∑
iεN3d,TP
γi,3dPpredi,3d
∆ci,3d,t︸ ︷︷ ︸=PTPCOMP
3d,TP
. (13)
The first term in this equation, PTCPT3d,TP, is the average direct cost pass-through, while the second
term, PTPCOMP3d,TP , summarizes the effect on pass-through due to price complementarities.
We find that predicted pass-through rates can significantly explain the variation in actual pass-through rates across sectors and trade partners. Figure 3 presents a scatter plot relating estimatedto predicted pass-through rates. The vertical axis displays the estimated sector-trade-partner-
22

specific pass-through rate and the horizontal axis displays the according predicted rate. Column1 of Table 5 presents the regression line corresponding to this scatter plot. The slope of the lineis estimated at 0.732 and statistically highly significant, i.e. the theory can explain differences inpass-through rates across sectors and countries quite well. These differences in pass-through ratesare not driven by sectoral characteristics. They persist when we add a set of three-digit NAICSfixed effects as shown in column 2.
However, we note that the predicted pass-through rates much higher than estimated ones.This is reflected by the generally negative intercept in Table 5, which also explains why the co-efficients in the previous subsection and Table 4 were small: although the presented theory is agood description of differences in pass-through rates across firms, sectors, and trade partners, thepredicted level of pass-through is generally higher than observed in the data.
In terms of economic magnitude, the direct cost pass-through channel is slightly less impor-tant than the price complementarity channel. Column 3 includes the two elements PTCPT
3d,TP and
PTPCOMP3d,TP of the predicted pass-through rate separately, documenting that both elements are sig-
nificant predictors of the estimated rates of pass-through. We find that a one standard deviationdifference in PTPCOMP
3d,TP (equal to 0.089) is associated with a 6.64% difference in the estimated pass-through rate, while a one standard deviation difference in PTCPT
3d,TP(equal to 0.068) is associatedwith a 4.54% difference in the estimated pass-through rate.
Importantly, omission of one of these two channels generates a strong bias in the predictedpass-through rate. We document this in column 4 where we include only the direct cost pass-through element PTCPT
3d,TP as explanatory variable. This results in an insignificant relationship be-tween estimated and predicted pass-through rates. The underlying reason is that the averagedirect cost pass-through and the average rate of reaction to the competition are negatively corre-lated. As a result of this negative correlation, an omitted variable bias makes the coefficient ondirect cost pass-through in column 4, PTCPT
3d,TP, drop to 0.055. 0.055 equals the true effect of 0.6673plus the omitted variable bias of 0.7458 ∗ (−0.82), where −0.82 is the coefficient from a regres-sion of PTCPT
3d,TP on PTPCOMP3d,TP . We thus significantly underestimate the true rate of pass-through
by omitting the element of the prediction that captures the importance of price complementari-ties. Both channels as well as their covariance are important for understanding the variation inpass-through.
The economic intuition for this aggregate result that both channels need to be taken into ac-count in order to correctly predict pass-through again follows from a firm-specific analogue: firmscharacterized by high price sensitivity to own costs react only little to changing competitor prices.At the aggregate level, those sectors that are dominated by firms with high price sensitivity to owncosts exhibit little reaction to changing competitor prices. This relation, however, is not mechanicalsince the average rate of reaction to the competition for each sector-trade partner combination de-pends on the market share distribution of firms from the trade partner in question, on the market
23
share distribution in the remainder of the industry, and on the correlation structure of exchangerates.
The result presented in column 4 may shed light on why Gopinath and Itskhoki (2010) findthat sectoral ”market structure”, as measured by a Herfindahl index, seems to have no impacton estimated rate of exchange rate pass-through: sectors that are dominated by firms that reactstrongly to changes in their own cost also tend to be characterized by a low degree of price com-plementarities, and thus the effect of market structure is not adequately captured by a measure ofsectoral concentration such as a Herfindahl index.
Finally, we note that predicted pass-through rates can exceed one (also see Figure 3). The rea-son is that PTPCOMP
3d,TP can take any value because it includes the cost change of competing goodsfrom other nations. The total size of the term depends on the correlation structure of the exchangerate of trade partner TP with that of other exchange rates, as well as the importance of each ex-change rate for the price index of sector k.
Our results also hold when we aggregate up to the country level. To produce a country levelcomparison, we collapse our estimates and predictions to the level of the trade partner. The modelpredicts that the country specific pass-through rate exceeds one for six economies (Mexico, Nor-way, Czech Republic, India, Pakistan, and Hong Kong). Figure 4 displays the theoretically pre-dicted and empirically estimated rates. We find that the overall fit of the theory to the data is quiteconvincing: The slope of the fitted line is 0.82 (significant at the 1% level even with only 34 ob-servations) and the R2 is around 29% (see column 5 of Table 5). Again, we also find that both thedirect cost pass-through coefficient and the indirect price complementarity effect are significantand the coefficients are of comparable magnitude (see column 6).
5 Conclusion
There is now ample notion in the literature that variable markups and price complementarities arebehind the low average long-run pass-through rates pervasively found in the empirical literature.We contribute to this literature in two ways.
First, we document the role of a firm’s own market share on its rate of cost pass-through andthe rate at which it reacts to competitor prices. Exactly the firms that react the most to changes intheir own cost react the least to changing competitor prices. While the rate at which a firm reactsto changes in its own cost is U-shaped in market share, the rate at which it reacts to competi-tors’ prices is hump-shaped in market share. These results resemble the qualitative predictions ofthe heterogeneous firm model of Atkeson and Burstein (2008) that is based on the preferences ofDornbusch (1987).
Second, we document that these two patterns are important for our understanding of howfirm-specific pass-through rates interact with price complementarities at the sectoral level in order
24

when shaping the industry equilibrium rate of pass-through. The direct cost pass-through channel– how firms react to changes in their own cost for given prices of the competition – and the pricecomplementarity channel – how firms react to changes in competitor prices for given own cost– are quantitatively equally important in explaining the industry wide equilibrium pass-throughrate. Additionally, including only one of these channels results in a failure to explain variation inaggregate pass-through rates. The underlying reason for this is that average markup sensitivityand average rate of reaction to the competition are negatively correlated. This aggregate impli-cation follows from the firm-specific finding that firms characterized by high price sensitivity toown costs react only little to changing competitor prices.
Documenting these two forces separately in microeconomic data and showing how they inter-act in industry equilibrium constitutes the main contribution of our paper.
References
ALESSANDRIA, G. (2009): “Consumer Search, Price Dispersion, And International Relative PriceFluctuations,” International Economic Review, 50, 803–829.
ALESSANDRIA, G. AND J. P. KABOSKI (2011): “Pricing-to-Market and the Failure of AbsolutePPP,” American Economic Journal: Macroeconomics, 3, 91–127.
AMITI, M., O. ITSKHOKI, AND J. KONINGS (2012): “Importers, Exporters, and Exchange RateDisconnect,” NBER Working Papers 18615, National Bureau of Economic Research, Inc.
ATKESON, A. AND A. BURSTEIN (2008): “Pricing-to-Market, Trade Costs, and International Rela-tive Prices,” American Economic Review, 98, 1998–2031.
AUER, R., T. CHANEY, AND P. SAURE (2012): “Quality Pricing-to-Market,” GMPI Working Paper125, Federal Reserve Bank of Dallas.
AUER, R. AND P. SAURE (2013): “International Price Spillovers via the Global Supply Chain,”Mimeo, Swiss National Bank.
BACCHETTA, P. AND E. VAN WINCOOP (2003): “Why Do Consumer Prices React Less Than ImportPrices to Exchange Rates?” Journal of the European Economic Association, 1, 662–670.
——— (2005): “A Theory of the Currency Denomination of International Trade,” Journal of Inter-national Economics, 67, 295–319.
BERGIN, P. R. AND R. C. FEENSTRA (2001): “Pricing-to-Market, Staggered Contracts, and RealExchange Rate Persistence,” Journal of International Economics, 54, 333–359.
——— (2009): “Pass-Through of Exchange Rates and Competition between Floaters and Fixers,”Journal of Money, Credit and Banking, 41, 35–70.
25

BERMAN, N., P. MARTIN, AND T. MAYER (2012): “How do Different Exporters React to ExchangeRate Changes?” The Quarterly Journal of Economics, 127, 437–492.
BURSTEIN, A., M. EICHENBAUM, AND S. REBELO (2005): “Large Devaluations and the Real Ex-change Rate,” Journal of Political Economy, 113, 742–784.
——— (2007): “Modeling Exchange Rate Passthrough after Large Devaluations,” Journal of Mone-tary Economics, 54, 346–368.
BURSTEIN, A. AND G. GOPINATH (2013): “International Prices and Exchange Rates,” forthcoming,Handbook of International Economics.
BURSTEIN, A. T., J. C. NEVES, AND S. REBELO (2003): “Distribution Costs and Real ExchangeRate Dynamics during Exchange-Rate-Based Stabilizations,” Journal of Monetary Economics, 50,1189–1214.
CAMPA, J. M. AND L. S. GOLDBERG (2005): “Exchange Rate Pass-Through into Import Prices,”The Review of Economics and Statistics, 87, 679–690.
CHEN, N., J. IMBS, AND A. SCOTT (2009): “The Dynamics of Trade and Competition,” Journal ofInternational Economics, 77, 50–62.
DEVEREUX, M. B., C. ENGEL, AND P. E. STORGAARD (2004): “Endogenous exchange rate pass-through when nominal prices are set in advance,” Journal of International Economics, 63, 263–291.
DIXIT, A. K. AND J. E. STIGLITZ (1977): “Monopolistic Competition and Optimum Product Di-versity,” American Economic Review, 67, 297–308.
DORNBUSCH, R. (1987): “Exchange Rates and Prices,” American Economic Review, 77, 93–106.
DROZD, L. A. AND J. B. NOSAL (2012): “Understanding International Prices: Customers as Capi-tal,” American Economic Review, 102, 364–95.
FEENSTRA, R. C. (1996): “U.S. Imports, 1972-1994: Data and Concordances,” NBER Working Pa-pers 5515, National Bureau of Economic Research, Inc.
FEENSTRA, R. C., J. E. GAGNON, AND M. M. KNETTER (1996): “Market Share and Exchange RatePass-Through in World Automobile Trade,” Journal of International Economics, 40, 187–207.
FEENSTRA, R. C., J. ROMALIS, AND P. K. SCHOTT (2002): “U.S. Imports, Exports, and Tariff Data,1989-2001,” NBER Working Papers 9387, National Bureau of Economic Research, Inc.
FITZGERALD, D. AND S. HALLER (2010): “Exchange Rates and Producer Prices: Evidence fromMicro-Data,” Working paper, Stanford University.
GARETTO, S. (2012): “”Firms’ Heterogeneity and Incomplete Pass-Through”,” Working paper,Boston University.
GOLDBERG, L. S. AND J. M. CAMPA (2010): “The Sensitivity of the CPI to Exchange Rates: Distri-bution Margins, Imported Inputs, and Trade Exposure,” The Review of Economics and Statistics,92, 392–407.
26

GOLDBERG, L. S. AND C. TILLE (2009): “Micro, Macro, and Strategic Forces in International TradeInvoicing,” Staff Reports 405, Federal Reserve Bank of New York.
GOLDBERG, P. K. AND R. HELLERSTEIN (2012): “A Structural Approach to Identifying the Sourcesof Local-Currency Price Stability,” Forthcoming, Review of Economic Studies.
GOLDBERG, P. K. AND F. VERBOVEN (2001): “The Evolution of Price Dispersion in the EuropeanCar Market,” Review of Economic Studies, 68, 811–48.
——— (2005): “Market integration and convergence to the Law of One Price: evidence from theEuropean car market,” Journal of International Economics, 65, 49–73.
GOPINATH, G. AND O. ITSKHOKI (2010): “Frequency of Price Adjustment and Pass-Through,”The Quarterly Journal of Economics, 125, 675–727.
——— (2011): “In Search of Real Rigidities,” in NBER Macroconomics Annual 2010, Volume 25,National Bureau of Economic Research, Inc, NBER Chapters, 261–309.
GOPINATH, G., O. ITSKHOKI, AND R. RIGOBON (2010): “Currency Choice and Exchange RatePass-Through,” American Economic Review, 100, 304–36.
GOPINATH, G. AND R. RIGOBON (2008): “Sticky Borders,” Quarterly Journal of Economics, 123,531–575.
GUST, C., S. LEDUC, AND R. VIGFUSSON (2010): “Trade Integration, Competition, and the Declinein Exchange-Rate Pass-Throughompetition, and the decline in exchange-rate pass-through,”Journal of Monetary Economics, 57, 309–324.
HELLERSTEIN, R. (2008): “Who Bears the Cost of a Change in the Exchange Rate? Pass-ThroughAccounting for the Case of Beerears the cost of a change in the exchange rate? Pass-throughaccounting for the case of beer,” Journal of International Economics, 76, 14–32.
HELPMAN, E. AND P. KRUGMAN (1987): Market Structure and Foreign Trade: Increasing Returns,Imperfect Competition, and the International Economy, vol. 1 of MIT Press Books, The MIT Press.
KIMBALL, M. S. (1995): “The Quantitative Analytics of the Basic Neomonetarist Model,” Journalof Money, Credit and Banking, 27, 1241–77.
KLENOW, P. J. AND J. L. WILLIS (2007): “Real Rigidities and Nominal Price Changes,” 2007 Meet-ing Papers 844, Society for Economic Dynamics.
KNETTER, M. M. (1989): “Price Discrimination by U.S. and German Exporters,” American Eco-nomic Review, 79, 198–210.
——— (1992): “International Comparisons of Pricing-to-Market Behavior,” NBER Working Papers4098, National Bureau of Economic Research, Inc.
KRUGMAN, P. (1986): “Pricing to Market when the Exchange Rate Changes,” NBER WorkingPapers 1926, National Bureau of Economic Research, Inc.
MELITZ, M. J. AND G. I. P. OTTAVIANO (2008): “Market Size, Trade, and Productivity,” Review ofEconomic Studies, 75, 295–316.
27

MICHAEL, P., A. R. NOBAY, AND D. A. PEEL (1997): “Transactions Costs and Nonlinear Ad-justment in Real Exchange Rates: An Empirical Investigation,” Journal of Political Economy, 105,862–79.
NAKAMURA, E. AND J. STEINSSON (2008): “Five Facts about Prices: A Reevaluation of Menu CostModels,” The Quarterly Journal of Economics, 123, 1415–1464.
——— (2012): “Lost in Transit: Product Replacement Bias and Pricing to Market,” Forthcoming,American Economic Review.
NAKAMURA, E. AND D. ZEROM (2010): “Accounting for Incomplete Pass-Through,” Review ofEconomic Studies, 77, 1192–1230.
NAKNOI, K. (2013): “Exchange Rate Pass-Through and Market Structure in Multi-CountryWorld,” Mimeo, University of Connecticut.
NEIMAN, B. (2010): “Stickiness, Synchronization and Passthrough in Intrafirm Trade Prices,” Jour-nal of Monetary Economics, 57, 295–308.
PENNINGS, S. (2012): “Pass-Through of Competitors’ Exchange Rates,” Working paper, NYU.
SIMONOVSKA, I. (2010): “Income Differences and Prices of Tradables,” NBER Working Papers16233, National Bureau of Economic Research, Inc.
VERBOVEN, F. (1996): “International Price Discrimination in the European Car Market,” RANDJournal of Economics, 27, 240–268.
YANG, J. (1997): “Exchange Rate Pass-Through In U.S. Manufacturing Industries,” The Review ofEconomics and Statistics, 79, 95–104.
28

6 Tables and Figures
Table 1: Market Shares
I. Quintile II. Quintile III. Quintile IV. Quintile V. Quintile All
Mean 0.0034% 0.5107% 6.5065% 30.4549% 82.5581% 23.9040%Std. Error 0.0000% 0.0026% 0.0189% 0.0585% 0.0865% 0.0765%Median 0.0002% 0.3092% 5.7537% 28.5037% 87.2009% 5.7536%
N 36045 36046 36046 36396 35691 180224NOTE: This table presents summary statistics of the market shares in our data. We compute mean, medianand standard errors for the pooled market shares of all good-months and their quintiles. Market sharesare defined within each ten-digit sector in the harmonized system/Tariff Schedule B and are calculated byfirst constructing trade partner-specific US import shares at the ten-digit level using data from Feenstra etal. (2002), and then allocating the resulting market shares using the structural implications of the model inequation (8) and the prices in the BLS micro data. We use data from 1998-2005.
Table 2: Market Share, Exchange Rate Pass-Through, and Reaction to Com-petitor Prices
(1) (2) (3) (4) (5)∆e 0.1476 0.1938 0.2204 0.1123 0.1721
[0.007]*** [0.0195]*** [0.0214]*** [0.0165]*** [0.0216]***∆e ∗m -0.1252 -0.5641 -0.6710
[0.0353]*** [0.1466]*** [0.1668]***∆e ∗m2 0.3901 0.6444
[0.1442]*** [0.2021]***∆Pcom 0.5675 0.5135
[0.0174]*** [0.0.0243]***∆Pcom ∗m 1.021
[0.0.2014]***∆Pcom ∗m2 -1.1827
[0.2226]***N 328825 110172 110172 85228 85228Ni 16171 6220 6220 5111 5111R2 0.371% 0.404% 0.434% 9.261% 9.516%
NOTE: This table presents estimates of exchange rate pass-through obtained from fixed ef-fects panel estimations. All reported coefficients are constructed by summing over the in-stantaneous and 12 lagged coefficients. The corresponding standard error is reported insquare brackets. The dependent variable is the monthly log price change of the importedgood. The exchange rate change ∆e is equal to the monthly log change of the bilateral ex-change rate against the USD. For the construction of market shares m and the change incompetitor prices ∆Pcom see the main text. N (Ni) denotes the number of observations at thegood-month (good) level. *** denotes significance at the 1% level, ** denotes significance atthe 5% level, and * denotes significance at the 10% level.
29

Table 3: Imported Inputs and Cost Pass-Through
(1) (2) (3) (4) (5)∆c 0.2052 0.1712 0.2077 0.1890 0.1597
[0.0252]*** [0.0217]*** [0.02522]*** [0.0347]*** [0.0304]***∆c ∗m -0.8005 -0.6727 -0.7418 -0.7477 -0.7095
[0.1940]*** [0.1669]*** [0.1941]*** [0.20772]*** [0.2047]***∆c ∗m2 0.7652 0.6490 0.6700 0.7483 0.7451
[0.2352]*** [0.2022]*** [0.2357]*** [0.2151]*** [0.2229]***∆Pcom 0.5131 0.5138 0.5097 0.5220 0.3678
[0.02427]*** [0.0243]*** [0.0243]*** [0.0492]*** [0.0476]***∆Pcom ∗m 1.0209 1.0201 0.9695 0.7528 0.5262
[0.2014]*** [0.2014]*** [0.2016]*** [0.3115]*** [0.3092]*∆Pcom ∗m2 -1.1831 -1.1822 -1.1051 -0.9862301 -0.6791
[0.2227]*** [0.2226]*** [0.2223]*** [0.3300]*** [0.3370]**∆m yesTime FEs yesTime-Strata FEs yesN 85228 85228 85228 85228 85228Ni 5111 5111 5111 5111 5111R2 9.527% 9.514% 9.663% 10.37% 21.035%
NOTE: This table presents estimates of cost pass-through from fixed effects panel estimations. All re-ported coefficients are constructed by summing over contemporaneous and 12 lagged coefficients.The corresponding standard error is reported in square brackets. The dependent variable is themonthly log price change of the imported good. In Columns (1), (3), (4), and (5), the cost changeof firm i is equal to the firm-specific local cost share multiplied by the monthly log change of thebilateral exchange rate ∆e against the USD. The local cost share is equal to one minus the importedinput cost share as constructed in the main text and the appendix. For the construction of marketshares m, the change in competitor prices, ∆Pcom, and the alternative cost change used in column (2),see main text. Column (3) includes the change in the firms market share as well as 12 lags thereof(coefficients not reported). (4) includes time fixed effects, and (5) includes separate sets of time fixedeffects for each two-digit HS strata in the BLS data. N (Ni) denotes the number of observations at thegood-month (good) level. *** denotes significance at the 1% level, ** denotes significance at the 5%level, and * denotes significance at the 10% level.
30

Table 4: Fit of the Theory in Industry Equilibrium
(1) (2) (3) (4)
∆ppredcost 0.1064 0.1043 0.1175
[0.0240]*** [0.0234]*** [0.0249]***∆c 0.0323 -0.2283
[0.0543] [0.4189]∆c ∗m 0.0915
[1.2825]∆c ∗m2 0.2939
[0.9574]∆ppred
own cost 0.1344[0.0273]***
∆ppredother cost 0.1062
[0.0240]***Time-Strata FEs yes yes yes yesN 100813 100813 100813 100813Ni 6019 6019 6019 6019R2 15.926% 15.924% 15.963% 15.907%
NOTE: This table presents estimates of cost pass-through from fixed effects panelestimations. All coefficients are constructed by summing over contemporaneousand 12 lagged coefficients. The corresponding standard errors are reported insquare brackets. The dependent variable is the monthly log price change of theimported good. In Columns (1), (2), (3), the predicted price change ∆ppred
cost isconstructed as in equation (12). The cost change ∆c of firm i is equal to the firm-specific local cost share multiplied by the monthly log change of the bilateralexchange rate against the USD, ∆e. The local cost share is equal to one minus theimported input cost share as described in the main text and the appendix. For theconstruction of market shares and the change in competitor prices, see main text.The two sub-elements of the predicted price change in column (4) correspond tothe components of the price change in equation (5) that traces back to changes inown costs and to changes in other costs, respectively. These two sub elements addup to the predicted price change that is constructed as in equation (12). N (Ni)denotes the number of observations at the good-month (good) level. *** denotessignificance at the 1% level, ** denotes significance at the 5% level, and * denotessignificance at the 10% level.
31

Table 5: Understanding Rates of Exchange Rate Pass-Through
(1) (2) (3) (4) (5) (6)Dependent Variable Estimated PT rate in TP-sector combination Estimated PT rate of TPPT3d,TP 0.732*** 0.574** 0.950***
[0.234] [0.240] [0.260]PTCPT
3d,TP 0.667** 0.0550 1.188***[0.310] [0.246] [0.367]
PTPCOMP3d,TP 0.746*** 0.803**
[0.238] [0.306]Intercept -0.404* -0.00893 -0.351 0.259 -0.517** -0.691**
[0.227] [0.252] [0.282] [0.208] [0.249] [0.313]Industry FEs yesN 205 186 205 205 34 34R2 4.6% 21.6% 4.6% 0% 29.4% 31.3%
NOTE: This table presents results from OLS regressions relating theoretically predicted pass-through rates,PT3d,TP, to estimated rates. Estimated pass-through rates in Columns (1) to (4) correspond to the trade partner-sector average of the estimated cost pass-through rate from a 12-month regression using the BLS micro data.Predicted pass-through rates correspond to the same average over the theoretical prediction constructed followingequation (13). Specification (2) includes a dummy for each three-digit NAICS sector. In (4) and (6), the predictedpass-through rate is split into the component associated with cost pass-through, PTCPT
3d,TP, and the one associated
with price complementarities, PTPCOMP3d,TP (see text). The sample in Columns (5) and (6) is collapsed by the sector
dimension, resulting in 34 country-specific data points.
32
Figure 1: Estimated Pass-Through by Market Share Quintile
0
0.05
0.1
0.15
0.2
0.25
0.3
0.35
0.4
0.45
I. Quintile II. Quintile III. Quintile IV. Quintile V. Quintile
Rat
e of
Exc
han
ge R
ate
Pas
s T
hro
ugh
Market Share
Dynamic Estimates Medium-Run Estimates Long-Run Estimates
(a) Panel A: Pass-through by quintiles of the market share
0"
0.1"
0.2"
0.3"
0.4"
0.5"
0.6"
0.7"
0.8"
0.9"
1"
I."Quin2le" II."Quin2le" III."Quin2le" IV."Quin2le" V."Quin2le"
Rate%of%R
eac)on
%to%Com
pe)tors%Prices%
Market%Share%
Dynamic"Es2mates" Medium@Run"Es2mates" Long@Run"Es2mates"
(b) Panel B: Responsiveness to competitors’ prices, by quintiles of market share
NOTE: We plot the rate of ERPT for each quintile of market shares. The means of the five market sharebins are 0.0033%, 0.51%, 6.51%, 30.46%, and 82.56%. The solid lines plots the rate of ERPT and the rate ofresponsiveness obtained from 12-month dynamic regressions, while the dotted lines present estimates con-ditional on a price change, so-called medium-run pass-through/responsiveness, and the dash-dotted linepresents life-long pass-through estimates, so called long-run pass-through/responsiveness (see Gopinathand Rigobon (2008) and Gopinath and Itskhoki (2010) for detailed discussions and explanations on pass-through). All three specifications are estimated including the exchange rate and local PPI inflation and thechange in competitors’ prices as dependent variables.
33

Figure 2: Firm-Level Markets Shares over Time
0%
5%
10%
15%
20%
25%
30%
Jan-
98
Apr
-98
Jul-
98
Oct
-98
Jan-
99
Apr
-99
Jul-
99
Oct
-99
Jan-
00
Apr
-00
Jul-
00
Oct
-00
Jan-
01
Apr
-01
Jul-
01
Oct
-01
Jan-
02
Apr
-02
Jul-
02
Oct
-02
Jan-
03
Apr
-03
Jul-
03
Oct
-03
Jan-
04
Apr
-04
Jul-
04
Oct
-04
Jan-
05
Mar
ket
Sh
are
wit
hin
HS
10 in
%
Date
Firm Market Shares within HS10 over Time
Mean Firm Market Share Median Firm Market Share
NOTE: This figure displays the evolution of the median (dotted line) and the mean (solid line) of firm-specific market shares in the sample of U.S. importers surveyed by the Bureau of Labor Statistics (BLS)from 01/1998 to 06/2005. Market shares are defined within each ten-digit sector in the harmonized sys-tem/Tariff Schedule B and are calculated by first constructing trade partner-specific US import shares atthe harmonized system ten-digit level of disaggregation using data from Feenstra et al. (2002), and thenallocating the resulting market share using the structural implications of the model in equation (8) and theprices in the BLS micro data.
34
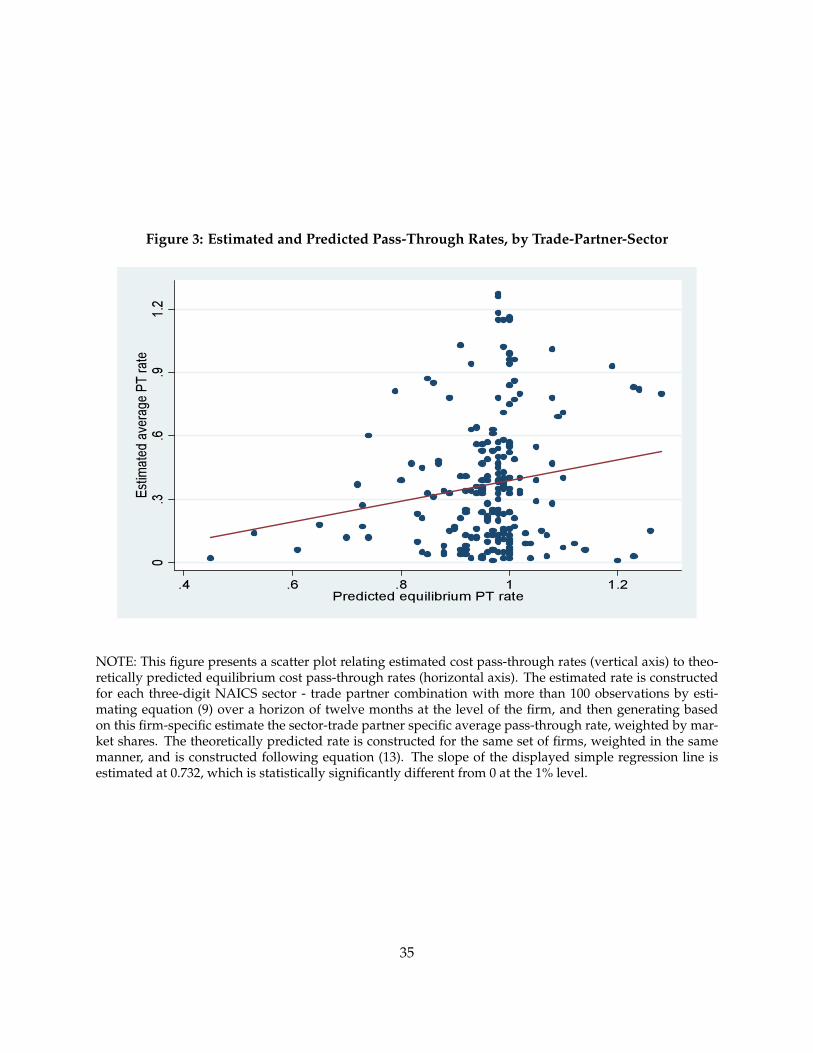
Figure 3: Estimated and Predicted Pass-Through Rates, by Trade-Partner-Sector
NOTE: This figure presents a scatter plot relating estimated cost pass-through rates (vertical axis) to theo-retically predicted equilibrium cost pass-through rates (horizontal axis). The estimated rate is constructedfor each three-digit NAICS sector - trade partner combination with more than 100 observations by esti-mating equation (9) over a horizon of twelve months at the level of the firm, and then generating basedon this firm-specific estimate the sector-trade partner specific average pass-through rate, weighted by mar-ket shares. The theoretically predicted rate is constructed for the same set of firms, weighted in the samemanner, and is constructed following equation (13). The slope of the displayed simple regression line isestimated at 0.732, which is statistically significantly different from 0 at the 1% level.
35
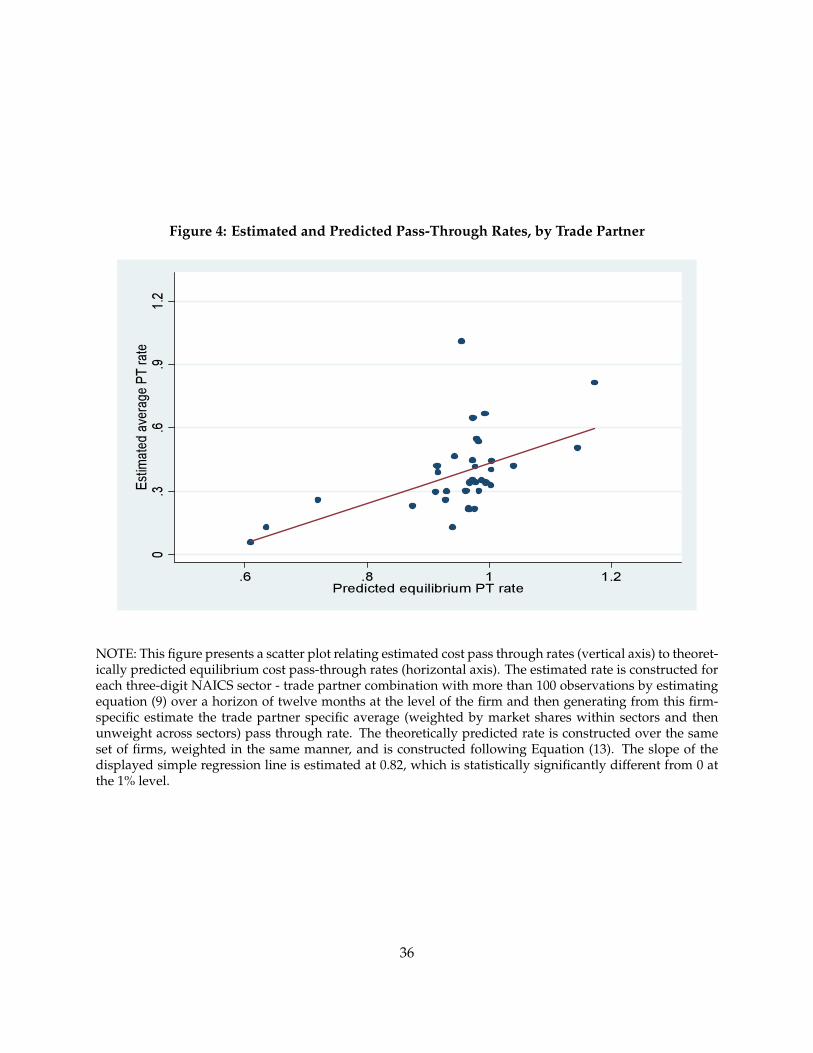
Figure 4: Estimated and Predicted Pass-Through Rates, by Trade Partner
NOTE: This figure presents a scatter plot relating estimated cost pass through rates (vertical axis) to theoret-ically predicted equilibrium cost pass-through rates (horizontal axis). The estimated rate is constructed foreach three-digit NAICS sector - trade partner combination with more than 100 observations by estimatingequation (9) over a horizon of twelve months at the level of the firm and then generating from this firm-specific estimate the trade partner specific average (weighted by market shares within sectors and thenunweight across sectors) pass through rate. The theoretically predicted rate is constructed over the sameset of firms, weighted in the same manner, and is constructed following Equation (13). The slope of thedisplayed simple regression line is estimated at 0.82, which is statistically significantly different from 0 atthe 1% level.
36

A APPENDIX: Proofs
Proof of Corollary 2. The expectation of the rate of equilibrium cost pass-through (5) is equal to
E [ECPTTP,k] = E
γTP
θli
∑jεNk,−TPsjαjθ
lj
eTP,jeTP,i
∑jεNksjαj
+γTP
θli
∑jεNk,TPsjαjθ
lj
∑jεNksjαj
+ αTP
=
γTPθl
i
∑jεNksjαj
E
[∑
jεNk,−TP
sjαjθljeTP,j
eTP,i
]+
γTP
θli
∑jεNk,TPsjαjθ
lj
∑jεNksjαj
+ αTP
To solve the above, we consider a Taylor approximation of f (X, Y) = X/Y with X = eTP,j andY = eTP,i both being distributed i.i.d. normally. It holds that
f (X, Y) ≈ X/Y + 1/Y(X− X)− X/Y2(Y− Y) + X/Y3(Y− Y)2 − 1/Y2(X− X)(Y− Y) + o(3+)
and, taking expectations results in
E f (X, Y) ≈ X/Y + X/Y3σ2Y − 1/Y2cov(X, Y).
Now, with X = β jeW + ej and Y = βieW + ei it holds that
cov(e(j), e(i)) = E[(βieW + ei − βiµW) ∗ (β jeW + ej − β jµW)] = βiβ jσ2W
and we thus have, for each country j:
E[eTP(j)]
E[eTP(i)]−
cov(eTP(i), eTP(j))(E[eTP(i)]
)2 +var(eTP(i))E[(eTP(j))](
E[eTP(i)])3 =
β j
βi
(1 +
σ2i
(µW βi)2
),
which proves Corollary 2.
Exchange Rate Pass-Through and Market Share under Alternative Demand StructuresWhat is the relation between Market Share and EPRT in the Melitz and Ottaviano (2008) frame-
work if firms take into account their effect on the toughness of competition? We review the Melitzand Ottaviano (2008) framework and extend it by this assumption.
Omitting k subscripts, and denoting by Nk the set of active firms (that we assume to be constantin the short run), with preferences over an outside good o and a set of differentiated varietiesindexed by i or j
U = qo + α ∑jεNk
qj −12
γ ∑jεNk
(qj)2 − 1
2η
(∑jεNk
qj
)2
.
With the price of qo normalized to one, this leads to demand for variety i of
qi = max[γ−1 (α− ηQ− pi) ; 0
]
37

where Q = ∑jεNkqj The maximization problem of the firm is:
maxpi
(pi − ci) γ−1 (α− ηQ− pi)
so that, if the firm does not take into account its effect on Q, the optimal price is given by
pi =12
ci +12(α− ηQ)
where Melitz and Ottaviano (2008) define cD ≡ α − ηQ as the cost of the marginally survivingfirm. Now, what is cost pass through of the individual firm? We note that in equilibrium Q =12
Nkα−∑jεNkcj
γ+ 12 Nkη
, so that
∂pi
∂ci=
12+
12
12 η
γ + 12 ηNk
.
It holds that 0.5 < ∂pi∂ci
< 1, and that the rate of cost pass-trough does not depend on thecost of production or the market share of firm i due to the fact with linear demand, every firm -irrespective of size - has the same effect on Q. Note however, that we measure ERPT in terms ofelasticities:
CPTi =∂pi
∂ci
ci
pi=
γ + 12 η (Nk + 1)(
γ + 12 ηNk
)+ c−1
i
(αγ + 1
2 η ∑jεNkcj
)The reason that pass-through is increasing in a firm’s cost and thus decreasing in a firm’s
market share is that cipi
is increasing in ci. As ci → 0, ERPT goes to 0. Note however, that dueto the quadratic formulation, even firms with ci = 0 do not have a market share of one. In thisframework, market share is equal to
si =qi pi
∑jεNkpjqj
=(α− ηQ)2 − (ci)
2
∑jεNk(α− ηQ)2 −
(cj)2 .
Alternative pass-through derivation:
38

CPTi = εpc =∂ ln pi
∂ ln ci
=∂ ln
(12 (e
ln ci + α− η 12
Nα−∑ eln ci
γ+ 12 ηN
))
∂ ln ci
=
(12 (ci − η 1
2−ci
γ+ 12 ηN
))
(12 (ci + α− η 1
2Nα−∑ ciγ+ 1
2 ηN))
=ci(γ + 1
2 ηN) + 12 ηci
(ci + α)(γ + 12 ηN)− η 1
2 (Nα−∑ ci)
=ci(γ + 1
2 ηN) + 12 ηci
ciγ + ci12 ηN + αγ + α 1
2 ηN − η 12 Nα + η 1
2 ∑ ci
=ci(γ + 1
2 ηN) + 12 ηci
ciγ + ci12 ηN + αγ + η 1
2 ∑ ci
=γ + 1
2 ηN + 12 η
γ + 12 ηN + 1
ciαγ + η 1
ci
12 ∑ ci
A.1 Under the large firm assumption with Cournot
Next, consider the same preferences but assume that firms compete in quantities and do taketheir effect on Q into account. We can rewrite demand as qi = γ−1 (α− η (qi + Q−i)− pi), whereQ−i = ∑jεNk,−i
qj. It holds thatpi = α− ηQ−i − (γ + η) qi,
i.e. the firm’s perceived demand is steeper if the effect on Q is taken into account. Note however,that the system retains is linearity already indicating that solutions will be similar as in the small-firm case considered in Melitz Ottaviano. The firm’s maximization problem is
maxqi
(α− ηQ−i − (γ + η) qi − ci) qi
implying pi =12 (α− ηQ−i) +
12 ci, i.e. instead of total consumption Q , what matters is consump-
tion from competing firms Q−i. Since Q−i = Q− qi, we can rewrite
pi =
12 (α− ηQ)
(1 + η
γ
)+ 1
2 ci
1 + 12
ηγ
39
and solve for Q = 12
αNk−∑jεNkcj
γ+ 12 η(Nk+1)
. The derivative of the price with respect to costs is again constant
∂p∗i∂ci
=12
γ + 12 η
(γ +
12 η (γ + η)
γ + 12 η (Nk + 1)
)
and the rate of pass-through is equal to
∂p∗i∂ci
ci
p∗i=
γ + 12 η (Nk + 1) + η 1
2
(1 + η
γ
)γ + 1
2 η (Nk + 1) +(
α(γ + 1
2 η)+ η 1
2 ∑jεNkcj
) (1 + η
γ
)c−1
i
,
that is, pass-through is uniformly increasing in ci.Alternative pass-through derivation:
CPTi = εpc =∂ ln pi
∂ ln ci
=
∂ ln(
12 (α−ηQ(eln ci ))(1+ η
γ )+12 eln ci
1+ 12
ηγ
)∂ ln ci
=
12 (1+
ηγ )(−η)( 1
2 (−ci)1
γ+ 12 η(N+1)
)+ 12 ci)
1+ 12
ηγ(
12 (α−ηQ)(1+ η
γ )+12 ci
1+ 12
ηγ
)
=
12 (1 +
ηγ )(−η)( 1
2 (−ci)1
γ+ 12 η(N+1)
) + 12 ci)
12 (α− ηQ)(1 + η
γ ) +12 ci
=12 ci[(1 +
ηγ )η(
12 ) + γ + 1
2 η(N + 1)]12 (α− ηQ)(1 + η
γ ) +12 ci
=ci[(1 +
ηγ )η(
12 ) + γ + 1
2 η(N + 1)]
(α− ηQ)(1 + ηγ ) + ci
B Appendix: Construction of Good-Specific Input Intensity
The WIOD is an extension of national input-output tables to the international dimension. It lists,for each country TP the dollar volume of imports by industry k from all trade partners and allsupplying industries. For example, it lists the dollar volume of imports that the US car industryimports from the Mexican textile industry. From this data, we construct the industry’s averageinput intensity of industry k in country TP by summing over input-imports from all countriesother than TP and all supplying industries l into country TP and industry k. We then divide by
40

the industry’s total variable costs.
θWIODTP,k =
∑cεC−TP ∑lεI Value Input Importsc,TP,k,l
Total Var Costk,TP
θWIODTP,k measures the average imported inputs intensity of industry k in TP. Amiti et al. (2012)
document a further key pattern in the data that we need to take into account: that firms of het-erogeneous productivity also differ in their imported input intensity. Since the exporting deci-sion, differences in input import intensity and market share (that determines the strength of thepricing-to-market response to cost shocks) are jointly determined and hence correlated, we needto take into account the heterogeneity in imported input intensity. For our purpose, we needto make two separate adjustments to account for the heterogeneity of imported input intensityacross firms. First, of all the imported input goods, we need to take into account that exportersand non-exporters differ in their imported input intensity. Second, of those imported inputs usedby exporters, we need to allocate the total to large and small exporters. We do these two ad-justments such that they match the micro-patterns of the Belgian data uncovered by Amiti et al.(2012) and in total sum up to the aggregate input usage in the World Input output tables database(WIOD).
The first adjustment reflects the fact that exporters are generally more imported input inten-sive than non-exporters. In the Belgian data of Amiti et al. (2012), actually 99.1% of all importedinputs are being used by exporters. These exporters also account for 85.8% of the total costs ofthe Belgian manufacturing sector. Thus, exporters are a factor 99.1%/85.8% = 1.156 as importedinput intensive as the total manufacturing sector.17
The second adjustment is to allocate the imported inputs across the various exporters fromeach trade partner. We postulate that the share of imported inputs is increasing in a firm’s marketshare.
θImInpi,TP = kTP,kmγ
i ΨTP,k
where we choose γ as 0.3 such that we match the distribution of input intensities in Amiti et al.(2012) (see the distribution reported in Table Table 1 as well as Figure 2). The industry-tradepartner specific constant kTP,k is chosen such that we match the industry’s average input intensityin the WIOD (adjusted by 1.156):
∑iεNTP,k
θImInpi,TP si,k = 1.156 ∗ θWIOD
TP,k
Summing up, we account for the input usage by heterogeneous firms originating from differ-ent countries and industries in two steps: for each trade partner and industry (that is, cars fromGermany), we know the total value of imported inputs as a fraction of that industry’s costs. For
17These numbers are calculated from Table 2 of Amiti et al. (2012) that splits up all firms into three groups (nonex-porters, exporters with above median imported input intensity, exporters with below median imported input intensity).Taking into account the average wage bill per employee and the number of employees as well as total material costsimplies the average costs per firm of each of the three groups. Then, taking into account the size of the three groups(76.3% non-exporters and 23.7% exporters spilt up in to equally sized subgroups of above and below median input in-tensity) yields that 85.8% of total variable costs are created by exporters. Finally, taking into account the average inputintensity of the two groups (36.8%, 17.3% and 1.6%, respectively) and again the average variable costs per firm as wellas the size of the three groups implies that 99.1% of all intermediate goods imports are imported by exporters.
41

example, that ratio could be 24%. We apply a correction factor of 1.156 to this figure as exportersare generally more input-intensive than the industry is in general. We then allocate the inputsimported by exporters over the exporters according to their market shares.
42
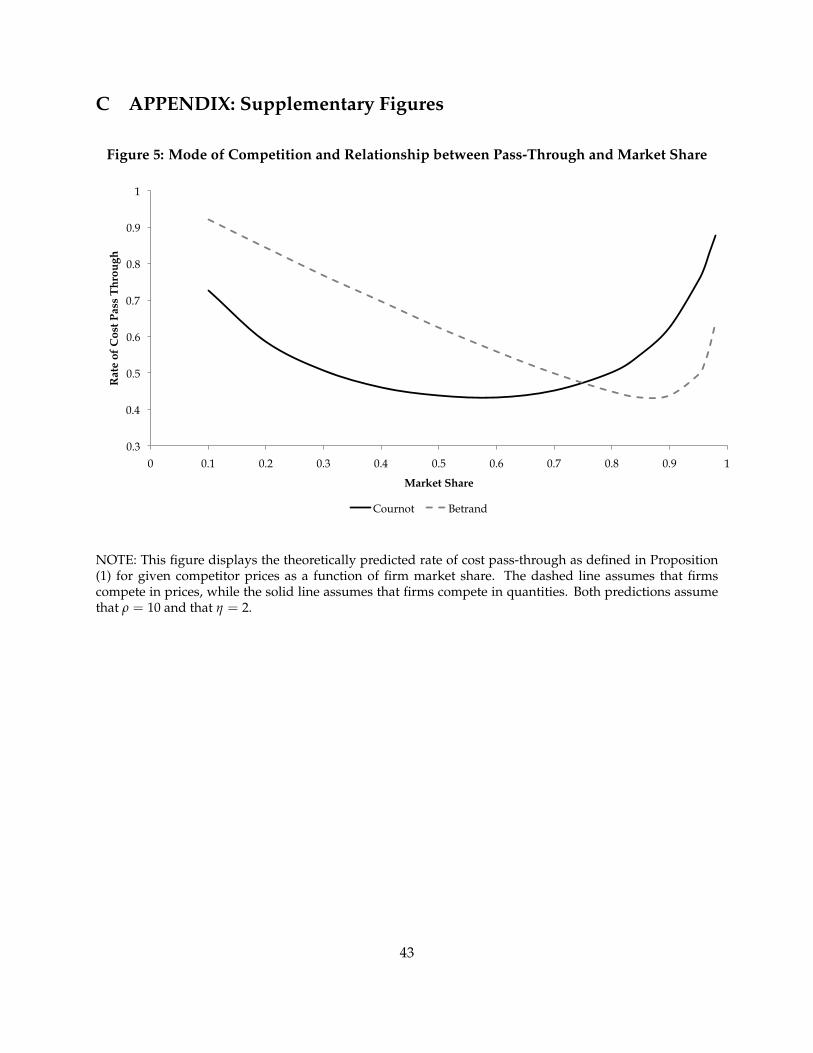
C APPENDIX: Supplementary Figures
Figure 5: Mode of Competition and Relationship between Pass-Through and Market Share
0.3
0.4
0.5
0.6
0.7
0.8
0.9
1
0 0.1 0.2 0.3 0.4 0.5 0.6 0.7 0.8 0.9 1
Rat
e of
Cos
t Pas
s T
hro
ugh
Market Share
Cournot Betrand
NOTE: This figure displays the theoretically predicted rate of cost pass-through as defined in Proposition(1) for given competitor prices as a function of firm market share. The dashed line assumes that firmscompete in prices, while the solid line assumes that firms compete in quantities. Both predictions assumethat ρ = 10 and that η = 2.
43