Embed Size (px)
Citation preview
Atanu.Das et. al. / International Journal of Engineering Science and Technology Vol. 2(6), 2010, 1923-1934
Market Risk Beta Estimation using Adaptive Kalman Filter
Atanu Das1*, Tapan Kumar Ghoshal2
1Department of CSE & IT, Netaji Subhash Engineering College, Garia, Kolkata-152, INDIA. 2 Department of Electrical Engineering, Jadavpur University, Kolkata-32, INDIA. *Corresponding Author: e-mail: [email protected], Tel +91-9432911685.
Abstract
Market risk of an asset or portfolio is recognized through beta in Capital Asset Pricing Model (CAPM). Traditional estimation techniques emerge poor results when beta in CAPM assumed to be dynamic and follows auto regressive model. Kalman Filter (KF) can optimally estimate dynamic beta where measurement noise covariance and state noise covariance are assumed to be known in a state-space framework. This paper applied Adaptive Kalman Filter (AKF) for beta estimation when the above covariances are not known and estimated dynamically. The technique is first characterized through simulation study and then applied to empirical data from Indian security market. A modification of the used AKF is also proposed to take care of the problems of AKF implementation on beta estimation and simulations show that modified method improves the performance of the filter measured by RMSE. Keywords: market risk, beta, estimation, Adaptive Kalman Filter.
1. Introduction
According to Capital Asset Pricing Model (CAPM) [1] if the market portfolio is efficient, then the i-th asset return is described by imiii rr where ir and mr is the returns of the i th asset and market index respectively,
i is the risk free rate of return (risk free interest), i is the random error term (with variance 2 ), i is the
relationship of the asset return with market index return, or in other words, it is the sensitivity of the i-th asset return with respect to the market. i can be expressed as a ratio of covariance ( im ) between specific asset returns and
market index returns and variance ( 2m ) of market index returns. i.e.
2m
imi
[2, 3]. If asset returns is
completely uncorrelated to the market returns i.e. 0i , then according to CAPM asset return will be equal to the
risk-free rate of return. The CAPM changes concept of the risk from the volatility to beta. The portfolio beta (i.e
p ) is calculated as weighed average of betas of the individual assets in the portfolio where weights being identical
to those that define the portfolio [2]. Good number of techniques are already in place for estimating beta assuming it to be a constant and have been
discussed in the section of beta estimation techniques. That section also illustrates the dynamic beta estimation literature. The next challenge is to identify the appropriate autoregressive model of time varying beta and has been explained in the section models for beta dynamics. Next task is to estimate beta which has been addressed by [4, 5] using KF [6, 7, 4]. KF application for beta estimation assumes the state noise covariance and measurement noise covariance to be known. However in reality these are not ensued always. To deal with such situations when those parameters are not known and estimated during filtering is addressed by [8] together with its references and citations. The techniques are popularly known as Adaptive Kalman Filter (AKF). [9] has recently proposed an AKF technique which has been used and modified in this work for dynamic beta estimation. Application of AKF for beta estimation emerge measurement covariance to be negative for small true values of the measurement covariance together with some relation with state noise covariance. This work investigates the possibility of modifying the AKF by reinitializing the measurement noise covariance when it becomes negative. Simulations are carried out to confirm the efficiency of the modified technique.
The rest of the paper is organized as follows. The next section briefly described the possible models for describing beta dynamics in the literature. The third section presents the beta estimation techniques in the literature as well as those which have been characterized. The fourth section illustrates the simulation and empirical investigation techniques. The results of the investigations are articulated in the fifth section. The paper is ended with a conclusion.
ISSN: 0975-5462 1923
Atanu.Das et. al. / International Journal of Engineering Science and Technology Vol. 2(6), 2010, 1923-1934
2. Models for Beta Dynamics
[10, 11 12, 4, 13, 14] and many others references there in studied the nature of beta with respect to time evolution. Empirical investigations in the above literatures proved that beta is not a constant as assumed in the CAPM. They tested the fact in the developed markets like UK, USA Japan etc. as well as in the developing markets like India, China etc. Some of these papers argued GARCH models [13, 15, 14] and some advocated stochastic [10, 13] nature (models) for characterizing time-varying beta.
[16 & 17] proved that structural models are superior and most accurate among the complex forecasting methods especially for long forecasting horizons (like annually, quarterly and monthly) and seasonal data. [18, 19] argued that autoregressive process is indeed an appropriate and parsimonious model of beta variations with evidence from Australian and Indian equity return data respectively. It has been observed [12] that there are four admired stochastic model for explaining the dynamics of beta: random coefficient model (attributed to [20] and explained in [36 & 37])
expressed as t , random walk model (attributed to [21, 22]) expressed as ttt 1 , ARMA (1,1)
(auto regressive moving average) beta model [12] expressed as 11 tttt , and mean reverting model
(attributed to [23, 11, 13, 15]) expressed as ttt )( 1 , where and is the speed parameter,
tends to go back (revert) towards and t is the noise term (with variance 2 ). [24 & 25] extended the mean
reverting model with name moving mean model by adding a new constraint given by ttt 1 where t is
the noise component with variance 2 . [12, 4 and 26 have shown that mean reverting model outperform over others
comparatively simple models with suitable assumptions where as [15] proved that mean reverting model is superior than GARCH beta models through simulation study. 3. Beta Estimation Techniques
Literature shows that there have been quite a number of techniques for beta estimation: OLS [5, 4, 15], GLS [27], KF [6, 12, 4, 26, 14], Adaptive KF [28]. [27] compared GLS and KF for purpose of estimation of non-stationary beta parameter in time varying extended CAPM. [19, 29, 30] used modified KF for estimating daily betas with high frequency Indian data exhibiting significant non-Gaussianity in the distribution of beta. [31 & 32] approached to estimate time varying beta using KF and Quadratic Filter. [33] integrated realized beta as function of realized volatility [34, 35] in a unified framework. The present work first applied an AKF for the dynamic beta estimation using state space model where measurement noise covariance and state noise covariance are not known and estimated during filtering. A small modification of the AKF is proposed to take care of the situations arises by characterizing AKF for beta estimation.
The Kalman filter is based on the representation of the dynamic system with a state space regression modeling the beta dynamics through an autoregressive process. The state-space representation of the dynamics of the Sharpe Diagonal Model is given by the following system of equations
titmiiti RR ,,, (1a)
tititti T ,1,, (1b)
The above system can be represented in a more general way as
ttttt wdxHy (2a)
ttttt cxTx 1 (2b)
tH is known constant or time varying coefficients, the return of index stock for our application, tT is the state
transition matrix and td is known. ty is the return of the stock and tx is the vector of state variables. Finally tw is a
vector of serially uncorrelated disturbances with mean zero and covariance tR and t is identified with a vector of
serially uncorrelated disturbances with mean zero and covariance tQ . In our application the system matrices R , T ,
d and c are all independent of time and so can be written without a subscript. If it is assumed that the parameters of the above system of equations are known then KF algorithm [6, 7, 4] can
estimate the dynamic beta (state). [9] proposed a improved AKF technique over [8] for estimation of states when Q and R are unknown and assumed to be dynamic over time known as Adaptive Kalman Filter for GPS/INS navigation problems. In this method innovation sequence tv (Algo 3.1 Step 4) is used for calculation of Q and R in
the following way:
ISSN: 0975-5462 1924
Atanu.Das et. al. / International Journal of Engineering Science and Technology Vol. 2(6), 2010, 1923-1934
'1|
1
0
'11 tttt
m
iititmt HPHvvR
(3)
where m is the estimation window size and 1 tt QQ where '
1|
1
0
'1
tttt
t
m
iititm
HPH
Rvv
(4)
3.1 AKF Algorithm:
Step 1: Set the values of T & H and initial value of x, P, Q & R. Step 2: Calculate State Prediction: cTxx ttt 1|
Step 3: Calculate State Covariance Prediction: tttt QTTPP '
1|
Step 4: Calculate Innovation: dxHyv ttttt 1|
Step 5: Calculate Measurement Noise Covariance Update: tttttt RHPHF '
1|
Step 6: Calculate State update: t
ttttttt F
vHPxx
'1|
1|
Step 7: Calculate State Covariance update: t
ttttttttt F
PHHPPP
1|'
1|1|
Step 8: Update Measurement Noise Covariance: '1|
1
0
'11 tttt
m
iititmt HPHvvR
, where m is the estimation
window size
Step 9: Update State Noise Covariance: tt QQ 1 where '
1|
1
0
'1
tttt
t
m
iititm
HPH
Rvv
3.2 Modified AKF Algorithm:
Step 1: Replicate Step 1 to 8 of the above algorithm. Step 2: Check whether measurement noise covariance R is negative. Step 3: If R found negative set the value of R to its initial value.
4. Investigations
Simulation Investigation: Simulation experiments are conducted to realize the optimal window size m of adaptive estimation of Q and R. The simulation also characterizes the system with synthetic data. The following assumptions are imposed while experimenting: Truth is generated with the following: T=1, 0 =0.5, i =0.02,
mtr = 150001,...,1,1 x ; Three types of situations are considered: Q is constant, Q is exponentially increasing and Q is
exponentially decreasing while generating the truth. Several initial guess values of the x, Q and R of the filter are considered and estimation performances are reported in the result section.
Empirical Investigations: Daily closing values of three popular NSE (of India) indices are used to characterize the system's empirical behavior. The time period considered is 1st January, 2001 to 31st December, 2007 (total of 1757 days data). NSE Nifty values are used as market portfolio values which is used for calculating the market return ( mtr ). Dynamic beta values of IT and Bank indices of NSE are separately estimated. These two indices values are
taken in to account to calculate portfolio return ( itr ) because these two indices are suitably designed portfolio of IT
and Bank equities respectively. According to the algorithmic demands no zero returns are allowed. A small number 0.00001 replaces the zero values when zero return appeared.
ISSN: 0975-5462 1925
Atanu.Das et. al. / International Journal of Engineering Science and Technology Vol. 2(6), 2010, 1923-1934
5. Results
5.1 Results of the Simulation Experiments:
To find the optimal window size m: The following table 1 gives the RMSE of beta estimation for different values of m with initial guess of R=0.9,
Q=0.1. Table 1: RMSE of beta estimation m 50 100 200 300 400 500 RMSE 0.7151 0.6871 0.6959 0.7180 0.7044 0.7020 The following table 2 gives the RMSE of Q estimation for different values of m with initial guess of R=0.9,
Q=0.1. Table 2: RMSE of Q estimation m 50 100 200 300 400 500 RMSE 0.3531 0.2202 0.1559 0.1548 0.1657 0.1673 To find the optimal and feasible value of m with initial guess R=0.9 the following table 3 gives the RMSE of beta
estimation for different values of m Table 3: RMSE of beta estimation for different constant True Q m 50 100 200 300 400 500 1000
0Q=0.05
NA NA NA 0.5038 0.4983 0.5025 0.5254
0Q=0.5
NA NA 0.4887 0.4892 0.4643 0.4787 0.4929
0Q=5
NA NA NA 0.5128 0.5023 0.5153 0.5507
The following table 4 gives the RMSE of Q estimation for different values of m Table 4: RMSE of Q estimation for different constant True Q M 50 100 200 300 400 500 1000
0Q=0.05
NA NA NA 0.1137 0.1316 0.1349 0.1620
0Q=0.5
NA NA 0.0826 0.0675 0.0549 0.0493 0.1034
0Q=5
NA NA NA 1.1215 1.2999 1.4606 2.0964
To check the Q and beta estimation performance the following figures 1 & 2 are generated with window size 300.
The initial guess supplied to the filter is Q=5.
ISSN: 0975-5462 1926

Atanu.Das et. al. / International Journal of Engineering Science and Technology Vol. 2(6), 2010, 1923-1934
Fig. 1: Q estimation performance where truth is generated with Q=0.5 (Constant) and, and initial guess Q=5, R=0.9, RMSE=1.1140
Fig. 2: Beta estimation performance where truth is generated with Q=0.5 (Constant) and initial guess Q=5, R=0.9, RMSE=0.7049.
Figure 3 and 4 illustrate the Q and beta estimation performance with initial guess Q=0.05 and R=0.9.
Fig. 3: Q estimation performance where truth is generated with Q=0.5 (Constant) and R=0.9, and initial guess Q=0.05, RMSE=0.1597.
ISSN: 0975-5462 1927
Atanu.Das et. al. / International Journal of Engineering Science and Technology Vol. 2(6), 2010, 1923-1934
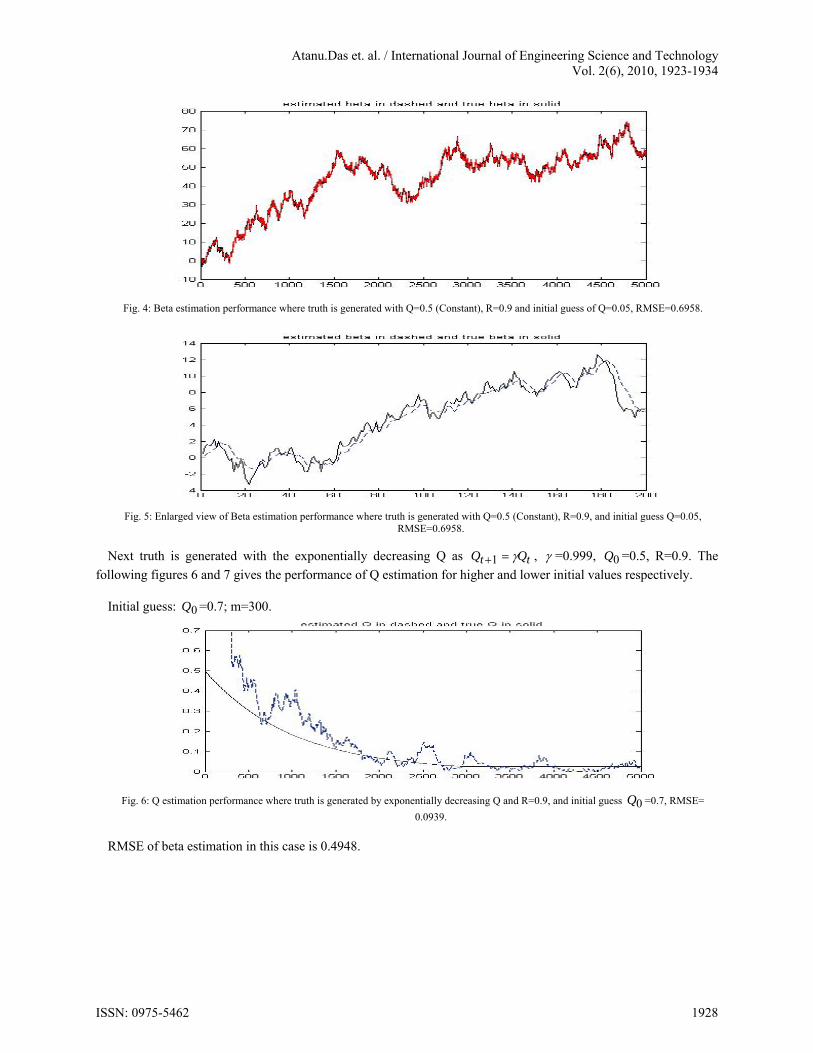
Fig. 4: Beta estimation performance where truth is generated with Q=0.5 (Constant), R=0.9 and initial guess of Q=0.05, RMSE=0.6958.
Fig. 5: Enlarged view of Beta estimation performance where truth is generated with Q=0.5 (Constant), R=0.9, and initial guess Q=0.05,
RMSE=0.6958.
Next truth is generated with the exponentially decreasing Q as tt QQ 1 , =0.999, 0Q =0.5, R=0.9. The
following figures 6 and 7 gives the performance of Q estimation for higher and lower initial values respectively. Initial guess: 0Q =0.7; m=300.
Fig. 6: Q estimation performance where truth is generated by exponentially decreasing Q and R=0.9, and initial guess 0Q =0.7, RMSE=
0.0939.
RMSE of beta estimation in this case is 0.4948.
ISSN: 0975-5462 1928
Atanu.Das et. al. / International Journal of Engineering Science and Technology Vol. 2(6), 2010, 1923-1934
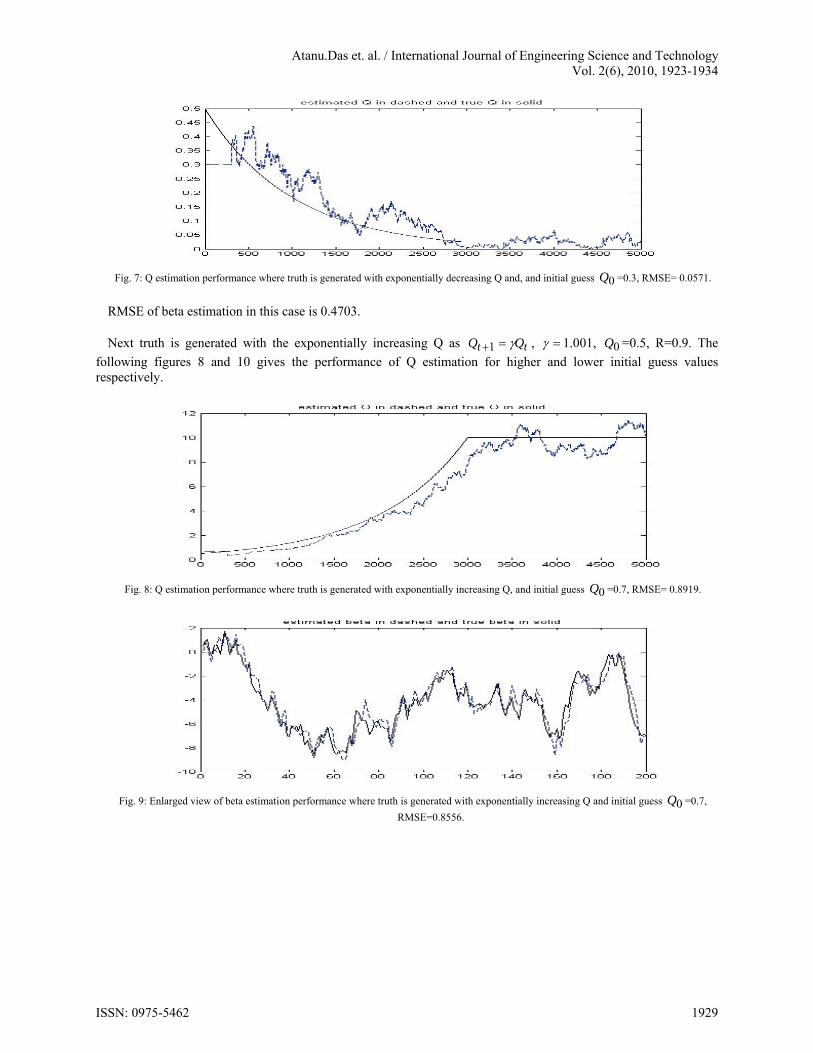
Fig. 7: Q estimation performance where truth is generated with exponentially decreasing Q and, and initial guess 0Q =0.3, RMSE= 0.0571.
RMSE of beta estimation in this case is 0.4703. Next truth is generated with the exponentially increasing Q as tt QQ 1 , 1.001, 0Q =0.5, R=0.9. The
following figures 8 and 10 gives the performance of Q estimation for higher and lower initial guess values respectively.
Fig. 8: Q estimation performance where truth is generated with exponentially increasing Q, and initial guess 0Q =0.7, RMSE= 0.8919.
Fig. 9: Enlarged view of beta estimation performance where truth is generated with exponentially increasing Q and initial guess 0Q =0.7,
RMSE=0.8556.
ISSN: 0975-5462 1929

Atanu.Das et. al. / International Journal of Engineering Science and Technology Vol. 2(6), 2010, 1923-1934
` Fig. 10: Q estimation performance where truth is generated exponentially increasing Q, and initial guess 0Q =0.3, RMSE=0.9714.
Fig. 11: Enlarged view of beta estimation performance where truth is generated with exponentially increasing Q and initial guess 0Q =0.3,
RMSE=0.8594.
To find the optimal value of window size m when Q is of exponentially changing nature the following table 5 & 6
is constructed where initial guess of R=0.9. Table 5: RMSE of beta estimation for exponentially decreasing Q m 50 100 200 300 400 500 1000
0Q=0.05
0.8518 0.8852 0.8757 0.8697 0.8914 0.8961 0.9634
0Q=0.5
0.8506 0.8614 0.8512 0.8499 0.8651 0.8653 0.8749
0Q=5
0.8701 0.8494 0.8678 0.8498 0.8507 0.8638 0.8827
Table 6: RMSE of beta estimation for exponentially increasing Q m 50 100 200 300 400 500 1000
0Q=0.05
1.6005 1.4220 0.7716 0.7338 0.7024 0.9614 1.3986
0Q=0.5
1.6132 1.2983 0.7921 0.7788 0.7347 0.9086 1.2919
0Q=5
1.8404 1.4160 1.1124 1.2656 1.6856 1.7089 2.2345
For m greater than 60 the estimator is working without problem but for m=50 and less some time it is not working in the above case. So it seems while using such estimator the chosen window size should preferably be greater than 60 and should not be chosen less than 50.
The following table 7, 8 and 9 illustrate the performance of modified AKF in comparison to AKF where true R is 0.01.
ISSN: 0975-5462 1930

Atanu.Das et. al. / International Journal of Engineering Science and Technology Vol. 2(6), 2010, 1923-1934
Table 7: RMSE of beta estimation using AKF and modified AKF where initial guess for R=0.01 Q 0.1 0.2 0.3 0.4 0.5 0.6 0.7 0.8 0.9 1.0 AKF 0.15
51 0.58
54 0.57
52 0.43
81 0.83
00 0.82
58 1.22
83 0.82
34 2.47
52 2.66
55 Modified AKF
0.0980
0.1004
0.1008
0.1023
0.1069
0.1045
0.1068
0.1041
0.1040
0.1135
Table 8: RMSE of beta estimation using AKF and modified AKF where initial guess for R=0.1 Q 0.1 0.2 0.3 0.4 0.5 0.6 0.7 0.8 0.9 1.0 AKF 0.15
02 0.27
20 0.34
74 0.48
53 0.33
69 0.45
25 0.53
87 1.26
18 1.06
02 1.76
79 Modified AKF
0.1316
0.1370
0.1356
0.1298
0.1337
0.1273
0.1282
0.1262
0.1232
0.1246
Table 9: RMSE of beta estimation using AKF and modified AKF where initial guess for R=0.001 Q 0.1 0.2 0.3 0.4 0.5 0.6 0.7 0.8 0.9 1.0 AKF 0.13
62 0.18
00 0.33
61 0.69
86 0.52
52 0.82
63 0.43
04 0.60
17 1.89
13 1.41
80 Modified AKF
0.0973
0.1022
0.1036
0.1038
0.1053
0.1031
0.1105
0.1129
0.1116
0.1131
5.2 Results of Empirical Investigations
5.2.1 Investigation with IT Index of NSE India:
Fig. 12: Estimated beta for the IT index of NSE-India with window size 300
Fig. 13: Estimated Q for the IT index of NSE-India with window size 300 and initial guess for Q=0.1
It has been noticed that changes (or adaptation) take place at least at the 12th decimal places in the sequence of estimated Q values.
ISSN: 0975-5462 1931

Atanu.Das et. al. / International Journal of Engineering Science and Technology Vol. 2(6), 2010, 1923-1934
Fig. 14: Estimated R for the IT index of NSE-India with window size 300 and initial guess for R=0.1
5.2.2 Investigation with Bank Index of NSE India:
Fig. 15: Estimated beta of the Bank index of NSE-India with window size 300
Fig. 16: Estimated Q for the Bank index of NSE-India with window size 300 and initial guess for Q=0.1
Fig. 17: Estimated R for the Bank index of NSE-India with window size 300 and initial guess for R=0.1
Interestingly the Q adaptation takes place at around 12th decimal place even though Q is less than 100000. For initial value Q> 100000 almost, Q did not change over time. Though R started from may be 100, it actually concentrates around 0.01 for first 1200 days. Later it suddenly jumped upward.
ISSN: 0975-5462 1932
Atanu.Das et. al. / International Journal of Engineering Science and Technology Vol. 2(6), 2010, 1923-1934
4. Conclusions
This work characterizes the AKF technique for beta estimation. The characterization is first carried out through simulation study. It has been found that measurement noise covariance (R) become negative for some combination of true Q (around 1) and true R (small like 0.01). The AKF technique is modified to take care of such situations. The simulation experiments show that modified AKF can efficiently estimate the beta and Q as exhibited by the RMSE results. Another challenge which has been addressed is identifying the optimal window size for adaptive estimation of beta. The simulation experiments revealed that estimation window size should preferably be of 300 time steps. References:
[1] William F. Sharpe, “Capital Asset Prices: A Theory of Market Equilibrium under Conditions of Risk”, The Journal of Finance, Vol. 19, No. 3, pp. 425-442, Sep, 1964.
[2] David G. Luenberger, Investment Science (Hardcover), Oxford University Press, 1998. [3] William F. Sharpe, Gordon J. Alexxander and Jeffery V. Bailey, Investment, 6th Ed., Prentice-Hall of India, 2005. [4] Andrea Berardi, Stefano Corradin, Cristina Sommacampagna, “Estimating Value at Risk with the Kalman Filter”, Working Paper,
Università di Verona, available at http://www.icer.it/workshop/Berardi_ Corradin_Sommacampagna.pdf, 2002. [5] Cristina Sommacampagna, “Estimating Value at Risk with the Kalman Filter”, Working Paper, available at
http://www.gloriamundi.org/picsresources/cs1.pdf, 2002. [6] R. Kalaba and L. Tesfatsion, “A further note on flexible least squares and Kalman filtering”, Journal of Economic Dynamics and Control,
Volume 14, Issue 1, pp. 183-185 February 1990. [7] Brown, R., and Hwang, P., Introduction to Random Signals and Applied Kalman Filtering, John Wiley & Sons, New York, 1997. [8] R. K. Mehra, “Approaches to adaptive filtering,” IEEE Trans. Automat. Contr., Vol.17, No.5, pp. 693-698, Oct. 1972. [9] W. Ding, J. Wang, and C. Rizos, “Improving adaptive Kalman estimation in GPS/INS integration,” J. Navigation, Vol. 60, No.3,
pp.517-529, Sep. 2007. [10] Bill Mcdonald, “Beta Non-Stationarity: An Empirical Test of Stochastic Forms”, Working Paper, University of Notre Dame, 1982. [11] T. Bos; P. Newbold, “An Empirical Investigation of the Possibility of Stochastic Systematic Risk in the Market Model”, The Journal of
Business, Vol. 57, No. 1, Part 1, pp. 35-41, Jan., 1984. [12] Juan Yao, Jit Gao, “Computer-Intensive Time-Varying Model Approach to the Systematic Risk of Australian Industrial Stock Returns”,
Working Paper, Finance Discipline. School of Business, The University of Sydney, NSW, Australia, 2001. [13] Taufiq Choudhry, “The Stochastic Structure of the Time-Varying Beta: Evidence From UK Companies”, The Manchester School, Vol.70
No.6, December 2002. [14] Sascha Mergner, Jan Bulla, “Time-varying Beta Risk of Pan-European Industry Portfolios: A Comparison of Alternative Modeling
Techniques”, available at http://ideas.repec.org/p/wpa/wuwp_/ 0509024.html, October 25, 2005. [15] Gergana Jostova, Alexander Philipov, “Bayesian Analysis of Stochastic Betas”, Working Paper, Department of Finance, School of
Business, George Washington University, July 2, 2004. [16] Harvey, A.C., Forecasting Structural time Series model and forecasting, Cambridge University Press, 1989. [17] Rick L. Andrews, “Forecasting Performance of Structural Time Series Models”, Journal of Business & Economic Statistics, Vol. 12, No.
1, pp. 129-133. 1994. [18] Robert W. Faff, John H.H. Lee And Tim R.L. Fry, “Time Stationarity of Systematic Risk: Some Australian Evidence”, Journal Of
Business Finance & Accounts, 19(2), 0306-686x, January 1992. [19] Syed Abuzar Moonis, Susan Thomas, Ajay Shah, “Using high–frequency data to measure conditional beta”, Working Paper, IGIDR,
Mumbai, India, May 2001. [20] Fabozzi, F. J. & Francis, J. C. “Beta as a random coefficient”, Journal of Financial and Quantitative Analysis, 13(1), 101-116, 1978. [21] Sunder, S., “Stationarity of market risk: random coefficient test for individual stocks”, Journal of Finance, 35(4), 883-896, 1980. [22] LaMotte, L. R. & McWhorter, A., “Testing for nonstationarity of market risk: An exact test and power considerations”, Journal of the
American Statistical Association, 73(364), 816-820, 1978. [23] Rosenberg, B., “The behaviour of random variables with nonstationary variance and the distribution of security prices”, Unpublished
paper: Research Program in Finance, Working paper 11, Graduate School of Business Administration, University of California, Berkeley, 1982.
[24] Curt Wells, “Variable betas on the Stockholm Exchange 1971-1989”, Applied Financial Economics, 4:1, 75-92, available at http://dx.doi.org/10.1080/758522128, 01 February 1994.
[25] Wells. C., The Kalman Filter in Finance, Kluwer Academic Pub., 1996. [26] Ajay Shah and Syed Abuzar Moonis, “Testing for time variation in beta in India”, Journal of Emerging Markets Finance, 2(2):163–180,
May–August, 2003. [27] Jayanth Rama Varma and Samir K Barua, “Estimation Errors And Time Varying Betas In Event Studies A New Approach”, Working
Paper 759, Indian Institute Of Management, Ahmedabad, July 1988. [28] Rick Martinelli, “Market Data Prediction with an Adaptive Kalman Filter”, Haiku Laboratories Technical Memorandum 951201,
available at http://www.haikulabs.com/kalman.htm, 1995. [29] Moonis, S. A. & Shah Ajay, “A natural experiment in the impact of interest rates on beta. Technical report, IGIDR, from
http://www.mayin.org/ajayshah/ans-resli3.html, 2002. [30] Ajay Shah and Syed Abuzar Moonis. Testing for time variation in beta in India. Journal of Emerging Markets Finance, 2(2):163–180,
May–August 2003 [31] Massimo Gastaldi and Annamaria Nardecchia, “The Kalman Filter Approach For Time-Varying β Estimation”, Systems Analysis
Modelling Simulation, Vol. 43, No. 8, pp. 1033–1042, August 2003.
ISSN: 0975-5462 1933

Atanu.Das et. al. / International Journal of Engineering Science and Technology Vol. 2(6), 2010, 1923-1934
[32] M. Gastaldi, A. Germani1, & A. Nardecchia, “The use of quadratic filter for the estimation of time-varying β”, WIT Transactions on Modelling and Simulation, Vol 43, www.witpress.com, ISSN 1743-355X (on-line) Computational Finance and its Applications II 215, doi:10.2495/CF060211, 2006.
[33] Torben G. Andersen, Tim Bollerslev, Francis X. Diebold, and Jin (Ginger) Wu, “A Framework for Exploring the Macroeconomic Determinants of Systematic Risk”, American Economic Review Papers and Proceedings, Session ID 71 (Financial Economics, Macroeconomics, and Econometrics: The Interface), 2005.
[34] Asai, M., M. McAleer, Marcelo C. Medeiros, “Asymmetry and Leverage in Realized Volatility”, EI 2008-31, available at http://publishing.eur.nl/ir/repub/ asset/13904/EI2008-31.pdf, 2008.
[35] Atanu Das, Tapan Kumar Ghoshal, Pramatha Nath Basu, “A Review on Recent Trends of Stochastic Volatility Models”, International Review of Applied Financial Issues and Economics, Vol 1, No 1, December, 2009.
[36] Brooks, R. D., Faff, R. W. & Lee, J. H., “The form of time variation of systematic risk: Some Australian evidence”, Applied Financial Economics, 2(4), 269-283, 1992.
[37] Simonds, R. R., LaMotte, L. R. & McWhorter, A., “Testing for nonstationarity market risk exact test and power considerations”, Journal of Financial and Quantitative Analysis, 21(2), 209-220, 1986.
Biographical notes
Atanu Das was born in April 6th, 1975 and received his B.Sc. (Hons) degree in Math, M.Sc. Degree in Statistics from The University of Burdwan, WB, India, and ME degree in Multimedia Development from Jadavpur University, Kolkata, India in the years 1996, 1998 and 2002 respectively. Presently he is pursuing his Ph.D. (Engg.) at Jadavpur University, Kolkata India in the field of estimation and filtering of dynamic systems. He is working as an Asst. Professor, CSE / IT, and In-charge, IT at Netaji Subhash Engineering College under West Bengal University of Technology, Kolkata, India. He has many publications at International and National Journals and Conference Proceedings to his credit. His research interest includes education technology, multimedia systems and applications development, beside stochastic estimation and filtering of financial systems. Dr. Tapan Kumar Ghoshal was born in June 8th, 1945. He received his BEE & MEE degree from Jadavpur University, Kolkata, India and Ph.D.(Engg) in Flight Control from Cranfield University, UK. He is now working as a Professor in the Dept. of Electrical Engineering at Jadavpur University, Kolkata. His research interest includes Control System Engg., Aerospace Control, Guidance and Navigation, Signal Processing including Estimation and Filtering, Software Engineering & Engineering Risk Analysis.
ISSN: 0975-5462 1934