Embed Size (px)
Citation preview

Ma
rk
et
Re
po
rt
Se
rie
s
Coal 2O18Analysis and Forecasts to 2O23

Analysis and Forecasts to 2O23
Ma
rk
et
Re
po
rt
Se
rie
s
Coal 2O18

INTERNATIONAL ENERGY AGENCY
The IEA examines the full spectrum of energy issues including oil, gas and coal supply and demand, renewable energy technologies, electricity markets, energy efficiency, access
to energy, demand side management and much more. Through its work, the IEA advocates policies that will enhance the reliability, affordability and sustainability of energy in its 30 member countries, 8 association countries and beyond.
The four main areas of IEA focus are:
n Energy Security: Promoting diversity, efficiency, flexibility and reliability for all fuelsand energy sources;
n Economic Development: Supporting free markets to foster economic growth andeliminate energy poverty;
n Environmental Awareness: Analysing policy options to offset the impactof energy production and use on the environment, especially for
tackling climate change and air pollution; and
n Engagement Worldwide: Working closely with associationand partner countries, especially major emerging
economies, to find solutions to shared energy and environmental
concerns.
IEA member countries:
Australia Austria
Belgium Canada
Czech RepublicDenmark
EstoniaFinland
FranceGermany
GreeceHungary
Ireland Italy
JapanKoreaLuxembourgMexicoNetherlandsNew Zealand NorwayPolandPortugalSlovak RepublicSpainSwedenSwitzerland
TurkeyUnited Kingdom
United States
The European Commission also participates in
the work of the IEA.
Please note that this publication is subject to specific restrictions that limit its use and distribution.
The terms and conditions are available online at www.iea.org/t&c/
© OECD/IEA, 2018
International Energy Agency Website: www.iea.org
Together
SecureSustainable

FOREWORD
COAL 2018 3
FOREWORD
The International Energy Agency’s (IEA) coal market report traditionally completes our annual cycle of publications. It provides a bookend for the work we perform throughout the year across all fuels and technologies, and it underscores the trends – and challenges – we expect to see for the next year and beyond.
Today, coal remains a centrepiece of the global energy system. It is affordable, abundant, easy to transport. For many countries, particularly in South and Southeast Asia, it is looked upon to provide energy security and energy access, and to underpin economic development.
Asia alone has about 1 400 gigawatts of coal-fired power plants with an average age of 11 years. This means that the existing infrastructure – let alone new plants – will be with us for decades to come, locking in carbon emissions for the next forty years. How we address this question is a central issue of the global climate and energy debate.
As the recent Intergovernmental Panel on Climate Change report warned, time is running out to meet our collective climate targets. At the IEA, we expect that global carbon emissions will grow this year, following last year’s increase which ended a three-year period of flat emissions. This contrasts sharply with the IEA’s Sustainable Development Scenario, which is aligned with the goals of the Paris Agreement as well as reducing air pollution and ensuring universal energy access.
But as this report shows, coal remains the second-largest source of primary energy and the largest source of electricity – and this will be the case for some years. This is why the IEA is taking the lead, along with the United Kingdom, the United States, Norway and many others, to kick-start a new era for carbon capture, utilisation and storage (CCUS). This technology can serve as a major bridge between our current and future energy needs, and our climate ambitions. Simply put – to meet our sustainability goals, there can be no future for coal without CCUS.
While more definitely needs to be done with CCUS, I am pleased to see that momentum is building. The enhancement of tax credits in the United States and new project developments in China, Canada, Norway and the United Kingdom are encouraging signs. In November, the IEA co-hosted a major international summit with the government of the United Kingdom in Edinburgh, Scotland, where ministers, senior governmental officials, CEOs from major energy companies, and the financial community came together to identify practical steps to accelerate investment and deployment of CCUS.
Fossil fuels are going to be with us for a long time. This is why the only way to tackle our long-term climate goals and address the urgent health impacts of air pollution, while also ensuring that more people around the world have access to energy, will require an approach that integrates strong policies with innovative technologies. It must rely on all available options – including more renewables, of course – but also greater energy efficiency, nuclear, CCUS, hydrogen, and more.
Dr Fatih Birol Executive Director International Energy Agency
© O
EC
D/IE
A, 2
018

ACKNOWLEDGEMENTS
4 COAL 2018
ACKNOWLEDGEMENTS
Coal 2018: Analysis and Forecasts to 2023 was prepared by the International Energy Agency’s (IEA) Gas, Coal and Power Markets Division (GCP), headed by Peter Fraser. The report was led, managed and co-ordinated by Carlos Fernández Alvarez. Max Schönfisch, Simon Schulte and Carlos Fernández Alvarez are the authors. Keisuke Sadamori, Director of Energy Markets and Security (EMS), provided expert guidance and advice.
Special thanks go to Volker Kraayvanger, who authored Box 1.2 on the energy interlinkages; Keunhyung Kim (Ryan), who authored Box 4.2 on Korea; Raimund Malischek, who authored Box 5.2 on carbon capture, utilisation and storage; and Beatriz Martínez, who prepared and aggregated the historical coal data. Many IEA colleagues provided us with advice and input during the process, including: Yasmina Abdelilah, Neil Atkinson, Heymi Bahar, Alessandro Blasi, Toril Bosoni, Willem Braat, Jean-Baptiste Dubreuil, Tim Gould, Raimund Malischek, Samantha McCulloch, Gergely Molnar, Cristina Morillas, Pawel Olejarnik, László Varró, Brent Wanner and Matthew Wittenstein.
The IEA Communication and Information Office (CIO) also provided editorial and production guidance. Rebecca Gaghen, Muriel Custodio, Astrid Dumond, Katie Russell, Therese Walsh and Bertrand Sadin made this publication possible. Kristine Douaud edited the report.
Our gratitude goes to the non-profit research Institute ewi Energy Research & Scenarios (ewi ER&S) in Cologne for sharing its breadth of coal expertise.
CRU provided with invaluable data and information for this report. Special thanks go to the Coal Industry Advisory Board (CIAB) for their support.
Many experts from outside the IEA provided inputs and/or reviewed the report:
Julian Beere Anglo American
Mick Buffier Glencore
Graham Chapman SUEK
Rodrigo Echeverri Noble Resources International
Nikki Fisher Anglo American
Justin Flood Sunset Power International
Renjith G The Energy Research Institute in India
Fabio Gabrieli Mercuria Energy Trading
Howard Gatiss CMC
Ayaka Jones US Department of Energy
Roland Lübke German Coal Association
Patricia Lumban Gaol PT Adaro Indonesia
Liu Yunhui China Energy Investment Group
Peter Morris Minerals Council of Australia
Jane Nakano CSIS
© O
EC
D/IE
A, 2
018

ACKNOWLEDGEMENTS
COAL 2018 5
Adam Parums CRU
Brian Ricketts Euracoal
Shintarou Sawa J-POWER
Hans-Wilhelm Schiffer RWE
J. Gordon Stephens Komatsu
Akira Yabumoto J-POWER
Fernando Luis Zancan Brazilian Coal Association
The individuals and organisations that contributed to this study are not responsible for any opinions or judgements it contains. Any error or omission is the responsibility of the IEA.
Comments and questions are welcome and should be addressed to:
Carlos Fernández Alvarez ([email protected])
© O
EC
D/IE
A, 2
018

© O
EC
D/IE
A, 2
018

TABLE OF CONTENTS
COAL 2018 7
TABLE OF CONTENTS
Executive summary .................................................................................................................... 11
1. Recent trends in demand and supply ................................................................................... 15
Highlights ....................................................................................................................................... 15 Demand ......................................................................................................................................... 15 Supply ............................................................................................................................................ 32 References ..................................................................................................................................... 40
2. Recent trends in international coal trade ............................................................................. 43
Highlights ....................................................................................................................................... 43 Market volumes and trade flows ................................................................................................... 43 Regional analysis ............................................................................................................................ 46 Prices ............................................................................................................................................. 55 Coal supply costs ........................................................................................................................... 61 References ..................................................................................................................................... 69
3. Medium-term demand and supply forecast ......................................................................... 71
Highlights ....................................................................................................................................... 71 Methodology ................................................................................................................................. 72 Assumptions .................................................................................................................................. 72 Global coal demand forecast, 2018-23 .......................................................................................... 73 Global coal supply forecast, 2018-23 ............................................................................................ 94 References ................................................................................................................................... 103
4. Medium-term international coal trade forecast .................................................................. 105
Highlights ..................................................................................................................................... 105 Methodology and assumptions ................................................................................................... 105 Seaborne coal trade forecast, 2018-23 ....................................................................................... 107 References ................................................................................................................................... 118
5. Capacity investment outlook .............................................................................................. 119
Highlights ..................................................................................................................................... 119 Investment overview ................................................................................................................... 119 Investment in export mining capacity ......................................................................................... 121 Investment in export infrastructure capacity .............................................................................. 122 Regional analyses ........................................................................................................................ 124 References ................................................................................................................................... 131
Annex A. Data Tables ................................................................................................................ 132
Annex B. Current Coal Mining Projects ....................................................................................... 137
Glossary .................................................................................................................................... 141
Definitions.................................................................................................................................... 141
© O
EC
D/IE
A, 2
018

TABLE OF CONTENTS
8 COAL 2018
Regional and country groupings ................................................................................................. 143
List of acronyms, abbreviations and units of measure ................................................................ 145
Acronyms and abbreviations ....................................................................................................... 145 Currency codes ............................................................................................................................ 148 Units of measure ......................................................................................................................... 148
LIST OF FIGURES
Figure 1.1 Thermal coal price markers and French power prices and imports, 2016 ....................... 18 Figure 1.2 LNG prices and imports in Europe and China, 2017-18 .................................................... 19 Figure 1.3 Increase in electricity generation by source in China, 2016-17 ........................................ 20 Figure 1.4 Installed capacity and load factors of China’s coal-fired power plants, 2011-17 ............. 20 Figure 1.5 Effect of improved Chinese coal-fired power plant efficiency on CO2 emissions ............ 21 Figure 1.6 Air pollutant reductions from China’s coal-fired power plants ........................................ 22 Figure 1.7 Increase in electricity generation by source in India, 2016-17 ......................................... 22 Figure 1.8 Installed capacity and load factors of coal-fired power plants in South Africa,
2011-17 ............................................................................................................................. 31 Figure 1.9 Chinese coal production by province, 2016 and 2017...................................................... 32 Figure 1.10 Annual coal production differences by province, 2015-17............................................... 33 Figure 2.1 Trade development of seaborne thermal (left) and met coal (right), 2012-17 ................ 44 Figure 2.2 Indonesian thermal coal exports, 2007-17 ....................................................................... 46 Figure 2.3 Australian exports of thermal coal (left) and met coal (right), 2007-17 .......................... 47 Figure 2.4 Russian exports of thermal coal (left) and met coal (right), 2008-17 ............................... 48 Figure 2.5 US exports of thermal coal (left) and met coal (right), 2007-17....................................... 49 Figure 2.6 Colombian exports of thermal coal, 2007-17 ................................................................... 49 Figure 2.7 South African exports of thermal coal, 2007-17 ............................................................... 50 Figure 2.8 Chinese imports of thermal coal (left) and met coal (right), 2007-17 .............................. 51 Figure 2.9 Indian imports of thermal coal (left) and met coal (right), 2007-17 ................................ 52 Figure 2.10 Japanese imports of thermal coal (left) and met coal (right), 2007-17 ............................ 53 Figure 2.11 Korean imports of thermal coal (left) and met coal (right), 2007-17 ............................... 53 Figure 2.12 EU imports of thermal coal (left) and met coal (right), 2007-17 ...................................... 54 Figure 2.13 Marker prices for different types of coal, 2016-18........................................................... 55 Figure 2.14 Thermal coal price markers (6 000 kcal/kg) in the Atlantic and Pacific basins,
2017-18 ............................................................................................................................. 56 Figure 2.15 Price markers for different thermal coal qualities in South Africa and Australia ............. 57 Figure 2.16 Relationship between the prices of South African and Australian thermal coal with
calorific values of 5 500 kcal/kg (left) and 6 000 kcal/kg (right) ....................................... 57 Figure 2.17 Evolution of coal prices in China ....................................................................................... 58 Figure 2.18 Coking coal price and monthly year-on-year BFI production growth, 2015-18 ............... 60 Figure 2.19 Forward curves of API 2 (left) and API 4 (right), 2016-18 ................................................. 60 Figure 2.20 Trade volumes for coal derivatives, 2000-17.................................................................... 61 Figure 2.21 Indexed nominal prices of selected commodities used in coal mining ............................ 62 Figure 2.22 Average fuel costs (left axis) and their share in total thermal coal mining costs
(right axis), 2015-17 .......................................................................................................... 63
© O
EC
D/IE
A, 2
018

TABLE OF CONTENTS
COAL 2018 9
Figure 2.23 Average labour costs (left axis) and their share in total thermal coal mining costs (right axis), 2015-17 .......................................................................................................... 63
Figure 2.24 Year-on-year development of selected currencies against the USD ................................ 64 Figure 2.25 FOB steam coal prices in USD and local currencies .......................................................... 65 Figure 2.26 Bulk carrier fleet, 2011-18 ................................................................................................ 65 Figure 2.27 Selected freight rates and fuel oil price, 2015-18 ............................................................. 66 Figure 2.28 FOB supply costs and average December price for 5 500-kcal/kg-equivalent
thermal coal at ports around the Bohai Economic Rim .................................................... 68 Figure 2.29 Indicative hard coking coal FOB supply curve and annual average FOB marker price ..... 69 Figure 2.30 Indicative SSCC and PCI FOB supply curve and annual average FOB marker price .......... 69 Figure 3.1 Chinese power demand compared with other economies .............................................. 75 Figure 3.2 China’s share in global output of selected energy-intensive products ............................ 75 Figure 3.3 Relationship between GDP and power generation in China, 2001-17 ............................. 76 Figure 3.4 Global coal demand growth in relation to hydropower production and
power demand in China .................................................................................................... 76 Figure 3.5 Total floor space under construction in China, 2010-16 .................................................. 78 Figure 3.6 Distribution of technologies in the new clean-heating area of northern China ............... 79 Figure 3.7 Crude steel, pig iron and direct reduced iron production in India, 2010-23 .................... 81 Figure 3.8 Planned annual coal-fired capacity additions in Viet Nam to 2023.................................. 84 Figure 3.9 Marginal East Coast US coal- and gas-fired power generation costs over the
outlook period .................................................................................................................. 86 Figure 3.10 Marginal EU hard coal- and gas-fired power generation costs over the
outlook period .................................................................................................................. 88 Figure 3.11 Shares of lignite-generated electricity in Balkan countries .............................................. 91 Figure 3.12 Global coal production development, 2017-23 ................................................................ 95 Figure 3.13 Thermal coal supply costs, China, 2017 and 2023 ............................................................ 96 Figure 4.1 Changes in global seaborne thermal coal imports, 2017 to 2018 (Mt) .......................... 107 Figure 4.2 Projected seaborne exports of thermal coal (left) and met coal (right)......................... 108 Figure 4.3 Projected seaborne thermal coal imports ...................................................................... 108 Figure 4.4 Power generation in Korea, 1990-2017 .......................................................................... 110 Figure 4.5 Coal and gas power generation cost comparison in Korea ............................................ 111 Figure 4.6 Projected seaborne thermal coal exports ...................................................................... 113 Figure 4.7 Indonesian thermal coal supply curve (FOB), 2018 and 2023 ........................................ 114 Figure 4.8 Projected seaborne met coal imports ............................................................................ 116 Figure 4.9 Projected seaborne met coal exports ............................................................................. 117 Figure 5.1 The path to zero-emissions coal ..................................................................................... 121
LIST OF MAPS
Map 1.1 Location and ownership of major coal mines and projects in South Africa (2017) .......... 39 Map 2.1 Main trade flows in the seaborne thermal coal market, 2017 (Mt) ................................. 44 Map 2.2 Main trade flows in the seaborne met coal market, 2017 (Mt) ....................................... 45 Map 2.3 Coal-fired power plants on the Rhine river ...................................................................... 67 Map 3.1 EU coal-fired power generation phase-out ...................................................................... 89 Map 4.1 Coal-fired power plants under development in Bangladesh .......................................... 112 Map 4.2 Coal basins and coal export capacity in Australia ........................................................... 115 Map 5.1 Cumulative capacity of hard coal export mining projects (Mtpa), 2019-23 ................... 122
© O
EC
D/IE
A, 2
018

TABLE OF CONTENTS
10 COAL 2018
LIST OF TABLES
Table 1.1 Total coal consumption (Mt), 2017 .................................................................................. 16 Table 1.2 Hard coal and lignite consumption in selected Asia Pacific countries (Mt) ..................... 17 Table 1.3 New coal-fired power plant blocks in Japan ..................................................................... 24 Table 1.4 New coal-fired power plant blocks in Korea ..................................................................... 24 Table 1.5 Hard coal and lignite consumption in selected European countries (Mt) ........................ 28 Table 1.6 Coal-fired capacity retirements in Germany .................................................................... 29 Table 2.1 Thermal coal exports in 2017 (Mt) and net changes from 2016 (colour-coded) ............. 45 Table 3.1 Coal-to-liquids plants in China, 2017 and 2023 ................................................................ 80 Table 3.2 New coal-fired power stations in Japan, 2018-23 ............................................................ 82 Table 3.3 Commissioning and retirements of coal-fired power plants in Korea, 2018-23 .............. 83 Table 3.4 Select ultra-supercritical coal plants under development in Indonesia ........................... 84 Table 3.5 New coal-fired power stations in Pakistan, 2018-23 ........................................................ 85 Table 3.6 Coal-fired power stations to be decommissioned in Germany ........................................ 90 Table 3.7 Key differences between the 2010 Mining Charter and the 2018 draft ........................ 102 Table 4.1 Tax scheme for coal and gas in Korea ............................................................................. 110 Table A.1. Coal demand (Mtce), 2016-23 ........................................................................................ 132 Table A.2. Thermal coal and lignite demand (Mtce), 2016-23 ........................................................ 132 Table A.3. Metallurgical (met) coal demand (Mtce), 2016-23 ........................................................ 133 Table A.4. Coal production (Mtce), 2016-23 ................................................................................... 133 Table A.5. Thermal coal and lignite production (Mtce), 2016-23 .................................................... 134 Table A.6. Met coal production (Mtce), 2016-23 ............................................................................ 134 Table A.7. Seaborne steam coal imports (Mtce), 2016-23 .............................................................. 135 Table A.8. Seaborne thermal coal exports (Mtce), 2016-23 ............................................................ 135 Table A.9. Seaborne met coal imports (Mtce), 2016-23 .................................................................. 135 Table A.10. Seaborne met coal exports (Mtce), 2016-23 .................................................................. 136
LIST OF BOXES
Box 1.1 Tips for readers ................................................................................................................. 16 Box 1.2 Energy interlinkages.......................................................................................................... 17 Box 1.3 China’s coal-fired power plants make significant strides ................................................. 21 Box 2.1 The hard task of price control ........................................................................................... 58 Box 2.2 The strategic value of the Rhine river ............................................................................... 66 Box 3.1 The importance of Chinese power generation in global coal demand............................. 74 Box 3.2 Cleaning up China’s heating system ................................................................................. 78 Box 3.3 Lignite-based electricity in the Balkans ............................................................................ 91 Box 3.4 The end of Coal India’s monopoly .................................................................................... 97 Box 3.5 South Africa’s 2018 Draft Mining Charter ...................................................................... 101 Box 4.1 The 1-billion-tonne market? ........................................................................................... 106 Box 4.2 Korea accelerates its energy transition .......................................................................... 109 Box 4.3 Bangladesh boosting coal power .................................................................................... 111 Box 5.1 Will technological advances boost coal demand? .......................................................... 120 Box 5.2 CCUS: Positive but insufficient momentum continues to build ..................................... 123
© O
EC
D/IE
A, 2
018

EXECUTIVE SUMMARY
COAL 2018 11
EXECUTIVE SUMMARY
Much talk, but not much change Global coal demand returned to growth in 2017. After two years of decline, global coal demand grew by 1% last year to 7 585 million tonnes (Mt) as stronger global economic growth increased both industrial output and electricity use. Global coal power generation increased by over 250 TWh, or around 3%, and accounted for about 40% of the additional power generation worldwide. Coal kept its share in the power mix at 38% after some years of decline. Driven by strong coal power generation in the People’s Republic of China (“China”) and India, coal demand is expected to grow again in 2018.
Markets trends are resistant to change. Coal, a carbon-intensive energy source, is at the centre of debate on energy and climate policy. In a growing number of countries, the elimination of coal-fired generation is a key climate policy goal. In others, coal remains the preferred source of electricity and is seen as abundant and affordable. Despite significant media attention being given to divestments and moves away from coal, market trends are proving resistant to change.
Global coal demand will be stable through 2023. Global coal demand in the next five years will be stable, with declines in Europe and United States offset by growth in India and other Asian countries. China, the main player in the global coal market, will see a gradual decline in demand. Coal’s contribution to the global energy mix will decline from 27% to 25%, mainly due to growth of renewables and natural gas.
Tighter markets are pushing up prices Tighter markets are driving price increases. The seaborne coal trade experienced a rebound in 2017. Chinese coal imports grew 15 Mt, while most other large importers, including Brazil, Chinese Taipei, Korea, Malaysia, Mexico, Morocco, Philippines, Pakistan, Turkey and Viet Nam, had record imports. Chile, Japan and Thailand were very close to their historical highs. Europe was the only shrinking market. With further growth in 2018 in China and India, seaborne thermal coal trade is close to the 1 billion tonne mark. Higher demand has led to higher prices.
But higher prices are not triggering new investments. More than two years of increasing coal prices have handed more cash to coal producers. Some of this extra revenue has been used to purchase already producing assets or, in a limited number of cases, to expand existing operations. By contrast, investment in new mines has not moved forward. Risks associated with climate policies, potentially stranded assets, local opposition, and the memories of the last downturn have cooled investors’ appetite to invest in new production. Banks, insurance companies, hedge funds, utilities and other operators in advanced economies are exiting the coal business. In many parts of the world, growing opposition to coal projects has provided strong disincentives for investors.
A tale of two Europes Western Europe is accelerating its coal exit. In EU28, policy action in three areas is hitting coal demand: action on climate change, including through the Emissions Trading System; action on air pollution; and, in most Western European countries, action to specifically phase out coal-fired power generation. Along with the expansion of renewables, spurred by the growing competitiveness of wind and solar, these policy efforts will eventually push coal out of the Western European power
© O
EC
D/IE
A, 2
018

EXECUTIVE SUMMARY
12 COAL 2018
mix. By 2023, at least two more countries, France and Sweden, will have closed their last coal power plants, and Germany will be the only significant coal consumer remaining in Western Europe.
By contrast, coal demand remains stable in Eastern Europe. Most countries in the region have not announced phase-out policies, and a handful of new coal power plants are under construction in the Balkans, Greece and Poland. Given that most of these new plants will replace older and less efficient coal capacity, coal demand will not increase. Some countries in Eastern Europe are among the few places in the world (the state of Victoria, in Australia, is another example) where lignite remains the cornerstone of the electricity system.
Blue skies, the Chinese priority One out of every four tonnes of coal used in the world is burned to produce electricity in China. Hence, coal’s fate largely rests on the Chinese power sector. The rebound in electricity use in China since 2016 underpins the global growth of coal use. Further, we expect increased electrification of transportation and heating, and increased electricity consumption by the growing middle class in China. In our forecast, global coal demand is very sensitive to trends of electricity use in China. Yet, despite these factors, we assume that the Chinese economy is in a structural transformation and that its electricity intensity will decline over time, stopping further growth in coal power generation by 2020.
“Winning the battle for blue skies” remains the policy priority in China. Environmental policies, and in particular clean-air measures, constrain coal demand. The main target of the policy action is to reduce direct coal use and small boilers in residential heating, as well as in the commercial and industrial sectors. Cement, steel and small power producers are also targeted in China’s air-quality campaign. Gas use for heating and industry, and renewables for power generation, are policy priorities. Whereas cleaner use of coal is another pillar of the strategy, the only sector in which we see significant growth is coal conversion, i.e. coal-to-liquids, coal-to-gas and coal-to-chemicals. Considering all these moving pieces, we maintain the forecast in last year’s report that China’s coal demand has entered a slow but structural decline at less than 1% per year on average.
India, coal’s safest bet The unmatched period of coal power generation growth in India is set to continue. Coal power generation in India has grown continuously since 1974. With the Indian economy expected to grow over 8% per year to 2023 and the electrification process continuing, power demand is forecast to rise by more than 5% per year over the period. The large-scale ongoing renewable expansion and the use of supercritical technology in new coal power plants will slow coal demand growth, which will grow by less than 4% per year through 2023, compared to over 6% on average per year in the past decade. Outside the power sector, economic growth and infrastructure development will increase coal consumption in steel and cement production.
South and Southeast Asia are the second engine of growth. Indonesia, Pakistan, Bangladesh, Philippines and Viet Nam combined have more than 800 million people, with an average annual per capita electricity consumption of just over 800 kWh, one-seventh that of EU28. Increasing coal power generation, supported by new coal plants under construction, will be the main driver of coal demand growth in those countries. In other countries with higher per capita electricity use, like Malaysia and the United Arab Emirates, new coal plants are largely due to energy mix diversification policies. Southeast Asia has the fastest growth in coal demand at over 5% per year through 2023, although India, with almost 150 Mtce of additional demand, supports the largest absolute growth.
© O
EC
D/IE
A, 2
018

EXECUTIVE SUMMARY
COAL 2018 13
China remains the wild card of coal trade India, Korea, and above all, China hold the key. The future of coal imports remains tied to South and Southeast Asia. For India, where the progress observed in coal production and transportation will not be not sufficient to reduce imports, we have revised our forecast for thermal imports upward. Growth is also expected in Korea, Viet Nam, Malaysia, the Philippines, Pakistan and others. By contrast, imports to Europe decline over time. Overall, the market depends on China, whose sheer size and changing policies give it a unique potential to swing imports from one year to the other. Whereas the arbitrage between domestic and imported prices in coastal areas is relevant, policies (for instance import quotas, port caps, taxes, and quality tests) are also important.
Australia recovers its leadership in export markets, but Indonesia follows closely. In our forecast, Indonesian exports decline, pushed by increasing domestic demand and lower prices, leaving Australia as the largest exporter in the world. This could change if prices rise as Indonesian producers have a proven record to ramp up production whenever prices are attractive. We forecast increasing exports from the Russian Federation, which is ramping up export infrastructure and targeting the Asian markets. Our forecast for US coal exports has not changed much compared to 2017. Abundant cheap gas and renewable expansion will continue to squeeze domestic coal power generation, and exports will depend on prices prevailing in the international markets, as the United States remains a swing supplier.
Coal, the most controversial fuel One planet, two coal worlds. Since 2015, we have observed that coal’s shift to Asia, and the emergence of two worlds – one with coal power generation and the other without it, would make it difficult to build agreements on coal and emission reductions. This became more evident when the United Kingdom and Canada launched the Powering Past Coal Alliance, which has been joined by more than 20 countries, as well as states, provinces, municipalities and businesses, who have committed to end unabated coal power generation by 2030. Today, coal used for power generation in the countries that have joined the Alliance accounts for less than 2% of global coal consumption. In many other countries, however, the end of coal generation is not envisaged given the role that coal plays for securing access to affordable energy.
Carbon capture, utilisation and storage (CCUS) is the bridge between the two worlds. If there is to be continued coal use in the longer term while meeting the overall goals of the Paris agreement, CCUS has to be in the portfolio. The International Energy Agency is committed to continue to build momentum on this crucial technology. While 2018 brought some good news in terms of policies and projects, our progress with deploying CCUS remains woefully off-track with what is required for a sustainable energy future.
© O
EC
D/IE
A, 2
018

© O
EC
D/IE
A, 2
018

RECENT TRENDS IN DEMAND AND SUPPLY
COAL 2018 15
1. RECENT TRENDS IN DEMAND AND SUPPLY
Highlights • Global coal consumption increased 1.1% from 2016 to 7 585 million tonnes (Mt) in 2017.
The share of coal in the global primary energy supply was 27%, making it the second-largest energy source after crude oil. Increased coal demand in the Asia Pacific region reflects higher demand in the People’s Republic of China (“China”), India, Korea and Southeast Asia, offsetting the ongoing decline in North America and Europe. Measured by energy content, 61% of the world’s coal was burned to generate electricity and 19% was metallurgical (met) coal used in the steel industry. Coal use in the power sector increased 1.9%, while met coal consumption rose 1.2%.
• In China, coal demand rose slightly, by 10 Mt to 3 664 Mt in 2017, after three consecutive years of decline. With a 48% share of global consumption, China remains the largest consumer of coal in the world by far. Although measures to discourage burning coal for heating continued to drive down non-power thermal coal consumption, rising coal-fired power generation raised consumption overall.
• India registered the world’s largest absolute increase in coal use in 2017, with consumption rising 40 Mt (4.4%) from 2016 to 2017. A larger relative increase was recorded in Korea (+11.5%), and coal demand in Southeast Asia rose 7.5% (to 254 Mt) in 2017. All increases reflect a rise in coal-fired electricity generation.
• Coal demand in the European Union decreased 1.1% in 2017 as a result of further coal plant closures and rising renewables-based power generation. In the United States, coal demand continued to fall (by 2.6% to 641 Mt), albeit less rapidly than in the previous two years as the decline in coal-fired power generation slowed.
• After two consecutive years of decline, global coal production increased 3.1% (225 Mt) to 7 549 Mt in 2017. Output of each of the world’s three largest producers – China, India and the United States – increased for the first time since 2014.
• China’s coal production recovered, climbing 3.3% (108 Mt) to 3 376 Mt. Higher prices spurred additional production, which had plummeted in 2016. Increased output was almost entirely in thermal coal.
• Bucking a negative multi-year trend, coal production in the United States rose 6.3% (42 Mt) from 2016 to 2017 – the largest percent increase in more than 20 years. Although demand continued to decline, greater production was spurred by higher export volumes as seaborne coal prices rose.
Demand After two consecutive years of decline, world coal consumption in physical tonnes rose again in 2017, up 1.1% (79 Mt) from 2016. Coal accounted for 27% of global primary energy consumption, maintaining its position as second-largest energy source after crude oil.
© O
EC
D/IE
A, 2
018

RECENT TRENDS IN DEMAND AND SUPPLY
16 COAL 2018
Increased consumption was driven almost entirely by rising demand in India, Southeast Asia, Korea, the Russian Federation (“Russia”) and China, offsetting ongoing decline in the United States and the European Union (Table 1.1).
Table 1.1 Total coal consumption (Mt), 2017
2016-17 2007-17* 2016 2017* Share Change % CAAGR China 3 654 3 664 48% 10 0.3% 2.7%
India 902 942 12% 40 4.4% 5.8%
United States 658 641 8% -17 -2.6% -4.6%
European Union 634 627 8% -7 -1.1% -2.7%
Southeast Asia 236 254 3% 18 7.5% 7.1%
Russia 217 228 3% 10 4.8% 0.7%
Japan 187 189 2.5% 2 0.8% 0%
World 7 506 7 585 100% 79 1.1% 1.2%
*Estimated.
Note: CAAGR = compound average annual growth rate. Differences in totals are due to rounding.
In terms of energy content, 61% of the world’s coal was used to generate electricity and 19% was met coal used mostly for pig iron and steel production. The remainder was consumed in non-power applications, such as for generating heat in the industry sector (primarily cement production), district heating networks and some specialised applications.
Box 1.1 Tips for readers
Readers of the previously titled Medium-Term Coal Market Report, now Coal, will note that the regional divisions used for the report have changed. Whereas previous reports divided coal demand analysis into Organisation for Economic Co-operation and Development (OECD) and non-OECD countries, such a split no longer reflects the coal market because dominance is shifting towards Asia, away from Europe and North America. The report has therefore adopted a more market-based geographical approach, turning its focus towards the Asia Pacific markets, particularly those of China, India, Japan, Korea and Southeast Asia.
Sectoral analysis of coal demand has also changed: over 60% of coal used in the world is for power generation; in addition, this area has the largest growth potential. For instance, a new 600-megawatt (MW) power plant may require 1.5 Mt of coal per year, equivalent to the amount of coal needed to make 2 Mt of steel or 15 Mt of cement. At the same time, however, numerous alternative energy sources exist in the electricity sector (hydro, wind, solar, biomass, nuclear, oil, gas, etc.), so the potential for decline is also considerable. Because coal demand is so closely tied to electricity generation, this year’s demand analysis (for both recent trends and forecasts) focuses more strongly on power.
Finally, definitions in the Glossary will help readers understand coal classification and terminology.
© O
EC
D/IE
A, 2
018

RECENT TRENDS IN DEMAND AND SUPPLY
COAL 2018 17
Asia Pacific
In 2017, Asia Pacific economies were responsible for 72% of the world’s coal consumption. The largest consumer was China, at 48% of the total (Table 1.1). Compared with 2016, total Asia Pacific consumption increased 1.8% (to 5 445 Mt), driven largely by an uptick in coal-fired power generation.
Table 1.2 Hard coal and lignite consumption in selected Asia Pacific countries (Mt)
Country Hard coal Lignite 2016 2017* Growth 2016 2017* Growth
China 3 654 3 664 <1% - - -
India 857 894 4% 45 47 5%
Japan 187 189 1% - - -
Korea 135 150 12% - - -
Australia 55 60 10% 61 57 -7%
Bangladesh 3 4 11% - - -
Chinese Taipei 65 68 4% - - -
Indonesia 94 101 7% - - -
Malaysia 30 34 12% - - -
Mongolia 2 3 6% 6 6 6%
Pakistan 9 13 52% 1 1 -
Philippines 24 27 10% - - -
Thailand 18 18 1% 17 16 -4%
Viet Nam 50 55 10% - - -
*Estimated.
Note: China consumes lignite, but it is not reported as such. Smaller amounts are consumed in Korea, Chinese Taipei, Malaysia and Philippines.
Box 1.2 Energy interlinkages
Although energy commodity prices vary among regions, regional prices are co-integrated through arbitrage (with a gap resulting from the cost of transportation from lower- to higher-price regions). Prices of various energy commodities are also interdependent, mainly because of demand-side substitution (e.g. substituting gas for coal – or vice versa – in the power sector), but there are also many common underlying supply-side drivers. Because these inter-fuel and interregional links affect the entire energy mix, no single fuel in any region can be analysed in isolation. A strength of International Energy Agency (IEA) analyses is that they cover the entire energy spectrum across the whole world. Although large energy market participants such as China and India have become increasingly influential and decisions made in Beijing or Delhi therefore impact the rest of the world, this is not a new phenomenon. For instance, the Medium-Term Coal Market Report 2012 (Box 5) addressed the relationship between rainfall in Central China and power prices in Europe. This year’s report presents two more recent examples of energy interlinkages, as coal-related decisions in China result in electricity and natural gas price movements in Asia, affecting Europe and beyond.
The European power market still incorporates considerable thermal power generation (22% from coal and 18% from natural gas in 2017). Although regional events can disturb the coal price correlation between the Atlantic and Pacific basins (the two main international steam coal regions), European coal prices are strongly influenced by market developments in China (but the effect of European market
© O
EC
D/IE
A, 2
018

RECENT TRENDS IN DEMAND AND SUPPLY
18 COAL 2018
activities on Chinese prices is much more limited; see Coal 2017). In Europe, Germany (Europe’s largest power producer) still uses considerable coal in its generation mix (37%) and is well connected with other markets. Consequently, when Germany exports power to neighbouring countries, the price of coal sets the marginal electricity price. Even electricity markets that have very little or no coal in the energy mix (such as that of France) can then be affected by coal price developments (Figure 1.1).
Figure 1.1 Thermal coal price markers and French power prices and imports, 2016
Notes: t = tonne; MWh = megawatt hour; GWh = gigawatt hour; CIF = cost, insurance and freight.
Sources: IHS Markit (2018), Coal McCloskey Price and Statistical Data, https://connect.ihs.com/industry/coal; ENTSO-E (2018), Statistics and Data, www.entsoe.eu/publications/statistics-and-data/.
Power prices are affected by several regional factors such as hydropower availability and unplanned power generation outages. In the second half of 2016, for example, France experienced nuclear power outages due to unplanned nuclear safety checks. The resulting demand gap and rising power prices boosted power imports, including from Germany, which produced 17.2% of its power from hard coal in 2016. As European coal prices were already relatively high, triggered by greater Chinese imports, arbitrage between the Atlantic and Pacific basins for coal exporters such as Colombia was possible. The continuing power supply-demand gap in France then kept European coal prices high at the same time as they were already dropping in China (beginning of 2017). Ironically, the price of European coal had initially been set by China expanding its coal imports during supply-side coal sector reforms in the country. As a result of extensive arbitrage between domestic and imported coal in China’s coastal region, coal prices climbed in China and elsewhere. What happened in 2016 clearly demonstrates how coal-related policies in China can raise electricity prices in France, a country that uses only negligible amounts of coal for power generation.
Another energy link between China and Europe that is gaining importance is natural gas, particularly since China considerably expanded liquefied natural gas (LNG) imports in the winter of 2017-18. The government’s efforts to end direct coal use and phase out small coal-fired boilers (of average steam rate 10 t or less per hour) gained momentum with the approaching deadline of the 2013 Action Plan on Prevention and Control of Air Pollution and the Action Plan on Improving Air Pollution Control of Fall/Winter 2017 (issued in July 2017). Rising LNG needs – triggered by the coal-to-gas switch in the industry and residential sectors – were further propelled by a winter that began harsher than normal and by lower pipeline imports from Turkmenistan. China’s surge in LNG demand was rapid, resulting in higher spot prices in the Pacific Basin as well as in Europe (Figure 1.2). LNG spot prices in Spain (the largest European importer of LNG) especially followed the price trend set by China. Given China’s desire to improve air quality and the importance of natural gas in achieving this goal, its influence on the global LNG market and the consequent effects for European importers will continue. The events of 2017 showed how policies to phase out coal in China can seriously impact gas prices in Europe and elsewhere.
0
20
40
60
80
100
120
0
20
40
60
80
100
120
Jan-16 Apr-16 Jul-16 Oct-16
EUR/MWhUSD/t
Coal and power prices
Qinhuangdao 5 800 Northwest Europe (CIF) Day-ahead prices France
0
100
200
300
400
500
600
Jan-16 Apr-16 Jul-16 Oct-16
GWh
Physical power flow
Germany to France
© O
EC
D/IE
A, 2
018

RECENT TRENDS IN DEMAND AND SUPPLY
COAL 2018 19
Figure 1.2 LNG prices and imports in Europe and China, 2017-18
Notes: DES = delivered ex ship; TTF = Title Transfer Facility (Netherlands); MBtu = million British thermal units; bcm = billion cubic metres.
Source: ICIS (2018), ICIS LNG Edge, www.icis.com/energy/liquefied-natural-gas/lng-edge.
China
In 2017, China consumed 3 664 Mt of coal: 2 957 Mt thermal and 707 Mt met. Although coal consumption had grown again after three years of decline, it remained well below the peak recorded in 2013. Thermal coal consumption declined 0.1% (2 Mt) from 2016 to 2017, while met coal use increased 1.7% (12 Mt).
China’s power sector is the world’s largest consumer of thermal coal: in 2017, it was responsible for 54% of the country’s total coal use and 71% of its thermal coal consumption. China generated 6 649 terawatt hours (TWh) of electricity in 2017, 67% from coal. Coal therefore continues to be the dominant fuel in the country’s electricity mix, and coal-based generation has grown every year since the economic reforms of 1970s (with the exception of 2015). Hydro, China’s second-largest power source, was used to generate 18% of its electricity, followed by 8% from other renewables (mostly wind and solar) and 4% from nuclear. Natural gas fuelled most of the remaining 3%.
China’s largest year-on-year (y-o-y) increase in coal-fired generation since 2013 occurred in 2017. Total power generation rose 6.3% (393 TWh) driven mainly by industrial electricity consumption (industrial output was 0.6 percentage points higher in 2017 than in 2016), rising consumption in the service sector and also residential, supported by a hot summer. While renewables-based generation grew 8.5%, a higher percentage than coal, (20 TWh from hydro, 64 TWh from wind and 51 TWh from solar – a 19.4% y-o-y increase for the latter two), coal registered the highest absolute increase. It contributed a further 195 TWh to the electricity supply, covering nearly half the additional power demand. In contrast, production by China’s nuclear power stations increased 35 TWh (up 16%), while other sources, including natural gas, supplied an additional 28 TWh (Figure 1.3). Power sector thermal coal consumption grew 4% in 2017 as a result of this increased production.
0
2
4
6
8
10
12
Jul-17 Sep-17 Nov-17 Jan-18 Mar-18
USD/MBtu
LNG spot DES prices and TTF
China Spain France UK TTF
0 1 2 3 4 5 6 7 8
Jul-17 Sep-17 Nov-17 Jan-18 Mar-18
bcm
LNG imports
China Spain France UK
© O
EC
D/IE
A, 2
018

RECENT TRENDS IN DEMAND AND SUPPLY
20 COAL 2018
Figure 1.3 Increase in electricity generation by source in China, 2016-17
At the end of 2017, operational coal-fired generation capacity in China was 980 gigawatts (GW) (Figure 1.4). Almost 40 GW of coal-fired capacity had been commissioned over the course of the year, i.e. more than Poland’s current installed coal capacity. By contrast, over 5 GW of coal-fired capacity was shut down in 2017.This was, however, a slowdown from net additions in 2015 (45 GW) and 2016 (46 GW).
Figure 1.4 Installed capacity and load factors of China’s coal-fired power plants, 2011-17
Note: Installed capacity and load factors are yearly averages.
With the exception of 2013, the average load factors1 of China’s fleet of coal-fired power stations declined each year from 2011 to 2016. In 2017, however, higher generation, combined with slower installed capacity growth, stabilised the coal fleet’s average load factor at roughly 53%. China’s coal-fired power stations have a typically low load factors because capacity growth exceeds demand growth (see Box 3.2 in the Medium-Term Coal Market Report 2016 [IEA, 2016] for an explanation of why coal-fired power plants continue to be built in China).
Outside the power sector, thermal coal consumption declined again in 2017, mainly owing to China’s ongoing efforts to reduce air pollution by replacing inefficient and highly polluting coal-based boilers in the industry and residential sectors with cleaner-burning natural gas. Last winter, however, the
1 Load factor is the ratio of a power plant’s actual generation to its maximum possible annual generation (running at full capacity for the entire year)
0 50
100 150 200 250 300 350 400
Total Coal Hydro Nuclear Wind Solar Natural gas/other
TWh
45%
50%
55%
60%
65%
70%
75%
0
200
400
600
800
1 000
1 200
2011 2012 2013 2014 2015 2016 2017
GW
Installed capacity Load factor (right axis)©
OE
CD
/IEA
, 201
8

RECENT TRENDS IN DEMAND AND SUPPLY
COAL 2018 21
rate of switching was so high that the gas system could not keep up, leading to shortages (IEA, 2018a). The fall in non-power thermal coal consumption was large enough to offset higher consumption in the power sector, slightly reducing overall thermal coal consumption. In contrast, met coal consumption increased 12 Mt to 707 Mt owing to greater steel production (pig iron).
Box 1.3 China’s coal-fired power plants make significant strides
China’s coal-based power sector is the largest coal-consuming sector globally by far, as approximately one of every four tonnes of coal consumed in the world is used in China to generate electricity. Although coal is used across China’s entire economy, the power sector alone is responsible for half the growth in global coal use since 2000, with coal-fired generating capacity quadrupling between 2000 and 2017.
China’s coal-fired fleet is both relatively new and relatively efficient. Thanks to government policies requiring that new power stations be efficient supercritical or ultra-supercritical plants (and encouraging the closure of small, inefficient plants), average coal power plant efficiency increased from 33.3% (net efficiency based on lower calorific value) in 2005 to almost 40% in 2017. This efficiency gain meant that nearly 400 Mt less coal was burned in 2017, reducing carbon dioxide (CO2) emissions 750 Mt that year – more than Germany’s annual energy-related CO2 emissions.
Figure 1.5 Effect of improved Chinese coal-fired power plant efficiency on CO2 emissions
While power sector efficiency gains have been significant, air pollutant emission reductions have been outstanding. In 2010, efforts to reduce nitrogen oxide (NOX) emissions added to those already initiated to reduce particulate matter (PM) and sulphur dioxide (SO2) emissions a few years before. As a result, all coal power plants in China had equipment to remove dust from flue gas by the end of 2010, and by 2016 they had desulphurisation equipment as well (compared with 88% in 2010).
By December 2016 (the most recent data available), 92% of coal-fired capacity had equipment to reduce NOX emissions, compared with 13% in 2010. In 2014, China issued “ultra-low emissions standards”, which set emissions limits for coal-fired plants at the same levels as for gas-fired plants: 10 milligrammes per normal cubic metre (mg/Nm3) for PM, 35 mg/Nm3 for SO2 and 50 mg/Nm3 for NOX. As of December 2017, two years before the government deadline, 60% of the coal fleet (580 GW) had been retrofitted to comply with the ultra-low emissions standards.
This strategy has reduced PM emissions by more than 7.5 Mt, SO2 emissions by more than 23 Mt and NOX by more than 15 Mt (Figure 1.6).
1 000
2 000
3 000
4 000
5 000
2005 2006 2007 2008 2009 2010 2011 2012 2013 2014 2015 2016 2017
Mt
Actual emissions Emissions without efficiency gains
© O
EC
D/IE
A, 2
018

RECENT TRENDS IN DEMAND AND SUPPLY
22 COAL 2018
Figure 1.6 Air pollutant reductions from China’s coal-fired power plants
Note: g/kWh = grammes per kilowatt hour.
Another area in which Chinese power plants are improving is flexibility. Given the increasing share of variable renewables sources (i.e. wind and solar photovoltaic [PV]) in the power mix, coal plant flexibility both improves plant operations and reduces renewables curtailment. To increase flexibility, the Chinese government launched a pilot project to raise ramp-up rates, reduce start-up times and reduce the minimum loads of 22 coal-fired power plants (17 GW). The target is to retrofit 220 GW of capacity by 2020.
Greater progress is still needed in improving energy efficiency, reducing air pollution and increasing flexibility, and indeed in developing large-scale carbon capture utilisation and storage (CCUS).
India
India consumed 942 Mt of coal in 2017: 825 Mt of thermal coal, 69 Mt of met coal and 47 Mt of lignite. Consumption increased 4.4% (40 Mt) from 2016, maintaining the upward trend begun in 1998. Thermal coal consumption rose 37 Mt, met coal 1 Mt and lignite by another 2 Mt.
Figure 1.7 Increase in electricity generation by source in India, 2016-17
2 4 6 8
10 12 14 16
2005 2006 2007 2008 2009 2010 2011 2012 2013 2014 2015 2016 2017
g/kWh
Dust SO2 NOx
0 10 20 30 40 50 60 70 80 90
Total Coal Nuclear Natural gas/other Renewables
TWh©
OE
CD
/IEA
, 201
8

RECENT TRENDS IN DEMAND AND SUPPLY
COAL 2018 23
The power sector is India’s largest consumer of coal, responsible for 73% of thermal coal and 66% of total coal consumption in 2017. India generated 1 557 TWh of electricity in 2017: 73% from coal, 18% from renewables, 4% from natural gas and 3% nuclear power.
Generation in 2017 was 5.5% (80 TWh) higher than in 2016, the lowest relative increase in electricity generation since 2012. The sudden demonetisation of India’s most common-value bank notes in November 2016 as part of anti-corruption efforts had some impact on this. Power generation from coal rose 2.6% (29 TWh) to 1 134 TWh, making 2017 the 43rd consecutive year of increase in coal-based generation. Output from other major electricity sources also rose: renewables-based (largely solar) generation increased 17% (41 TWh), while nuclear, the third-largest power-generating source, recorded a 34% (13 TWh) increase (Figure 1.7).
Thermal coal consumption, already boosted by the rise in coal-fired generation, was further augmented by greater production of direct reduced iron and cement.
Growth in coal-fired capacity in 2017 was lower than in previous years – only 4 GW, after a 22-GW increase in 2016 – for installed capacity of 193 GW at the end of 2017.2 As capacity growth has been expanding more quickly than generation since 2011, the average load factors of coal power stations have declined steadily to only recover approximately 65% in 2017. The return of coal supply shortages resulting from insufficient coal production or rail unavailability at high demand times has also reduced load factors.
The steel sector also consumes significant amounts of coal, mainly metallurgical (both coking and pulverised coal injection [PCI]), but thermal as well, as India is the largest producer of direct reduced iron, mostly using coal. In 2017, crude steel production rose 6%, raising pig iron production and met coal demand.
Japan
Japan consumed 189 Mt of coal in 2017, a 0.8% (2-Mt) increase from 2016. Steam coal consumption rose 3 Mt, owing entirely to higher power sector consumption, while met coal use declined 1 Mt.
The power sector accounted for 82% of Japan’s thermal coal consumption and 60% of total coal consumption in 2017. Coal-fired power generation rose 3.4% in 2017 as new generating plants were brought into service and existing ones were operated at higher capacity factors. Coal was the second-largest source of electricity production (361 TWh) after gas (400 TWh), despite increased output from nuclear and renewables. Power demand climbed 2.6%, the largest increase since 2010, driven by higher industrial output and a cold winter.
Japan’s coal-fired capacity, currently 44 GW, continues to grow: 388 MW of new capacity was commissioned in 2017, including a 166-MW integrated gasification combined cycle (IGCC) unit in Osaki (Table 1.3). An additional 261 MW came online in the first quarter of 2018 and no plants have been retired. (This capacity is not net coal-fuelled, however, as some plants – Nagoya 2, Souma and Ishinomaki – will co-fire up to 30% biomass.)
2 Grid-connected coal-fired power stations monitored by the Central Electricity Authority only. Captive plants that generate electricity solely for direct consumption by industries (estimated at 30 GW) are not included.
© O
EC
D/IE
A, 2
018
RECENT TRENDS IN DEMAND AND SUPPLY
24 COAL 2018
Table 1.3 New coal-fired power plants in Japan
Unit Capacity (MW) Commissioned in
Osaki 166 March 2017
Nagoya 2 110 September 2017
Sendai Power Station 112 October 2017
Souma 112 March 2018
Ishinomaki 149 March 2018
Total 649
Outside the power sector, thermal coal consumption declined slightly. There was also a small drop in met coal consumption as raw steel production decreased somewhat (World Steel Association, 2018).
Korea
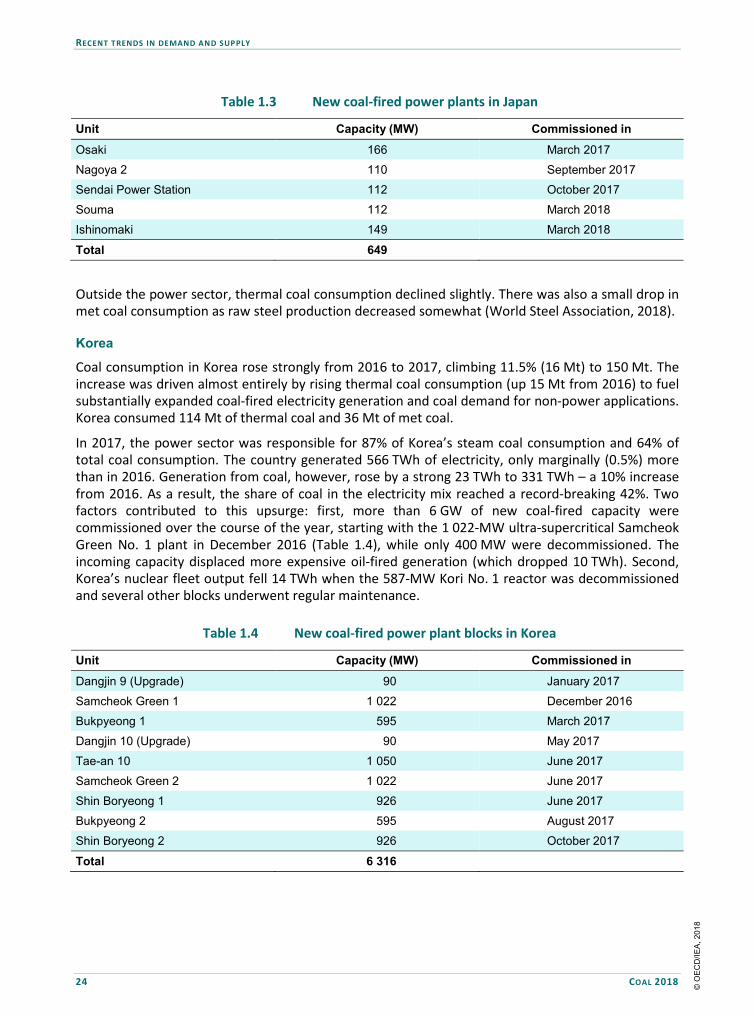
Coal consumption in Korea rose strongly from 2016 to 2017, climbing 11.5% (16 Mt) to 150 Mt. The increase was driven almost entirely by rising thermal coal consumption (up 15 Mt from 2016) to fuel substantially expanded coal-fired electricity generation and coal demand for non-power applications. Korea consumed 114 Mt of thermal coal and 36 Mt of met coal.
In 2017, the power sector was responsible for 87% of Korea’s steam coal consumption and 64% of total coal consumption. The country generated 566 TWh of electricity, only marginally (0.5%) more than in 2016. Generation from coal, however, rose by a strong 23 TWh to 331 TWh – a 10% increase from 2016. As a result, the share of coal in the electricity mix reached a record-breaking 42%. Two factors contributed to this upsurge: first, more than 6 GW of new coal-fired capacity were commissioned over the course of the year, starting with the 1 022-MW ultra-supercritical Samcheok Green No. 1 plant in December 2016 (Table 1.4), while only 400 MW were decommissioned. The incoming capacity displaced more expensive oil-fired generation (which dropped 10 TWh). Second, Korea’s nuclear fleet output fell 14 TWh when the 587-MW Kori No. 1 reactor was decommissioned and several other blocks underwent regular maintenance.
Table 1.4 New coal-fired power plant blocks in Korea
Unit Capacity (MW) Commissioned in
Dangjin 9 (Upgrade) 90 January 2017
Samcheok Green 1 1 022 December 2016
Bukpyeong 1 595 March 2017
Dangjin 10 (Upgrade) 90 May 2017
Tae-an 10 1 050 June 2017
Samcheok Green 2 1 022 June 2017
Shin Boryeong 1 926 June 2017
Bukpyeong 2 595 August 2017
Shin Boryeong 2 926 October 2017
Total 6 316
© O
EC
D/IE
A, 2
018

RECENT TRENDS IN DEMAND AND SUPPLY
COAL 2018 25
Along with the total capacity increase, average load factors rose to 82% in 2017, 4 percentage points higher than in 2016. Power sector thermal coal consumption rose more than 10% to supply the considerable generation expansion.
Outside the power sector, thermal coal consumption increased with higher cement production (USGS, 2018). In line with the world economy, Korea registered a strong value-added by industry increase in 2017 (4.6% higher than in 2016) (World Bank, 2018). This did not, however, translate into a large increase in domestic steel production (World Steel Association, 2018); as a result, coking coal consumption rose by only 0.5 Mt.
Southeast Asia
Coal consumption in Southeast Asia increased a substantial 7.5% (18 Mt) to 254 Mt in 2017. Growth was driven entirely by rising steam coal consumption, which expanded 8.7% from 2016 (to 233 Mt). Met coal consumption remained flat (4 Mt), as did lignite (17 Mt).
Power generation in Southeast Asia increased 4.3% to 972 TWh in 2017, driven by strong regional gross domestic product (GDP) growth (5.1%, up 0.3 percentage points from 2016). Coal-fired generation expanded the most in response to rising power demand, 9% (31 TWh) higher than in 2016, and its share in the energy mix increased to 38%. Growth in coal-fired generation outpaced that from both natural gas (9 TWh) and renewables (2 TWh). Power sector thermal coal consumption therefore rose 8%.
Coal-fired generating capacity continues to grow in the region: of the 70 GW of installed coal capacity in January 2018, 4 GW (net) had been added in 2017. Most is in Indonesia (around 30 GW), followed by Viet Nam (15 GW), Malaysia (11 GW), the Philippines (7 GW) and Thailand (5 GW). In addition, lignite-based power is generated in Thailand and the Lao People’s Democratic Republic (Laos), but production remained flat in 2017.3 Non-power thermal coal consumption also grew as greater construction activity spurred cement production across the region (USGS, 2018).
Indonesia was the largest user of thermal coal (97 Mt), followed by Viet Nam (55 Mt), Malaysia (34 Mt), the Philippines (27 Mt) and Thailand (18 Mt). Met coal consumption, primarily by blast furnaces in Indonesia, remained unchanged from 2016.
Other Asia Pacific
Australia consumed 118 Mt of coal in 2017 (relatively unchanged from 2016 and 2015), of which 57 Mt was thermal coal, 57 Mt lignite and 4 Mt met coal. The power sector was the country’s only consumer of lignite and the largest consumer of thermal coal. Australia generated 260 TWh of power in 2017, 4 TWh more than in 2016. Despite increased demand, the fleet of hard coal and lignite power stations generated slightly less electricity than in 2016, primarily due to closure of the 1.6-GW Hazelwood lignite power station in March 2017. Hazelwood plant production was replaced by increased hard coal- and natural gas-fired generation, and lignite consumption declined accordingly 4 Mt from 2016 while steam coal consumption (also boosted by slightly higher non-power use) rose 5 Mt.
Chinese Taipei consumed 60 Mt of thermal coal and 8 Mt of met coal in 2017, a 3.5% increase from 2016. While met coal consumption remained flat, thermal consumption increased 2 Mt. With a share of 68%, the power sector was the island’s largest coal consumer. However, although electricity generation increased 9 TWh to 269 TWh in 2017, a large part was generated by nuclear power
3 Laos’ Hongsa lignite-fired power station exports its electricity to Thailand.
© O
EC
D/IE
A, 2
018

RECENT TRENDS IN DEMAND AND SUPPLY
26 COAL 2018
stations; renewables- and natural gas-based generation increased slightly to make up the remainder. With an output of 120 TWh (45% of the energy mix), coal-fired power generation (and thermal coal consumption) stayed roughly the same as in 2016. Higher coal consumption therefore resulted entirely from rising non-power thermal coal demand.
Coal consumption in Pakistan increased substantially, from 9 Mt in 2016 to 14 Mt in 2017, most of it thermal coal to supply the 1 320-MW Sahiwal coal-fired power station commissioned in mid-2017. Record-level cement industry production also boosted thermal coal use.
North America
North American coal consumption has been declining since 2007 at an average rate of 4.5% per year because of coal-to-gas switching and the expansion of renewables in the US power sector. It fell 2.4% to 698 Mt from 2016 to 2017.
United States
North America’s largest economy, the United States, is responsible for more than 90% of the region’s coal consumption. Low natural gas prices after the shale gas revolution precipitated coal-to-gas switching in the power sector, so US thermal coal consumption has been declining steadily at 5% per year since 2007. Coal use fell less significantly in 2017, however: thermal coal declined 16 Mt (-2.7%), compared with 57 Mt in 2016. Moreover, met coal consumption increased 1 Mt to 17 Mt, the first rise since 2013.
Most coal is used in the power sector in the United States. The combination of a milder winter and cooler summer in 2017 reduced electricity demand, however, while generation from renewables also grew strongly (hydropower output was exceptionally high and wind and solar capacity continued to expand). These circumstances curtailed output from fossil fuel-based generators: natural gas-fired generation declined 7.5% (106 TWh) from 2016, a sharper drop than the 2.8% (39 TWh) for coal-fired generation. Higher gas prices (that prompted gas-to-coal switching in some regions) also caused gas-fired generation to decline more strongly.
Over the course of the year, 6.3 GW of coal-fired capacity was retired and no new capacity came online. Consumption by lignite-fired power stations, which are concentrated mainly in Texas and account for less than 5% of installed coal-fired capacity, fell 3 Mt to 64 Mt.
In contrast, US met coal consumption increased 1 Mt to 17 Mt in 2017 as raw steel production edged up 4% (World Steel Association, 2018).
Other North America
Compared with the United States, coal plays only a minor role in power generation in Canada and Mexico.
In Canada, total coal consumption decreased 1 Mt to 36 Mt in 2017. The power sector accounted for an estimated 88% of the country’s coal consumption by energy, but coal was used for only 9% of the 674 TWh of electricity produced because the generation mix is dominated by hydro (58%) and nuclear (15%). With growth in non-hydro renewables and natural gas, coal-fired generation fell 6.7% (4 TWh) to 58 TWh in 2017. As a result, thermal coal consumption declined to 24 Mt. Met coal consumption remained flat at 3 Mt, as did lignite at 9 Mt.
© O
EC
D/IE
A, 2
018

RECENT TRENDS IN DEMAND AND SUPPLY
COAL 2018 27
Mexico consumed 21 Mt of hard coal in 2017 across all sectors, roughly the same as in 2016. Coal is a minor part of the electricity mix: while Mexico generated 319 TWh of power in 2017, total generation from coal fell 8.4% (3 TWh) to 32 TWh, giving it only a 10% share in the mix.
Central and South America With combined coal consumption of only 53 Mt (32 Mt steam coal, 19 Mt met coal and 1 Mt lignite), all the countries of Central and South America together accounted for less than 1% of total global coal use in 2017.
Coal is a minor contributor to the electricity supply systems of Central and South America, where hydro is the leading energy source for electricity generation. Across the region, the share of coal in the generation mix in 2017 was similar to the 5% of the three preceding years.
With consumption of 12 Mt, Chile was the largest thermal coal user in the region. The country generated 30 TWh of coal-based electricity, 37% of its total electricity generation. Additional coal-fired capacity came online recently (October 2016: the 531-MW Cochrane power station), but some coal capacity has also closed in the last two years.
Brazil was the region’s second-largest consumer of thermal coal (10 Mt), even though coal is of only minor importance in the generation mix. Being one of the world’s largest steel producers, the country was also the region’s largest consumer of met coal (15 Mt, which is 1 Mt more than in 2016).
Europe
Europe consumed 812 Mt of coal in both 2016 and 2017. Declining consumption by European Union (EU) members was offset by a commensurate increase mainly in Turkey. There was, however, a shift from hard coal to lignite, with the former falling and the latter rising by 12 Mt.
European Union
EU coal consumption declined 1.1% (7 Mt) to 627 Mt in 2017. Thermal coal consumption dropped a sharp 7% (15 Mt) from 2016, to 188 Mt, whereas met coal remained flat at 58 Mt. The European Union is the world’s largest consumer of lignite, showing a 2% (8 Mt) increase to 381 Mt in 2017. Germany and Poland were the primary coal consumers (see Table 1.5), followed by the Czech Republic (45 Mt), Greece (38 Mt), Bulgaria (35 Mt) and Romania (26 Mt). As lignite is prominent in the power sectors of all these countries, it constitutes most of their consumption. Spain consumed 23 Mt of coal in 2017, 17.5% (3 Mt) more than in 2016, as thermal coal-fired generation filled the gap left by a drop in hydroelectric output. Italy consumed 15 Mt of coal in 2017, 2 Mt less than in 2016, as fuel price movements resulted in natural gas partially displacing coal for power generation.
In units of energy, the EU power sector accounted for 69% of European coal consumption in 2017. As stronger economic growth led to higher electricity demand in almost every member state, EU electricity generation increased 1.4% (47 TWh) to 3 305 TWh. Nevertheless, thermal coal-based generation declined 8% (31 TWh) as a result of capacity retirements (5.7 GW of coal-fired capacity were decommissioned over the course of the year, most of it in Western Europe), partial coal-to-gas switching during some periods of the year (triggered by a steep rise in thermal coal prices) and expanding renewables-based production. Generation from lignite, however, increased slightly (by 2%/6 TWh) as plants in Greece and Bulgaria came back online after outages in 2016. Steam coal-fired plants generated 355 TWh of electricity, while lignite-fired ones (mainly in Germany, Greece and
© O
EC
D/IE
A, 2
018

RECENT TRENDS IN DEMAND AND SUPPLY
28 COAL 2018
Eastern Europe) generated 308 TWh, giving coal an overall 21% share in the EU electricity mix. With these developments, power sector thermal coal consumption fell an estimated 8% from 2016, while lignite consumption edged up slightly. Some substitution of coal by alternative fuels in cement production, and declining coal use for residential heating, also reduced thermal coal consumption.
EU crude steel production increased nearly 4%, but higher levels of scrap steel recycling meant that pig iron production – an intermediate step in the steelmaking process – rose less sharply (World Steel Association, 2018). In addition, high coking coal prices motivated blast furnace operators to increase efficiency, so met coal consumption remained roughly stable from 2016 to 2017.
Table 1.5 Hard coal and lignite consumption in selected European countries (Mt)
Country Hard coal Lignite 2016 2017* Growth 2016 2017* Growth
Austria 4 3 -3% - - -
Belgium 4 4 2% - - -
Bosnia and Herzegovina 1 1 11% 14 14 1%
Bulgaria 1 1 -2% 31 34 11%
Croatia 1 1 -41% - - -
Czech Republic 8 7 -12% 38 38 -1%
Denmark 3 3 -22% - - -
Finland 5 4 -11% - - -
France 13 14 9% - - -
Germany 60 51 -16% 172 171 -0.4%
Greece - - - 34 38 10%
Hungary 2 2 7% 9 8 -12%
Ireland 2 2 -20% - - -
Italy 17 15 -10% - - -
Netherlands 16 15 -11% - - -
Norway 1 1 17% - - -
Poland 75 74 <1% 60 61 1%
Portugal 5 5 14% - - -
Romania 1 1 5% 23 25 7%
Serbia 0 0 -30% 39 40 3%
Slovak Republic 4 4 4% 2 2 -6%
Slovenia 0 0 8% 3 3 -1%
Spain 19 23 18% - - -
Sweden 3 3 -3% - - -
Turkey 39 41 6% 68 72 6%
United Kingdom 18 14 -20% - - -
*Estimated.
Source: IEA (2018b), Coal Information (database), www.iea.org/statistics.
© O
EC
D/IE
A, 2
018

RECENT TRENDS IN DEMAND AND SUPPLY
COAL 2018 29
Germany
Germany’s coal consumption declined 4% (9 Mt) in 2017, entirely due to falling thermal coal consumption with capacity retirements and a partial coal-to-gas switch in the power sector. The country consumed 31 Mt of thermal coal, 19 Mt of met coal and 171 Mt of lignite, making it the European Union’s largest coal consumer.
In 2017, Germany generated 655 TWh of electricity, 0.9% (6 TWh) more than in 2016, of which 53 TWh were net exports (compared with 51 TWh in 2016). With a share of 23%, lignite is still Germany’s largest single power source, although renewables as a whole accounted for 33% of the electricity produced in 2017.
While lignite-fired power stations produced 148 TWh in 2017 (only 1 TWh less than in 2016), steam coal-fuelled generation dropped significantly. High thermal coal prices triggered a partial coal-to-gas switch in early 2017, leading to above-average generation from natural gas (6 TWh more than in 2016). In addition, favourable weather conditions and steadily expanding wind capacity led to higher generation from renewables (+22 TWh). As a result, thermal coal output dropped 17% to 93 TWh and consumption was 10 Mt less than in 2016. Lignite consumption remained largely flat, however.
As detailed in Table 1.6, 3 GW of coal-fired capacity were withdrawn from the market in 2017. Most notably, STEAG retired all remaining blocks of the Voerde and Voerde West power stations (2 GW). Blocks P and Q of RWE’s Frimmersdorf lignite power plant were consigned to the emergency-only standby reserve, with their final decommissioning scheduled for 2021 (Bundesnetzagentur, 2018).
Table 1.6 Coal-fired capacity retirements in Germany
Plant Fuel Capacity (MW) Decommissioned in
Berlin-Klingenberg Lignite 164 May 2017
Frimmersdorf P/Q Lignite 562 October 2017 (2021)
Herne 3 Thermal coal 280 June 2017
Voerde Thermal coal 1 390 March 2017
Voerde West Thermal coal 640 March 2017
Total 3 036 Notes: Klingenberg was converted to burn natural gas. Frimmersdorf P and Q were taken off the grid and moved into the standby reserve, which means they no longer participate in the wholesale market (final decommissioning set for 2021).
Source: Bundesnetzagentur (2018), “Power plant closure notifications”.
Germany consumes very little thermal coal outside its power and heat sectors, so a portion of the lignite produced at its large open-pit mines is set aside for beneficiation, which yields a product that can be sold to industrial users such as cement kilns. Overall non-power coal consumption remained stable in 2017.
Poland
Poland was the European Union’s primary hard coal consumer in 2017. It used 61 Mt of thermal coal and 13 Mt of met coal, in addition to 61 Mt of lignite. For all three types of coal, consumption remained broadly stable from 2016.
Poland generated 170 TWh of electricity in 2017, a 2.2% (4-TWh) increase from 2016. Additional electricity generated in 2017 was entirely from renewables, as overall generation from hard coal- and
© O
EC
D/IE
A, 2
018

RECENT TRENDS IN DEMAND AND SUPPLY
30 COAL 2018
lignite-fired power stations remained nearly unchanged from 2016. The share of coal in the power mix therefore declined slightly to 77%, with 79 TWh generated from steam coal and 52 TWh from lignite.
Other Europe
Turkey consumed 113 Mt of coal in 2017, 5.8% (6 Mt) more than in 2016. Strong growth in industrial output drove up electricity demand, leading to 8.3% (23 TWh) higher power generation (297 TWh produced in 2017). Lower precipitation reduced hydropower output, so generation from both natural gas and coal (both hard coal and lignite) increased. Coal-fired generation grew 5.6% (5 TWh) to 97 TWh, of which lignite accounted for 42 TWh. Coal fuelled 33% of Turkey’s electricity generation with an installed capacity of 18.5 GW at the end of 2017; the commissioning of two 700-MW hard coal-fired generators in ZETES-3 power plant in Catalağzi in 2016 also propelled higher generation. In physical tonnes, lignite consumption increased 4 Mt to 72 Mt, thermal coal by 2 Mt to 35 Mt, and met coal remained largely flat at 6 Mt.
Middle East
With total coal consumption of only 12 Mt in 2017, the Middle East is a minor consumer of coal globally. Israel alone used the majority (8 Mt), most of it steam coal for power generation.
Eurasia
Eurasian countries consumed 363 Mt of coal in 2017: 182 Mt of thermal coal, 101 Mt of met coal and 79 Mt of lignite.
Russia
Russia is the largest consumer of coal in Eurasia, using 90 Mt of thermal coal (up 11.4% or 9 Mt from 2016), 68 Mt of met coal and 79 Mt of lignite in 2017. Most of the thermal coal was used in the power sector.
In 2017, Russia generated 1 093 TWh of power, predominantly from natural gas (48%). Coal-fired power stations generated 171 TWh (16%), the same amount as in 2016.
Russian steel exports grew 22% between 2011 and 2017, making it the third-largest steel exporter in the world (DOC, 2018) and the fifth-largest crude steel producer. Russian met coal consumption rose accordingly, from 58 Mt in 2011 to 70 Mt in 2015, before falling marginally to 68 Mt in 2017.
Other Eurasia
Coal consumption in Ukraine decreased a significant 13% (7 Mt) to 47 Mt in 2017. Thermal coal consumption dropped from 34 Mt to 28 Mt, and met coal fell to 19 Mt (-1 Mt). It appears that loss of control of the Donetsk and Luhansk power plants might have led to these declines.
Kazakhstan consumed 79 Mt of coal in 2017: 61 Mt of thermal coal, 15 Mt of met coal and 3.5 Mt of lignite. Consumption remained largely stable from 2016.
Africa
Africa consumed 203 Mt of coal in 2017, South Africa alone using more than 90%.
© O
EC
D/IE
A, 2
018
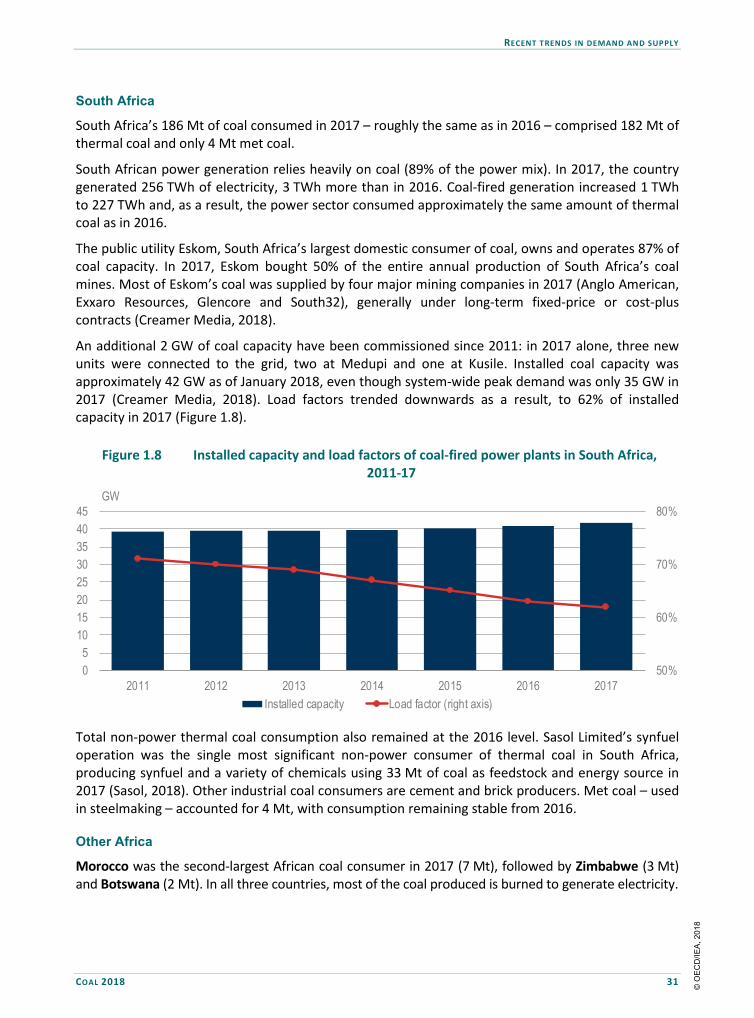
RECENT TRENDS IN DEMAND AND SUPPLY
COAL 2018 31
South Africa
South Africa’s 186 Mt of coal consumed in 2017 – roughly the same as in 2016 – comprised 182 Mt of thermal coal and only 4 Mt met coal.
South African power generation relies heavily on coal (89% of the power mix). In 2017, the country generated 256 TWh of electricity, 3 TWh more than in 2016. Coal-fired generation increased 1 TWh to 227 TWh and, as a result, the power sector consumed approximately the same amount of thermal coal as in 2016.
The public utility Eskom, South Africa’s largest domestic consumer of coal, owns and operates 87% of coal capacity. In 2017, Eskom bought 50% of the entire annual production of South Africa’s coal mines. Most of Eskom’s coal was supplied by four major mining companies in 2017 (Anglo American, Exxaro Resources, Glencore and South32), generally under long-term fixed-price or cost-plus contracts (Creamer Media, 2018).
An additional 2 GW of coal capacity have been commissioned since 2011: in 2017 alone, three new units were connected to the grid, two at Medupi and one at Kusile. Installed coal capacity was approximately 42 GW as of January 2018, even though system-wide peak demand was only 35 GW in 2017 (Creamer Media, 2018). Load factors trended downwards as a result, to 62% of installed capacity in 2017 (Figure 1.8).
Figure 1.8 Installed capacity and load factors of coal-fired power plants in South Africa, 2011-17
Total non-power thermal coal consumption also remained at the 2016 level. Sasol Limited’s synfuel operation was the single most significant non-power consumer of thermal coal in South Africa, producing synfuel and a variety of chemicals using 33 Mt of coal as feedstock and energy source in 2017 (Sasol, 2018). Other industrial coal consumers are cement and brick producers. Met coal – used in steelmaking – accounted for 4 Mt, with consumption remaining stable from 2016.
Other Africa
Morocco was the second-largest African coal consumer in 2017 (7 Mt), followed by Zimbabwe (3 Mt) and Botswana (2 Mt). In all three countries, most of the coal produced is burned to generate electricity.
50%
60%
70%
80%
0 5
10 15 20 25 30 35 40 45
2011 2012 2013 2014 2015 2016 2017
GW
Installed capacity Load factor (right axis)©
OE
CD
/IEA
, 201
8

RECENT TRENDS IN DEMAND AND SUPPLY
32 COAL 2018
Supply After two consecutive years of decline, world coal production grew 3.1% (225 Mt) to 7 549 Mt in 2017, with the world’s three largest producers (China, India and the United States) responsible for the expansion.
Asia Pacific
The Asia Pacific region produces 70% of the world’s coal, as China, India, Australia and Indonesia are four of the world’s five largest producers (the United States is the third-largest producer by mass).
China
In China, the world’s largest coal producer (responsible for nearly half of global annual output), production declined from 2013 to 2016 due to restructuring of the coal mining industry. Closures of inefficient mines and stricter environmental and labour regulations reduced its productive capacity, with almost 500 million tonnes per annum (Mtpa) capacity shut down in 2016 and 2017 combined. Total capacity, including operational mines and those under development, was 4 360 Mtpa at the end of 2017: 3 340 Mtpa operational and 1 020 Mtpa under construction. However, this strong decline from the 5 700 Mtpa reported at the end of 2015 far exceeds the 500 Mtpa closed since then because China’s production capacity reports include mines under development and those being idled.
Nevertheless, bucking the multi-year trend of declining production, Chinese coal output rose 3.3% (108 Mt) to 3 376 Mt in 2017, as prices rose and as the limitation on coal miners’ working days that had been in place for much of the second half of 2016 was relaxed.4 Thermal coal production expanded (+4.2%/110 Mt); in contrast, met coal output remained the same as in 2016 (63 Mt less than in 2015) since most of the new mining capacity that came online was for thermal coal, and many met coal mines had been closed after 2015, particularly in Shanxi.
Figure 1.9 Chinese coal production by province, 2016 and 2017
Sources: Adapted from IHS Markit (2018), Coal McCloskey Price and Statistical Data, https://connect.ihs.com/industry/coal; IEA (2018b), Coal Information (database), www.iea.org/statistics.
4 See IEA (2017) for a more detailed analysis of how the working-day reduction affected Chinese coal production.
0 100 200 300 400 500 600 700 800 900
1 000
Inner
Mon
golia
Shan
xiSh
aanx
iGu
izhou
Xinji
ang
Shan
dong
Anhu
iHe
nan
Ning
xiaHe
bei
Heilo
ngjia
ngSi
chua
nYu
nnan
Gans
uLia
oning
Huna
nJil
inJia
ngsu
Chon
gqing
Fujia
nJia
ngxi
Qing
hai
Guan
gxi
Hube
iBe
ijing
Tianji
nSh
angh
aiZh
ejian
gGu
angd
ong
Haina
n
Mt
2016
2017
© O
EC
D/IE
A, 2
018

RECENT TRENDS IN DEMAND AND SUPPLY
COAL 2018 33
In 2017, coal production increased in all of China’s major coal-producing regions: Inner Mongolia (+9%), Shanxi (+4%) and Shaanxi (+13%), which together accounted for 67% of China’s coal output (Figure 1.9). In most provinces, however, coal output is still significantly below 2015 levels.
In addition to overall output decreasing since 2015, coal production has shifted westward (Figure 1.10). Moving from north-western to south-eastern China, generally mine size and labour productivity fall: the largest and most productive mines are in Inner Mongolia, Shaanxi and Xinjiang (average mine capacity of 1.5 Mtpa), while mines in north-eastern, eastern and southern China have average capacities of only 0.2 Mtpa to 0.7 Mtpa, and labour productivity is lower (CRU, 2017). Thus, as China was closing less-efficient mines, most of the eastern provinces registered significant drops in coal production. The greatest contraction occurred in the northern province of Shanxi (Figure 1.10), which produced 104 Mt less than in 2015. At the same time, production of its western neighbour, Shaanxi, increased 69 Mt, and in Xinjiang it rose 33 Mt. In Inner Mongolia, where the western Ordos and Wuhai prefectures are responsible for nearly 70% of the province’s total output, production grew 16 Mt. This shift is putting the major coal-producing hubs further away from demand centres, increasing transportation costs. Effects of this were already noticed in 2017, resulting in higher seaborne coal imports.
Figure 1.10 Annual coal production differences by province, 2015-17
Source: Adapted from IHS Markit (2018), Coal McCloskey Price and Statistical Data, https://connect.ihs.com/industry/coal; IEA (2018b), Coal Information (database), www.iea.org/statistics.
Capacity cuts, combined with demand growth, did, however, make the Chinese coal mining industry much more profitable. In 2017, China Shenhua Energy Co., the largest listed coal mining company, posted its highest profits since 2012. According to the China National Coal Association, all the 90 largest coal-producing companies reported a fourfold increase in profits from 2016 to 2017 (China Daily, 2018).
-100%-80%-60%-40%-20%0%20%40%60%
- 120- 100
- 80- 60- 40- 20
0 20 40 60 80
Shan
xiHu
nan
Hebe
iSh
ando
ngCh
ongq
ingAn
hui
Qing
hai
Liaon
ingJia
ngxi
Hena
nJia
ngsu
Heilo
ngjia
ngHu
bei
Ning
xiaYu
nnan
Gans
uJil
inFu
jian
Beijin
gGu
angx
iTia
njin
Shan
ghai
Zheji
ang
Guan
gdon
gHa
inan
Guizh
ouSi
chua
nInn
er M
ongo
liaXi
njian
gSh
aanx
i
Mt
Percentage change (right axis)©
OE
CD
/IEA
, 201
8

RECENT TRENDS IN DEMAND AND SUPPLY
34 COAL 2018
India
India’s coal output continued to grow to 730 Mt in 2017, 2.5% (18 Mt) higher than in 2016. Thermal coal production increased 2.5% (16 Mt) to 673 Mt, while met coal output remained broadly flat at 9 Mt. Lignite production rose by 2 Mt to 47 Mt.
Indian coal production is dominated by state-owned mining companies, which were responsible for 82% (600 Mt) of the country’s coal output in 2017. Coal India Limited (CIL), by far the largest, produced 560 Mt in 2017, 4% more than in 2016. It nevertheless missed its annual production target by 34 Mt for a variety of reasons, including abundant rainfall, transportation issues and slower than expected forest clearance operations around some mines. However, sales rose 7% over the year as the company drew down its stocks, especially during the first half of 2017.
CIL is investing heavily to increase production, and at the same time making efforts to restructure its coal mines; for example, it closed 43 underground mines in 2017. Although CIL had 467 mines in 2017, half of its production came from only 15 open-cast mines, meaning that average mine production was just above 0.5 Mtpa. Singareni Collieries Company, another state-owned mining company, also shares this problem: it has over 60 mines, but more than 80% of its production comes from just 14. The small scale of other mines discourages mechanisation, challenging production costs reduction.
Australia
Australia produced 501 Mt of coal in 2017, most of it destined for export. Compared with 2016, output remained largely flat (still 12 Mt below 2015). Around 50% (254 Mt) was thermal coal and 40% (190 Mt) met coal; the remaining 10% (57 Mt) was lignite consumed by the Australian power sector. Despite bad weather and strikes that impeded production at some Queensland mines – as well as Cyclone Debbie-related damage to rail export infrastructure in April 2017 – production increased slightly from 2016 for thermal coal (+1.7%/4 Mt) ) and met coal (+0.4%/1 Mt), even though met coal exports declined. Spurred by high seaborne market prices, several mines in care-and-maintenance mode began operating again in 2017: Glencore restarted met coal production in February at the Integra underground operation in New South Wales, followed by thermal and met coal production at the Collinsville Coal open-cut mine late in the year. In Queensland, Fitzroy Australia brought the Broadlea North met coal mine back into production in late 2017, while Bounty Mining resumed met coal mining at the Cook colliery in the first quarter of 2018.
In contrast, lignite production fell almost 7% (4 Mt) with closure of the Hazelwood lignite power station and the associated mine.
Indonesia
Indonesian coal production climbed 5.2% (24 Mt) in 2017 for total output of 488 Mt, exceeding the government’s 2017 production target of 477 Mt. The main coal-producing regions are Kalimantan and Sumatra. Although most of the coal produced was sub-bituminous with relatively low calorific value and high moisture content, it is low in sulphur and good for blending with bituminous coal from Australia and South Africa, so 80% of production was exported. As Indonesia is a relatively flexible producer with comparably low labour costs, it can ramp up production quickly when seaborne thermal coal prices rise, as occurred in 2017.
© O
EC
D/IE
A, 2
018

RECENT TRENDS IN DEMAND AND SUPPLY
COAL 2018 35
Country focus: Mongolia
Mongolia has some of the world’s largest undeveloped coal reserves, with eight large-scale coal mines (four hard coal and four lignite) currently in operation. While lignite production is largely for domestic consumption, exploitation of hard coal (especially high-quality coking coal) is export-oriented. In 2017, Mongolia’s coal output rose almost 50% to 48 Mt. As China is Mongolia’s only major export destination for geographical reasons, increased output was driven entirely by China’s rising coal import demand. Low-cost Mongolian coal therefore filled the void created by Chinese capacity cuts and restricted seaborne market supplies. Mongolia produced 26 Mt of met coal for export, 16 Mt of steam coal partially for export, and 7 Mt of lignite for domestic consumption.
Most of the country’s coking coal is produced at two major coal fields in the Gobi Desert close to the Chinese border: Tavan Tolgoi and Ovoot Tolgoi/Nariin Sukhait. The Tavan Tolgoi coal field has approximately 1 800 Mt of coking coal and 4 800 Mt of thermal coal, making it one of the largest contiguous coal deposits in the world. The Tsankhi section of the deposit, which holds most of the coal, is owned by Erdenes Tavan Tolgoi (ETT), a state-owned mining company that was tasked with developing the deposit after it was renationalised by the government in 2007. Only the Ukhaa Khudag section is owned by a private entity, the Mongolian Mining Corporation (MMC), which began mining operations there in 2009. ETT followed, starting production at West Tsankhi in 2010 and East Tsankhi in 2013.
The Ovoot Tolgoi mine, owned and operated by SouthGobi Resources Limited, trucks its coking coal 50 kilometres (km) to the Chinese border, where a railway terminus with coal-loading infrastructure was opened in 2007. Ovoot Tolgoi started producing coal in 2008, and 4.65 Mt of coal were mined and sold to buyers across the border in 2017 (SouthGobi Resources, 2018).
Because China is their only export destination and overland transport costs are high, Mongolian producers sell their coal at a significant discount. In 2017, for example, SouthGobi’s average selling price was USD 48 per tonne (/t) for premium semi-soft coking coal from Ovoot Tolgoi (SouthGobi Resources, 2018), while MMC received an average free-on-train (FOT) price of USD 126/t for hard coking coal produced at Ukhaa Khudag (MMC, 2018). These are significantly lower than the 2017 average prices for similar coals on the seaborne market, for instance Australian ultra-low volatile PCI (ULV-PCI) was USD 121/t FOB (free on board) and Australian prime hard coking coal was USD 189/t FOB.
The lack of rail infrastructure linking Mongolia’s export-oriented coal mines to demand centres in China is a problem, as coal must be trucked to the border, raising supply costs.
Other Asia Pacific
Viet Nam produced 40 Mt of anthracite in 2017, roughly the same as the year before, and Thailand mined 16 Mt of lignite for its power stations, 1 Mt less than in 2016. Since opening of the Panian open-pit mine in 2006, thermal coal production in the Philippines has increased steadily to 12 Mt in 2017, half of it exported to consumers overseas. Pakistan produced 4 Mt of coal in 2017: 3 Mt of steam coal and 1 Mt of lignite.
North America North American coal production has been declining steadily since 2007 at an average rate of 3.8% per year. In 2017, however, regional output increased 41 Mt, largely owing to the recovery in coal exports from the United States.
© O
EC
D/IE
A, 2
018

RECENT TRENDS IN DEMAND AND SUPPLY
36 COAL 2018
United States
After a record-level decline in 2016, the United States registered a 6.3% (42-Mt) rise in coal output, producing 702 Mt in 2017. This increase – the largest in absolute terms since 2001 and in percentage terms since 1994 – was propelled by expanding exports to the tight seaborne market and a rebound in domestic coking coal consumption. The United States remains the world’s third-largest coal producer behind China and India. US thermal coal production increased 5.3% (29 Mt) to 573 Mt, while met coal output rose 30% (15 Mt) to 65 Mt. In addition, the country produced 64 Mt of lignite for the power sector.
Other North America
Canada produced 61 Mt of coal in 2017, roughly the same as the year before. Steam coal accounted for 25 Mt and lignite for 9 Mt, almost all consumed domestically. Total met coal production of 27 Mt was mostly for export.
Mexico’s coal mining industry produced 12 Mt of coal in 2017: 7 Mt of thermal and 5 Mt of met coal, all consumed domestically.
Central and South America
Within Central and South America, which produces only 1% of the world’s coal, only Colombia is a relevant supplier. In 2017, the region overall produced 98 Mt of coal, 3.2% (3 Mt) less than in 2016.
Colombia
With production of 89 Mt, Colombia was responsible for almost 90% of Central and South America’s coal output in 2017, as it is endowed with a large amount of high-quality coal resources. Most of the coal mined was thermal coal (83 Mt), although output declined 3% (3 Mt) from 2016 because of lower production at smaller mines. However, the overall combined output of the three largest producers (Drummond, Cerrejón and Glencore) increased 2% (2 Mt). Drummond’s production from its El Descanso and Pribbenow mines in particular rose significantly (+14%) to 32.5 Mt. Production at Cerrejón, the country’s largest mine, was 31.9 Mt, almost the same as in 2016 because further output potential was thwarted by heavy rains that disrupted production in May 2017. Output of Glencore’s Calenturitas and La Jagua mines fell for the second year in a row (to 14.6 Mt) as heavy downpours and difficult mining conditions continued to affect operations, particularly from November 2017 onwards.
Other Central and South America
Brazil produced 5 Mt of coal in 2017, 2 Mt less than in 2016. Brazilian coal is of relatively low calorific value and high in ash and sulphur, so most of it is consumed in power plants close to the mines. In Chile, 2.5 Mt of thermal coal were mined in 2017, nearly the same as in 2016. All its production comes from Mina Invierno mine.
Europe
European coal production increased 1.3% to 608 Mt in 2017. Most of the coal mined in Europe is lignite, which is burned in power stations close to the mines. With output of 524 Mt (15 Mt more than in 2016), Europe was the world’s largest lignite producer by far.
© O
EC
D/IE
A, 2
018

RECENT TRENDS IN DEMAND AND SUPPLY
COAL 2018 37
European Union
EU member states were responsible for 76% (464 Mt) of Europe’s total coal production in 2017, a 1% (4 Mt) rise from 2016. The increase resulted entirely from 3% (11 Mt) higher lignite output as steam coal production continued to drop steadily, by 8% (6 Mt) to 64 Mt in 2017 – just half of EU-28 production of only ten years ago. EU met coal production also fell by 1 Mt to 18 Mt.
Germany is the European Union’s largest lignite producer by far. Its output was 171 Mt in 2017, roughly the same as in 2016 when mining activities ceased at the Schöningen open-pit mine (no additional closures occurred in 2017). In addition, Germany still produced roughly 1.5 Mt of steam coal and 2 Mt of met coal from underground hard coal mines in the Ruhr area.
The European Union’s primary producer of hard coal is Poland. In 2017, restructuring of Poland’s hard coal industry continued: the newly formed mining giant Polska Grupa Górnicza (PGG) took over some Katowicki Holding Węglowy (KHW) mines with financial support from the state-controlled Polskie Górnictwo Naftowe i Gazownictwo (PGNiG), Polska Grupa Energetyczna (PGE) and Energa, and other mines were closed. Thermal coal output fell 4% (4 Mt) from 2016, met coal dropped 6% (1 Mt) and PGG therefore failed to meet its annual output targets, largely because of underinvestment in the coal industry after several years of severe losses. The country produced 54 Mt of thermal coal and 12 Mt of met coal in 2017 from mines in the Upper Silesia and Lublin coal basins. Furthermore, Poland mined 61 Mt of lignite, making it the second-largest EU lignite producer.
The Czech Republic produced roughly 3 Mt of thermal coal and 3 Mt of met coal from mines located in the Czech half of the Upper Silesia basin. Hard coal production declined 1 Mt from 2016, but lignite output remained stable at 39 Mt in 2017.
Behind Germany, Poland and the Czech Republic, the European Union’s other major coal producers were Greece (37 Mt), Bulgaria (34 Mt), Romania (26 Mt) and Hungary (8 Mt), all mining lignite for power generation.
Other Europe
Outside the European Union, other notable coal producers in Europe in 2017 were Turkey (74 Mt of lignite and 3 Mt of hard coal), Serbia (40 Mt of lignite), Bosnia and Herzegovina (14 Mt of lignite), Kosovo (8 Mt of lignite) and the Former Yugoslav Republic of Macedonia (5 Mt of lignite).
Middle East The Islamic Republic of Iran (“Iran”) is the only Middle Eastern coal producer. In 2017, the country mined just over 1 Mt of hard coal, most of it coking coal for domestic steel production.
Eurasia
Eurasia produced 530 Mt of coal in 2017, an increase of 2.4% (13 Mt) from 2016. The region’s main coal producer is Russia, followed by Kazakhstan and Ukraine.
Russia
Russia produces thermal coal, met coal and lignite. In 2017, total production increased 5.7% (21 Mt) to 387 Mt. The strongest increase was in thermal coal production, which grew 7.9% (17 Mt) to 226 Mt, mainly to meet rising export demand as the share of Russian coal in the European and East
© O
EC
D/IE
A, 2
018

RECENT TRENDS IN DEMAND AND SUPPLY
38 COAL 2018
Asian thermal coal markets expanded. Met coal production also increased from 84 Mt in 2016 to 86 Mt in 2017, and 76 Mt of lignite were mined in 2017, a 2.9% (2-Mt) increase from 2016.
Other Eurasia
Kazakhstan produced 85 Mt of thermal coal, 15 Mt of met coal and 6 Mt of lignite in 2017. While thermal coal production expanded 2% (3 Mt) from 2016, met coal and lignite output remained flat.
In March 2017, the Ukrainian government imposed a trade blockade on non-controlled areas of Donbas (the Donetsk and Luhansk regions), a major coal-producing region in Ukraine, which further disrupted coal shipments from rebel-held to government-held areas. Hard coal production contracted a dramatic 28.4% (11 Mt) to 29 Mt in 2017 as a result, the lowest output in decades. Met coal production was affected the most, with output dropping 50% to 5 Mt.
Africa
In 2017, 275 Mt of coal were produced in Africa. South Africa was the continent’s dominant coal producer at 94% of total output.
Country focus: South Africa
South Africa produced 257 Mt of coal in 2017 (253 Mt of steam coal and 4 Mt of met coal), making it the world’s sixth-largest coal producer. At only a 0.7% (2 Mt) increase from 2016, coal output remained largely flat. Roughly half was purchased by the state-owned utility Eskom for use in its coal-fired power stations, and another 71 Mt were exported.
Most of South Africa’s coal reserves are in the province of Mpumalanga, which is home to the Witbank, Highveld and Ermelo coal fields. Mined extensively, they provide almost 80% of the country’s total run-of-mine production. However, most Mpumalanga mines are at peak production, so output is expected to decline in upcoming years. As a result, mining activities are gradually shifting to the northern Limpopo province on the border with Mozambique (Chamber of Mines, 2018). The Waterberg coal field, where Exxaro’s Grootgeluk mine is situated, is estimated to contain 40% of South Africa’s coal resources (Map 1.1).
South Africa’s coal mining industry was a major employer in 2017, directly employing 82 248 people (Minerals Council, 2018). Anglo American, Exxaro, Sasol Mining, South32 and Glencore were the country’s largest producers: these five companies together account for three-quarters of the country’s coal output. Anglo American produced 49 Mt. Exxaro produced 44 Mt in 2017, 70% of it under contract for Eskom and 17% exported to customers overseas. Sasol Mining produced 36 Mt, used primarily for synthetic fuels and chemical production in Sasol Limited’s plant, although 3 Mt were sold to customers in South Africa and abroad (Sasol, 2018). South32’s mines produced 29 Mt, with 41% going to buyers overseas (South32, 2018a), and Glencore also produced 29 Mt, 65% for export (Glencore, 2018). Smaller companies accounted for the remaining 70 Mt of South Africa’s coal production.
Two additional mines launched commercial operations in 2017: in March, Universal Coal’s New Clydesdale Colliery on the southern fringes of the Witbank coal field delivered its first shipment of thermal coal to Eskom. In May, the first coal left Khanyisa coal mine, owned by Wescoal (Creamer Media, 2017).
© O
EC
D/IE
A, 2
018

RECENT TRENDS IN DEMAND AND SUPPLY
COAL 2018 39
Dedicated coal railway lines operated by Transnet Freight Rail (TFR) connect the mines in Limpopo and Mpumalanga to the Richards Bay Coal Terminal, which handles most of South Africa’s coal exports. Current total line capacity is approximately 81 Mtpa, with upgrades to 97.5 Mtpa planned. In the 2017 fiscal year, TFR transported 73.8 Mt of coal, 2.4% more than in 2016 (Transnet, 2018).
Map 1.1 Location and ownership of major coal mines and projects in South Africa (2017)
Source: Adapted from Chamber of Mines (2018), Coal Strategy 2018.
A major shift in ownership structures within the South African coal mining industry is currently under way, driven in part by Eskom’s goal of sourcing all its coal from mines that are at least 51% black-owned. In 2017, Anglo American sold its New Vaal, New Denmark and Kriel coal mines – including the supply agreement with Eskom – to the majority black-owned Seriti Resources (Creamer Media, 2017). In 2018, the company also sold the New Largo coal project, an undeveloped mine slated to deliver coal to Eskom’s 4 800-MW Kusile power plant, to New Largo Coal, a consortium owned by Seriti Resources, Coalzar and the Industrial Development Corporation (Creamer Media, 2018). With this transaction,
Pretoria1 2 3 4
5
6
8
9 1018
17
1213
1415 1611
719 20 21
22
23
24
25
© O
EC
D/IE
A, 2
018

RECENT TRENDS IN DEMAND AND SUPPLY
40 COAL 2018
Anglo American completed its sale of Eskom-oriented mines but continues to maintain its significant export-oriented production capacities as well as some minor domestic supply. In April 2018, South32 – itself demerged from BHP Billiton in 2015 – followed suit and spun off its energy-related coal mining operations into a separate, independently managed company, South Africa Energy Coal (SAEC), with the objective of gradually increasing the stake held by local investors (South32, 2018b).
Other Africa
Mozambique is the continent’s second-largest coal producer. Large-scale coal extraction started in 2010 when Riversdale Mining opened its first mine in the Moatize basin. The Brazilian mining giant Vale now dominates coal production. With commissioning of the Northern Logistics Corridor (a dedicated railway line to the port of Nacala), Vale no longer relies on the lower-capacity Sena line, for which services were briefly interrupted by rebels in 2016. Furthermore, a second coal processing plant was opened at the end of the year, allowing production to ramp up further. As a result (and also motivated by high prices), Mozambique’s mines produced 11 Mt of coal in 2017 (7 Mt of met coal and 4 Mt of thermal coal) – 85% (5 Mt) more than in 2016.
References Bundesnetzagentur (2018), “Power plant closure notifications”, www.bundesnetzagentur.de/EN/Areas/Energy/Companies/SecurityOfSupply/GeneratingCapacity/List_of_closure_notifications/List_of_closure_notifications_node.html (accessed 2 August 2018).
Chamber of Mines (2018), Coal Strategy 2018, Chamber of Mines Coal Leadership Forum, www.mineralscouncil.org.za/component/jdownloads/send/25-downloads/535-coal-strategy-2018 (accessed 15 August 2018).
China Daily (2018), “Chinese coal producers see surging profits in 2017”, Xinhua News Agency, 29 March 2018, www.chinadaily.com.cn/a/201803/29/WS5abccf91a3105cdcf651525e.html (accessed 2 August 2018).
Creamer Media (2018), Electricity 2018: A Review of South Africa’s Electricity Sector, Creamer Media Research Channel Africa, Johannesburg, March 2018.
Creamer Media (2017), Coal 2017: A Review of South Africa’s Coal Sector, Creamer Media Research Channel Africa, Johannesburg, November 2017.
CRU (2017), Thermal Coal Cost Reports and Profiles, CRU Group, London, www.crugroup.com.
DOC (US Department of Commerce) (2018), “Steel exports report: Russia”, Global Steel Trade Monitor, March 2018, DOC International Trade Administration, Washington, DC, www.trade.gov/steel/countries/pdfs/2017/annual/exports-russia.pdf.
ENTSO-E (2018), Statistics and Data, www.entsoe.eu/publications/statistics-and-data/.
Glencore (2018), Annual Report 2017, Glencore, Baar, Switzerland, www.glencore.com/investors/reports-results/report-archive.
ICIS (2018), ICIS LNG Edge, www.icis.com/energy/liquefied-natural-gas/lng-edge.
© O
EC
D/IE
A, 2
018

RECENT TRENDS IN DEMAND AND SUPPLY
COAL 2018 41
IEA (International Energy Agency) (2018a), Global Gas Security Review 2018, OECD/IEA, Paris.
IEA (2018b), Coal Information (database), www.iea.org/statistics.
IEA (2017), Coal 2017: Analysis and Forecasts to 2022, OECD/IEA, Paris.
IEA (2016), Medium-Term Coal Market Report 2016: Analysis and Forecasts to 2021, OECD/IEA, Paris.
IHS Markit (2018), Coal McCloskey Price and Statistical Data, https://connect.ihs.com/industry/coal.
Minerals Council (2018), Coal – Key Facts and Figures, www.mineralscouncil.org.za/sa-mining/coal (accessed 17 August 2018).
MMC (Mongolian Mining Corporation) (2018), Annual Report 2017, www.mmc.mn/uploads/MMC%20AR2017_ENG_f.pdf.
Sasol (2018), “Production and sales metrics for the period ended 31 December 2017”, www.sasol.com/investor-centre/financial-reporting/business-performance-metrics (accessed 20 August 2018).
SouthGobi Resources Ltd (2018), Annual Report 2017, www.southgobi.com/html/ir_reports.php.
South32 (2018a), Quarterly Report, December 2017, www.south32.net/docs/default-source/exchange-releases/quarterly-report-december-2017.pdf.
South32 (2018b), South Africa Energy Coal, www.south32.net/what-we-do/places-we-work/south-africa-energy-coal (accessed 20 August 2018).
Transnet (2018), Freight Rail 2017, www.transnet.net/InvestorRelations/AR2017/OD%20Reports/8335_Transnet%202017_Freight%20Rail%20HR-compressed.pdf.
USGS (US Geological Survey) (2018), Cement Statistics and Information, https://minerals.usgs.gov/minerals/pubs/commodity/cement/.
World Bank (2018), World Development Indicators (database), http://databank.worldbank.org/data/home.aspx (accessed 2 August 2018).
World Steel Association (2018), Statistics, www.worldsteel.org/steel-by-topic/statistics.html.
© O
EC
D/IE
A, 2
018

© O
EC
D/IE
A, 2
018

RECENT TRENDS IN INTERNATIONAL COAL TRADE
COAL 2018 43
2. RECENT TRENDS IN INTERNATIONAL COAL TRADE
Highlights • The total traded market volume increased to 1 373 million tonnes (Mt) in 2017, 3.5%
(46 Mt) more than in 2016. By weight, thermal coal accounted for 75% of coal traded internationally, met coal for 24% and lignite for 1%. Seaborne trade made up 89%, with 6% more thermal coal trade than in 2016 and metallurgical (met) growing 2.5%.
• The People’s Republic of China (“China”) was the largest importer of coal in 2017. Indian and Korean imports grew significantly in 2017. China’s thermal coal imports expanded 2% to 212 Mt, while its met coal imports rose 15% to 70 Mt. India’s thermal coal imports rebounded to 161 Mt, 9% above the 2016 level, and Korea registered a 12% increase to 113 Mt.
• Indonesia overtook Australia to become the world’s largest coal exporter, prompted by higher prices and demand from China. Australia’s coal exports declined 2.6% (10 Mt) in 2017, largely due to weather-related disruptions, but it remains the world leader in the met coal market as well as by energy content and export value.
• Coal exports from the United States rose 60% (50 Mt) from 2016, highlighting its role as a “swing supplier” that is able to send significant volumes to the market on short notice when seaborne prices are high. Coal exports from the Russian Federation (“Russia”) increased 11% (19 Mt) to 187 Mt, making it the world’s third-largest exporter after Indonesia and Australia. Russia is becoming an increasingly important supplier to the Pacific Basin, as half its exports were sent there in 2017.
• After rising sharply in 2016, both thermal and met coal prices remained high throughout 2017 and into 2018. High prices were provoked by robust demand and tight supply resulting from ongoing supply-side reforms in China and insufficient investment in new capacity in almost all exporting countries.
• Market segmentation is increasing. With trade in low-calorific-value coal soaring, price gaps among the various qualities of coal are widening. The gap between Newcastle 6 000 kilocalories per kilogramme (kcal/kg) coal and 5 500-kcal/kg coal rose to over USD 50 per tonne (/t), the highest price gap ever recorded between these grades.
• In 2017, coal supply costs increased in virtually all producer nations, partly due to rising costs of major inputs such as diesel fuel. Furthermore, higher coal prices caused producers to relax their cost discipline of the past several years, contributing to general supply-cost inflation.
Market volumes and trade flows International coal trade recovery accelerated in 2017, with the total traded market volume increasing to 1 373 Mt, up 3.5% (46 Mt) from 2016 (Figure 2.1). By weight, thermal coal accounted for 75% of international trade, met coal for 24% and lignite for 1%.
© O
EC
D/IE
A, 2
018

RECENT TRENDS IN INTERNATIONAL COAL TRADE
44 COAL 2018
Figure 2.1 Trade development of seaborne thermal (left) and met coal (right), 2012-17
Source: IEA (2018), Coal Information (database), www.iea.org/statistics.
Thermal coal In 2017, 1 031 Mt of thermal coal were traded internationally, 90% of it by sea – a 6% (54-Mt) increase from 2016. However, thermal coal is still mostly produced and consumed locally: only 18% of the world’s annual thermal coal consumption is imported.
Using different colours to designate the world’s main coal trade flows, Map 2.1 indicates that both the major thermal coal exporters and importers are in the Pacific Basin. With a market share of 38%, Indonesia is now the largest exporter, followed by Australia (19.5%), Russia (15%), Colombia (8%), South Africa (7%) and the United States (4%).
Map 2.1 Main trade flows in the seaborne thermal coal market, 2017 (Mt)
Note: Exports from Russia to Europe include exports via railway. Sources: Adapted from IHS Markit (2018a), Coal McCloskey Price and Statistical Data, https://connect.ihs.com/industry/coal; IEA (2018), Coal Information (database), www.iea.org/statistics.
-10%
-5%
0%
5%
10%
15%
0 200 400 600 800
1 0001 200
2012 2013 2014 2015 2016 2017
Mt
Thermal coal Metallurgical coal Annual growth (right axis)
-10%
-5%
0%
5%
10%
15%
0
100
200
300
2012 2013 2014 2015 2016 2017
Mt
© O
EC
D/IE
A, 2
018

RECENT TRENDS IN INTERNATIONAL COAL TRADE
COAL 2018 45
Total imports expanded in virtually all major importing countries/regions in 2017, as did exports from Indonesia, Russia and the United States (Table 2.1). The considerable decline in the “Other” category results from the embargo on exports from the Democratic People’s Republic of Korea, which fell from 23 Mt in 2016 to less than 5 Mt in 2017.
Table 2.1 Thermal coal exports in 2017 (Mt) and net changes from 2016 (colour-coded)
Source: IEA (2018), Coal Information (database), www.iea.org/statistics.
Metallurgical coal With a total traded volume of 327 Mt in 2017, the international met coal market is only one-third the size of the thermal coal market.
Map 2.2 Main trade flows in the seaborne met coal market, 2017 (Mt)
Note: Exports from Russia to Europe include exports via railway. Mongolian exports to China are inland exports only. Due to their importance for the global seaborne trade they are included in the map.
Sources: Adapted from IHS Markit (2018a), Coal McCloskey Price and Statistical Data, https://connect.ihs.com/industry/coal; IEA (2018), Coal Information (database), www.iea.org/statistics.
6.0 -1.5 2.9 -0.3 -1.7 -0.7 -3.1 -1.3 0.0 0.1 0.4
5.2 4.2 -1.6 4.5 7.8 -1.8 0.1 0.9 -0.1 -0.1 19.2
-0.1 -5.0 0.3 4.9 4.0 -2.6 0.0 -0.3 0.6 -0.9 0.9
-0.2 -2.0 1.7 -0.6 0.3 -2.8 3.7 1.3 0.0 -0.4 1.0
0.1 4.9 2.1 4.7 0.5 6.1 0.4 1.3 0.1 0.1 20.3
5.6 -0.6 -1.2 -0.4 -0.2 10.4 -0.2 -0.2 0.5 0.5 14.2
-12.5 14.6 -0.8 -0.1 6.3 -0.3 0.8 -1.4 4.0 0.0 10.7
4.3 14.7 2.5 13.4 17.1 8.7 1.6 -0.1 5.1 -0.6
Australia 43 3 82 31 40 0 0 2 0 0 202
Indonesia 121 99 31 41 89 6 1 1 0 0 389
South Africa 0 34 0 8 15 8 0 1 1 3 70
Colombia 0 0 2 3 1 45 14 15 0 4 83
United States 0 7 3 6 1 15 4 2 0 0 38
Russia 21 3 14 22 17 74 0 1 4 3 158
Other 27 14 7 2 13 9 1 4 30 0 107
TOTAL 212 161 140 113 174 156 20 25 35 10
North America
To From China India Japan Korea
Other Asia Pacific Europe TOTAL
Middle EastEurasia
Latin America
-15 Mt +20 Mt0 Mt
© O
EC
D/IE
A, 2
018

RECENT TRENDS IN INTERNATIONAL COAL TRADE
46 COAL 2018
However, cross-border trade plays a more important role in met coal supply: roughly 30% of total annual consumption is imported, 85% of it by sea. Although international met coal trade overall grew 14 Mt or 4.5% from 2016 to 2017, seaborne volumes expanded more slowly, by approximately 2.5% (7 Mt). The met coal market is dominated by Australia, which is a major supplier to both the Asia Pacific region and Europe (Map 2.2). Other important exporters are the United States, Canada, Russia, Mongolia and – increasingly – Mozambique. In 2017, these six countries supplied 97% of the world’s met coal exports. Australia held 55% of the market, followed by the United States (15%), for which exports increased significantly, particularly to Europe. Russia (9%) and Mongolia (8%) also exported more than in 2016. Since seaborne trade overall grew from 2016 and Canada’s exports remained largely stable, its market share dropped to 8%. Mozambique still has only a 2% market share, but its exports nearly doubled from 2016 to 2017.
Regional analysis
Exporters
Indonesia
Indonesia overtook Australia in 2017 to become the world’s largest exporter of coal (by weight), a position it had already held between 2011 and 2014. As Indonesian exports are very price sensitive (i.e. production can increase rapidly when prices are attractive), they were able to take advantage of higher seaborne market prices. Around 80% of the coal produced in Indonesia was exported, almost all of it to Asia, and mostly of low calorific value.1 Thermal coal exports expanded to 389 Mt, up 5% (+19 Mt) from 2016 (Figure 2.2). China was the primary buyer, receiving 31% of Indonesia’s exports (5 Mt more than in 2016), and India took 25%, a 4-Mt increase.
Figure 2.2 Indonesian thermal coal exports, 2007-17
ROW = rest of world.
Sources: Adapted from IHS Markit (2018a), Coal McCloskey Price and Statistical Data, https://connect.ihs.com/industry/coal; IEA (2018), Coal Information (database), www.iea.org/statistics.
1 Some lignite is also exported, but it is not reported as such.
0 50
100 150 200 250 300 350 400 450
2007 2008 2009 2010 2011 2012 2013 2014 2015 2016 2017
Mt
ROW
Europe
China
Southeast Asia
Chinese Taipei
Korea
Japan
India
© O
EC
D/IE
A, 2
018

RECENT TRENDS IN INTERNATIONAL COAL TRADE
COAL 2018 47
Australia
Australian coal exports fell 2.6% (10 Mt) to 379 Mt in 2017, causing Australia to lose its position as the world’s top coal exporter by weight – but not by energy or export value (which is the highest ever owing to high prices). Of its 2017 production, 76% was exported.
Almost half of the coal Australia exported was met coal (177 Mt), making up 55% of the global met coal trade (Figure 2.3). It achieved this export level despite a 5.7% (11-Mt) decline from 2016 due mainly to production shortfalls and railway damage caused by Cyclone Debbie on 28 March 2017. In addition, the small price differential between semi-soft coking coal and Newcastle 6 000 kcal/kg coal caused some producers to forego further washing and sell their output as thermal rather than met coal.
Figure 2.3 Australian exports of thermal coal (left) and met coal (right), 2007-17
Sources: Adapted from IHS Markit (2018a), Coal McCloskey Price and Statistical Data, https://connect.ihs.com/industry/coal; IEA (2018), Coal Information (database), www.iea.org/statistics.
China took 10.7% (4 Mt) more Australian met coal than in 2016, and although it was still the largest buyer with a share of 24%, for the first time India was roughly on a par with China. Japan followed, but its share decreased from almost 41% in 2007 to 21% in 2017. Europe also remained an important customer, receiving 9.5% of Australia’s exports in 2017, just behind Korea with 10%.
Thermal coal exports remained similar to 2016, as strikes and logistics problems in New South Wales limited throughput volumes at the state’s ports. Japan, with a 41% share, remained the main consumer of Australian thermal coal, increasing its imports by 3 Mt to 82 Mt. Australia’s thermal coal, known for its high quality and consistency, is the preferred fuel for Japan’s high-efficiency coal-fired power stations. China also continued to enlarge its imports of Australian thermal coal to a share of 21% in 2017, and it was followed by Korea (15%), Chinese Taipei (12%) and Southeast Asia (8%).
Russia
With total exports of 190 Mt, an increase of 11% (19 Mt) from 2016, Russia cemented its position as the world’s third-largest exporter of coal in 2017. Thermal coal made up 83% (158 Mt) of exports, 12% (23 Mt) was met coal and 5% (9 Mt) was lignite (Figure 2.4). Russia exported half its domestic production in 2017, compared with 30% in 2005 and just over 40% in 2010.
0
40
80
120
160
200
240
2007 2009 2011 2013 2015 2017
Mt
India Japan Korea Chinese Taipei Europe China Southeast Asia ROW
0
40
80
120
160
200
240
2007 2009 2011 2013 2015 2017
Mt
© O
EC
D/IE
A, 2
018

RECENT TRENDS IN INTERNATIONAL COAL TRADE
48 COAL 2018
Russia’s extensive railway network enables the long-distance transportation of coal from its main production centre – the Kuznetsk Basin in southwestern Siberia – to ports in the Russian Far East and on the Arctic, the Baltic and the Black Sea. This makes Russia an important exporter in both the Atlantic and the Pacific basins. In 2017, roughly half of Russia’s thermal coal exports were destined for the Asia Pacific region, while 45% went to Europe.
Figure 2.4 Russian exports of thermal coal (left) and met coal (right), 2008-17
Sources: Adapted from IHS Markit (2018a), Coal McCloskey Price and Statistical Data, https://connect.ihs.com/industry/coal; IEA (2018), Coal Information (database), www.iea.org/statistics.
Russia’s thermal coal exports grew 10% (15 Mt) in 2017; in Asia, Korea was the largest consumer (21 Mt). Exports to Europe increased 16.5% (10 Mt) in 2017, where shipments from Russia partially replaced imports from Colombia and South Africa. Met coal exports rose slightly (+1 Mt) from 2016, with Ukraine remaining the primary importer at 6 Mt (27% of Russia’s annual met coal exports). Another 60% went to Asia Pacific countries and the remaining 13% (3 Mt) were exported to various European countries.
United States
The United States was the fourth-largest coal exporter in the world overall in 2017 (88 Mt) and the second-largest met coal exporter specifically as met coal made up roughly two-thirds of exports (50 Mt) (Figure 2.5).
Due to the position of US exports in the supply-cost curve with most US exporters among the high-cost suppliers, they are highly price-sensitive. This can lead to relatively large year-on-year (y-o-y) fluctuations in exports, as US met coal production scales up whenever the market is tight, for instance when high demand and constrained production by lower-cost producers such as Colombia or Australia coincide, leading to a price rise.
US coal exports grew 60% (33 Mt) from 2016 to 2017. Thermal coal rose the most significantly (+20 Mt), in response to rising Asia Pacific demand, and Europe also invited higher steam coal imports from the United States to make up for lower volumes from Colombia and South Africa.
0
40
80
120
160
200
2008 2011 2014 2017
Mt
Germany Netherlands United Kingdom Turkey China Other Europe Other Asia Pacific ROW
0
5
10
15
20
25
2008 2011 2014 2017
Mt
© O
EC
D/IE
A, 2
018

RECENT TRENDS IN INTERNATIONAL COAL TRADE
COAL 2018 49
Figure 2.5 US exports of thermal coal (left) and met coal (right), 2007-17
Sources: Adapted from IHS Markit (2018a), Coal McCloskey Price and Statistical Data, https://connect.ihs.com/industry/coal; IEA (2018), Coal Information (database), www.iea.org/statistics.
Colombia
In 2017, Colombia was the world’s fifth-largest exporter of coal (86 Mt). It had the highest export-to-production ratio of all the major exporters, sending 96% of its production abroad, almost exclusively thermal coal (Figure 2.6). Colombian thermal coal exports rose 1.3% (1 Mt) from 2016.
Figure 2.6 Colombian exports of thermal coal, 2007-17
Sources: Adapted from IHS Markit (2018a), Coal McCloskey Price and Statistical Data, https://connect.ihs.com/industry/coal; IEA (2018), Coal Information (database), www.iea.org/statistics.
Europe was the primary destination, with close to 54% (45 Mt) of Colombia’s exports crossing the Atlantic – a 6% (3 Mt) reduction from 2016. Within Europe, the largest importers are the European Union (28 Mt; primarily the Netherlands, Germany, Spain and Portugal) and Turkey (17 Mt).
0
10
20
30
40
50
60
70
2007 2009 2011 2013 2015 2017
Mt
Europe Asia Pacific Central and South America North America ROW
0
10
20
30
40
50
60
70
2007 2009 2011 2013 2015 2017
Mt
0 10 20 30 40 50 60 70 80 90
2007 2008 2009 2010 2011 2012 2013 2014 2015 2016 2017
Mt
ROW
Asia Pacific
Central andSouth America
North America
Europe
© O
EC
D/IE
A, 2
018

RECENT TRENDS IN INTERNATIONAL COAL TRADE
50 COAL 2018
Other destinations include other Central and South American countries (14.5 Mt) and North America (14 Mt). Mexico’s imports from Colombia rose significantly, from 2 Mt in 2016 to 7 Mt in 2017, and 6 Mt were shipped to the Asia Pacific region.
South Africa
Around 28% of the coal produced in South Africa is exported. Most of it is thermal coal, exports of which expanded 1.3% (1 Mt) to 70 Mt in 2017 (Figure 2.7). Europe used to be the main export destination for South African thermal coal, with a market share of over 80% as late as 2004. Since then, with demand in Asia and production in Colombia on the rise, shipments to Europe have steadily declined to 11%. India has since replaced Europe as the main offtaker, receiving 44% of South Africa’s exports in 2017, although this was 10% (3.5 Mt) lower than in 2016 mainly due to increasing competition from high-sulphur US coal, in particular in the cement sector.
Figure 2.7 South African exports of thermal coal, 2007-17
Sources: Adapted from IHS Markit (2018a), Coal McCloskey Price and Statistical Data, https://connect.ihs.com/industry/coal; IEA (2018), Coal Information (database), www.iea.org/statistics.
Other important destinations were Korea and Pakistan, both of which imported additional amounts of 4.5 Mt (Korea) and 3 Mt (Pakistan) in 2017, to each receive 10% of South Africa’s thermal coal exports. Other destinations in the Asia Pacific region, as well as importers in Africa, took market shares of 9% each.
Prior to 2014, China was also an important buyer of South African coal. When the Chinese government introduced an import tax, however, coal from South Africa was replaced with imports from Australia and Indonesia because their free trade agreements with China exempt them from the import tax and allow them to supply coal to the Chinese market at a lower price.
Other countries
Canada exported 29 Mt of met coal in 2017, up 1 Mt from 2016, making it the world’s third-largest met coal exporter; 72% of it went to the Asia Pacific region, particularly Japan (7 Mt), Korea (6 Mt), China (5 Mt) and India (3 Mt). Europe received 13% of the exports, Ukraine and Germany (1 Mt each) were the largest importers. Thermal coal exports were negligible at only 2 Mt.
0
10
20
30
40
50
60
70
80
2007 2008 2009 2010 2011 2012 2013 2014 2015 2016 2017
Mt
ROW
Africa
Other Asia Pacific
China
Europe
Korea
Pakistan
India
© O
EC
D/IE
A, 2
018

RECENT TRENDS IN INTERNATIONAL COAL TRADE
COAL 2018 51
Mongolia was the fourth-largest met coal exporter in 2017 at 26 Mt (5 Mt more than in 2016), all of it sent to China. Exports of thermal coal also more than doubled to 7 Mt, also to China. Because inland transportation costs are high, prices received by Mongolian suppliers are lower than those on the seaborne market and make it very price-sensitive. As Mongolia is landlocked, it relies completely on the Chinese market.
Kazakhstan exported 24 Mt thermal coal and roughly 1 Mt of met coal in 2017, almost all of it to Russia. Steam coal exports increased around 1 Mt from 2016, while met coal exports remained the same.
In 2017, Poland exported 2.8 Mt of met coal and 4.3 Mt of thermal coal, mostly to the Czech Republic. While met coal exports were slightly higher than in 2016 (0.7 Mt), those of thermal coal declined 2.3 Mt with the fall in domestic thermal coal production.
Even though it is a net importer of coal, the Philippines began exporting thermal coal from its Panian open-pit mine in 2006, mostly to China. In 2017, it exported 5.8 Mt, 1 Mt less than in the year before.
Mozambique exports both thermal and met coal. After rising from less than 1 Mt in 2015 to 5.4 Mt in 2016, thermal coal exports fell slightly to 4.8 Mt in 2017. In contrast, met coal exports increased 3 Mt to 7 Mt. Roughly 40% of the met coal was shipped to Europe, while most of the rest went to Korea and Japan.
Importers
China
China’s imports of both thermal and met coal continued to expand in 2017, with thermal rising 2% (4 Mt) to 212 Mt and met 15% (11 Mt) to 70 Mt (Figure 2.8). The supply-side reform of the mining industry underpinning this trend has had a stronger impact on coking coal, for which imports increased more than for thermal, even though demand for thermal coal rose more. Mine closures in Shanxi, the largest coking-coal-producing province, were not offset by commissioning of new capacity. In China, import volumes are not only the result from cost arbitrage between imports and domestic supply, but also from numerous policies.
Figure 2.8 Chinese imports of thermal coal (left) and met coal (right), 2007-17
Sources: Adapted from IHS Markit (2018a), Coal McCloskey Price and Statistical Data, https://connect.ihs.com/industry/coal; IEA (2018), Coal Information (database), www.iea.org/statistics.
0
50
100
150
200
250
300
2007 2009 2011 2013 2015 2017
Mt
Australia Indonesia Viet Nam Russia Mongolia Canada South Africa ROW
0
20
40
60
80
100
2007 2009 2011 2013 2015 2017
Mt
© O
EC
D/IE
A, 2
018

RECENT TRENDS IN INTERNATIONAL COAL TRADE
52 COAL 2018
From July to December 2017, for example, several small Chinese ports stopped accepting foreign coal shipments, while the average time to clear imports through customs increased from 7-10 days to 20-40 days. Import quotas, shipping caps in northern ports, quality tests, etc., also affected the balance between domestic coal shipped from northern ports and imports.
Since 2009, Mongolia has been a major supplier of met coal to China. Imports expanded another 10% (2.3 Mt) from 2016 to 2017, giving Mongolia a market share of 38% (26 Mt), second only to Australia at 44% (31 Mt). With a 7% (5 Mt) share of China’s import market, Russia became the third-largest source of met coal imports, narrowly overtaking Canada’s share, which dropped to 6% (4 Mt).
India
After having declined for two consecutive years, Indian thermal coal imports rebounded 9% (15 Mt) to 161 Mt in 2017, making India the world’s second-largest coal importer (Figure 2.9). For geographical reasons, Indonesia and South Africa were its primary sources of seaborne thermal coal. Indonesia supplied 66%, with imports from the country increasing 11% (12 Mt) to 106 Mt in 2017. South Africa’s share was 24%, and the shipped volume rose by 4.6% (2 Mt) to 39 Mt. Other thermal coal producers contributed only minimally to India’s import mix. Interestingly, thermal coal imports from the United States doubled to 7 Mt in 2017, surpassing those from Australia, which dropped almost 30% to 3.5 Mt.
Figure 2.9 Indian imports of thermal coal (left) and met coal (right), 2007-17
Sources: Adapted from IHS Markit (2018a), Coal McCloskey Price and Statistical Data, https://connect.ihs.com/industry/coal; IEA (2018), Coal Information (database), www.iea.org/statistics.
India imported 47 Mt of met coal in 2017, roughly the same as in 2016 and 2015. Although imports fell 2% (1 Mt) from 2016, Australia remained the dominant supplier at 83% (39 Mt). Other relevant met coal suppliers were the United States and Canada, with a combined market share of 13% (6 Mt).
Japan
Japan imported 140 Mt of thermal coal and 47 Mt of met coal in 2017 (Figure 2.10). While thermal coal imports rose 1.7% (2.5 Mt) from the previous year, met coal imports declined slightly.
Japan’s most important thermal coal suppliers were Australia, at 62% (86 Mt), and Indonesia, at 21% (29 Mt). With a share of 10% (14 Mt), Russia was the third-largest import source. As import volumes
0
50
100
150
200
250
2007 2009 2011 2013 2015 2017
Mt
Australia Indonesia South Africa Canada United States ROW
0
15
30
45
60
2007 2009 2011 2013 2015 2017
Mt
© O
EC
D/IE
A, 2
018

RECENT TRENDS IN INTERNATIONAL COAL TRADE
COAL 2018 53
from all three countries remained roughly the same as in 2016, the rise in total thermal coal imports resulted mainly from a greater number of coal purchases from US exporters (2 Mt more) and from other suppliers around the world.
With a market share of 63% (30 Mt), Australia was also the dominant supplier of met coal to Japan, followed by Canada (7 Mt), the United States (5 Mt) and Russia (3 Mt). Imports from the United States were 2 Mt higher than in 2016.
Figure 2.10 Japanese imports of thermal coal (left) and met coal (right), 2007-17
Sources: Adapted from IHS Markit (2018a), Coal McCloskey Price and Statistical Data, https://connect.ihs.com/industry/coal; IEA (2018), Coal Information (database), www.iea.org/statistics.
Korea
Korean coal imports rose substantially in 2017, mostly thermal coal to fuel the increase in coal-fired electricity generation over the course of the year (Figure 2.11). Thermal coal imports therefore grew 12% (13 Mt) to 113 Mt, whereas met coal imports remained broadly stable, rising only 1% (0.5 Mt) from 2016.
Figure 2.11 Korean imports of thermal coal (left) and met coal (right), 2007-17
Sources: Adapted from IHS Markit (2018a), Coal McCloskey Price and Statistical Data, https://connect.ihs.com/industry/coal; IEA (2018), Coal Information (database), www.iea.org/statistics.
0 20 40 60 80
100 120 140 160
2007 2009 2011 2013 2015 2017
Mt
Australia Indonesia China Russia Canada United States ROW
0
10
20
30
40
50
60
2007 2009 2011 2013 2015 2017
Mt
0
20
40
60
80
100
120
2007 2009 2011 2013 2015 2017
Mt
Australia Indonesia China Russia Canada United States ROW
0 5
10 15 20 25 30 35 40
2007 2009 2011 2013 2015 2017
Mt
© O
EC
D/IE
A, 2
018

RECENT TRENDS IN INTERNATIONAL COAL TRADE
54 COAL 2018
Indonesia overtook Australia to become Korea’s primary supplier of thermal coal: imports from Australia fell 5.3% (2 Mt) to a 31% (35 Mt) market share, while those from Indonesia expanded 12% (5 Mt), to 37 Mt or 33%. Russia supplied 20% (20 Mt) of thermal imports, an increase of 3% (1 Mt).
Even though met coal imports from Australia were 11% (2 Mt) lower than in 2016, it still supplied 42% (15 Mt) of Korea’s imported met coal. Canada was the point of origin for 21% (7 Mt) of met imports, and imports from Russia and the United States each increased 1 Mt, giving Russia a market share of 18% (6.5 Mt) and the United States 13% (4.5 Mt).
European Union
European Union (EU) member states imported 152 Mt of thermal coal and 44 Mt of met coal in 2017, together roughly the volume of Japan’s imports (Figure 2.12). With a share of 47%, Russia was the European Union’s main thermal coal supplier, followed by Colombia (24%) and the United States (15%). Compared with 2016, imports increased by a strong 14% (10 Mt) from Russia and 20% (4.5 Mt) from the United States. Imports from Colombia, however, dropped a substantial 46% (17 Mt) to 36 Mt, with Colombian cargo finding alternative buyers in Turkey, Mexico and even Asia. Imports from South Africa – the source of nearly 50% of EU thermal coal imports at the beginning of this century –continued to decline in 2017, as Asian market prices are more attractive than Europe’s.
Figure 2.12 EU imports of thermal coal (left) and met coal (right), 2007-17
Sources: Adapted from IHS Markit (2018a), Coal McCloskey Price and Statistical Data, https://connect.ihs.com/industry/coal; IEA (2018), Coal Information (database), www.iea.org/statistics.
Although met coal imports from Australia declined 10% (2 Mt), it was still the European Union’s main supplier, providing 43% (19 Mt) in 2017. Imports from the United States and Russia each increased 1 Mt, boosting the US market share to 30% (13 Mt) and Russia’s to 13% (6 Mt). Canada exported 4 Mt of met coal to the European Union, an increase of 1 Mt from 2016.
By country, Germany was still the European Union’s largest coal importer in 2017, although its thermal coal imports dropped more than 10 Mt from 2016 as capacity retirements and a partial coal-to-gas switch led to lower hard coal-fired power generation. It imported 35 Mt of thermal coal and 13 Mt of met coal. Spain imported 17 Mt of thermal coal – 5 Mt more than in 2016 as coal-fired generation scaled up. Hard coal shipments to Italy declined 1 Mt to 15 Mt in 2017, while the United Kingdom’s hard coal imports stayed roughly flat at 9 Mt.
0
50
100
150
200
250
2007 2009 2011 2013 2015 2017
Mt
Australia Indonesia Russia South Africa United States Colombia Canada ROW
0
10
20
30
40
50
60
70
2007 2009 2011 2013 2015 2017
Mt
© O
EC
D/IE
A, 2
018

RECENT TRENDS IN INTERNATIONAL COAL TRADE
COAL 2018 55
Other countries
Turkey imported 33 Mt of thermal coal in 2017, 7.8% (3 Mt) more than in 2016. Around 50% came from Colombia, 42% from Russia and 7% from South Africa. Turkish met coal imports declined slightly to 5 Mt and were sourced mainly from the United States, Canada and Australia.
Chinese Taipei imported 60 Mt of thermal coal and 7 Mt of met coal in 2017. Thermal coal imports increased 3% (2 Mt) from 2016, the main suppliers being Australia (50%), Indonesia (27%) and Russia (13%).
Fuelling increased coal-fired power generation, thermal coal shipments into Malaysia increased 13.5% (4 Mt) in 2017. With a market share of 72%, neighbouring Indonesia was the largest supplier, followed by Australia (17%). Similarly, Thailand received the bulk of its thermal coal imports from Indonesia (73%) and Australia (17%); its imports expanded 3% (1 Mt) to 23 Mt in 2017.
Prices Coal prices began to climb sharply in late 2016 as production capacity cuts in China and the reduction of annual working days to 276 reduced the coal supply at the same time as domestic demand was climbing (Figure 2.13). The working-day reduction was reversed in late 2016, easing supply constraints in China, and prices began to fall again. They did not, however, return to the low levels of early 2016, as coal demand remained elevated, particularly in Asia, and capacity cuts in China continued to restrict output growth and kept import requirements high. In most coal-exporting countries, output remained subdued because producers were reluctant after years of low prices to expand production capacity. This situation persisted throughout 2017 and into 2018.
Figure 2.13 Marker prices for different types of coal, 2016-18
Notes: FOB = free on board; PCI = pulverised coal injection.
Source: IHS Markit (2018a), Coal McCloskey Price and Statistical Data, https://connect.ihs.com/industry/coal.
Thermal coal After reaching a high point in late 2016, thermal coal prices declined somewhat as China relaxed some of the supply-side restrictions it had imposed earlier that year. From April 2017 onwards, however, prices climbed again, driven by rising demand in the Asia Pacific region. In early 2018, Asian thermal coal prices received a further boost from rising import demand in Korea, where coal-fired
0
50
100
150
200
250
300
350
Jan-16 May-16 Sep-16 Jan-17 May-17 Sep-17 Jan-18 May-18
USD/tAustralian prime hardcoking (FOB)
Australian low-volatilePCI (FOB)
Newcastle steam coal(FOB)
© O
EC
D/IE
A, 2
018

RECENT TRENDS IN INTERNATIONAL COAL TRADE
56 COAL 2018
power generation compensated for nuclear plant outages. In July 2018, the FOB price for Newcastle steam coal (6 000 kcal/kg) reached USD 120/t – a price not seen since 2011 – as strong demand coincided with tight supply (Figure 2.14).
Figure 2.14 Thermal coal price markers (6 000 kcal/kg) in the Atlantic and Pacific basins, 2017-18
Notes: CIF = cost, insurance and freight; CFR = cost and freight. South China (CFR) does not include Chinese taxes.
Source: IHS Markit (2018a), Coal McCloskey Price and Statistical Data, https://connect.ihs.com/industry/coal.
It still appears that Asia (particularly China) is the primary price-setter, but regional developments also need to be considered. Prices fell somewhat after a mild January-February in 2017, while high renewable power output reduced coal-fired generation in Europe, only to rise again as extreme cold returned to the continent in March. Although arbitrage usually ensures that prices are co-integrated, regional supply/demand shocks can lead to a (generally temporary) bifurcation in prices.
Figure 2.14 also shows that the FOB price for coal at Puerto Bolivar (Colombia) is closely correlated with the European import price, the main destination for Colombian cargoes. The price for Newcastle coal is more closely aligned with the South China (CFR) price, with China being one of the key offtakers for Australian thermal coal. From January 2018 onwards, the price spread between the Atlantic and Pacific basins widened, with Asian prices buoyed by strong demand growth and tight supply. Widening spread signals create arbitrage opportunities for producers to sell into markets that they would not normally be active on: in response to the widening price differential, shipments from Colombia to Asia, for instance, increased from 0.4 Mt in January 2018 to 1 Mt in May 2018 (IHS Markit, 2018a).
Price spreads between different thermal coal qualities delivered FOB in Richards Bay, South Africa, and Newcastle, Australia, have been widening (Figure 2.15). For South African thermal coal, it rose from USD 15/t in January 2016 to USD 20/t in July 2018. For Australian thermal coal, the gap opened even further, particularly since May 2018. In August it shot up to over USD 50/t.
The primary reason for this is that, globally, the supply of lower-quality thermal coal has been growing faster than that of higher grades, leading to a widening of spreads. In Australia, the effect was compounded by supply tightness in the Hunter Valley and rising demand from Japan and Korea, where plant operators value the quality and consistency of high-grade Australian thermal coal. Utilities from both countries purchased higher volumes of 6 000-kcal/kg thermal coal in 2017 and
20
40
60
80
100
120
Jan-17 Mar-17 May-17 Jul-17 Sep-17 Nov-17 Jan-18 Mar-18 May-18
USD/t
Northwest Europe (CIF)South China (CFR)Newcastle (FOB)Puerto Bolivar (FOB)
© O
EC
D/IE
A, 2
018

RECENT TRENDS IN INTERNATIONAL COAL TRADE
COAL 2018 57
early 2018, driving the price up more strongly than that of lower Australian or Indonesian grades. In addition, import restrictions were imposed at coal terminals in southern China, further softening demand for lower-quality Australian thermal coal (IHS Markit, 2018b).
Figure 2.15 Price markers for different thermal coal qualities in South Africa and Australia
Source: IHS Markit (2018a), Coal McCloskey Price and Statistical Data, https://connect.ihs.com/industry/coal.
The Richards Bay and Newcastle 6 000-kcal/kg and 5 500-kcal/kg price markers follow opposite trajectories during second quarter of 2018 (Figure 2.16). South Africa’s public utility Eskom, which typically consumes 4 800-kcal/kg coal, has been ramping up its spot coal purchases for blending to make up for supply shortfalls at its affiliated mines.
Figure 2.16 Relationship between the prices of South African and Australian thermal coal with calorific values of 5 500 kcal/kg (left) and 6 000 kcal/kg (right)
Source: IHS Markit (2018a), Coal McCloskey Price and Statistical Data, https://connect.ihs.com/industry/coal.
As a result, 5 500-kcal/kg thermal coal from Richards Bay traded at a premium to similar Australian coal from May 2018 onwards (IHS Markit, 2018c). With higher shares of low-calorific-value coal being traded in Asia, Newcastle 6 000 kcal/kg is losing relevance as the coal price indicator in the Pacific Basin.
0
10
20
30
40
50
30
50
70
90
110
130
Jan-16 Jul-16 Jan-17 Jul-17 Jan-18 Jul-18
USD/tUSD/t Richards Bay (FOB)
Spread (right axis) 6 000 kcal/kg 5 500 kcal/kg
0
10
20
30
40
50
30
50
70
90
110
130
Jan-16 Jul-16 Jan-17 Jul-17 Jan-18 Jul-18
USD/tUSD/t Newcastle (FOB)
30
50
70
90
110
130
Jan-17 Jul-17 Jan-18 Jul-18
USD/t 5 500 kcal/kg
Richards Bay (FOB) Newcastle (FOB)
30
50
70
90
110
130
Jan-17 Jul-17 Jan-18 Jul-18
USD/t 6 000 kcal/kg
© O
EC
D/IE
A, 2
018

RECENT TRENDS IN INTERNATIONAL COAL TRADE
58 COAL 2018
Box 2.1 The hard task of price control
Both the Medium-Term Coal Market Report 2016 (IEA, 2016) and Coal 2017 (IEA, 2017) included in-depth analyses of China’s coal pricing policy, which is part of broader supply-side reforms of the coal supply chain and is designed to ensure safety, profitability and competitiveness. Supply constraints occurred in 2016 while demand was rebounding, and prices, naturally, went up. To control the situation, in the last quarter of 2017 the Chinese government published guidelines that established a “comfort zone” of prices within the RMB 500/t to RMB 570/t range (as reported in the Bohai-Rim Steam Coal Price Index [BSPI]). In this range, the coal price exceeds supply costs, and coal-fired power generation costs remain below power tariffs. The government established that prices falling below or exceeding this range by RMB 30/t (i.e. between RMB 470 and RMB 600/t) be monitored, and that prices outside this secondary range be considered a call to action.
As indicated in Figure 2.17, BSPI prices were outside the comfort zone for almost all of 2017-18. Given that the BSPI collects both spot and term contract prices, spot prices in Qinhuangdao are more representative than BSPI of short-term developments in the market. Spot prices have much exceeded government expectations (above RMB 700/t, and even up to RMB 750/t) because 500 million tonnes per annum (Mtpa) of capacity were closed in 2016-17 (and another 150 Mtpa of closures are expected in 2018) at the same time as coal demand for power generation recovered. Production in 2017 and 2018 would have had to scale up significantly to keep pace with demand and avoid a price hike. The situation is more complex than this, however, as higher oil prices and labour costs offset the supply-cost declines resulting from closure of inefficient mines and the opening of more cost-efficient ones. In addition, mine closures have been more intense in south-eastern China, so greater amounts of coal have had to be transported there from the northwest. The amount of coal transported by rail reached 2.16 billion metric tonnes (Bt) in 2017 – 13% more than in 2016. Likewise, coal shipped from the northern ports to southern China increased 13% to 727 Mt in 2017, even though coal consumption grew less than 1%.
Figure 2.17 Evolution of coal prices in China
Source: IHS Markit (2018a), Coal McCloskey Price and Statistical Data, https://connect.ihs.com/industry/coal.
Not only have China’s environmental policies reduced coal demand, especially in the residential and industry sectors, they have affected supplies, for example through mine closures for environmental reasons and truck bans at some ports. Some price relief could come from international markets, but supplies there are also tight because investments have run out, particularly for greenfield developments. In addition, several import barriers were introduced recently. Limits on trace elements (fluorine,
300
400
500
600
700
800
Jan-2016 May-2016 Sep-2016 Jan-2017 May-2017 Sep-2017 Jan-2018 May-2018
RMB/t
Qinhuangdao FOB price Bohai Rim steam coal price index
© O
EC
D/IE
A, 2
018

RECENT TRENDS IN INTERNATIONAL COAL TRADE
COAL 2018 59
mercury, chlorine, phosphorus and arsenic) have hindered imports, as have testing delays and different results than those made in the origin; the import tax (except on Indonesian and Australian coal) is another deterrent. Although no official information is available, some ports in southern China appear to have import quotas that could restrict imports, and some small ports associated with power plants even stopped receiving coal imports for several months. Overall, quantitative restrictions on imports have not brought down domestic prices as they otherwise should. Therefore, even though BSPI prices had not moved outside the monitoring range, in February 2018 the government banned spot deals of over RMB 750/t. Three months later, when spot prices spiked again, the National Development and Reform Commission (NDRC) announced a comprehensive strategy to soften coal prices by targeting:
• Supply – increase production in some of the mining hubs and bring mining capacity into production more quickly.
• Demand – increase clean energy utilisation and constrain coal use in industrial hubs.
• Logistics – prioritise thermal coal access to rail capacity and allocate 100 Mt of inventory throughout the logistics chain.
• Trade – monitor compliance of term contracts and increase supervision of market practices.
• Corporate – promote vertical integration.
China’s situation demonstrates that controlling market prices – even within a certain range and even in a (to some degree) policy-commanded economy – requires Herculean efforts in such a complex sector as the coal industry.
Met coal Met coal includes hard coking coal, semi-soft coking coal, and PCI, all used in steelmaking via the blast furnace process. Production volumes of blast furnace iron (BFI) are therefore a major determinant of met coal demand and prices.
In mid-2016, met coal prices shot up, driven by supply-side restrictions in China at the same time as demand rose, particularly in China, which recorded a strong y-o-y increase in BFI production (Figure 2.18).
After a slump at the very beginning of the year, BFI production in China rose over the first half of 2017, keeping coking coal prices elevated. In April 2017, supply disruptions associated with the landfall of Cyclone Debbie in Queensland led to a sharp spike in met coal prices. Although y-o-y BFI production growth slowed in the second half of year, the price of Australian prime hard coking coal in particular continued to inch upwards, indicating that supply-side constraints were playing an increasingly important role in determining prices. In Australia, slow loading at the Dalrymple Coal Terminal in Queensland led to long vessel queues and tighter seaborne market supplies (IHS Markit, 2018d). Furthermore, reforms targeted at improving the quality and profitability of China’s steel industry by removing excess capacity and closing inefficient steel mills were beginning to take effect. Higher steel plant utilisation rates and wider margins, combined with stricter environmental standards, have been driving steel producers to rely more heavily on higher-quality inputs such as high-grade coking coal (BHP, 2018).
© O
EC
D/IE
A, 2
018

RECENT TRENDS IN INTERNATIONAL COAL TRADE
60 COAL 2018
Figure 2.18 Coking coal price and monthly year-on-year BFI production growth, 2015-18
Sources: Adapted from IHS Markit (2018a), Coal McCloskey Price and Statistical Data, https://connect.ihs.com/industry/coal; World Steel Association (2018), “Monthly crude steel and iron production”, www.worldsteel.org/steel-by-topic/statistics/monthly-crude-steel-and-iron-production.html.
Although its quality is inferior to that of Australian prime hard coking, the fluidity of US high-ash, high-volatile coking coal makes it a popular blending coal. Although the normal price premium for Australian prime hard coking coal had largely disappeared by June 2015 due to the closure of high-cost US mines, high demand for prime hard coking from mid-2017 caused the spread to widen again, restoring the usual relationship between both price markers.
Coal forward prices Coal futures markets continue in backwardation, a trend that began in 2015 after many years of contango (Figure 2.19). The small contango seen only during 2017 in the Argus/McCloskey’s Coal Price Index (API) 4 disappeared in 2018. Under the current high prices, backwardation is stronger. Another interesting observation is that backwardation in the API 2 is much stronger than in the API 4. Swaps for API 4 in the calendar 2022 are almost USD 10 over API 2 swaps for the same time period, and levels of almost USD 10 above API 2 in 2022 suggest that the market expects a stronger push in Asian markets than in Europe, widening the current price gap between Asia and Europe.
Figure 2.19 Forward curves of API 2 (left) and API 4 (right), 2016-18
Notes: Q1 = first quarter; Q3 = third quarter.
Source: IHS Markit (2018a), Coal McCloskey Price and Statistical Data, https://connect.ihs.com/industry/coal.
0
50
100
150
200
250
300
- 15
- 10
- 5
0
5
10
Jan-15 Jun-15 Nov-15 Apr-16 Sep-16 Feb-17 Jul-17 Dec-17 May-18
USD/tMt
ROW (left axis)
China (left axis)
Australian primehard coking (FOB)
US high-ash, high-volatile (FOB)
0
20
40
60
80
100
120
Q1-2016 Q3-2017 Q1-2019 Q3-2020 Q1-2022
USD/t API2
20-Jan-16 06-Jan-17 04-Dec-17 06-Sep-18
0
20
40
60
80
100
120
Q1-2016 Q3-2017 Q1-2019 Q3-2020 Q1-2022
USD/t API4©
OE
CD
/IEA
, 201
8

RECENT TRENDS IN INTERNATIONAL COAL TRADE
COAL 2018 61
Coal derivatives
After exponential volume growth, coal derivatives plummeted more than 50% from 2016 to 2017 (Figure 2.20) and the trend continues in 2018, although the rate will probably decline to around 40%, in contrast with growth in coal demand and seaborne trade. API 2 volumes do not faithfully represent European trends, as API 2 is used as a proxy for hedging coal outside Europe. Although drops have been similar in API 2, API 4 and other indices, the main decline has occurred in Asia: the sudden and somehow unexpected price hike in 2016, linked to changing Chinese policies, resulted in considerable losses for many traders. Some of the largest trading houses completely left the coal business or minimised their risk exposure. Although there has been a general lack of trust in the Asian trading community since 2016, paper trading volumes in Asia are expected to slowly increase in upcoming years. Given the diverse qualities and indices in the Asian markets, it will be difficult to reach the liquidity of the API 2 in any of them.
Figure 2.20 Trade volumes for coal derivatives, 2000-17
Source: IHS Markit (2018a), Coal McCloskey Price and Statistical Data, https://connect.ihs.com/industry/coal.
On the positive side for coal traders, Indonesian derivatives based on Indonesian Coal Index (ICI) 4 and launched in early 2018 have evolved well, surpassing 1 Mt in just a few months. ICI 4, created in 2008 and published by Argus and PT Coal Indo Energy, is a price benchmark for coal of low calorific value (4 200 kcal/kg gross as received [GAR], FOB Kalimantan). Although its volumes are still insignificant compared with those of API 2, it is expected to expand as the growth of Asian markets and the decline of the European one reduces the share of API 2-based derivatives.
Positive evolution of derivatives, in parallel with iron ore and scrap derivatives growth, is also good news for coking coal stakeholders, although this market comprises a volume of tens of millions of tonnes, which cannot compare with thermal coal trade volumes.
Coal supply costs Coal supply costs consist of two primary components: mining cash costs and transportation costs. Cash costs can vary significantly among mines, depending on mine type (open-cast or underground), strip ratio and other factors such as wage rates, taxes and royalties. Coal transport costs are determined by the rates for inland transportation of coal by road or rail, as well as port fees and seaborne freight rates. Compared with oil and gas extraction, variable costs have a greater effect on
0 500
1 0001 5002 0002 5003 0003 5004 0004 5005 000
2000 2001 2002 2003 2004 2005 2006 2007 2008 2009 2010 2011 2012 2013 2014 2015 2016 2017 2018
Mt
Others
API4
API2
© O
EC
D/IE
A, 2
018

RECENT TRENDS IN INTERNATIONAL COAL TRADE
62 COAL 2018
the cost structure of coal mining because it is more fuel- and labour-intensive, but less capital-intensive. Since coal is traded mostly in US dollars but some costs (e.g. for labour) are incurred in the local currency, exchange rate fluctuations also need to be considered as part of the relative supply costs of individual producers.
Development of input factor prices
In the majority of coal-exporting countries, the cash costs of mining make up the largest part of total supply costs. In most coal-producing countries, material costs account for more than two-thirds of mining cash costs.
In the past three years, prices for tyres, explosives and mining machinery have remained relatively stable (Figure 2.21). Costs of steel-mill products declined throughout 2015 because the steel market was oversupplied, but this trend reversed in 2016 and price growth has continued since, with nominal prices exceeding the January 2015 levels in the beginning of 2018.
Figure 2.21 Indexed nominal prices of selected commodities used in coal mining
Source: US Bureau of Labour Statistics (2018), Producer Price Data, www.bls.gov/data.
The price of diesel fuel – closely linked to that of oil – reached a multi-year low in January 2016, rebounding as the oil price continued to recover throughout 2017 and 2018.
In 2017, the rising price of diesel drove up the fuel cost per tonne of production in most large coal mining countries (Figure 2.22). Higher diesel prices more strongly affect the operators of open-cast mines, since they rely heavily on diesel-consuming equipment such as large trucks, bulldozers and excavators. Accordingly, the countries with mainly this type of mine (Colombia, Indonesia and Russia) registered the largest average fuel cost increases, in absolute terms and also as a share of total mining costs. Exceptions were China and the United States, where closures of less-efficient mines, combined with rising production, stabilised average fuel costs. In addition, more than 90% of China’s coal is produced from underground mines, which are not as strongly affected by rising fuel prices (CRU, 2017).
60
80
100
120
140
Jan-15 May-15 Sep-15 Jan-16 May-16 Sep-16 Jan-17 May-17 Sep-17 Jan-18 May-18
Explosives
Tyres
Steel products
Machinery andequipment
Diesel fuel
© O
EC
D/IE
A, 2
018

RECENT TRENDS IN INTERNATIONAL COAL TRADE
COAL 2018 63
Figure 2.22 Average fuel costs (left axis) and their share in total thermal coal mining costs (right axis), 2015-17
Source: Adapted from CRU (2018), Thermal Coal Cost Model (database).
Labour costs account for 15-35% of volume-averaged coal mining costs. Average labour costs per tonne of coal produced2 increased in all major coal-exporting countries in 2017 (Figure 2.23). In South Africa, lower production at some mines and stronger inflation drove up average labour costs, an effect that was compounded by appreciation of the ZAR against the USD (see below). In Australia, labour productivity remained at record-high levels. Nevertheless, supply disruptions due to bad weather and strikes, as well as rising wage inflation, raised average output-weighted labour costs. In Indonesia, average labour costs increased slightly from 2016 as new but less-productive capacity came online in response to high seaborne prices (CRU, 2017). In China, where average labour costs had fallen 30% from 2013 to 2016, they climbed again in 2017 as mines raised wages to halt the loss of skilled workers.
Figure 2.23 Average labour costs (left axis) and their share in total thermal coal mining costs (right axis), 2015-17
Source: Adapted from CRU (2018), Thermal Coal Cost Model (database).
2 The average labour cost per tonne produced is derived by dividing total annual labour costs – wages as well as all additional labour-related costs covered by the employer, such as for administration, housing, sanitary facilities, transportation and relocation – by the number of tonnes produced that year (CRU, 2017).
0%
5%
10%
15%
20%
25%
30%
0
2
4
6
8
10
12
Australia Colombia Indonesia Russia South Africa United States China
USD/t2015
2016
2017
Share of fuel costsin total miningcosts (right axis)
0%5%10%15%20%25%30%35%40%
0 2 4 6 8
10 12 14 16
Australia Colombia Indonesia Russia South Africa United States China
USD/t 2015
2016
2017
Share of labourcosts in totalmining costs (rightaxis)
© O
EC
D/IE
A, 2
018

RECENT TRENDS IN INTERNATIONAL COAL TRADE
64 COAL 2018
Currency exchange rates
Internationally, coal is traded mostly in US dollars. The costs of labour, railway fees, port charges and royalties, however, are usually settled in the local currency. A shift in the exchange rate can therefore affect an exporter’s competitiveness; at the same time, it can also alter an importer’s purchasing power and the relative competitiveness of imported coal against alternative fuels such as lignite or natural gas.
Since 2011, the USD has appreciated against the currencies of all major coal-exporting countries (Figure 2.24). The COP and RUB in particular depreciated considerably as the oil-dependent Colombian and Russian economies were buffeted by the low price of oil – and in Russia’s case, Western sanctions imposed after its annexation of Crimea in 2014. Low commodity prices in general meant that the AUD, IDR and ZAR also came under pressure. In early 2016, the oil price bottomed out and worldwide demand for commodities climbed through the remainder of the year, through 2017 and into the first half of 2018, stabilising exchange rates against the USD.
Figure 2.24 Year-on-year development of selected currencies against the USD
Notes: AUD = Australian dollar; CNY = Chinese Yuan renminbi; ZAR = South African rand; RUB = Russian ruble; IDR = Indonesian rupiah; COP = Colombian peso. The chart displays the y-o-y development of the monthly average exchange rate of selected currencies, expressed in percent change compared with the previous year. For example, in May 2015, the RUB had depreciated 45% against the USD compared with May 2014.
Source: OECD (2018), Monthly Monetary and Financial Statistics (MEI), https://stats.oecd.org.
By comparing the price of steam coal delivered FOB in Puerto Bolivar (Colombia) and Richards Bay (South Africa) in USD per tonne with the local currency equivalents, Figure 2.25 illustrates the effect of local currency depreciation.
Depreciation of the COP and ZAR over the course of 2015 and early 2016 led to stabilisation of the price per tonne in these currencies, while in USD it declined, improving the competitiveness of producers in Colombia and South Africa (IEA, 2017). Conversely, for coal sold at Richard’s Bay in late 2017/early 2018, appreciation of the ZAR led to a price decline in the local currency.
-50%
-40%
-30%
-20%
-10%
0%
10%
20%
May-12 May-13 May-14 May-15 May-16 May-17 May-18
AUD
CNY
COP
IDR
RUB
ZAR
© O
EC
D/IE
A, 2
018

RECENT TRENDS IN INTERNATIONAL COAL TRADE
COAL 2018 65
Figure 2.25 FOB steam coal prices in USD and local currencies
Source: IHS Markit (2018a), Coal McCloskey Price and Statistical Data, https://connect.ihs.com/industry/coal.
Dry bulk shipping market Dry bulk shipping is an important link in the global coal supply chain, as roughly 90% of coal traded internationally is delivered by ship. In 2017, coal accounted for approximately 32% of entire seaborne dry bulk trade by mass, ahead of grain (14%) and behind iron ore (42%).
The capacity of a dry bulk carrier is expressed in deadweight tonnage (dwt), which indicates the mass that a ship can carry safely. It excludes the ship’s structural weight, but includes fuel, water, crew and cargo.3
Keeping pace with a commensurate slowdown in the growth of international dry bulk shipping, annual expansions of total dry bulk carrier capacity have decreased from the high levels of 2008-12. Growth has not exceeded 3% per year since 2015 (Figure 2.26).
Figure 2.26 Bulk carrier fleet, 2011-18
Source: UNCTAD (2018), UNCTAD Statistical Database, http://unctadstat.unctad.org.
3 A description of the various classes of dry bulk carriers can be found in IEA (2017), Coal 2017: Analysis and Forecasts to 2022.
0
50
100
150
200
250
300
0
20
40
60
80
100
120
Jan-15 Jan-16 Jan-17 Jan-18
thsd COP/tUSD/t Puerto Bolivar
USD Local (right axis)
200 400 600 8001 0001 2001 4001 600
0
20
40
60
80
100
120
Jan-15 Jan-16 Jan-17 Jan-18
ZAR/tUSD/t Richards Bay
0%2%4%6%8%10%12%14%16%
0 100 200 300 400 500 600 700 800 900
2011 2012 2013 2014 2015 2016 2017 2018
Million dtw
Bulk carriercapacity
Annualgrowth(right axis)
© O
EC
D/IE
A, 2
018

RECENT TRENDS IN INTERNATIONAL COAL TRADE
66 COAL 2018
Coal freight rates are determined largely by the demand for and supply of dry bulk carrier capacity and the price of marine fuel oil, which is closely linked to the oil price. If the market is tight or fuel expensive, rates increase, and vice versa in periods of low demand and low fuel prices.
Chinese demand is central to the dry bulk shipping market, as China received 71% of all international iron ore shipments, 45% of all steel shipments and 18% of all coal shipments in 2016 (UNCTAD, 2017).
These dynamics are reflected in seaborne coal delivery rates, as illustrated by the Queensland-Rotterdam and Richards Bay-Rotterdam routes (Figure 2.27). Spot freight rates fluctuate substantially in the short term, chiefly the result of variations in demand for dry bulk shipments (primarily coal and iron ore) and in marine fuel oil prices.
After hitting a low in early 2016, freight rates recovered with rising marine fuel prices, higher Chinese coal imports and an uptick in grain and iron ore shipments. After weakening in the first half of 2017, freight rates began climbing again in July, and after another high in December 2017, they plummeted at the beginning of 2018 to recover in May 2018. All these freight price movements were driven largely by fluctuations in the marine fuel oil price and Chinese coal and iron ore imports.
Figure 2.27 Selected freight rates and fuel oil price, 2015-18
Note: bbl = barrel.
Sources: IHS Markit (2018a), Coal McCloskey Price and Statistical Data, https://connect.ihs.com/industry/coal; Argus Media Ltd (2018), Singapore High-Sulphur Fuel Oil 380 CST, Spot Price.
Box 2.2 The strategic value of the Rhine river
In 2017, half of Germany’s hard coal was imported through the Amsterdam-Rotterdam-Antwerp (ARA) ports and distributed via the Rhine river and its connecting rivers (the Main and the Neckar) and canals. While one-third of that hard coal was coking coal, mainly for blast furnaces in the Ruhr district, two-thirds was thermal coal for coal-fired power stations. Around 10 gigawatts (GW) of hard coal-fired generation capacity – more than the half of the German hard coal fleet – is located on – and hence supplied via – the Rhine river and its tributaries (Map 2.3).
Rhine river navigability, which is highly weather-dependent, is therefore essential to the operation of Germany’s hard coal-fired power plants. In January 2018, high precipitation and melting snow caused the water level of the Rhine in the region of Cologne to rise by more than 9 metres (m), suspending all shipping. One year before, in January 2017, the opposite happened as low precipitation resulted in
01020304050607080
02468
1012141618
Jan-15 May-15 Sep-15 Jan-16 May-16 Sep-16 Jan-17 May-17 Sep-17 Jan-18 May-18
USD/bblUSD/t
Queensland-Rotterdam (150 000 t) Richards Bay-Rotterdam (150 000 t) Singapore H SFO 380cst (right axis)
© O
EC
D/IE
A, 2
018

RECENT TRENDS IN INTERNATIONAL COAL TRADE
COAL 2018 67
water levels of less than 1.5 m in the Cologne region and persistent frost caused ice sheets to form on the surface. Similarly, in July 2018 high temperatures and low precipitation caused the water level to drop to below 1.3 m around Cologne; these occurrences highlight the vulnerability of Europe’s most important inland waterway.
Map 2.3 Coal-fired power plants on the Rhine river
This vulnerability is reflected in shipping costs. When water levels are low, barges must reduce their loads and are often not able to utilise more than half their capacity. As a result, buyers pay low water surcharges on freight rates, which may raise the price more than 100% depending on the water level. The low water in January 2017, for instance, resulted in freight rates of EUR 30/t from the ARA ports to Kassel in Karlsruhe, southern Germany, when under usual weather conditions in this season are normally around EUR 5/t.
In Germany’s electricity market, older, lower-efficiency hard coal-fired power plants are in direct competition with modern combined-cycle gas-fired plants (see IEA [2017], Box 3.1). When the price spread between hard coal and natural gas is wide, reinforced by a high carbon price, fuel switching from coal- to gas-fired generation happens. Hence, non-navigability of the Rhine and the resultant hikes in shipping costs that raise overall coal supply costs may drive fuel switching in Germany’s power market.
© O
EC
D/IE
A, 2
018

RECENT TRENDS IN INTERNATIONAL COAL TRADE
68 COAL 2018
Development of coal supply-cost curves
After declining for two consecutive years, export coal supply costs increased again in 2017 as a result of rising fuel and labour costs in most of the large coal-exporting countries.
Figure 2.28 illustrates Chinese FOB supply costs for 5 500-kcal/kg-equivalent thermal coal delivered to ports around the Bohai Economic Rim. Flattening of the cost curve demonstrates that supply-side reforms in China, particularly the closure of smaller, less-efficient mines, substantially cut the cost of coal supplied to the Bohai Rim from 2015 to 2017. The elimination of transportation bottlenecks through upgraded rail infrastructure also helped, as rail shipments of coal within China increased 13% to 2 160 Mt in 2017. At the same time, the price shot up from less than USD 50/t in December 2015 to USD 87/t in December 2017. Both developments led to significantly higher producer margins, substantially raising the industry’s profitability.
Figure 2.28 FOB supply costs and average December price for 5 500-kcal/kg-equivalent thermal coal at ports around the Bohai Economic Rim
Notes: The year 2016 is not shown because it was a transition year (see IEA, 2017). Costs converted to 5 500 kcal/kg-equivalent.
Sources: Adapted from CRU (2018), Thermal Coal Cost Model; IHS Markit (2018a), Coal McCloskey Price and Statistical Data, https://connect.ihs.com/industry/coal.
The seaborne supply curves (FOB) for hard coking coal (Figure 2.29) and for semi-soft coking coal (SSCC) and PCI coal (Figure 2.30) consist of variable production costs, overburden removal, royalties, inland transportation and port usage fees; annual average marker prices are also plotted. The seaborne hard coking coal supply expanded by around 10 Mt in 2017, although it is still lower than in 2015. Rising input factor prices – especially for fuel and labour – raised supply costs, causing nearly the entire supply curve to shift upwards from the year before. It is nevertheless evident that high average prices made production of met coal – especially hard coking coal – profitable in 2017.
The supply curves show that Russian producers are among the lowest-cost producers for both hard coking and semi-soft/PCI coals, whereas US producers – owing to the relatively high cost of taking their coal to port – are clustered mainly in the upper half of the supply curve. As a result, US exports are relatively price-sensitive. In 2017, large amounts of US met coal were sent to the seaborne market in response to high prices and supply shortfalls in Australia.
0
20
40
60
80
100
0 100 200 300 400 500 600 700
USD/t
Mt
2015
2017
Bohai Rim December 2017
Bohai Rim December 2015
© O
EC
D/IE
A, 2
018

RECENT TRENDS IN INTERNATIONAL COAL TRADE
COAL 2018 69
Figure 2.29 Indicative hard coking coal FOB supply curve and annual average FOB marker price
Note: The annual average FOB marker price is based on the monthly average index for Australian prime hard coking coal.
Sources: Adapted from CRU (2018), Thermal Coal Cost Model, accessed August 2018; IHS Markit (2018a), Coal McCloskey Price and Statistical Data, https://connect.ihs.com/industry/coal.
Figure 2.30 Indicative SSCC and PCI FOB supply curve and annual average FOB marker price
Note: The annual average FOB marker price is based on the monthly average index for Australian ultra-low volatile PCI.
Sources: Adapted from CRU (2018), Thermal Coal Cost Model; IHS Markit (2018a), Coal McCloskey Price and Statistical Data, https://connect.ihs.com/industry/coal.
References Argus Media Ltd (2018), “Singapore High-Sulphur Fuel Oil 380 CST, Spot Price.
BHP (2018), “Iron ore, metallurgical coal and China's steel reforms”, 8 May, BHP, Melbourne, www.bhp.com/media-and-insights/prospects/2018/05/iron-ore-met-coal-and-chinas-steel-reforms (accessed 5 September 2018).
CRU (2018), Thermal Coal Cost Model (database), CRU Group, London, www.crugroup.com.
CRU (2017), Thermal Coal Cost Reports and Profiles, CRU Group, London, www.crugroup.com.
0
50
100
150
200
0 50 100 150 200 250
USD/t
Mt
Australia
Russia
United States
Mozambique
Other
FOB costs2016FOB costs2015
Australian prime hard coking 2017 (FOB)
Australian prime hard coking 2016 (FOB)
0
25
50
75
100
125
150
0 5 10 15 20 25 30 35 40 45
USD/t
Mt
Australia
Russia
United States
Indonesia
Other
FOB costs2016FOB costs2015
Australian ULV PCI (FOB) 2017
Australian ULV PCI (FOB) 2016
© O
EC
D/IE
A, 2
018

RECENT TRENDS IN INTERNATIONAL COAL TRADE
70 COAL 2018
IEA (International Energy Agency) (2018), Coal Information (database), www.iea.org/statistics.
IEA (2017), Coal 2017: Analysis and Forecasts to 2022, OECD/IEA, Paris.
IEA (2016), Medium-Term Coal Market Report 2016: Market Analysis and Forecasts to 2021, OECD/IEA, Paris.
IHS Markit (2018a), Coal McCloskey Price and Statistical Data, https://connect.ihs.com/industry/coal.
IHS Markit (2018b), China Coal Monthly, Vol. 168, 25 January 2018, https://connect.ihs.com/industry/coal.
IHS Markit (2018c), South African Coal Report, Vol. 600, 2 May 2018, https://connect.ihs.com/industry/coal.
IHS Markit (2018d), Australian Coal Report, Vol. 731, 10 January 2018, https://connect.ihs.com/industry/coal.
OECD (Organisation for Economic Co-operation and Development) (2018), Monthly Monetary and Financial Statistics (MEI), https://stats.oecd.org.
UNCTAD (United Nations Conference on Trade and Development) (2018), UNCTAD Statistical Database, http://unctadstat.unctad.org.
UNCTAD (2017), Review of Maritime Transport 2017, UNCTAD, New York and Geneva, https://unctad.org/en/PublicationsLibrary/rmt2017_en.pdf.
US Bureau of Labour Statistics (2018), Producer Price Data, www.bls.gov/data.
World Steel Association (2018), “Monthly crude steel and iron production”, www.worldsteel.org/steel-by-topic/statistics/monthly-crude-steel-and-iron-production.html.
© O
EC
D/IE
A, 2
018

MEDIUM-TERM DEMAND AND SUPPLY FORECAST
COAL 2018 71
3. MEDIUM-TERM DEMAND AND SUPPLY FORECAST
Highlights • Global coal consumption is projected to remain stable over the forecast period, rising
from 5 355 million tonnes of coal equivalent (Mtce) in 2017 to 5 418 Mtce in 2023 – a compound average annual growth rate (CAAGR) of 0.2%.
• A slight increase in coal-fired power generation offsets a shallow decline in non-power coal consumption. Thermal coal demand is expected to rise by 77 Mtce (0.3% per year) over the forecast period, to 4 127 Mtce in 2023. With efficiency improvements and more scrap steel used in steelmaking, metallurgical (met) coal demand declines marginally to 1 015 Mtce in 2023.
• Coal consumption in the People’s Republic of China (“China”) is projected to decrease 0.5% per year to 2 673 Mtce in 2023. Thermal coal demand falls 0.3% per year on average, as the strong decline in coal combustion by industries and residential users (resulting from policies to curb air pollution) outpaces growth in coal conversion and coal-fired power generation. Sluggish steel production, efficiency improvements and higher reliance on electric arc furnaces in the steel industry also cause met coal demand to fall.
• India demonstrates the largest absolute increase in coal consumption over the forecast period, with demand rising by 146 Mtce to 708 Mtce in 2023. Coal-fired power generation continues to expand, underpinning a 3.6% rise in thermal coal consumption per year. Boosted by rising crude steel output, met coal consumption also grows at a strong CAAGR of 6.2%. Coal consumption in Southeast Asia rises 5.7% per year to 259 Mtce, but it continues to fall in the United States (-2.2% per year) and the European Union (-2.5% per year) as coal-fired power generation contracts.
• Total coal production in China is projected to remain broadly stable over the outlook period. While thermal coal production increases slightly, met coal output continues to fall as met coal mines are disproportionally affected by capacity closures. Supply costs are expected to increase again as production shifts further inland.
• Coal production in India grows 4% per year, reaching 499 Mtce in 2023 as state-owned producer Coal India Limited (CIL) brings several new mines online. Production from other producers also expands.
• US coal production falls, with exports stable and domestic demand in decline. In both the Russian Federation (“Russia”) and Australia, production is projected to increase to meet export demand.
© O
EC
D/IE
A, 2
018

MEDIUM-TERM DEMAND AND SUPPLY FORECAST
72 COAL 2018
Methodology This section presents the global coal demand and supply forecast, with thermal coal, lignite and met coal projections each presented separately. Analysis is market-oriented because products are priced and traded differently, and they are used in separate final markets for a variety of purposes. Forecasts are provided for several large countries and regions, although the country groupings in this report have changed from previous versions (see Box 1.1).
Coal use is driven by many factors, such as its price relative to that of its substitutes (particularly for electricity generation and industry consumption, but also for heat production – especially in developing economies), economic and population growth, and electrification rates. Because these drivers vary from one country to the next, Coal 2018 employs country-specific econometric estimations, such as the elasticity of non-power thermal coal demand in relation to a country’s gross domestic product (GDP) or population growth. Demand projections for the respective countries and coal types are based on assumptions of various relevant parameters (e.g. GDP and population growth forecasts provided by the International Monetary Fund [IMF], fuel prices and efficiency of coal-fired power plants). The International Energy Agency’s (IEA) broad expertise on energy markets informs consistent demand estimates that account for developments in other energy markets such as natural gas, renewable energies and crude oil. Coal 2018 forecasts cover country-level demand for more than 60 countries and particularly emphasise coal demand in the power sector.
Over 60% of coal use is for power generation, making it the sector with the highest potential to trigger consumption growth. However, it is also the sector in which a great number of alternatives to coal exist (e.g. hydro, wind, solar, gas, oil, biomass and nuclear). This makes the electricity sector the most complex and the most sensitive regarding coal demand. While many alternative energy sources have low marginal costs and are thus dispatched ahead of coal, gas-fired power generators compete directly with (hard) coal. Power sector coal demand is therefore strongly dictated by power demand fluctuations, the share of low-marginal-cost generation, and coal-gas price spreads. Climate policies (i.e. carbon prices), air pollution regulations and phase-out policies now need to be considered in an increasing number of jurisdictions. Whereas in the past, power demand generally followed GDP evolution; in developing economies, this relationship still holds, but in most developed ones it is no longer the case, with electricity use stagnating or even sometimes declining with GDP growth.
Steel production, or more precisely pig iron, which uses most of the coke-oven coke, is the main driver of met coal demand. GDP growth therefore strongly influences met coal demand, as do the structure and maturity of the economy as well as other factors such as plans for new blast furnaces and trends in steelmaking (basic oxygen versus electric arc furnace) and plans about direct iron reduction.
Supply forecasts, which are also prepared country-by-country, are based on demand forecasts plus or minus exports and imports (see chapter 4 for details on the trade model used). Companies’ and countries’ investment plans, as well as future costs (based on the CRU supply model) are also essential inputs for supply forecasts.
Assumptions Coal 2018 demand projections rely heavily on the GDP forecasts of the April 2018 IMF World Economic Outlook (IMF, 2018). According to the IMF, the global economy is set to grow an average 3.8% per year over 2017-23. For advanced economies,1 the IMF projects sustained growth of 1.9% 1 As defined by the IMF.
© O
EC
D/IE
A, 2
018

MEDIUM-TERM DEMAND AND SUPPLY FORECAST
COAL 2018 73
through 2023. GDP grows in the United States and the European Union 2% per year, 0.8% per year in Japan and 2.8% per year in Korea. For emerging markets and developing economies, the IMF projects a 5% per year average increase. With a 6% per year rise in GDP, China’s share in global growth over the period is expected to be significant, although less than in the last decade. For India’s GDP, the IMF predicts a CAAGR of 7.7% through 2023.
Underlying prices assumed for crude oil, natural gas and coal are aligned with other IEA market reports (IEA, 2018a; 2018b), and calculations were based on updated forward curves with some adjustments.
Natural gas price assumptions are based on the gas forward curves of September 2018. For Europe, this report assumed Title Transfer Facility (TTF) prices of USD 9.5 per million British thermal units (/MBtu) in September 2018. For 2019-20, average traded prices are slightly lower at USD 8.7/MBtu, and they are assumed to fall a further USD 2/MBtu by 2023 as new export capacities (for both liquefied and piped gas) loosen the global gas market. Henry Hub (HH) natural gas spot prices in the United States averaged USD 2.97/MBtu in September 2018, and they are projected to remain at this level until 2023. Oil-linked liquefied natural gas (LNG) prices are assumed to be around USD 8/MBtu, and LNG spot prices are projected to stay low; US LNG exports are expected to support further convergence of regional price benchmarks, although they will differ at least in transport and transaction costs. Furthermore, extrapolated from September 2018 futures, a European Union (EU) emissions trading system (ETS) allowance price of EUR 21 per tonne of carbon dioxide (/tCO2) is assumed to persist over the period.
Assumptions for oil prices are aligned with those of the IEA Oil 2018 market report published in March 2018, with the underlying futures strips updated in October 2018. They were at USD 82/barrel (Brent) at that time and are projected to decline to USD 65 per barrel by 2023.
Coal price assumptions are also based on forward prices, with some adjustment. The price of coal imported into Europe is expected to decline over the outlook period, from USD 91/t in 2018 to USD 82/t in 2023, with similar trends for other prices internationally. All values are expressed in real terms.
Another crucial driver of coal consumption and production is government policy. The assumptions of this report are based on policies already in force or very likely to be in force during the forecast period (2017-23). Changes to government regulations, international trade policies and enforcement of sanctions that have repercussions on countries’ energy sectors and supply mixes (and beyond) will be reflected in future IEA reports.
Global coal demand forecast, 2018-23 After declining from 2014 to 2016, global coal demand is expected to increase slightly over the forecast period, from 5 355 Mtce in 2017 to 5 418 Mtce in 2023 (at a CAAGR of 0.2%). While thermal coal demand is slated to rise from 4 050 Mtce to 4 127 Mtce, world met coal consumption – 1 027 Mtce in 2017 – is projected to increase through 2019 and then decline to 1 015 Mtce by 2023. Lignite demand also declines marginally, from 279 Mtce in 2017 to 276 Mtce in 2023. Geographical divergence in coal demand development is expected to continue, with consumption in Europe and North America in sustained decline over the forecast period while demand in the Asia Pacific region continues to climb. China, which accounts for half of global coal demand, remains the key market force: although a slight decline through the period is forecast, any upward/downward movement would translate into global growth/decline and would affect prices. Following up on the 2015 Paris Agreement, the United Kingdom and Canada launched the Powering Past Coal Alliance, which has
© O
EC
D/IE
A, 2
018

MEDIUM-TERM DEMAND AND SUPPLY FORECAST
74 COAL 2018
been joined by more than 20 countries as well as numerous states, municipalities and businesses. Of special relevance is South Chungcheong province in Korea, which announced it was joining in October 2018 and is the largest coal consumer in the Alliance, larger than any of the country members. Although the members of the Alliance have committed to end unabated coal-fired power generation by 2030 – a strong message that could certainly hasten coal demand decline in some jurisdictions – the impact on this forecast is not substantial. First, 2030 is far beyond this report’s time frame, and second, coal use for power generation by all members of the Alliance combined amounts to only just over 2% of global coal demand.
Asia Pacific
At a CAAGR of 0.6%, coal demand in the Asia Pacific region is projected to increase from 3 960 Mtce in 2017 to 4 107 Mtce in 2023. Coal demand growth in India, Southeast Asia and a handful of other countries is expected to be strong enough to offset declining demand in China and Japan.
China
In the near term, China’s coal demand is projected to rebound from its 2016 low (but without reaching the all-time peak of 2 928 Mtce recorded in 2013) and then decline to 2 673 Mtce in 2023 as a result of different trends in China’s four major coal-consuming sectors. While coal-fired power generation increases, coal use by the steel industry is expected to slowly fall. Coal consumption in the residential, commercial and small-scale industry sectors also drops further as the country pursues its “blue sky” policy, with a slower decline in heavy industry (e.g. cement production) because substitution is more difficult. Finally, coal conversion (coal-to-gas, coal-to-liquids, coal-to-chemicals) is projected to expand over the forecast period.
Power generation remains a major driver of Chinese and global coal demand (Box 3.1). Macroeconomics and deployment of other generation sources are expected to shape coal-fired power generation, and hence coal demand in the power sector. Chinese electricity demand continues to grow at a CAAGR of 3.5% over the projection period, decelerating from the 6.3% registered in 2017 owing to a shift in the country’s economic structure and efficiency measures. Total power generation is forecast to rise to 8 200 terawatt hours (TWh) in 2023 from 6 650 TWh in 2017, with most of the additional electricity coming from non-hydro renewables, i.e. wind and solar, and hydro growth slowing in comparison with the last five years. The renewables share, including hydro, widens to more than 30% of the power mix, and coal falls to below 60%, its lowest share ever. The continuation of commissioning of modern, highly efficient coal-fired power plants and closure of older ones raises the fleet’s average efficiency. Consequently, even though coal-fired power generation increases 1% per year on average, power sector coal consumption grows only 0.5% per year.
Box 3.1 The importance of Chinese power generation in global coal demand
In Coal 2018, which focuses more strongly on power generation than in previous years (see Box 1.1), China’s power sector warrants special attention, as it dwarfs all other countries at 45% of global coal-fired power generation. However, China’s share of coal use in power generation is lower than the world average. For example, in Organisation for Economic Co-operation and Development (OECD) countries, power generation represents 80% of coal use, whereas in China it accounts for 54% of the country’s consumption because coal is used more widely in the economy for other applications. Nevertheless, China’s power sector remains the largest coal-consuming sector on the planet by far, as more than one of every 4 tonnes of coal used in the world is burned in China to produce electricity.
© O
EC
D/IE
A, 2
018

MEDIUM-TERM DEMAND AND SUPPLY FORECAST
COAL 2018 75
China’s electricity demand structure is quite particular – very far from the “three-thirds” rule of thumb of many countries, whereby one-third of electricity is used for industry, one-third for services and one-third for residential purposes. In China, industry uses 70% (mostly for heavy industry), 16% goes to services, the residential sector uses 14% and agriculture claims 1% (Figure 3.1).
Figure 3.1 Chinese power demand compared with other economies
This structure is essential to understanding both recent and future trends. China’s economic growth since the beginning of the century has been based on rapid industrialisation and urbanisation, which quadrupled the Chinese economy. Investment in heavy, energy-intensive industry (Figure 3.2), infrastructure and export-oriented manufacturing has therefore caused electricity demand to surge.
Figure 3.2 China’s share in global output of selected energy-intensive products
China is on the verge of economic changes that would shift it away from this pattern to a growth model oriented towards services and innovation-driven manufacturing while maintaining expansion of the middle class. Furthermore, electrification continues for electric heating and electromobility, in which China leads globally. Despite these changes, power demand growth is expected to subside; in fact, there are indications that this process may already be under way, as GDP growth of 6.9% in 2015 led to only 3% higher electricity demand.
One year does not indicate a trend, however, and growth of Chinese electricity demand in 2016, 2017 and 2018 has been closer to GDP growth (Figure 3.3). Demand for coal-fired generation has therefore continued to increase even as coal demand for industrial and residential uses has declined and low-carbon generation has expanded relatively quickly.
0% 10% 20% 30% 40% 50% 60% 70% 80%
Primary
Industry
Services
Residential India
US
China
0%
10%
20%
30%
40%
50%
60%
70%
2000 2016
Cement
Steel
Aluminium
Silica©
OE
CD
/IEA
, 201
8

MEDIUM-TERM DEMAND AND SUPPLY FORECAST
76 COAL 2018
Figure 3.3 Relationship between GDP and power generation in China, 2001-17
Sources: IMF (2018), World Economic Outlook; IEA (2018c), Electricity Information (database), www.iea.org/statistics.
On the supply side, coal-fired power generation dominates at around 70% and hydro is the second source (20%). Developments in nuclear, wind and solar energy are impressive, but given the scale of power consumption in China, their contribution is still modest, so at power demand growth in the neighbourhood of 5%, significant additional coal-generated power is needed (Figure 3.4). It must also be kept in mind that wind, solar, nuclear and hydro (gas is of little importance in terms of both share and growth here) are almost always must-run capacity, meaning that coal-fired capacity absorbs most of the incremental or decremental electricity use. Therefore, as the coal share of generation is around 70%, power demand growth or decline of 2 percentage points translates into approximately 3 percentage points of coal-based generation growth or decline. Furthermore, given the scale of hydro-based generation, the natural cycles of dry and wet years also prompt higher or lower coal-fired generation because it offsets the differences.
Given the high share of global coal demand claimed for Chinese power generation, coal’s position as the largest (and marginal) power supplier, and hydropower’s importance (and variability) in China’s power mix, global coal demand is strongly determined by what happens in China’s power sector.
Figure 3.4 Global coal demand growth in relation to hydropower production and power demand in China
01000200030004000500060007000
01 0002 0003 0004 0005 0006 0007 0008 0009 000
10 00011 000
TWh2010 USD billion
GDP (Constant 2010 USD billion)Power generation (TWh) (right axis)
-5%
0%
5%
10%
15%
20%
GDP growth Total generation growthCoal generation growth
-2.0%
-1.0%
0.0%
1.0%
2.0%
3.0%
4.0%
0% 1% 2% 3% 4% 5% 6% 7% 8% 9% 10%
Glob
al co
al de
mand
incre
ase
Hydro output or power demand growth
China hydro outputgrowth
China power demandgrowth
© O
EC
D/IE
A, 2
018

MEDIUM-TERM DEMAND AND SUPPLY FORECAST
COAL 2018 77
Overcapacity in coal-fired power generation has been an issue for several years, especially since approval of new plants was transferred to the provinces in October 2014 (see IEA [2016], Box 3.2). The 13th Five-Year Plan (FYP) established a target of 1 100 gigawatts (GW) for coal-based power generation capacity, which it appears will be surpassed considering the number of provincial capacity approvals. The National Development and Reform Commission (NDRC) and the National Energy Administration (NEA) have tried to curtail growth by ordering slowdowns and project cancellations since 2016. However, given that current coal capacity is almost 1 000 GW and more than 200 GW are under construction, it seems keeping it at 1 100 GW will be difficult, even after closure of 20 GW of old, inefficient plants. In principle, coal generation overcapacity does not directly impact coal demand for power, as electricity demand and non-coal generation are the main drivers, but some spillover from overcapacity cannot be ruled out. Coal plant load factors, even after improvements in 2017 and 2018, are still low at just 50%; in addition, many coal plants are operating at a loss due to the hike in thermal coal prices and the almost inflexible regulated electricity tariff. For the economic situation of coal plants to improve, power demand would have to grow faster, expansion of alternative power sources would have to slow down, or coal dispatch would have to increase at the expense of other sources.
In contrast with the power sector forecast, China’s non-power thermal coal demand falls strongly and continuously as a result of air quality policies and the shift to a more service-oriented economy. Air quality is China’s main policy priority, and the country intends to virtually eliminate direct coal use for residential heating, especially in urban areas (see Box 3.2). A major switch to small gas-fired boilers is also envisioned for both residential and commercial use, as well as for industries in which energy input is not a large share of the cost. In energy-intensive industries, coal substitution will be limited, although seasonal and regional restrictions will also have some effect on coal demand. As a result, a coal consumption decline of over 100 Mtce is forecast for China’s residential, commercial and non-energy-intensive sectors over the period. The actual figure will depend on the availability and affordability of natural gas, which is one of the pillars of China’s air quality strategy. The decline is strong enough to offset an anticipated increase in coal consumption in the coal conversion sector.
Furthermore, China’s economy is expected to continue slowly shifting away from an investment-driven, capital-intensive model of growth in the past to one based more on increased consumer spending (IMF, 2018). The output of cement and other energy-intensive products will decline as a result, as will coal demand in those industries. There are indications that the construction cycle has already reached its peak and activity is decelerating, as the amount of floor space under construction – a good proxy for the level of construction activity – decreased between 2014 and 2016 (Figure 3.5). Some indicators, such as the amount of new residential floor space under construction, seem to have rebounded in 2018, however, so conclusions must be drawn with caution.
Despite the recent rebound in steel production, which may last a little longer, subdued steel production is forecast for the period overall. There is upward potential, however, as steel intensity (steel consumption per capita) and steel stock per capita are still lower than in Japan or Korea. On top of this, we will monitor the evolution of US steel tariffs, and the implications for Chinese steel exports, to adapt our forecast in the future. A slight increase in steel recycling with higher electric arc furnace production (versus the basic oxygen method) and efficiency improvements reduce met coal demand, which is therefore projected to increase in 2018-19 and then decline by just under 2% per year to 605 Mtce in 2023.
© O
EC
D/IE
A, 2
018

MEDIUM-TERM DEMAND AND SUPPLY FORECAST
78 COAL 2018
Figure 3.5 Total floor space under construction in China, 2010-16
Source: National Bureau of Statistics (2018), National Data, http://data.stats.gov.cn/english/.
Box 3.2 Cleaning up China’s heating system
Reducing the considerable air pollution resulting from China’s staggering economic growth and development since 2000 has become a policy and public priority. In 2012, the government published new Environment Air Quality Standards, followed by Air Pollution Emission Standards for Coal-Fired Power Plants. The resultant pollutant emissions reductions in coal-fired power generation have been outstanding (see Box 1.2).
In contrast, the industry and heating sectors continue to contribute strongly to air pollution. Heating facilities in particular are being targeted by the government’s air quality policies, as they are generally widely dispersed and small, so installing and operating scrubbers is difficult and costly; in addition, they often directly burn low-quality, low-efficiency, high-polluting coal. Unlike the large utilities dominating the power sector that have easy access to capital to finance investments, heating usually involves small communities and even families or individuals. Cleaning up the heating system is therefore a much greater challenge than refurbishing the power sector or even industry, especially in the colder northern region of the country where coal was free for decades and even today is more economical than other fuels. In September 2017, the government (i.e. the Ministry of Housing and Urban Rural Development, the NDRC, the Ministry of Finance and the NEA) asked 28 cities across 13 provinces to switch from coal-based heating to gas or electricity. The switch reduced coal-burning significantly in those areas, but gas shortages left thousands of households, hospitals and schools without heating in Hebei, where more than 2.6 million households had converted from coal to gas or electricity, shutting down more than 30 000 coal-fired boilers. In some cities the ban on burning coal for heating was suspended in December, and some industries had to stop production due to lack of gas.
While these problems have not halted conversions, they have led to some revisions of the plan. On 27 June 2018, the State Council released the Three-Year Action Plan for Cleaner Air, focusing on Beijing, Tianjin, Shanghai and key cities in Hebei, Henan, Shaanxi, Shanxi, Shandong, Jiangsu, Zhejiang and Anhui provinces. The goal of the Action Plan is to continue fighting air pollution without compromising access to heating by converting 70% of northern China to clean heating (i.e. switching from bulk coal to cleaner sources) by 2021. The plan recognises that gas availability and affordability, as well as infrastructure development, are prerequisites to switching from coal to natural gas. The plan targets 50% clean-heating coverage in northern China by 2019 and 70% by 2021, and for Beijing, Tianjin and 26 cities in Hebei, Shanxi, Shandong and Henan, the targets are 90% by 2019 and 100% by 2021.
0
2 000
4 000
6 000
8 000
10 000
12 000
14 000
16 000
2010 2011 2012 2013 2014 2015 2016
Million square metres
© O
EC
D/IE
A, 2
018

MEDIUM-TERM DEMAND AND SUPPLY FORECAST
COAL 2018 79
The primary objective of the plan is to replace bulk coal-burning with clean heating (Figure 3.6). A major component is large, central coal facilities (i.e. district heating), which are easier to retrofit with emissions-reducing technologies than are small dispersed boilers. The plan estimates that direct coal-burning will be reduced by more than 150 Mt. Given that central heating systems are much more efficient than dispersed systems and that almost half of coal will be replaced by alternatives, coal consumption decline is estimated at 100 Mt.
Figure 3.6 Distribution of technologies in the new clean-heating area of northern China
Source: NDRC (2017), “Circular on the publication of the clean winter heating plan for Northern China (2017-2021)”, https://chinaenergyportal.org/en/clean-winter-heating-plan-for-northern-china-2017-2021/.
As long as it is available and affordable, natural gas will be the preferred substitute for coal. The General Plan on Securing Gas Supply for Clean Heating in Major Areas in Northern China, the strategy to ensure that gas supply is available in Beijing, Tianjin and another 26 cities, establishes clear division of responsibility between the NEA for national-level co-ordination and local authorities to implement the reforms. As the success of the strategy depends on the gas supply at large, for which investments to build more gas pipelines, regasification plants and storage capacity are required, the State Council issued an order in September 2018 setting targets for minimum gas storage capacity by 2020 and providing guidelines for local administrations and gas companies to increase gas production, diversify imports and reinforce network interconnections.
China also has the largest coal conversion sector in the world, including coal-to-liquids, coal-to-chemicals and coal-to-gas. The forecast shows 80 Mtce of growth through 2023 owing to the current coal-to-oil and coal-to-chemicals momentum. Coal conversion is well perceived in China, as it is a good way to increase energy security, monetise otherwise stranded coal and develop certain regions, and it is air-pollution friendly. Despite the push for gas in the Clean Air Strategy, some doubts have arisen in the coal-to-gas sector, where some companies struggle with poor economics and technical problems. Table 3.1 lists coal-to-liquids projects planned to come online during the forecast period.
Judging from the trends in various sectors, the breakdown of coal demand in China is expected to converge with that of more mature economies, and the power sector’s share of total coal consumption will increase to 57-3% higher than in 2017.
Geothermal heating4% Biomass heating
15%
Gas heating14%
Electric heating8%
Coal district heating58%
Geothermal heatingBiomass heatingSolar heatingIndustrial waste heatingGas heatingElectric heatingCoal district heatingDistributed coal
© O
EC
D/IE
A, 2
018

MEDIUM-TERM DEMAND AND SUPPLY FORECAST
80 COAL 2018
Table 3.1 Coal-to-liquids plants in China, 2017 and 2023
Capacity (Mtpa) Company Location Process 2017 2023
China Energy Inner Mongolia (Ordos) DCL 1.1 3.2
Yitai Inner Mongolia ICL 0.2 0.2
Lu'an Shanxi ICL 0.2 0.2
China Energy Inner Mongolia ICL 0.2 0.2
Yankuang Yulin ICL 1.0 1.0
Yitai Inner Mongolia (Hangjin) ICL 1.2
China Energy Nigxia ICL 4.0 4.0
Lu'an Shanxi (Changzhi) ICL 0.5 1.8
Yufu Energy Guizhou (Bijie) ICL 2.0
Yitai Xinjiang (Yili) ICL 1.0
Yitai Xinjiang (Urumqi) ICL 2.0
Yitai Inner Mongolia (Ordos) ICL 2.0
Yanchang Yulin (Shaanxi) 0.3
Yitai/Huadian Ganquanbao (Inner Mongolia) ICL 1.0
Yankuang Yulin (Shaanxi) ICL 1.0
Shaanxi Future Energy Shaanxi ICL 2.0
Total 7.1 23
Notes: Mtpa = million tonnes per annum; DCL = direct coal liquefaction; ICL = indirect coal liquefaction.
India
Coal demand in India is forecast to rise from 563 Mtce in 2017 to 708 Mtce in 2023 at a CAAGR of 3.9%. Both power and non-power coal demand rise substantially over the next six years, making India the economy with the largest absolute increase in coal consumption in the world.
India’s power sector – responsible for almost two-thirds of total coal demand – largely drives the forecast. Considering that infrastructure development is ongoing, the middle class is expanding, more and more people have access to electricity, and GDP growth exceeds 7%, strong electricity generation growth of 5.4% per year is forecast for the projection period. Because coal is the default fuel for power generation in India, the expansion of other energy sources, particularly renewables, has an important influence on projections. Over 80 GW of solar and 65 GW of wind-based generation capacity are expected by 2023 (the Indian government is aiming for 100 GW of solar and 50 GW of wind by 2022 – double the wind capacity of 2017 and four times the solar capacity). Overall, India’s renewables-based generation (including hydro) almost doubles to nearly 25% of the power mix during the forecast period. Additional nuclear-based generation of 30 TWh from the nuclear plants under construction (around 4 GW of capacity) is also assumed. Although growth in gas-fired generation is also forecast, gas does not play an important role in India. As a result, coal-fired generation increases at a CAAGR of 3.8% and coal demand for power grows a little more slowly at 3.5% per year as a result of the higher thermal efficiency of newer plants. Over half of the new capacity (currently over 50 GW under construction) is supercritical (the Khargone Super Thermal Power Station in Madhya Pradesh is to be the first ultra-supercritical [USC] plant in India), compared with less than one-third of current capacity. Furthermore, as much as 23 GW of old, inefficient
© O
EC
D/IE
A, 2
018

MEDIUM-TERM DEMAND AND SUPPLY FORECAST
COAL 2018 81
subcritical power plants could be retired by 2022 as a result of stricter environmental standards introduced in 2015 – although implementation of these standards has been postponed due to the financial and technical challenges of retrofitting the plants. The load factors of India’s coal-fired power plants have been falling for several years as capacity expansion has outstripped generation growth, despite generation expanding 8% per year on average. Given the amount of capacity under construction, this decline will continue unless more retirements occur. Lignite demand is also likely to increase moderately, from 15 Mtce in 2017 to 21 Mtce in 2023, as a number of plants burn lignite,
Owing to strong economic growth and infrastructure development, India’s non-power coal consumption, with cement and sponge iron production as the largest users, grows a substantial 33 Mtce over the forecast period, to 163 Mtce in 2023. Crude steel output expands to over 140 Mt by 2023 at a CAAGR of 6% (Figure 3.7), and India, as soon as in 2018, overtakes Japan to become the world’s second-largest crude steel producer. Crude steel expansion results in even higher pig iron production, of which India soon becomes the second-largest world producer. Met coal demand rises rapidly in consequence, by 6.2% per year to 83 Mtce in 2023 – 25 Mtce more than in 2017.
Figure 3.7 Crude steel, pig iron and direct reduced iron production in India, 2010-23
*Estimated.
Sources: Adapted from IMF (2018), World Economic Outlook; World Steel Association (2018) Statistics, www.worldsteel.org/steel-by-topic/statistics.html.
Japan
As the amount of coal used for power generation falls, Japanese coal demand is forecast to decline from 164 Mtce in 2017 to 153 Mtce in 2023 at a rate of 1.1% per year.
Japan’s coal-fired power stations are baseload plants, mostly unaffected by fluctuations of power demand or renewables output. However, this could change. As a marginal decline in Japanese electricity demand is expected, nuclear plant re-starts (15 GW assumed to be operational by 2023) and renewables expansion could get the thermal gap smaller, especially at certain times owing to solar photovoltaic (PV) expansion. Coal capacity may therefore be constrained to work at full load, so despite coal capacity under development (Table 3.2), coal-based power generation and coal demand are projected to fall slightly. In addition, most of the new plants will co-fire biomass with coal, and they are mostly highly efficient USC or integrated gasification combined cycle (IGCC) technology, which also reduces the amount of coal needed for coal-fired generation. Nevertheless, coal moves
0 20 40 60 80
100 120 140 160
2010 2011 2012 2013 2014 2015 2016 2017 2018* 2019* 2020* 2021* 2022* 2023*
Mt
Pig iron Direct reduced iron Crude steel
© O
EC
D/IE
A, 2
018

MEDIUM-TERM DEMAND AND SUPPLY FORECAST
82 COAL 2018
from being Japan’s second-largest electricity source in 2017 to largest by 2023, as gas-fired generation, with higher generation costs, declines more strongly over the period.
Table 3.2 New coal-fired power stations in Japan, 2018-23
Plant Developer Technology Capacity (MW) Scheduled for
Akita Nippon Paper 112 2018
Kamisu Marubeni Corp., KEPCO 112 2018
Hibikinada Hibikinada Thermal, IDI Infrastructures 112 2019
Matsuura Kyushu USC 1 000 2019
Kushiro Kushiro Coal Mine, F-Power, IDI-I, etc. 112 2019
Houfu Air Water Inc., Chugoku Energy 112 2019
Takehara J-POWER USC 600 2020
Noshiro Tohoku Electric Power USC 600 2020
Kashima J-POWER, NSSMC USC 645 2020
Nakoso TEPCO, Mitsubishi Corp., Joban, etc. IGCC 540 2020
Hitachinaka JERA USC 650 2020
Hirono TEPCO, Mitsubishi Corp., Joban, etc. IGCC 540 2021
Taketoyo Chubu Electric Power USC 1 070 2022
Misumi Chogoku Electric Power USC 1 000 2022
Tokuyama TKE3 300 2022
Total 7 505 Note: MW = megawatt.
Declining crude steel and iron production also results in gradually declining Japanese met coal demand, which is expected to fall from 45 Mtce in 2017 to 41 Mtce in 2023 at 1.5% per year.
Korea
Korea consumed 129 Mtce of coal in 2017, and demand is expected to continue rising slightly to 131 Mtce in 2023. The increase is mainly in met coal, demand for which expands 2% annually to reach 39 Mtce in 2023, driven by a positive economic outlook. Thermal coal demand, however, peaks at 97 Mtce in 2020 and then declines to 92 Mtce in 2023.
Electricity demand rises over the forecast period, with total generation growing at a CAAGR of 1.6%, from 566 TWh in 2017 to 622 TWh in 2023. After significant growth in 2017, coal-fired power generation expands further as additional power plant blocks become operational, raising capacity by 4.6 GW (net) over the outlook period (Table 3.3). In 2021, however, additional nuclear reactors also come online and renewables capacity expands significantly by 2023. This additional generation crowds out natural gas and, to a lesser extent, coal, causing coal plant load factors to fall in the latter half of the outlook period. As a result, coal plants are expected to generate 260 TWh in 2023, roughly the same as in 2017. The share of coal in the power mix declines to 42%, but it remains Korea’s primary source of electricity, followed by nuclear (28%), natural gas (19%), and renewables (10%).
© O
EC
D/IE
A, 2
018

MEDIUM-TERM DEMAND AND SUPPLY FORECAST
COAL 2018 83
Table 3.3 Commissioning and retirements of coal-fired power plants in Korea, 2018-23
Unit Capacity (MW) Schedule
Pocheon CHP 84 August 2018
Youngdong 2 -200 January 2019
Samcheon -1 120 December 2019
Shin Seocheon 1 1 000 March 2020
Yeosu CHP 124 July 2020
Honam 1 and 2 -500 January 2021
Goseong GreenPower 1 1 040 April 2021
Goseong GreenPower 2 1 040 October 2021
PosPower 1 1 050 December 2021
Boryeong 1 and 2 -1 000 May 2022
Gangneung EcoPower 2 2 080 June 2022
PosPower 2 1 050 June 2022
Total (net) 4 648
Note: Retirements in red.
Source: MOTIE (2017), 8th Basic Plan for Long-Term Electricity Supply and Demand (2017-2031).
Korea’s economic outlook for the forecast period remains positive. Accordingly, met coal demand is expected to rise at a CAAGR of 2%, reaching 39 Mtce in 2023 to supply steadily expanding crude steel production.
Southeast Asia
Worldwide, the greatest percentage increase in coal demand (5.4%) is expected in Southeast Asia, rising from 186 Mtce in 2017 to 259 Mtce in 2023.
Within the region, coal demand growth is concentrated in Indonesia, Viet Nam, Malaysia and the Philippines.2 Although these countries differ considerably in energy resource endowment, they share (to varying degrees) robust economic growth, a rising population and an expanding middle class, all of which boost power demand (which is rising substantially at over 4% per year). As coal-based power is expected to cover a significant share of the additional demand (followed by natural gas and renewables), considerable new coal-fired capacity is set to come online in these four countries. Viet Nam, which had 14.5 GW of coal capacity in December 2017, has planned to have over 40 GW by 2023 (Figure 3.8) (the forecast assumes a lag between that schedule and actual commissioning).
2 In Thailand, the region’s other significant user of coal, public opposition to proposed coal-fired plants is strong, and so they are not assumed to be operational by 2023. Slight coal demand growth is forecast, but in non-power demand in industry and construction.
© O
EC
D/IE
A, 2
018

MEDIUM-TERM DEMAND AND SUPPLY FORECAST
84 COAL 2018
Figure 3.8 Planned annual coal-fired capacity additions in Viet Nam to 2023
In Indonesia, coal-fired capacity expansions shift rapidly to supercritical and even USC technology, reducing emissions considerably compared with the existing predominantly subcritical fleet (Table 3.4). In addition to these plants, other projects totalling around 5 GW are under development, plus a number of mine-mouth projects. Coal conversion plants, if developed, could also raise coal demand. Although some projects have been proposed, they are not included in the forecast because final investment decisions have not been made.
Table 3.4 Select ultra-supercritical coal plants under development in Indonesia
Plant Company Capacity (MW) Expected commissioning year
Java 4 (Tanjung Jati B) PT Bhumi Jati Power 2 x 1 000 2019
Java 7 Guohua Java Power 2 x 1 050 2020
Central Java PT Bhimasena Power 2 x 1 000 2020
Cirebon Cirebon Energi Prasarana 1 000 2022
Cilacap (Jawa 8) S2P Expansion 1 000 2019
Jawa 9 PT Indo Raya Tenaga 1 000 2023
Jawa 10 PT Indo Raya Tenaga 1 000 2023
Total 10 100
Additional coal-fired capacity is also under construction in the Philippines (5 GW) and Malaysia (2.6 GW). As a result, coal-fired power generation grows at a CAAGR of 6.3% across the region and thermal coal demand rises 5.4% per year through 2023. Lignite demand – all of it consumed for power generation in Thailand and the Lao People’s Democratic Republic (Laos) – is expected to remain flat.
Strong economic growth over the outlook period continues to support expanding crude steel and cement production in Southeast Asia, so non-power thermal and met coal consumption are also projected to increase. Met coal demand triples from 4 Mtce in 2017 to 12 Mtce in 2023 as new blast furnaces open in Malaysia, Indonesia and Viet Nam.
1 0002 0003 0004 0005 0006 0007 0008 0009 000
Before 2012 2012 2013 2014 2015 2016 2017 2018 2019 2020 2021 2022 2023
MW
© O
EC
D/IE
A, 2
018

MEDIUM-TERM DEMAND AND SUPPLY FORECAST
COAL 2018 85
Other Asia Pacific
In Australia, coal demand falls from 66 Mtce in 2017 to 59 Mtce in 2023. Load factors of the country’s coal-fired power stations decline slowly as renewables-based generation expands, and closure (by 2022) of the 2 000-MW Liddell hard coal-fired power station in New South Wales’ Hunter Valley also further reduces coal-fired power generation towards the end of the forecast period. As a result, thermal coal demand falls from 43 Mtce in 2017 to 40 Mtce in 2023 while lignite demand decreases from 19 Mtce to 17 Mtce. Met coal demand declines slightly to 3 Mtce in 2023.
Coal demand in Chinese Taipei rises at a 1% CAAGR between 2017 and 2023, climbing from 60 Mtce to 63 Mtce. Thermal coal consumption accounts for the increase as coal-fired power generation rises slightly in response to rising electricity demand. Policy uncertainty on coal power has increased after the Referendum held in November 2018. Met coal demand is expected to remain stable at 7.5 Mtce per year.
Strong growth in coal-fired power generation doubles Pakistan’s demand for coal from 12 Mtce in 2017 to 24 Mtce in 2023. The 1 320-MW Port Qasim coal-fired power station was commissioned in April 2018, and another 2.6 GW are currently under development and expected to come online during the forecast period (Table 3.5). One-third of the new capacity slated to come online after 2018 will rely on imported coal, with the remainder running on domestic coal mined from the Thar coal fields.
Table 3.5 New coal-fired power stations in Pakistan, 2018-23
Province/Plant Capacity (MW)
Expected start year
Coal consumption (Mtpa) Coal source
Sindh/Port Qasim 660 2018 1.9 Imported
Sindh/Port Qasim 660 2018 1.9 Imported
Balochistan/Hub 660 2018 1.9 Imported
Sindh/Engro Power Gen Thar 330 2019 1.9 Thar Block II Phase I
Balochistan/Hub 660 2020 1.9 Imported
Sindh/Engro Power Gen Thar 330 2020 1.9 Thar Block II Phase I
Balochistan/Gwadar 300 2021 0.9 Imported
Sindh/ Shanghai Electric 660 2021 3.8 Thar Block I
Sindh/Thalnova Power Thar 330 2021 1.9 Thar Block II Phase II
Sindh/Thar Energy Limited 330 2021 1.9 Thar Block II Phase II
Sindh/Jamshoro 1320 2021 4 80% imported/20% Thar
Sindh/Shanghai Electric 660 2022 3.8 Thar Block I
Sindh/Oracle 1 320 2022 7.8 Thar Block VI
Total 8 220
17.5
© O
EC
D/IE
A, 2
018

MEDIUM-TERM DEMAND AND SUPPLY FORECAST
86 COAL 2018
Another country with increasing power sector coal demand is Bangladesh, which more than triples its 2017 consumption (3 Mtce) by 2023 (see Box 4.3).
North America North American coal demand continues to decrease at a CAAGR of 2.6% over the forecast period, from 513 Mtce in 2017 to 437 Mtce in 2023. The United States – the continent’s largest consumer by far – is responsible for most of this trend.
United States
US coal demand is projected to fall from 473 Mtce in 2017 to 413 Mtce in 2023, a 2.2% decline per year. As electricity generation accounts for more than 90% of US coal consumption, the fate of coal demand is decided by the power sector. The three elements that have characterised the US power landscape for several years still persist: sluggish (if any) power demand growth; expansion of renewables, driven by tax breaks and state portfolios (and accelerated by declining costs); and increasing availability of affordable natural gas.
The regulatory pressure that had been helping to curb coal-fired generation has now eased, however, as the current US administration publicly supports coal as an important element of supply security, energy independence and grid resilience. Accordingly, it is reversing numerous rules affecting coal mining and power generation and studying ways to support the sector. One of the more significant changes is the Environmental Protection Agency’s proposed repeal of the 2015 Clean Power Plan. Its replacement, the Affordable Clean Energy Rule, would shift greenhouse gas regulatory authority to states and encourage efficiency upgrades through modified New Source Review requirements. Extension and expansion of the 45Q tax break offers opportunities for carbon capture, utilisation and storage. Through its programme “Coal FIRST” (Flexible, Innovative, Resilient, Small, Transformative), the US Department of Energy is researching the potential for small, highly flexible, and efficient modular coal plants with near-zero emissions. Such small, modular coal plants would be easy to replicate and less financially risky than large ones.
Figure 3.9 Marginal East Coast US coal- and gas-fired power generation costs over the outlook period
Notes: MWh = megawatt hour; CCGT = combined-cycle gas turbine. CCGT net efficiency: 55%; coal net efficiency: 35-44%.
0 10 20 30 40 50 60 70 80 90
0 5
10 15 20 25 30 35 40 45
Oct-18 Oct-19 Oct-20 Oct-21 Oct-22 Oct-23
USD/tUSD/MWh Coal (left axis)
CCGT (left axis)
Henry Hub (gas)(left axis)
East Coast(coal) (rightaxis)
© O
EC
D/IE
A, 2
018

MEDIUM-TERM DEMAND AND SUPPLY FORECAST
COAL 2018 87
Nevertheless, although these policy changes and research are considered beneficial for the US coal industry, they are not expected to significantly alter the current coal demand trajectory in the medium term, mainly for economic reasons. As illustrated in Figure 3.9, the marginal cost of gas-fired power generation is projected to remain well below that of coal in many regions owing to persistently low natural gas prices. Based on company announcements and market conditions, closure of at least 20 GW of coal capacity is expected over the forecast period. Although no lignite-fired power stations are scheduled for decommissioning, expansion of intermittent wind and solar electricity production will reduce the load factor of lignite plants (located chiefly in Texas), slowly reducing their annual output. Consequently, lignite demand falls slightly from 31 Mtce in 2017 to 26 Mtce in 2023.
Higher consumption for crude steel production is offset by increased use of the electric furnace, so met coal demand is expected to remain roughly stable at 18 Mtce over the projection period.
Using coal for other purposes could boost demand, however. Riverview Coal has proposed a coal-to-diesel plant in Spencer County, Indiana, that would produce 13 thousand barrels per day (kb/d) of diesel and 7 kb/d of naphtha from direct hydrogenation, taking advantage of both low-cost gas to produce hydrogen and inexpensive high-sulphur Illinois coal (sulphur helps the process). While this project would consume only 1.5 Mt of coal per year, it could pave the way for further coal use. It is unlikely to be in service before 2024, however.
Other North America
Canada, which has committed to a complete phase-out of unabated coal-fired power generation by 2030, is expected to almost halve coal consumption from 23 Mtce in 2017 to 12 Mtce in 2023. Mexico’s coal demand also declines, from 17 Mtce in 2017 to 12 Mtce in 2023. Developments in both countries largely mirror those of the United States, with coal use declining in power generation but stabilising in other sectors. Mexico also joined the Powering Past Coal Alliance.
Central and South America
Coal demand in Central and South America increases 1.1% per year, from 45 Mtce in 2017 to 48 Mtce in 2023, owing to rising thermal coal consumption.
Higher thermal coal demand results mainly from coal-fired capacity additions. The largest plant under development is the Punta Catalina (2 x 376 MW) in the Dominican Republic. Load factors are difficult to forecast, especially in Brazil, as seasonal variations in hydro production are a crucial factor. 340 MW Pampa Power Station is under construction in the Candiota coal field near Uruguay. In January 2018, Chile (the region’s largest consumer of coal for power generation) announced that it intends to phase out coal, but plant closures are unlikely until after the outlook period. On the contrary, the 375-MW Mejillones coal plant is about to start commercial operation, although it will be offset by approximately 450 MW small plants which will be closed by 2021.
Met coal demand is expected to stabilise at 19 Mtce per year over the outlook period, and Brazil remains the region’s largest consumer by far (11 Mtce per year in 2023).
Europe
Coal demand in Europe continues to fall at a CAAGR of 1.3% over the outlook period (from 406 Mtce to 375 Mtce). The European Union is responsible for the region’s overall decline, as coal demand in eastern and southern Europe (non-EU countries) remains stable and even increases in Turkey.
© O
EC
D/IE
A, 2
018

MEDIUM-TERM DEMAND AND SUPPLY FORECAST
88 COAL 2018
European Union
EU coal demand is projected to drop 2.5% per year, from 325 Mtce in 2017 to 280 Mtce in 2023.3 However, even though there is no doubt that coal demand is in strong decline with no chance of recovery, it will have taken 30 years for consumption to drop by half (demand in 1992 was 567 Mtce), indicating the resiliency of coal as an energy source.
Falling EU coal consumption is the result of both energy resource competition and government policies. Declining renewables costs, diversification of natural gas supplies as US and Australian LNG exports expand, and sluggish power markets are all curtailing coal-based generation. In addition, climate legislation, air pollution regulations and, more recently, phase-out policies reinforce coal consumption cuts. Although the EU ETS penalises coal-based power generation because it is CO2 emissions-intensive, this does not reverse coal-to-gas competition (except in the United Kingdom due to its floor price). However, the ETS has been reinforced with additional policies. The backloading mechanism temporarily removed 900 million CO2 permits from auction during 2014-16, and the Market Stability Reserve (MSR) aims to further reduce the current surplus of CO2 permits in the market (estimated at 2 Bt) by doubling the rate at which excess allowances are absorbed – from 12% in 2019 to 24% in 2023 – and permanent cancellation. Furthermore, the linear reduction rate of annual allowance auctions and allocations is increasing from 1.7% to 2.2%. However, even with all these measures, it is not certain that high CO2 prices are enough to completely change the dispatch order of plants (Figure 3.10).
Figure 3.10 Marginal EU hard coal- and gas-fired power generation costs over the outlook period
Notes: EUA = European Union Allowance. CCGT net efficiency: 55%; coal net efficiency: 35-44%.
Regarding air pollution regulations, the Large Combustion Plants Directive gave rise to significant capacity closures across Europe. In addition, the Industrial Emissions Directive, which establishes more stringent emissions limits, obligates many plant owners to invest to reduce emissions even though investment recovery will be difficult (electricity demand is flat, variable renewables are expanding and wholesale electricity prices are low). Even with these policies, however, two types of coal-fired power plants are well positioned to compete: modern high-efficiency plants equipped with
3 United Kingdom is considered part of the European Union in this report.
0 10 20 30 40 50 60 70 80 90
0 10 20 30 40 50 60 70 80 90
Oct-18 Oct-19 Oct-20 Oct-21 Oct-22 Oct-23
EUR/tEUR/MWh Coal (left axis)
CCGT (left axis)
TTF (gas) (leftaxis)
API2 (coal)(right axis)
EUA (right axis)©
OE
CD
/IEA
, 201
8

MEDIUM-TERM DEMAND AND SUPPLY FORECAST
COAL 2018 89
air quality control equipment, and plants consuming inexpensive mine-mouth lignite. Several countries have therefore consented to phase-out policies: in fact, most of the western EU member states have pledged to end coal-based generation by 2030 (Map 3.1).
Map 3.1 EU coal-fired power generation phase-out
The list includes the United Kingdom, France, Ireland, Denmark, Sweden, Finland, the Netherlands, Italy, Portugal, Austria, and, very recently, Hungary, although only Austria, Sweden and France will phase it out completely by 2023. In Germany, Slovakia and Spain, discussions are ongoing. Whereas the share of coal in countries that have decided to phase it out is below 10%, in those that have not it is around 40%. As a result of this broad policy action, thermal coal demand is expected to fall
© O
EC
D/IE
A, 2
018

MEDIUM-TERM DEMAND AND SUPPLY FORECAST
90 COAL 2018
substantially, by 4.8% per year, from 146 Mtce in 2017 to 109 Mtce in 2023. Lignite demand is also forecast to decline, but more slowly (-1.1% per year).
Continued transformation of the EU power mix is therefore expected. The share of coal in the electricity mix is forecast to decline from 21% in 2017 to 17% in 2023 (less than half the share of renewables) as Spain retires half its existing capacity and 2 GW are switched off in Italy. But the most important country for this forecast is Germany, the European Union’s largest coal consumer by far and where the future of coal is uncertain. Decommissioning of 3 615 MW of coal capacity is planned (on top of the nuclear shutdowns), and commissioning of the new 1 100-MW Datteln 4 hard coal plant has been further delayed (Table 3.6). Furthermore, the Commission on Growth, Structural Change and Employment has been tasked with drawing up a phase-out plan for coal power (BMU, 2018), with results expected in 2019. Although a complete phase-out is not expected until well after 2030, additional retirements over 2018-23 are currently being discussed by the commission.
Table 3.6 Coal-fired power stations to be decommissioned in Germany
Unit Fuel Capacity (MW) Decommissioning in
Gemeinschaftskraftwerk Kiel Hard coal 323 2018
Kraftwerk Werdohl-Elverlingsen Hard coal 310 2018
HKW Elberfeld 3 Hard coal 85 2019
HKW I Hard coal 95 2018
Niederaußem E and F Lignite 594 2018
Jänschwalde E and F Lignite 930 2018
Neurath C Lignite 292 2019
Kraftwerk Ensdorf 1 and 3 Hard coal 389 2018/2019
Reuter C Hard coal 124 2019
Lünen 6 and 7 Hard coal 473 2019
Gersteinwerk 2 Hard coal 614 2019
Total 3 615 Note: Niederaußem E/F, Jänschwalde E/F and Neurath C were taken off the grid and moved into the standby reserve, which means they no longer participate in the wholesale market. Final decommissioning will take place in approximately three years.
Source: Bundesnetzagentur (2018), “Power plant closure notifications”.
A clear divide between eastern and western EU member states is apparent in the medium-term outlook for coal-fired power generation. While most western members have committed to phase-outs with more or less firm schedules, eastern ones continue to consider coal-generated power a pillar of the electricity supply. In Poland, in addition to the 1 075-MW Kozienice plant commissioned in December 2017, the Opole 5 and 6 (1 800 MW), 910-MW Jaworzno 3, 1 000-MW Ostroleka and 496-MW Turow lignite plants are under construction. Rather than coal demand rising, however, it will fall slightly because the units are replacing older, less-efficient capacity. Hard coal- and lignite-fired capacity is expected to remain at current levels (with fluctuations) in Bulgaria, the Czech Republic, Greece, Hungary and Romania. As a result, coal-fired power generation is projected to drop substantially in western member states, including Germany, at roughly 5% per year, while current output levels are maintained in the eastern European Union.4
4 Bulgaria, Croatia, the Czech Republic, Greece, Poland, Romania, Slovakia and Slovenia.
© O
EC
D/IE
A, 2
018

MEDIUM-TERM DEMAND AND SUPPLY FORECAST
COAL 2018 91
Met coal demand is considered uncertain in light of recently imposed steel tariffs. A slight increase in steel production is offset by some process efficiency improvements and increasing scrap use, so met coal demand is forecast to remain stable.
Other Europe
Coal demand in Turkey is projected to rise from 57 Mtce in 2017 to 70 Mtce in 2023 at a CAAGR of 3.3%. Electricity demand continues to grow, provoking a 30-TWh increase in coal-fired electricity generation over the outlook period. As expectations for expanding coal imports have diminished, only the 1 320-MW Hunutlu power plant is set to go ahead; prospects are better for plants using domestic lignite. Accordingly, steam coal demand increases 3.4% per year to 37 Mtce in 2023, while lignite demand rises 4% per year to reach 26 Mtce.
Turkish crude steel production is highly influenced by trade tariffs, so under current circumstances met coal demand is projected to remain stable at 7 Mtce per year until 2023. Given that Turkey is a net exporter of steel products, future developments will depend on trade tariff evolution.
Stable coal demand is forecast for Balkan countries (Box 3.3).
Box 3.3 Lignite-based electricity in the Balkans
Serbia, the Former Yugoslav Republic of Macedonia (FYROM), Kosovo, Bosnia and Herzegovina and Montenegro, formerly integrated into Yugoslavia (together with Slovenia and Croatia), share many characteristics owing to their common past, one of them being lignite dependency. Lignite is used for more than 50% of electricity generation in all these countries: Montenegro (50.3%) is the least dependent and Kosovo (97%) the most (Figure 3.11). Lignite plants in the Balkans are generally old, and emissions of air pollutants (SO2, NOX, particulates and others) exceed EU limits.
Figure 3.11 Shares of lignite-generated electricity in Balkan countries
Source: IEA (2018c), Electricity Information (database), www.iea.org/statistics.
Serbia, the largest and most populated Balkan country, has over 4 GW of lignite-fired capacity that produces 70% of its electricity, fuelled by domestic lignite from the Kolubara and Kostolac basins. Serbia’s lignite dependency was made obvious in 2014, when floods affecting Tamnava West, Veliki Crljeni and Kolubara Fields B and D severely disrupted the coal supply – and therefore the power supply. To ensure stable lignite supplies in the future, EPS, the state-owned utility, started production at Polje G mine in December 2017 and expects to also start at Radljevo mine in 2019. In addition, it plans to
0%10%20%30%40%50%60%70%80%90%
100%
Bosnia FYROM Kosovo Montenegro Serbia Average
© O
EC
D/IE
A, 2
018

MEDIUM-TERM DEMAND AND SUPPLY FORECAST
92 COAL 2018
commission a new 350-MW block, Kostolac B3 (a USD 715-million investment) – the first power plant to be built in Serbia in almost 30 years and involving expansion of the Drmno lignite mine from 9 Mtpa to 12 Mtpa. China Exim Bank is providing a USD 575-million loan, and the Serbian government the balance. Construction work began in November 2017, and the plant is to be operational by 2020. Kolubara B, a lignite-based 750-MW project, is currently seeking financing.
In Bosnia and Herzegovina, where two-thirds of electricity is generated from lignite, investments are being made to guarantee lignite-based generation for years to come. The 300-MW Stanari power plant, which started operations in 2016, was built by Dongfang and financed by the China Development Bank. The plant complies with the EU Large Plant Combustion Directive and required investment in the adjacent coal mine. Tuzla G7 is a 450-MW lignite-fired plant at Tuzla, where a 715-MW plant is currently operating. It is a USD 900-million investment, of which EPBiH (Elektroprivreda Bosne i Hercegovine), the owner, has secured USD 750 million through a loan from China Exim Bank. In January 2018, the China Energy Group and Lager, a Bosnian company, signed an agreement to build a USD 640-million mine and power plant at Kamengrad (2 x 215 MW), and construction of Uglijevik 3, a 600-MW (2 x 300 MW) plant, together with a mine that will feed the plant, began in 2017. Finally, the 350-MW Gacko 2 project aims to replace an old unit currently in operation. Progress with the proposed 350-MW Banovici plant has not been reported recently.
In the Former Yugoslav Republic of Macedonia, where coal fuels 60% of power generation, a new coal-fired power plant that would require a new mine has been proposed for Mariovo. It is not currently clear, however, whether this project will go ahead.
In Montenegro, the 220-MW Pljevja power plant, commissioned in 1982 and supplied with domestic lignite, is the only coal-fired plant. A new 254-MW unit in Pljevja was proposed and contracts were signed, but it was not possible to secure financing, so the existing plant needs to be modernised.
Kosovo, endowed with the fourth-largest lignite resources in Europe (10.8 Bt) after Poland, Germany and Serbia, depends almost completely on lignite for power generation. ContourGlobal is planning to build a 500-MW plant in Kosovo, with construction expected to start in 2019 and commissioning by 2023. One of the poorest countries in Europe, Kosovo is also one of the most polluted, and the old Kosova A and Kosova B plants are major contributors to this pollution. Replacing Kosova A’s old units would benefit the environment as well as end the country’s frequent electricity blackouts. In October 2018 the World Bank announced it will not finance the plant, so its future is uncertain.
Middle East
Coal demand in the Middle East is projected to rise slightly, from 10 Mtce in 2017 to 12 Mtce in 2023, as the result of two opposing trends. Thermal coal consumption in the United Arab Emirates is expected to expand as the four 600-MW blocks of the Hassyan coal-fired power station come online from 2020 to 2023. Oman is also constructing its new 1 200-MW Duqm coal-fired power plant, but it is not sure to be operational by 2023 so has not been included in this forecast. In contrast, Israel, currently the largest Middle Eastern coal consumer, changed its energy policy after the Leviathan gas fields were discovered. In consequence, it is phasing out coal-based power generation and replacing it with renewables and domestically produced natural gas. Roughly half of Israel’s 5 GW of coal-fired capacity is to be supplanted by natural gas-fired generation, with complete phase-out set for after the forecast period.
© O
EC
D/IE
A, 2
018

MEDIUM-TERM DEMAND AND SUPPLY FORECAST
COAL 2018 93
Eurasia
Eurasian coal demand increases slightly over the projection period, from 266 Mtce to 269 Mtce. While demand for thermal coal and lignite is expected to remain stable, met coal demand expands by 3 Mtce to 97 Mtce in 2023.
Russia
A slight decrease in Russian coal demand is expected (from 172 Mtce in 2017 to 168 Mtce in 2023), largely due to a 1.3% per year drop in thermal coal demand (66 Mtce by 2023). Although electricity demand expands marginally, coal-fired electricity generation falls severely, from 171 TWh in 2017 to 153 TWh in 2023, with steam coal in particular being crowded out by steadily increasing generation from natural gas, nuclear and renewables. As a result, the portion of coal in Russia’s power mix declines from 16% in 2017 to 14% in 2023.
Russia was the world’s third-largest steel exporter and a major producer of crude steel in 2017 (DOC, 2018). Over the outlook period, rising steel exports are expected to drive domestic crude steel production, raising Russian met coal demand to 67 Mtce in 2023.
Other Eurasia
Coal demand in Ukraine is projected to remain at 40 Mtce per year between 2017 and 2023. In Kazakhstan, it increases slightly with expanded coal-fired electricity generation (from 50 Mtce in 2017 to 53 Mtce in 2023). To meet this rise in demand, the Balkhash SC coal-fired power plant (2 x 660 MW, scheduled for 2020), Ekibastuz GRES-1 Unit 1 (500 MW, scheduled for 2021) are under construction, and so too, Ekibastuz GRS-2 Unit 3 (636 MW), although commissioning may not happen before 2023.
Africa
Coal demand in Africa increases at a CAAGR of 1.5% between 2017 and 2023, rising to 170 Mtce. While demand for thermal coal rises by 14 Mtce to 165 Mtce, met coal increases 1.1% per year from a very low level to reach 5 Mtce by the end of the outlook period.
South Africa
Aside from annual fluctuations, stable coal demand is forecast for South Africa. The share of coal in the energy mix is high at 70% – second only to Mongolia’s (90%). The country is projected to consume 147 Mtce of coal in 2023.
After several years of slow decline, electricity demand rises again over the outlook period, prompting higher coal-fired generation. Renewables-based generation expands more quickly, however, so the share of coal in the power mix actually declines to around 85% by 2023. This forecast is based on strong economic growth, but if growth is not as strong as expected, the coal share would shrink as a result of renewables expansion.
Eskom, the state-owned utility, expects the three remaining units of the Medupi power station (combined capacity of 2.4 GW) to be connected to the grid by 2020. Eskom’s other major coal project, Kusile, is behind schedule, with five units (4 GW total capacity) yet to be commissioned (Eskom expects it to be completed by 2022). Two independent power producer (IPP) projects, the 557-MW Tahbametsi and 336-MW Khanyisa power stations, are beset by legal and financial challenges and are not expected to be in service by the contract date in December 2021.
© O
EC
D/IE
A, 2
018

MEDIUM-TERM DEMAND AND SUPPLY FORECAST
94 COAL 2018
Non-power demand is anticipated to grow, driven by increasing industrial activity. The liquefaction sector, once the largest in the world, remains largely unchanged over the forecast period, however, as does met coal demand of 4 Mtce per year.
Other Africa
Coal demand in Morocco is projected to increase to 9 Mtce per year with commissioning of the 1.4-GW Safi power station. Originally scheduled for March 2018, it has been postponed to 2019 due to technical problems. Egypt is going ahead with construction of an over 6-GW coal-fired power station at Hamrawein on the Red Sea. This plant, one of the largest coal plants in the world if built as planned, together with Ayoun Moussa (2 600 MW) and other proposed projects currently behind schedule, will significantly affect the coal trade if completed. These plants are not expected to enter into service before 2023. Nevertheless, coal use in Egypt is to increase driven by higher use in the cement industry. Coal demand is also rising in other African countries, but the forecast is cautious considering that the projects likely to be developed are of small scale, and large ones are unlikely. In Botswana, for example, Kibo Mining is trying to develop the 600-MW Mabasekwa IPP plant, a mine-mouth project consisting of four units of 150 MW, but financing for the project is not guaranteed. It seems more likely that the 60-MW mine-mouth Imaloto power plant in Madagascar will go ahead, as will Malawi’s 300-MW Kamwamba power plant. Another project that will likely proceed is the 300-MW Ncondezi mine-mouth plant in Mozambique. Given its considerable coal reserves and increasing production in recent years, Mozambique seems to be one of the countries where new plants are more likely, such as the 300-MW Benga Power plant. In Zambia, the 300-MW Maamba mine-mouth plant has made some progress, and the 300-MW mine-mouth Mbeya and 120-MW Rukwa plants in Tanzania also seem likely to go ahead. Completion of some of these projects and increasing use of coal for cement production and other industrial purposes will raise coal demand, but not considerably.
The 1 000-MW Lamu Coal Power Station in Kenya, which had seemed ready to proceed, is facing increasing public opposition. Another project that is highly uncertain is a 50 000-barrel-per-day coal-to-liquid project in Zimbabwe. If built, it would have the largest coal demand of all the prospective projects. Given the current status of these projects, neither of them is included in the forecast.
Global coal supply forecast, 2018-23 Global coal production is projected to grow 0.1% per year over the forecast period, reaching 5 418 Mtce in 2023 (Figure 3.12). Thermal coal production increases by 63 Mtce to 4 127 Mtce, while met coal production declines by 15 Mtce to 1 015 Mtce.
Lignite production remains at roughly 276 Mtce over the projection period, as lower production in Europe and North America is offset by higher output in India.
© O
EC
D/IE
A, 2
018

MEDIUM-TERM DEMAND AND SUPPLY FORECAST
COAL 2018 95
Figure 3.12 Global coal production development, 2017-23
*Estimated.
Notes: CAAGR = compound average annual growth rate.
Asia Pacific In the Asia Pacific region, coal supplies are expected to grow 0.3% per year over the forecast period, with output reaching 3 921 Mtce in 2023.
China
China remains the world’s largest coal producer by far, accounting for 46% of global output in 2023 even though total production is expected to decline to 2 497 Mtce (36 Mtce less than in 2017). Considering that China’s coal exports are negligible at the Chinese scale, coal production is the result of coal demand minus imports. In determining how much coal to import, the key deciding factor is the difference between the cost of delivering domestic coal to the coastal regions and the cost of delivering imported coal. Nevertheless, even assuming very low short-term price elasticity for coal demand in China, coal prices also have some impact on demand. Therefore, China’s coal industry supply-side reforms, which aim to create a safe, competitive and profitable sector in the long term, will profoundly affect the global coal market in upcoming years.5
The reform’s strategy is manifold, but the cornerstone is the replacement of unsafe, polluting, high-cost mines with safer, cleaner, lower-cost ones. Consolidation of mines and companies is also an important aspect of the reform. Under the 13th FYP, China intends to phase out 800 Mtpa of inefficient coal mining capacity by 2020, while bringing 500 Mtpa of additional “high-quality” capacity online. By the end of 2017, 500 Mtpa of outdated capacity had been shut down, so the target – once viewed as overly ambitious – now seems reachable as capacity cuts continue, albeit at a slower pace than before (the number of mines is projected to decline from 7 000 at the end of 2017 to 6 000 in 2020). Met coal output is expected to be more strongly affected by the ongoing capacity cuts since coking coal is produced mostly at smaller, less-efficient mines in central and southern China, although the northern province of Shanxi is the largest producing province. Production is therefore projected to fall by 30 Mtce over the forecast period, down to 551 Mtce in 2023. Thermal coal production remains roughly at the present level, however, with a regional shift as large, new mines continue to come online, mostly in Inner Mongolia, Shaanxi and Xinjiang, following the trend outlined in chapter 1. Although demand is also shifting towards north-western China, the 5 See IEA (2017), Box 3.4, for a detailed description of supply-side reforms in China’s coal industry.
0
1 000
2 000
3 000
4 000
5 000
6 000
2016 2017* 2019 2021 2023
Mtce
Asia Pacific North America Europe Eurasia Africa Other
-5%-4%-3%-2%-1%0%1%2%3%4%5%
- 200
- 150
- 100
- 50
0
50
100
150
200
2013-17 2017-23
Mtce
CAAGR (right axis)
© O
EC
D/IE
A, 2
018

MEDIUM-TERM DEMAND AND SUPPLY FORECAST
96 COAL 2018
production shift will be larger, and this will increase demand for coal railings to demand centres and to ports around the Bohai Economic Rim – especially since the trucking of coal to all major ports is to virtually end in 2019. To prevent persistent transportation bottlenecks, China continues to invest heavily in new rail capacity, but this has ramifications for thermal coal supply costs (i.e. cost, insurance and freight [CIF], excluding royalties). While total supply capacity is expected to remain the same, costs increase significantly over the outlook period (Figure 3.13). A significant portion of the additional cost results from bringing the coal to market, as the distances between coal production centres and terminals are greater.
Figure 3.13 Thermal coal supply costs, China, 2017 and 2023
Note: Mines that supply mine-mouth power plants exclusively are excluded.
Source: CRU (2018), Thermal Coal Cost Model (database).
China’s coal mining industry is expected to continue consolidating in upcoming years to ensure its profitability. In early 2018, the NDRC stated its intention to consolidate numerous small producers to form several large mining companies, each with the capacity to produce 100 Mtpa or more of coal (only six are currently able to produce more than this). The mergers are to be completed by the end of 2020.
India
Total coal output in India is projected to rise 4% per year over the outlook period, from 395 Mtce to 499 Mtce. Thermal coal production increases to 469 Mtce (+98 Mtce from 2017), while met coal output remains flat at 9 Mtce per year.
Thermal coal production is forecast to increase because coal demand continues to grow during the outlook period and the current Indian government is committed to reducing imports as much as possible. Production growth comes from both the private and public sectors, but the cornerstone is state-owned Coal India Ltd. (CIL), which currently produces 80% of domestic output. CIL’s 1-Bt production target (i.e. double the production of 2015-16), first set for 2020, has been moved to 2026, which is more realistic and still demonstrates the government’s ambition to increase production. Accordingly, the company is investing heavily in new production capacity, albeit challenged by forest clearance and land acquisition issues. In addition to production growth, CIL aims to improve its performance, both in terms of costs and safety, entailing closure of one-third of its 174 underground mines operational in 2017. This should not significantly affect expansion plans, however, as more
0
20
40
60
80
100
120
0 250 500 750 1000 1250 1500 1750 2000
USD/t
Mt
20172023
© O
EC
D/IE
A, 2
018

MEDIUM-TERM DEMAND AND SUPPLY FORECAST
COAL 2018 97
than 95% of its production is from open-pit mines, and more are expected to come online during the forecast period. The additional mining capacity scheduled for commissioning in the next few years will ensure steady coal production expansion over the outlook period. Singareni Collieries Company Limited (SCCL), India’s second-largest coal producer (also a public company) is also expected to increase its coal output by 2023 from the current 60 Mtpa. It is therefore expanding outside Telangana province, its traditional area of operations, and increasing investment in new blocks to ramp up coal production to between 85 Mtpa and 100 Mtpa within the next five years.
The country’s captive coal producers are expected to contribute significantly to output growth. State-owned NTPC, India’s largest utility, holds ten captive coal blocks to mine steam coal for its fleet of coal-fired power stations. Two have already begun production (6.5 Mt in 2017), and with more blocks set to start soon, production could reach 50 Mtpa by 2023. Developing the new blocks is challenging, however. The Deocha Pachami block, rejected by Coal India due to geological issues, is the largest coal block by reserve volume, as it contains over 2 Bt of coal. After three years of discussions, it was allotted to West Bengal Power Development Corporation, but securing the necessary investment is difficult, as will be finding a market if the block produces at full potential, because production will exceed the needs of the nearby power plants.
State-owned NLC India Limited (NLCIL), formerly Neyveli Lignite Corporation Ltd, plans to expand current production with new lignite mines to feed additional power plants. Pits at Palayamkottai and Vellar, and a third pit at the existing Neyveli mine, are to start operations in the early 2020s. Accordingly, lignite production is also projected to expand by 5 Mtce to 21 Mtce in 2023.
In addition to increased production from CIL, Singareni, captive plants and NLCIL, growth from commercial mining is also possible. However, the high optimism of February 2018 concerning the end of Coal India’s monopoly has since subsided (Box 3.4).
Box 3.4 The end of Coal India’s monopoly
In 1973, the Coal Mines Nationalization Act (CMNA) initiated a monopoly that lasted 45 years, until February 2018 when the Cabinet Committee on Economic Affairs (CCEA) approved the beginning of commercial mining by setting rules for auctioning commercial coal mines. In 1993, an amendment to the CMNA allowed private coal production, but only in captive blocks for specified uses (power, steel, cement and fertiliser production). With the February 2018 reform, private companies may develop new mines and sell coal in the free market without price or end-use restrictions; the government expects the increased competition to raise the sector’s efficiency as well as technological advancement. The framework approved by the CCEA includes forward auctions of new mines, with floor prices determined by the mine’s intrinsic value. The highest bid (in rupees per tonne) wins the block, and royalties are passed on to the state.
Of the coal CIL supplies to power plants, 80% is currently through long-term fuel supply agreements (FSAs), and the rest is through e-auctions. Given that FSA prices are much lower than those obtained through e-auctions, it is yet to be seen how prices and quality (and hence CIL) will be affected by the commercial mining.
A crucial point of the reform is the blocks to be auctioned, as their size, location and coal quality will determine their attractiveness to investors. The ten mines already identified for auctioning vary widely in these aspects: for example, whereas the Chhendipada block has reserves of over 1.2 Bt, Mednirai’s 80 Mt could discourage investors. There are also transportation issues concerning rake (coal car) allocations by Indian Railways.
© O
EC
D/IE
A, 2
018

MEDIUM-TERM DEMAND AND SUPPLY FORECAST
98 COAL 2018
The potential beneficiaries of the reforms are multiple: immediate ones are the 20 GW of coal-fired generation capacity without long-term FSAs with Coal India, but the end of the marketing monopoly will also give flexibility to the non-regulated sectors (steel, cement and other industries) that are very dependent on e-auctions and imports. Larger companies currently exploiting captive blocks will also have an opportunity to expand their businesses. Less clear is the impact on coking coal development, given that most blocks are of thermal grade.
All reforms face resistance, however. Trade unions opposed the decision, citing lack of consultation, foreign ownership of strategic resources, and the impact private operations would have on worker health, safety and the environment. The Indian National Trade Union Congress (INTUC), one of India’s largest unions, went to the Supreme Court in an attempt to block the decision, and four other major trade unions (Bharatiya Mazdoor Sangh [BMS]; All India Trade Union Congress [AITUC]; Hind Mazdoor Sabha [HMS]; and Centre of Indian Trade Unions [CITU]) organised strikes. State-owned companies (Coal India in particular) also claim that commercial mining may put stress on their operations and consequently affect company finances as well as the public budget. Even within the broader political environment, it is not clear how much support there is for privatisation.
In October 2018, the government announced that the companies allotted for the next blocks being auctioned up to January 2019 will be allowed to sell 25% of their production to the market at the prices set by Coal India. Given the amount of time required for block allocation, land acquisition, forest clearance approval, environmental permitting, financial closure and mine development, commercial production within the forecast period is highly uncertain.
Although mining expansion is necessary to increase actual supplies and reduce import dependency, it is only half of what is required. The other half involves transporting the coal from the mines to consumption centres, which has traditionally been as big a problem as production in India. Given that 60% of coal is transported by rail, and that coal therefore accounts for 45% of Indian Railways’ revenues, the level of coal freight charges determines the competitiveness of both the coal mining and the rail transport industries. For this reason, the coal industry has recently adopted the practice of developing more mines close to power plants to reduce the coal freight component of its costs, and the government has also made considerable progress in allocating coal linkages (i.e. buying coal from mines close to power plants to save money on transport/logistics). However, given the existence of cross-subsidies between coal and passengers freights, the social implications of further coal industry rationalisation could therefore put a brake on reforms.
Australia
Coal production in Australia is forecast to grow at a CAAGR of 0.7% to sustain progressive export expansion. Output reaches 438 Mtce in 2023, an 18-Mtce increase from 2017. Given that 80% of Australia’s production is for export, a more detailed analysis is provided in chapter 4 (and concrete projects under development are detailed in chapter 5). Met coal output rises 1.4% per year, from 185 Mtce in 2017 to 201 Mtce in 2023, but thermal coal grows more slowly, by 5 Mtce to 221 Mtce.
In contrast, lignite production, which adapts to power plant consumption, is forecast to drop by 3 Mtce to 17 Mtce as demand declines slightly but steadily from the country’s lignite-fired power stations, for which load factors are expected to fall as more renewables come online.
© O
EC
D/IE
A, 2
018

MEDIUM-TERM DEMAND AND SUPPLY FORECAST
COAL 2018 99
Indonesia
Following an initial rise, coal production in Indonesia declines to 365 Mtce over the outlook period, down 9 Mtce from 2017. Although the government had originally planned to cap production at 400 Mt (about 80 Mt less than current production), these plans were cancelled in light of prevailing high coal prices. Whereas domestic demand is set to increase substantially, declining seaborne coal prices will push coal exports down. Since March 2018, prices have been capped at USD 70/t (basis 6 322 kcal/kg gross as received [GAR]) for two years for domestic power plants, much below prevailing international prices. This could limit exports from many producers, so there have been discussions about replacing the price cap with a levy to help PLN (the government-owned electricity utility) because it must provide electricity at a fixed tariff irrespective of coal prices. In any case, Indonesian production will be determined by exports (see chapter 4 for more detail).
Met coal production remains stable at 2 Mtce per year over the outlook period.
Mongolia
Mongolian coal production is projected to decline from 43 Mtce in 2017 to 33 Mtce in 2023. Thermal coal output – 15 Mtce in 2017 – decreases to 11 Mtce in 2023, whereas lignite output remains stable. Met coal production falls 4% per year to 19 Mtce in 2023, 6 Mtce less than in 2017. Drops in met and thermal coal production result from reduced exports to China (Mongolia’s only major export destination), where thermal and met coal demand contract over the forecast period. Due to high trucking costs to the Chinese border, plus rail costs from there, China considers Mongolia a high-cost supplier, so its production is quite price-sensitive. If the market is tighter and prices are higher than expected as a result of either strong demand or constrained supply, Mongolian production will exceed the forecast.
North America
In North America, coal production is expected to decline 2.2% per year to 512 Mtce in 2023.
United States
US coal output decreases 2.1% per year, from 533 Mtce in 2017 to 469 Mtce in 2023, primarily owing to the ongoing decline in coal-fired power generation, which will continue to reduce domestic coal demand and precipitate additional mine closures. US coal exports are not expected to offset this effect.
Canada
Canada’s coal production falls from 43 Mtce to 35 Mtce at a CAAGR of 3.6% over the forecast period, also due largely to declining coal-fired power generation. Almost the entire production drop concerns thermal coal, which is projected to fall by 9 Mtce to only 7 Mtce in 2023. Lignite production also declines, but by only 1 Mtce to 3 Mtce in 2023.
Conversely, met coal output increases 1.8% per year, from 23 Mtce in 2017 to 25 Mtce in 2023 to support exports. In December 2017, Kameron Collieries ULC started exporting coking coal from the Donkin mine in Cape Breton, Nova Scotia, and production is expected to ramp up to the mine’s maximum permitted capacity of 2.75 Mtpa by 2021. Donkin has a 30-year lifespan and will be operated using continuous-miner units.
© O
EC
D/IE
A, 2
018

MEDIUM-TERM DEMAND AND SUPPLY FORECAST
100 COAL 2018
Central and South America
Coal production in Central and South America is expected to peak at 91 Mtce per year during the forecast period and then decline back to the 2017 level of 87 Mtce by 2023. Colombia continues to account for the majority of production, and output in the rest of the region remains stable.
Colombia
Coal output in Colombia is expected to decline to 80 Mtce in 2023 – 3 Mtce less than in 2017, resulting in thermal coal output of 76 Mtce in 2023 and met coal production of 4.5 Mtce. Colombia’s coal sector is plagued by underinvestment, and output has been largely flat in recent years. Drummond, currently the country’s largest producer, announced its intention to sell its Colombian assets, but no further progress has been reported. Therefore, given the quality of Colombia’s coal resources and global market conditions – and depending on the strategy of potential Drummond’s new owners and their willingness to invest – Colombian coal production could be higher than forecast.
Europe
In Europe, coal production is expected to decline marginally, from 220 Mtce in 2017 to 218 Mtce in 2023. Germany stops producing hard coal by the end of 2018, while lignite output is projected to fall from 53 Mtce to 46 Mtce. In Spain, subsidised high-cost coal mines will be shut down by the end of 2018 under the government’s mine closure plan, cutting production to 1 Mtce per year by 2023. Coal production from the last mines in the United Kingdom is projected to drop to less than 2 Mtce in 2023, and although new mines have been proposed, it is highly uncertain they will be developed. Coal production in the Czech Republic remains at a steady 22 Mtce per year until 2023, with thermal and met coal each accounting for 3 Mtce and lignite making up the rest. Lignite production is also projected to remain stable in Bulgaria (8 Mtce per year), Greece (7 Mtce per year) and Romania (7 Mtce per year). Coal production in Turkey increases from 22 Mtce in 2017 to 28 Mtce in 2023, largely due to commissioning of additional lignite-fired power plants and their associated mines; hard coal production remains at 2 Mtce per year. In October 2018, TTK (Turkey’s state-owned hard coal producer) and TKI (the state-owned lignite producer) transferred seven large coal fields to the private sector, with the target of producing 3 Mt of hard coal and 16 Mt of lignite per year. Therefore, if these mines are operational by 2023, production would exceed the forecast amounts.
Poland
Although total output is projected to decline slightly (from 71 Mtce to 68 Mtce), Poland remains Europe’s primary hard coal producer over the outlook period. Falling by 1 Mtce each, lignite production amounts to 40 Mtce and thermal coal to 16 Mtce in 2023. The slight decrease in thermal coal output reflects the challenges faced by Polish mining giant PGG, which is struggling to maintain its profitability and the operating performance of its mines.
At 12 Mtce per year, met coal output is projected to remain steady over the forecast period. Although investors have proposed additional capacity (Prairie Mining Limited is planning to reactivate the Dębieńsko coking coal mine in Upper Silesia and to start up the Jan Karski Mine, a new underground operation in the Lublin basin, and there is interest in opening Krupiński mine, formerly operated by JSW), these projects are not assumed to go into production within the forecast period.
© O
EC
D/IE
A, 2
018

MEDIUM-TERM DEMAND AND SUPPLY FORECAST
COAL 2018 101
Middle East
Middle Eastern coal output remains roughly stable at 1 Mtce per year, all of it from mines in Iran.
Eurasia Coal production in Eurasia is projected to increase 0.9% per year over the outlook period, from 406 Mtce to 429 Mtce.
Russia
In Russia, higher met coal production is anticipated, driven by rising exports and, to a lesser extent, by the steelmaking industry. At a CAAGR of 2.5%, output expands to 97 Mtce in 2023, up 13 Mtce from 2017.
Rising met coal output is also complemented by slightly higher thermal coal production, with exports more than offsetting demand decline. Thermal coal output increases slightly from 194 Mtce in 2017 to 200 Mtce in 2023, while lignite production remains flat at 35 Mtce per year.
Overall Russian coal production therefore increases slightly, from 314 Mtce in 2017 to 331 Mtce in 2023, highly dependent on exports (see chapter 4).
Africa
Coal production in Africa rises 1.9% per year over the forecast period, from 224 Mtce in 2017 to 251 Mtce in 2023, mostly owing to output growth in South Africa and Mozambique.
South Africa
South Africa’s coal output rises from 208 Mtce in 2017 to 225 Mtce in 2023 at a CAAGR of 1.3%. Thermal coal continues to dominate, with met coal output stable at 4 Mtce per year to the end of the forecast period. Coal output and mining capacity expand in response to rising export demand, with several new mining projects slated to come online during the outlook period. This said with one caveat: the lack of investment in the coal mining for some few years could result in a higher than expected decline in the output of existing mines.
It should be also noted that the possible ratification of a new mining charter – a final version of which is to be published at the end of 2018 (Bloomberg, 2018) – introduces significant forecast uncertainty. The current draft of the charter imposes considerable requirements on mining companies (Box 3.5), and according to the mining industry, the charter’s uncertainty and its obligations for mining ventures are already deterring investment in South Africa’s mining sector. Significantly stricter requirements could deter mining companies, in particular major international players, from doing business in the country, reducing the potential for coal output growth over the forecast period.
Box 3.5 South Africa’s 2018 Draft Mining Charter
South Africa’s mining laws are embodied in a mining charter, last updated in 2010. Although the government has been attempting to update laws on mining and petroleum extraction for several years, the proposals have been contentious and a succession of drafts has been circulated without any obtaining parliamentary approval. In 2017, the government published a particularly controversial draft charter that met with strong mining industry opposition, so in June 2018 the new South African Mineral Resources Minister Gwede Mantashe released a revised proposal for comment: the Draft Broad-Based
© O
EC
D/IE
A, 2
018

MEDIUM-TERM DEMAND AND SUPPLY FORECAST
102 COAL 2018
Black Economic Empowerment Charter for the South African Mining and Minerals Industry 2018 – also called the 2018 Draft Mining Charter (Golegal, 2018).
The charter’s key objective is to promote Broad-Based Black Economic Empowerment (B-BBEE) in the mining industry. B-BBEE is a form of affirmative action introduced in 2003 to enhance the participation of historically disadvantaged South Africans (HDSAs) – Black Africans, Indians and Coloureds – in the economy. The charter seeks to accomplish this by raising minimum HDSA shareholding requirements for companies that prospect for or exploit mineral resources such as coal. In many ways, the 2018 Draft Mining Charter is less far-reaching than that of 2017. For example, the 2017 Draft Mining Charter stipulated that exploration licences could be held only by HDSA majority-owned companies, a requirement that was dropped from the latest version. Similarly, the 2017 draft obligated companies with less than 30% B-BBEE shareholding to “top up” to at least 30% within 12 months of the Charter becoming law; in the 2018 draft, this has been extended to five years. In addition, the nature of the top-up is left open: there is no restriction as to its commercial form, type of beneficiary (e.g. HDSA communities, entrepreneurs or company employees) or level of implementation (e.g. at the holding level as opposed to the unit or asset level). Crucially, the government has affirmed that it recognises the “once empowered, always empowered” principle, which means that past B-BBEE transactions count towards the empowerment status of a company even if the HDSA shareholder has since sold its stake to a non-HDSA shareholder.
Under the 2010 Mining Charter currently in force, the B-BBEE shareholding requirement is 26%, which means that 26% of a mining venture must be owned by HDSA shareholders. The 2018 Draft Mining Charter stipulates that new mining licences will be granted only to applications that fulfil this requirement, with the obligation to top up to 30% within five years (Table 3.7).
Table 3.7 Key differences between the 2010 Mining Charter and the 2018 draft
2010 Mining Charter 2018 Draft Mining Charter
Minimum shares held by HDSAs 26% 30%, (five-year transition period to go from 26% to 30%)
Board representation at least 40% HDSAs at least 50% HDSAs and 20% female
Mandatory local community stake no requirements 8%, free-carry and non-transferable, to receive 1% of core earnings if no dividend
Mandatory employee stake no requirements 8%, free-carry and non-transferable, to receive 1% of core earnings if no dividend
B-BBEE sourcing requirements 70% of services and 40% of goods to be procured from B-BBEE entities
80% of services and 70% of goods to be procured from B-BBEE entities
Furthermore, almost half of that share (14%) must be progressively vested to a B-BBEE-designated entrepreneur over the term of the mining rights (typically 30 years). A B-BBEE entrepreneur is an entity in which HDSAs hold a controlling stake (51%). Should the B-BBEE entrepreneur choose to divest itself of its shares after the vesting period, 40% of the sale proceeds must be reinvested in the mining industry. The aim of this requirement is to encourage long-term investment by B-BBEE investors. Furthermore, the 2018 Draft Mining Charter specifies that 8% of shares must be held by the company’s employees and another 8% by local communities. The employees’ stake is supposed to be non-transferable and, controversially, these equity stakes should be “free carry”, i.e. allotted free of charge to the respective communities. In addition, licence holders would be required to pay employees and local communities
© O
EC
D/IE
A, 2
018

MEDIUM-TERM DEMAND AND SUPPLY FORECAST
COAL 2018 103
1% of their core earnings in years in which they do not declare a regular dividend. Moreover, the charter stipulates that at least 50% of the board members must be HDSAs and at least 20% female.
More significant restrictions on the procurement of goods and services are also imposed, as the draft charter states that 80% of the services and 70% of the goods a mining venture requires must be procured from B-BBEE entities. Compared with existing rules, this is a 10-percentage-point increase in B-BBE sourcing requirements for services, and a 30-percentage-point increase for goods. However, the 2018 draft would also allow small-scale miners to appeal to the Ministry of Natural Resources for exemptions from certain provisions on a case-by-case basis.
An official update to the 2018 Draft Mining Charter is scheduled for release at the end of 2018, and there are indications that there may be further easing of some of the more contested provisions because the government is concerned about a detrimental investment impact. The cabinet approved changes to the draft in September 2018, reducing by 5% the stakes that holders of new mining rights need to give to employees and communities. Alternatively, licence holders could directly fund projects in local communities, provided that the funding is equivalent to 5% of the company’s value. The provision that 1% of core earnings must be payed to employees and communities in years in which no dividends are declared was also dropped (Bloomberg, 2018).
Mozambique
Coal production in Mozambique continues to expand by another 7 Mtce to 17 Mtce over the forecast period, corresponding to a CAAGR of 8.8%. Thermal coal production remains stable at 4 Mtce per year, while met coal output continues to increase from 7 Mtce in 2017 to 13 Mtce in 2023. The Nacala Logistics Corridor (NLC), which consists of a railway line and port, is expected to be able to handle up to 18 Mtpa of coal exports from 2019 onwards, thereby supporting projected output growth.
References Bloomberg (2018), “South Africa eases free-carry rules in final mining charter”, 20 September 2018, www.bloomberg.com/news/articles/2018-09-20/south-africa-eases-free-carry-rules-in-final-mining-charter (accessed 24 September 2018).
Bundesnetzagentur (2018), “Power plant closure notifications”, www.bundesnetzagentur.de/EN/Areas/Energy/Companies/SecurityOfSupply/GeneratingCapacity/List_of_closure_notifications/List_of_closure_notifications_node.html (accessed 2 August 2018).
BMU (Germany’s Federal Ministry for the Environment, Nature Conservation and Nuclear Safety) (2018), “Commission on Growth, Structural Change and Employment takes up work”, 6 June 2018, www.bmu.de/en/report/kommission-wachstum-strukturwandel-und-beschaeftigung-nimmt-arbeit-auf/.
CRU (2018), Thermal Coal Cost Model (database), CRU Group, London, www.crugroup.com.
Golegal (2018), “The Draft 2018 Mining Charter”, 22 June 2018, www.golegal.co.za/draft-mining-charter-2018/ (accessed 24 September 2018).
© O
EC
D/IE
A, 2
018

MEDIUM-TERM DEMAND AND SUPPLY FORECAST
104 COAL 2018
DOC (US Department of Commerce) (2018), “Steel exports report: Russia”, Global Steel Trade Monitor, March 2018, DOC International Trade Administration, Washington, DC, www.trade.gov/steel/countries/pdfs/2017/annual/exports-russia.pdf.
IEA (International Energy Agency) (2018a), Oil 2018: Analysis and Forecasts to 2023, OECD/IEA, Paris.
IEA (2018b), Gas 2018: Analysis and Forecasts to 2023, OECD/IEA, Paris.
IEA (2018c), Electricity Information (database), www.iea.org/statistics.
IEA (2017), Coal 2017: Analysis and Forecasts to 2022, OECD/IEA, Paris.
IEA (2016), Medium-Term Coal Market Report 2016: Market Analysis and Forecasts to 2021, OECD/IEA, Paris.
IMF (International Monetary Fund) (2018), World Economic Outlook, April 2018, IMF, Washington, DC, www.imf.org/en/publications/.
MOTIE (Ministry of Trade, Industry and Energy) (2017), 8th Basic Plan for Long-Term Electricity Supply and Demand (2017-2031), Government of Korea.
National Bureau of Statistics (2018), National Data, http://data.stats.gov.cn/english/.
NDRC (National Development and Reform Commission) (2017), Circular on the publication of the Clean winter heating plan for Northern China (2017-2021), NDRC Energy [2017] No. 2100NDRC, Beijing.
NDRC (National Development and Reform Commission) (2017), “Circular on the publication of the clean winter heating plan for Northern China (2017-2021)”, https://chinaenergyportal.org/en/clean-winter-heating-plan-for-northern-china-2017-2021/.
World Steel Association (2018), Statistics, www.worldsteel.org/steel-by-topic/statistics.html.
© O
EC
D/IE
A, 2
018

MEDIUM-TERM INTERNATIONAL COAL TRADE FORECAST
COAL 2018 105
4. MEDIUM-TERM INTERNATIONAL COAL TRADE FORECAST
Highlights • Global seaborne thermal coal trade by 2023 will be similar to 2017. After rising in 2017 and
2018, it is projected to decline to 782 million tonnes of coal equivalent (Mtce) in 2023 (3 Mtce more than in 2017). In physical volume, seaborne global trade remains around 1 Bt in 2018 and 2019, and falls slightly thereafter.
• The global metallurgical (met) coal market continues to expand over the forecast period by 1.7% annually, mainly owing to growth in India and, to a lesser extent, Korea and the People’s Republic of China (“China”). A slight decline is expected in Europe and Japan.
• China’s thermal coal imports drop considerably at an average annual rate of 5%, from 144 Mtce in 2017 to 106 Mtce in 2023. China’s import forecast is fraught with uncertainty, however, due to demand fluctuations and policy changes that affect the relative competitiveness of domestic and imported coal and may significantly impact import volumes.
• India’s thermal coal imports expand 2.2% per year, from 119 Mtce in 2017 to 135 Mtce in 2023, because domestic supplies are unable to keep pace with demand growth. Met coal imports increase even more quickly (at a 7.2% compound average annual growth rate [CAAGR]) to 74 Mtce in 2023 to meet rising steel industry demand.
• Thermal coal imports grow considerably in developing Asia (primarily in some of the Southeast Asian countries, Bangladesh and Pakistan), rising at a CAAGR of 8.5% from 86 Mtce in 2017 to 140 Mtce in 2023 to fuel expanding coal-fired power generation.
• Europe’s coal imports continue to shrink, while Japan’s and Korea’s are more stable. Thermal coal imports into Europe drop from 115 Mtce in 2017 to 87 Mtce in 2023. In Japan, both thermal and met coal imports decline slowly, and in Korea thermal coal imports remain broadly stable while met coal imports rise 2% per year with continued steel output growth.
• Indonesia’s thermal coal exports fall 2.1% annually to 273 Mtce in 2023. At the same time as lower seaborne prices force some high-cost production out of the market, domestic demand rises, leaving less volume for export. Nevertheless, Indonesia remains the world’s largest thermal coal exporter.
• Australian met coal exports increase at a 2.4% CAAGR to 198 Mtce in 2023, but thermal coal exports rise only marginally, from 176 Mtce in 2017 to 181 Mtce in 2023.
Methodology and assumptions This section offers international thermal and met coal trade forecasts through 2023. Flows between importing and exporting countries/regions have been assessed using the Reinforced Model for Coal
© O
EC
D/IE
A, 2
018

MEDIUM-TERM INTERNATIONAL COAL TRADE FORECAST
106 COAL 2018
Flow Analysis (RMCFA), a spatial optimisation model developed at the International Energy Agency (IEA) that is used for both thermal and met coal. The model has two modules: the first is an optimisation model that computes cost-minimal allocation among production, consumption, exports and imports, subject to mining and infrastructure capacity constraints. The model establishes some exporting or importing nodes, which group different countries together. According to economic theory, the outcome reflects trade flows in a well-integrated and competitive market, an assumption justified by the rather low market concentration in international seaborne coal trade. However, coal is not a uniform commodity: quality is highly variable, and the existence of market concentrations for specific qualities is debatable. Therefore, the second module is a tool that allows coal volumes to be allocated from “exporting nodes” to “importing nodes”, taking quality requirements into account. Outputs from both modules were analysed and compared to produce the actual forecasts.
For most countries, import demand is an input. In other cases, however, optimisation of domestic and overseas supplies causes imports to become the model’s output. The simulation model covers major coal mining regions and demand hubs, and incorporates detailed datasets for mining and transport costs as well as port, railway and mine capacities. Detailed mine and infrastructure capacity expansions are factored in, as are variations in coal quality by type (thermal or met) and energy content. Mining cost developments are estimated based on assumed price evolution of inputs such as diesel fuel, steel products and labour. Due to input price escalation and deteriorating geological conditions, productivity gains are assumed to be lower than rising infrastructure and mining costs (with some adjustments, cost assumptions were based on the CRU Coal Cost Model). Main policies concerning coal, such as export quotas, taxes and royalties, are assumed to be constant throughout the outlook period unless changes have been firmly committed.
Regarding freight rates, although additions to total dry bulk carrier capacity are becoming smaller each year, transport overcapacity in the dry bulk shipping market persists, so rates are not expected to rise to the high levels they were before the 2008 financial crisis. The International Maritime Organisation (IMO) sulphur cap regulation on marine fuel oil will impact freight rates, but the effect is uncertain because many decisions on retrofitting and fuel switching have yet to be made.
Box 4.1 The 1-billion-tonne market?
Coal 2018 forecasts (and those of previous reports in this series) employ the measure “tce” (tonne of coal equivalent),1 which is a unit of energy (7 million kilocalories [kcal]) rather than mass. Using this unit allows different supplies and demands (including imports and exports) to be compared in a more uniform way than if a unit of mass were used. In contrast, historical consumption is expressed in tonnes (t) to be consistent with what most stakeholders use. The conversion of tce to t is straightforward if the calorific value of the coal is known (net calorific value is usually used, as it is more representative in most applications). For example, 1 t of 3 500-kcal-per-kilogramme (/kg) calorific value coal is 0.5 tce. Therefore, when imports from year to year are being compared, if the calorific value mix of the coal changes, the relationship between t and tce also changes. For example, coal export growth from 2017 to 2018 was mostly in low-calorific-value Indonesian coal, so the mass (Mt) of the exports increased more substantially than their energy value (Mtce). The stronger growth of mass relative to energy means the effect of expanding seaborne thermal coal trading is amplified, which firmly establishes coal as the second-largest seaborne-traded bulk commodity by mass (after iron ore) and puts thermal coal at the threshold of breaking the 1-Bt mark (Figure 4.1).
1 In some countries, tce is “tonne of standard coal”.
© O
EC
D/IE
A, 2
018

MEDIUM-TERM INTERNATIONAL COAL TRADE FORECAST
COAL 2018 107
Figure 4.1 Changes in global seaborne thermal coal imports, 2017 to 2018 (Mt)
*Japan, Korea and Chinese Taipei.
Source: Adapted from IHS Markit (2018), Coal McCloskey Price and Statistical Data, https://connect.ihs.com/industry/coal.
Following export growth in 2017 and 2018, seaborne thermal coal volumes decline slowly, assuming that Chinese and Korean imports begin to contract (although these assumptions are far from certain). In the case of Korea, the government is clearly willing to scale back coal-fired power generation to reduce air pollution and the country’s carbon footprint (see Box 4.2). Regarding China, however, its import volatility – unique in the energy market – has persisted for several years. Although this volatility was not unexpected (it was already mentioned in the Medium-Term Coal Market Report 2013), the scale of the fluctuations has been remarkable. The potential for China’s imports to rise or fall significantly in a period of only a few months makes it necessary to exercise caution in drawing up forecasts. The amazing pace of restructuring in China (i.e. closure of 5 million tonnes per annum [Mtpa] of inefficient coal capacity every week for the past two years2) has underpinned import growth, and it is questionable whether commissioning of efficient mines can occur at similar pace.
Seaborne coal trade forecast, 2018-23 Total seaborne coal trade is forecast to expand 0.6% per year, from 1 037 Mtce in 2017 to 1 067 Mtce in 2023. Although seaborne thermal coal trade initially increases from 779 Mtce in 2017, it falls thereafter to 782 Mtce in 2023 (Figure 4.2). Conversely, seaborne met coal trade grows 1.8% per year from 258 Mtce in 2017 to 285 Mtce in 2023.
Seaborne thermal coal trade forecast
Seaborne thermal coal trade is projected to expand marginally from 779 Mtce to 782 Mtce in 2023. The decline after 2019 offsets the increases in 2018-19. The forecast comes with big uncertainty. This is not new, as it is something that former reports have repeated since 2013 in relation to Chinese imports. Now, imports to India and Korea are subject to a big uncertainty depending on policies. Price-sensitive exporters, like Indonesia and United States are most affected by potential import swings.
2 This figure includes coking coal capacity.
900
920
940
960
980
1 000
1 020
Imports 2017 Europe JKT* China India Others Imports 2018
Mt
© O
EC
D/IE
A, 2
018

MEDIUM-TERM INTERNATIONAL COAL TRADE FORECAST
108 COAL 2018
Figure 4.2 Projected seaborne exports of thermal coal (left) and met coal (right)
*Estimated.
Importers
As noted above, global seaborne thermal coal trade is projected to continue expanding in the near term and then slowly decline through 2023. Strong import growth by developing Asian countries (primarily India, Pakistan, Malaysia, Viet Nam and the Philippines) is insufficient to offset substantially lower imports by China and Europe (Figure 4.3).
Figure 4.3 Projected seaborne thermal coal imports
*Estimated.
Note: CAAGR = compound average annual growth rate.
As usual, Chinese thermal coal import forecasts are fraught with uncertainty. Short-term fluctuations in electricity demand and hydropower output can significantly affect yearly thermal coal demand (see Box 3.1) and therefore imports, as can policies affecting the coal supply and other regulatory decisions such as enhanced trace element checks, import quotas and shipping caps at the Bohai Rim ports. Policies to address air pollution and replace coal for heating can also have considerable short-
0 100 200 300 400 500 600 700 800 900
2016 2017* 2019 2021 2022 2023
Mtce
Thermal coal
0 50
100 150 200 250 300 350 400
2016 2017* 2019 2021 2023
Mtce
Met coal
0 100 200 300 400 500 600 700 800 900
2016 2017* 2019 2021 2023
Mtce
Europe Japan Korea China India Other developing Asia (incl. ASEAN) Other
-10%
-5%
0%
5%
10%
- 60
- 40
- 20
0
20
40
60
2011-17 2017-23
Mtce
CAAGR (right axis)
© O
EC
D/IE
A, 2
018

MEDIUM-TERM INTERNATIONAL COAL TRADE FORECAST
COAL 2018 109
term impacts on demand, as testified by events in 2017 (see chapter 1). Given the volatility of Chinese imports, it is difficult to envisage a clear trend for the future. However, based on current demand trends, including a shift in production to north-western China (supported by construction of ultra-high-voltage [UHV] transmission lines), mining capacity to come online and infrastructure improvements foreseen for the projection period, China’s thermal coal imports are forecast to fall substantially, offsetting the strong growth of 2017 and 2018. China’s imports, currently the largest in the world, are projected to fall from 144 Mtce in 2017 to 106 Mtce in 2023. This implies that the commissioning of new, efficient mining capacity is successful.
Conversely, India’s thermal coal imports are forecast to expand from 119 Mtce in 2017 to 135 Mtce in 2023 at a CAAGR of 2.2%. Although this year’s demand outlook is similar to last year’s, the current forecast is for import growth, whereas decline was forecast in 2017. The reason for this is that the production increase modelled last year will be very challenging for India to meet, requiring not only significant investment and productivity gains, but quicker progress in land acquisition and forest clearance as well as more efficient coal transport (see chapter 3). Although progress was favourable in 2018 in new mine investments and allocation of coal linkages, it did not meet last year’s modelling expectations. This year’s approach to production growth and thermal coal imports is therefore more cautious, although the forecast is still quite uncertain. Developments in coal mining and transportation will thus be monitored, as will the financial health of India’s utilities, to adjust the forecast for next year’s report. The beginning of commercial mining could be also important, but substantial production is not expected before 2023 (see Box 3.4).
Japan’s thermal coal imports contract slightly over the forecast period (by 1% per year), from 117 Mtce in 2017 to 111 Mtce in 2023, largely due to a slow decline in coal-fired electricity generation. While Australia is expected to remain its main supplier since Japan’s high-efficiency power plants rely on Australian coal for quality and consistency reasons, liberalisation of the power market is expected to force Japanese utilities to diversify providers in quest of the most affordable coal.
Thermal coal imports into Korea are projected to peak at 96 Mtce in 2020 and then decline to 91 Mtce by 2023 as the share of coal-fired power generation declines. However, new regulations passed by the Korean government (such as a coal tax hike and local authorities having the ability to curtail coal-fired power generation when air pollution standards are exceeded) introduce considerable forecast uncertainty (Box 4.2).
Box 4.2 Korea accelerates its energy transition
A new government was inaugurated in Korea in 2017. Moon Jae-in, the new president, pledged an energy transition by increasing renewables and natural gas as well as phasing out nuclear and reducing coal consumption in the power sector. This commitment was designed to address concerns over deteriorating air quality as well as nuclear safety following an earthquake near certain nuclear plants. Korea’s energy transition plan signals a major change in a country where over 70% of total electricity was produced by coal-fired and nuclear power plants in 2017 (Figure 4.4).
Of the various measures the government has been undertaking to implement these commitments, one of the first was its 8th Basic Plan for Long-term Electricity Supply and Demand, issued not long after the new government’s policies were announced. Under this plan, six power plants equivalent to 2.1 gigawatts (GW) of capacity, originally to be fuelled by coal, are to be natural gas-fired instead. Other coal-fired plants already under construction are to be completed, however, but the plan also contains measures to expand the share of renewables-based generation to 20% of the power mix by 2030. The installed capacity of coal-fired generation is expected to rise 12.3% under the plan, to 41.5 GW in 2023.
© O
EC
D/IE
A, 2
018

MEDIUM-TERM INTERNATIONAL COAL TRADE FORECAST
110 COAL 2018
Figure 4.4 Power generation in Korea, 1990-2017
Note: Other includes biofuels, wastes and heat from chemical sources.
Source: IEA (2018), World Energy Statistics 2018, www.iea.org/statistics/.
While coal-based generating capacity is expected to increase in the medium term, its operations will be affected by new emissions regulations. The government has prohibited older coal-fired power plants from operating in the spring, when air quality is poor. In 2017, eight old coal-fired plants (2.8 GW of capacity) were forced to shut down, and five of them were stopped again in 2018 (the impact of the stoppages on annual coal-based generation has been small, however). The government tried new limits on coal-fired plants from October to December 2018, when fine particulate matter (PM) concentrations exceed 50 microgrammes per cubic metre (µg/m3). Under the new regulation, a coal power plant’s output can be restricted to less than 80% when requested by the mayor of the region in which the coal power plant is located.
In addition, the government implemented a major tax reform in July 2018 that raises the tax burden on coal by USD 9/t, while that of natural gas is reduced by USD 60/t (Table 4.1).The reform takes effect in April 2019.
Table 4.1 Tax scheme for coal and gas in Korea
Case Fuel Levy on import (USD/t)
Individual consumption tax (USD/t)
Total tax (USD/MBtu)
Before 2018 Thermal coal Natural gas
0 21.04
31.30 52.17
1.31 1.42
After 2019 Thermal coal Natural gas
0 3.30
40.00 10.43
1.68 0.27
Notes: MBtu = million British thermal units. Exchange rate: USD 1 = KRW 1 150. Taxes are set per tonne, so total tax is an approximate calculation based on a calorific value of 6 000 kcal/kg for coal and 10 500 kcal per normal cubic metre (/Nm3) for natural gas.
Source: MOEF (2018), “Tax Revision Bill 2018”, http://english.moef.go.kr/popup/180806/popup20180806.html.
As the tax reform will reduce the price gap between coal and gas, the average power generation fuel cost gap will fall USD 10.9 per megawatt hour (/MWh) in 2019 from 2018 (Figure 4.5). While the power generation cost gap between gas and coal fell to a historical low in 2017, the tax reform will close the gap even further. Depending on plant efficiency, fuel costs may be lower for some gas-fired power generation than for less-efficient coal-fuelled plants; the average price gap does, however, continue to favour coal.
0
100
200
300
400
500
600
1990 1993 1996 1999 2002 2005 2008 2011 2014 2017
TWhOther
Renewables
Nuclear
Oil
Gas
Coal
© O
EC
D/IE
A, 2
018

MEDIUM-TERM INTERNATIONAL COAL TRADE FORECAST
COAL 2018 111
Figure 4.5 Coal and gas power generation cost comparison in Korea
Notes: The only cost considered is fuel cost. Generation cost ranges reflect generation efficiency.
The final measure that has been proposed is “environmental dispatch”, whereby power plant dispatch decisions must take into account the environmental costs of each plant’s emissions. Although proposed in the electricity plan, this measure has not been implemented. Electricity prices are a sensitive issue across the world, but in Korea, manufacturing-based industries are particularly sensitive to higher energy costs.
A new energy master plan to be proposed in 2019 may lead to further changes.
Developing Asia’s thermal coal imports rise substantially over the forecast period, mainly into the various countries where coal-fired power generation is expanding: Viet Nam, the Philippines, Malaysia, Pakistan and Bangladesh (see Box 4.3). At a high CAAGR of 8.5%, imports climb from 86 Mtce in 2017 to 140 Mtce in 2023, surpassing those to Europe.
Thermal coal imports into Europe continue to fall over the outlook period, largely because of the ongoing decline in hard coal-fired power generation in Western Europe. As a result, shipments into the Amsterdam-Rotterdam-Antwerp (ARA) hub, which chiefly serves the countries of north-western Europe, are projected to decline more strongly than those to coal terminals in the Mediterranean, where Turkey in particular is expected to continue ramping up its imports of thermal coal while Spain and Italy import less. European thermal coal imports overall decline by an average 4.5% per year over the forecast period, dropping from 115 Mtce in 2017 to 87 Mtce in 2023.
Box 4.3 Bangladesh boosting coal power
In Bangladesh, a country of over 160 million people, annual power consumption of less than 500 kilowatt hours (kWh) per capita – compared with over 9 000 kWh per person in Organisation for Economic Co-operation and Development (OECD) countries – as well as strong economic growth (over 7% in 2016 and 2017), mean that potential for higher electricity use in upcoming years is great. Despite being crossed by two of the largest rivers in the world (the Ganges and the Brahmaputra), hydropower production is quite limited, so natural gas and oil (to a lesser extent) have been the cornerstones of electricity production (over 95%). The 525-megawatt (MW) Barapukuria coal-fired power plant, consuming coal from the adjacent Barapukuria coal mine, is currently the country’s only operational
30
40
50
60
70
80
90
100
Before 2018 After 2019
USD/MWh
Gas
Coal
Average gap
© O
EC
D/IE
A, 2
018

MEDIUM-TERM INTERNATIONAL COAL TRADE FORECAST
112 COAL 2018
coal plant. However, the government’s policy is to reduce gas and oil use in the power sector and increase coal-based generation, mainly from imported coal. Planned capacity is immense, but developments have been delayed for several reasons: difficulties finding financing; planning deficiencies; land acquisition issues; scarcity of skilled labour; and lack of experience in developing such large, complex projects. Furthermore, public opposition to these projects is strong. Unsurprisingly, given the country’s low per capita income and negligible contribution to global carbon dioxide (CO2) emissions, concern about the country’s carbon footprint is not the cause of public opposition, but rather population displacement, local air pollution and reduced biodiversity are the points of contention. (The Rampal plant and its potential impact on the Sundarbans is the best example of this.)
Of more than 20 projects accounting for almost 30 GW of coal-fired capacity with different ownership structures and in different stages of development, almost one-third are being developed by the public sector. Around half are developed by various joint ventures owned 50-50 by a domestic public utility and a foreign company, and the last share of less than one-third consists of private sector independent power producer (IPP) projects. Of this group of projects, all but six are very unlikely to be developed within the forecast period (Map 4.1).
Map 4.1 Coal-fired power plants under development in Bangladesh
© O
EC
D/IE
A, 2
018

MEDIUM-TERM INTERNATIONAL COAL TRADE FORECAST
COAL 2018 113
The 1.2-GW ultra-supercritical (USC) plant on Matarbari Island, owned by state-owned Coal Power Generation Co. Bangladesh Ltd and built by a consortium comprising Japan’s Sumitomo Corp., IHI Corp. and Toshiba Corp., and Korea’s Posco Engineering & Construction Co., is expected to be online by 2022. The supercritical 1 320-MW Maitree Power Plant in Rampal, a joint venture development by Bangladesh Power Development Board (BPDB) and India’s NTPC, is also expected by 2022. State-owned North-West Power Generation Company Ltd and China’s CMC formed a joint venture to build and exploit the 1 320-MW Payra Coal Power Plant in Patuakhali, which should be running by 2020, and another BPDB joint venture (this time with China Huadian Hong Kong Co., Inc.) to build a supercritical 1 320-MW power plant in Moheshkhali is to be commissioned by 2022. One other joint venture, between the Rural Power Company and Norinco International (the USC 1 320-MW Dhankhali power plant in Patuakhali), could also go ahead within the forecast period.
This means that 25 terawatt hours (TWh) of coal-fired power generation is expected by 2023, compared with only 1 TWh in 2016. The additional generation is to be fuelled entirely by imported coal, as the 2 000-MW Pulbhari project, designed to use local coal, still has some issues to resolve (particularly public opposition) before it can proceed. Bangladesh could provide an informative case study of a country launching a large supercritical coal-fired fleet despite having only limited experience, and only in subcritical technology.
However, given the delays associated with these types of projects, public opposition and financing issues, this forecast will have to be updated in the near future. It could also be that the projects progress more rapidly than expected and the forecast will need be revised upward.
Exporters
Being a relatively high-cost producer, Indonesia’s coal export volumes are strongly determined by coal prices. As indicated by the forward curve presented in chapter 2, seaborne thermal coal prices are assumed to soften over the outlook period, largely because China, Indonesia’s largest customer, is expected to reduce its import demand by more than 37 Mtce by 2023. As seaborne coal prices fall, Indonesia’s export-oriented production is expected to decrease as shown in Figure 4.6.
Figure 4.6 Projected seaborne thermal coal exports
*Estimated.
0 100 200 300 400 500 600 700 800 900
2016 2017* 2019 2021 2023
Mtce
Australia South Africa Indonesia Russia Colombia United States Other
-10%-8%-5%-3%0%3%5%8%10%
- 60
- 40
- 20
0
20
40
60
2011-17 2017-23
Mtce
CAAGR (right axis)
© O
EC
D/IE
A, 2
018

MEDIUM-TERM INTERNATIONAL COAL TRADE FORECAST
114 COAL 2018
In Figure 4.7, costs are standardised at 6 000 kcal/kg,3 and although this is a simplification for all producers, it is particularly significant for Indonesia because its low-calorific-value coal is sold at an important discount to the Newcastle 6 000 benchmark.
Furthermore, Indonesia’s domestic thermal coal demand is projected to increase over the forecast period, driven by a strong increase in coal-fired power generation, making less coal available for overseas markets. The combination of these two factors leads to a decline in Indonesian thermal coal exports from 310 Mtce in 2017 to 273 Mtce in 2023 at an average annual rate of 2.1%.
Figure 4.7 Indonesian thermal coal supply curve (FOB), 2018 and 2023
Notes: FOB = free on board. Costs converted to 6 000 kcal/kg-equivalent, taking into account differences in value.
Sources: Adapted from CRU (2018), Thermal Coal Cost Model; IHS Markit (2018), Coal McCloskey Price and Statistical Data, https://connect.ihs.com/industry/coal.
Indonesian coal exporters also face other regulations that may ultimately affect their competitiveness. Not only do they have to use letters of credit issued by local banks and convert half of their profits to rupiahs, they must also use Indonesian flagged ships and local insurance (although the flag regulation has been delayed for two years). The domestic market obligation (DMO), which obligates Indonesian producers to sell at least 25% of their production into the domestic market at a price no greater than USD 70/t (6 322 kcal/kg gross as received [GAR]) could also constrain exports, although it has been in place for years without a significant impact. The HBA coal price reference, which tracks high-calorific-value coal, is not perceived by low-calorific-value producers to be the ideal benchmark for them, especially at times when the price gap between low- and high-calorific-value coal widens, although the HPB price, derived from the HBA, offers a discount to coal with a calorific value below 4 200 GAR.
Some government measures have had a positive effect for coal producers, however. It has definitively scrapped the 400-Mt production cap planned for 2019 and has indicated it is willing to relax the DMO if more demand for exports exists. Overall, however, it is likely that Indonesian exports will continue to be price-sensitive, and imports by China, India and Korea will therefore remain more important than domestic policies in determining actual exports.
3 As mentioned in chapter 2, although market segmentation by quality is increasing and trade in low-calorific-value coal is expanding considerably, the main reference in seaborne trade is still 6 000-kcal/kg coal.
Newcastle FOB (July 2018)
Newcastle FOB (2023 projection)
0
20
40
60
80
100
120
140
0 50 100 150 200 250 300 350 400 450
USD/t
Mt
20182023
© O
EC
D/IE
A, 2
018

MEDIUM-TERM INTERNATIONAL COAL TRADE FORECAST
COAL 2018 115
Australia’s thermal coal exports are projected to increase to 181 Mtce in 2023, 6 Mtce higher than in 2017. Existing coal-loading capacity is extensive enough to support further growth in both thermal and met coal exports, such that even Abbot Point port can absorb the first phase of Carmichael production without any expansion (Map 4.2). (Regarding Carmichael – the project was proposed as a 60-mtpa mine but has been scaled down substantially to 10 mtpa.) To enable larger coal exports, stage one of the Hunter Valley Corridor Capacity Strategy in New South Wales is expected to further enlarge throughput capacity during the outlook period.
Map 4.2 Coal basins and coal export capacity in Australia
After several years of production growth and confident of its considerable base of low-cost reserves, the Russian Federation’s (“Russia”) government aims to expand coal exports. To do so, the country is upgrading its transportation links to boost shipments, particularly to customers in the Asia Pacific region (see chapter 5). As a result, further growth in Russian coal exports is expected, with those for seaborne thermal coal expanding at a CAAGR of 2.2% from 113 Mtce in 2017 to 128 Mtce in 2023.
Conversely, thermal coal exports from Colombia decline 0.9% per year on average, from 76 Mtce in 2017 to 72 Mtce in 2023. As described in chapter 3, export decline results largely from lower production due to underinvestment in Colombia’s coal sector. A potential sale of Drummond could alter this trend.
South Africa is expected to expand its thermal coal exports 2.5% per year, from 67 Mtce in 2017 to 77 Mtce in 2023. However, uncertainty surrounding the lack of investment in the recent years and the new mining charter makes this outlook uncertain (see chapter 3). Any production decrease would likely affect exports first, as Eskom and the domestic industrial sector would have priority.
© O
EC
D/IE
A, 2
018

MEDIUM-TERM INTERNATIONAL COAL TRADE FORECAST
116 COAL 2018
Thermal coal exports from the United States increase 2.2% per year to 29 Mtce in 2023, up 4 Mtce from 2017. US producers act as swing suppliers to the seaborne market, with export volumes determined by prices. Although it therefore appears illogical that lower prices through 2023 would correspond with higher US exports, the increase results from dropping US domestic demand that leaves some spare production. It also helps that the United States has enough available transport infrastructure (rail capacity, barges and East Coast ports) to fill the gap left in the global market by declining Indonesian export volumes.
Seaborne met coal trade forecast
Seaborne met coal trade is projected to expand from 258 Mtce in 2017 to 285 Mtce in 2023 at a CAAGR of 1.7%. On the supply side, the market is highly concentrated, with Australia alone accounting for approximately 70% of the supply, a position it is expected to maintain over the outlook period. The United States, Canada and Russia are currently the three other main suppliers, and together with Australia they account for 95% of the supply. The dominance of Australia (Queensland especially, where most of the coking coal comes from) makes the market very sensitive to disruptions there, such as those associated with Cyclone Debbie in April 2017 that led to a significant price spike. Mozambique entered the market in recent years, and with improved infrastructure is poised to increase its exports steadily over the forecast period. On the demand side, met coal imports into China, Europe and Japan are projected to decline while they increase in India, which is expected to continue driving market expansion over the forecast period. However, tariffs on imported steel create some uncertainty for the met coal market.
Importers
Met coal imports into Europe contract slightly over the outlook period, from 59 Mtce to 57 Mtce (Figure 4.8), although higher energy prices in Europe could accelerate the decline.
In Japan (traditionally the world’s second-largest crude steel producer and a major importer of met coal), crude steel production continues to decline slowly through 2023, leading to a commensurate reduction in met coal imports, which fall 1.5% per year on average from 45 Mtce in 2017 to 41 Mtce in 2023.
Figure 4.8 Projected seaborne met coal imports
*Estimated.
0
50
100
150
200
250
300
2016 2017* 2019 2021 2023
Mtce
Europe Japan Korea China India Other developing Asia (incl. ASEAN) Other
-5%-3%0%3%5%8%10%13%15%
- 10- 5 0 5
10 15 20 25 30
2011-17 2017-23
Mtce
CAAGR (right axis)
© O
EC
D/IE
A, 2
018

MEDIUM-TERM INTERNATIONAL COAL TRADE FORECAST
COAL 2018 117
Rising crude steel production means that met coal imports by Korea (which lacks indigenous production, like Japan) are projected to continue increasing, from 34 Mtce in 2017 to 39 Mtce in 2023.
Seaborne met coal imports by China, the producer of half the globe’s steel, expand at a CAAGR of 2.3% to 36 Mtce in 2023 (4 Mtce more than in 2017). Even though met coal demand is projected to fall over the forecast period, further cuts in domestic production raise import volumes from overseas suppliers. As explained in chapters 1 and 3, China’s supply-side reforms, which are key in determining imports and prices, will affect coking coal more than thermal coal, leading to this rise in imports.
Rising demand and stagnating coal production in India mean that met coal imports grow at a CAAGR of 7.2% – from 49 Mtce in 2017 to 74 Mtce in 2023 – making India the world’s primary importer of met coal by 2023.
Rising met coal consumption in some Southeast Asian countries (such as Malaysia and Viet Nam), where new blast furnaces become operational during the outlook period, is projected to bolster imports from 5 Mtce in 2017 to 9 Mtce in 2023. Imports by Chinese Taipei remain at approximately 6 Mtce per year.
Exporters
Australia’s export volumes swell considerably over the forecast period, primarily in response to higher offtake from buyers in India (Figure 4.9). In the short term, high seaborne prices mean that several coking coal mines that had been idled are back in operation: in 2017, Glencore restarted production at the Integra underground operation and the Collinsville open-cut mine. Later that year, Fitzroy reopened Broadlea North, which had been placed in care-and-maintenance mode in 2009. In early 2018, Bounty Mining resumed mining at the Cook colliery, while the Baralaba Coal Company’s Baralaba North Mine is also scheduled to restart in 2018. In the medium term, significant new export mining capacity could come online through 2023 (see chapter 5). Australia’s exports therefore grow a substantial 2.4% per year, from 172 Mtce in 2017 (a year that had significant supply disruptions; see chapter 1) to 198 Mtce in 2023.
Figure 4.9 Projected seaborne met coal exports
*Estimated.
Seaborne met coal exports from Russia are expected to continue expanding over the forecast period, driven primarily by rising Asian demand and Russia’s plans to expand export-oriented mining.
0
50
100
150
200
250
300
2016 2017* 2019 2021 2023
Mtce
Australia Canada Mozambique Russia United States Other
-40%-30%-20%-10%0%10%20%30%40%50%
- 30
- 20
- 10
0
10
20
30
40
2011-17 2017-23
Mtce
CAAGR (right axis)
© O
EC
D/IE
A, 2
018

MEDIUM-TERM INTERNATIONAL COAL TRADE FORECAST
118 COAL 2018
Volumes shipped through the country’s coal terminals are therefore projected to grow at a CAAGR of 3.7%, reaching 19 Mtce in 2023 – up 4 Mtce from 2017.
Benefiting from opening of the Nacala corridor rail line and expansion of the Nacala port, Mozambique continues to ramp up coal production, increasing its seaborne exports from a mere 7 Mtce in 2017 to 13 Mtce in 2023 – a CAAGR of 11%. Owing to its geographic proximity, India is expected to be an increasingly important offtaker.
In 2017, coal producers in the United States benefited from rising demand in China and supply disruptions in Australia, with coking coal exports hitting 34 Mtce that year. With a recovery in Australian production, coupled with additional supplies from Mozambique and Russia, US met coal exports decline by 9 Mtce over the forecast period, to 26 Mtce in 2023. Exports from Canada also fall marginally, from 24 Mtce in 2017 to 23 Mtce in 2023.
References CRU (2018), Thermal Coal Cost Model (database), CRU Group, London, www.crugroup.com.
IEA (International Energy Agency) (2018), World Energy Statistics 2018, OECD/IEA, Paris, www.iea.org/statistics/.
IHS Markit (2018), Coal McCloskey Price and Statistical Data, https://connect.ihs.com/industry/coal.
MOEF (Ministry of Economy and Finance) (2018), Tax Revision Bill 2018, Government of Korea, http://english.moef.go.kr/popup/180806/popup20180806.html.
© O
EC
D/IE
A, 2
018

CAPACITY INVESTMENT OUTLOOK
COAL 2018 119
5. CAPACITY INVESTMENT OUTLOOK
Highlights • Despite higher prices and a tight market, low coal sector investment persists. New export-
oriented greenfield projects especially are very rare outside the Russian Federation (“Russia”). Finding financing for new coal projects is becoming more difficult, public opposition is growing and approval processes in most jurisdictions have become lengthier.
• Although numerous coal mining projects are under development or discussion, most are unlikely to proceed during the forecast period. Projects globally total 965 Mtpa, of which 139 Mtpa qualify as more advanced and 826 Mtpa as less advanced. This increase from 2017 results from slow project progress rather investment upturn.
• Australia has the most export mining capacity under development. More than half of global new capacity is in Australia (an additional 577 Mtpa announced), due also partially to Australia being more transparent than other countries. Projects include both thermal and coking coal projects, in both producing and untapped basins such as the Galilee Basin.
• In export infrastructure, only Russia’s port capacity is expanding significantly, and there is some potential in Mozambique. In Russia, ports of the Baltic, Artic, Black Sea and the Far East are being enlarged. A further prerequisite to coal export expansion is the extension of rail lines linking the Kuznetsk Basin to the coal ports, particularly the Far Eastern ports.
• Carbon capture, utilisation and storage (CCUS) momentum is building. Developments both on the ground and in policy are positive, but technological progress lags far behind.
Investment overview Last year’s coal mine investment analysis concluded that, despite the prevalence of high coal prices since late 2016, very few new investments had been proposed. One year later, prices were even higher but the situation is relatively unchanged. Capacity under development (both more and less advanced) continues to increase, but this is more the result of slow project progress than of a rebound in coal mine investments. While prices have risen, so have costs, due to labour inflation and higher oil prices (and other input cost hikes). Still, companies’ profit margins are solid and this has had some effect on investment activity in the sector. Coal company acquisitions have been increasing, but although this results partly from companies having funds available to spend, it is also due to others wishing to leave the coal sector. The best example of this is Rio Tinto: one of the top five global producers less than one decade ago, it has now virtually left the sector after selling Hail Creek mine and the Valeria project. In addition, Coronado Global resources launched an initial public offering (IPO) worth over USD 700 million – the first large IPO in Australia’s coal sector since Yancoal Australia was listed in 2012. Another indication of this turnover is South32’s announcement that it received tens of bids for its assets in South Africa.
Higher prices and risk aversion are also providing low-investment-cost options, such as reopening or purchasing mines that had been placed in idle mode some time ago; brownfield expansions; and even very low, short-term capex operations that would otherwise be very unlikely. A good example is
© O
EC
D/IE
A, 2
018

CAPACITY INVESTMENT OUTLOOK
120 COAL 2018
Ascon Group (a German trading house), which is leasing Walvis Bay port (Namibia) to ship coal from mines in Zimbabwe and Botswana. The coal is to be trucked to the Namibian border and then moved by rail to the port, from which it will be shipped to Germany.
Despite higher prices and indications of market tightening, the aversion to greenfield investments persists, so very few new export-oriented greenfield mines are being proposed outside Russia. Financing new projects is increasingly difficult, public opposition is growing and approval processes have become lengthier. The Carmichael project in Australia, probably the most controversial coal project currently under development, has been confronted with all these challenges. Although the project has won nine court challenges and received 112 approvals, its future remains uncertain.
Box 5.1 Will technological advances boost coal demand?
More than 80% of the coal consumed in the world is simply burned to produce steam and heat, mostly in pulverised coal plants for power generation (over 60% of coal is consumed in this manner), but it also serves many other purposes, from industrial processes to residential heating. Almost 15% of coal is subject to pyrolysis, i.e. heating in the absence of oxygen. This process, in which coal loses moisture and volatile matter to become coke or semi-coke, is mostly used at large scale to produce iron in blast furnaces. Coke supports the charge of raw materials, reduces iron ore (iron oxide), supplies energy to the process and supplies the carbon content of the pig iron. Less than 5% of coal is gasified, i.e. injected with steam and air or oxygen to produce a mixture of gases, mainly carbon monoxide (CO), hydrogen, carbon dioxide (CO2) and methane. Gasification, as opposed to coal-burning, in principle offers the possibility of cleaner coal use. In gasification, direct emission of air pollutants is avoided and the process is very versatile since the gases produced can be used for a variety of applications: producing electricity, synthetic liquid fuels, synthetic natural gas – i.e. methane – and a variety of chemicals. Coal-based power generation has recently been challenged by the technological advancements in wind- and solar photovoltaic (PV)-based generation that have reduced their costs dramatically. Coal-based technologies are also advancing, however, so it is possible that beyond the forecast period, these technologies may actually boost coal use, both for power generation and other applications.
For power generation, technological innovation aims to: raise efficiency; reduce air pollution; and, more recently, enhance flexibility (Figure 5.1). Despite technological progress, CO2 emissions remain the main challenge in using coal. Advanced ultra-supercritical (AUSC) plants will achieve 50% efficiency by using higher-temperature steam (around 700 degrees Celsius [°C] instead of the current maximum of 630 °C), and double-reheat and/or digital-twin technologies that optimise coal-burning by incorporating digital technology and big data. In an integrated gasification combined-cycle (IGCC) plant (in which coal is gasified to obtain syngas that is sent to a gas turbine), applying a steam cycle after the gas turbine can raise efficiency to over 50% (such as in the air-blown 540-megawatt (MW) Hirono and 540-MW Nakoso plants under construction in Japan). The oxygen-blown 166-MW IGCC Osaki plant, also in Japan, is in operation and CO2 capture is under construction. The addition of a fuel cell is planned, to create an integrated gasification fuel cell (IGFC) plant, for which efficiency can approach 60%.
Whereas higher efficiency means fewer emissions (as illustrated in Figure 5.1), only CCUS can effectuate the reductions needed to meet climate change targets. Two commercial-scale CCUS coal-fuelled power plants are currently operating successfully: Boundary Dam (Saskatchewan, Canada) and Petra Nova (Texas, United States). A more innovative approach involves application of the Allam cycle for electricity production, which uses supercritical CO2 as a working fluid rather than the water/steam typically used in coal-fired power generation. NET Power has built a 50-MW demonstration plant in Texas, running on gas. Given the low price of gas in the United States, the business case for coal gasification is unclear, but for places with higher coal and gas price differentials coal gasification with the Allam cycle is a promising technology.
© O
EC
D/IE
A, 2
018

CAPACITY INVESTMENT OUTLOOK
COAL 2018 121
Figure 5.1 The path to zero-emissions coal
Note: Emissions for every technology is an approximate value.
Apart from power generation, prospects for coal use are high in the coal conversion (coal-to-gas, coal-to-liquids, and coal-to-chemicals) sector, especially in the People’s Republic of China (“China”). The main economic driver is the price gap between coal and oil, but coal conversion could be a good way to monetise coal that would otherwise be stranded for reasons of quality and/or transportation costs. Outside South Africa and China, projects are under consideration in other countries, such as India, Botswana and even the United States. Whereas in India and Botswana the rationale is clear, as both countries have abundant coal reserves and little gas or oil, the project in the United States could change thinking, as it seems counterintuitive for one of the world’s largest oil-producing countries to build a coal-to-liquids plant (see the US coal demand forecast in chapter 3 for more details).
Another technology that could reshape the future of coal use is coal gasification to produce hydrogen. Australia’s state of Victoria has one of the largest lignite reserves in the world and is also home to the Hydrogen Energy Supply Chain (HESC) project in Latrobe Valley. This is a pilot lignite gasification project that produces hydrogen to be liquefied and shipped to Japan. CO2 produced in the process will also be captured and stored on-site. Expected to be highly beneficial for the hydrogen economy, the HESC project may also pave the way for using coal that would otherwise remain stranded.
The Corbin project takes a completely different approach to coal exploitation, by turning coal fines that are normally discarded into hydrocarbon to be added either to crude oil or to certain oil products. This raises the value of coal to near that of oil, plus additional energy is obtained without using additional resources and the recovery of coal fines reduces the environmental impact of coal.
Only time can tell how coal technology will evolve, but if power generation from pulverised coal plants declines considerably, it is still very unlikely that any other technology will take over at such a scale.
Investment in export mining capacity A large number of coal mining projects are under development or discussion, although many are unlikely to go ahead within the forecast period. For assessment purposes, these projects are categorised as either more advanced or less advanced as in former years. Projects qualify as more advanced if they have been committed, obtained financing, or are under construction. Less-advanced projects are at the feasibility or environmental impact study stage, or are awaiting approval.
Around 139 Mtpa of more advanced export mining capacity is currently under development, slightly more than the 115 Mtpa recorded in last year’s report (IEA, 2017). Most of the more advanced
0
200
400
600
800
1000
1200
Subcritical SC USC AUSC IGCC IGFC CCUS Biomasscofiring with
CCUS
g/kWh
© O
EC
D/IE
A, 2
018

CAPACITY INVESTMENT OUTLOOK
122 COAL 2018
capacity is in South Africa (43%) (Map 5.1). While many are designed to sell chiefly into the domestic market, a lot of projects are expected to produce at least small quanitites for export as well. Russia registers 19% of the more advanced capacity, followed by Australia (16%), Colombia (6%), Mozambique (6%) and Canada (5%). Australia’s share has dropped from 2017, as several new mines have started production. Much of the new, more advanced capacity under development in South Africa is thermal coal, while in Russia and Australia it is mostly met coal. Globally, 54% of the more advanced projects are brownfield developments (i.e. extensions of existing mines).
Map 5.1 Cumulative capacity of hard coal export mining projects (Mtpa), 2019-23
*Includes projects without an announced start-up year.
Compared with Coal 2017, this year’s report registers a significant increase in less-advanced, proposed export mining capacity (an additional 426 Mtpa), mostly reflecting a lack of project progress last year: around 85% of these projects are greenfield developments. Of the less-advanced capacity proposed since last year, the focus is very much on Australia, which claims 67% of it. Projects include large thermal coal operations in the Galilee Basin as well as new, large coking coal projects in the Bowen Basin. It should be noted, however, that much of the newly listed capacity is proposed to come online in or after 2023, or a proposed start-up date has not been officially announced.
Investment in export infrastructure capacity Among the major coal exporters, only Russia is considerably expanding its export infrastructure to substantially increase its coal transhipment capacity over the forecast period. In Australia, Adani’s proposed expansion of the Abbot Point coal terminal would be a major capacity improvement, but its fate depends very much on that of the embattled Carmichael Coal Project in the Galilee Basin.
© O
EC
D/IE
A, 2
018

CAPACITY INVESTMENT OUTLOOK
COAL 2018 123
Box 5.2 CCUS: Positive but insufficient momentum continues to build
The Intergovernmental Panel on Climate Change (IPCC) Special Report on Global Warming of 1.5°C, released in October 2018, and the International Energy Agency (IEA) World Energy Outlook 2018 deliver a stern reminder: CCUS needs to be employed for climate goals to be achieved. The IEA therefore continues to monitor CCUS technological and policy developments closely, as well as advances in financing and project start-ups through its Tracking Clean Energy Progress work programme.
Two large-scale, coal-based CCUS power stations are currently operating successfully: the Boundary Dam project in Saskatchewan, Canada, which has an annual capture capacity of 1 million tonnes of carbon dioxide (MtCO2), and the Petra Nova Carbon Capture project in Texas, United States, with annual capture capacity of 1.4 MtCO2. Both are retrofits using post-combustion capture technology and they sell captured CO2 for enhanced oil recovery.
CCUS is a vital technology – not only for coal, and not only for power generation. It can be applied to other fuels, including biomass, and used in industry applications. Launching of the first iron and steel-related CCUS facility in Abu Dhabi in 2016, and of the world’s first large-scale CCUS project linked with bioenergy at the Illinois Industrial CCUS Project (producing corn ethanol) in 2017, has enlarged the portfolio of large-scale, proven CCUS applications in the industry and transformation sectors. The total number of CCUS projects in industry and transformation climbed to 16 in 2018 when one additional industrial project linked to CO2-enhanced oil recovery (EOR) began operations in China.
CCUS projects currently operational and in early development have a potential capture capacity of 50 Mtpa. However, the IEA Sustainable Development Scenario envisions around 760 Mtpa of CO2 captured from power generation, industry and transformation in 2030. This implies that if CCUS is to be part of a low-carbon energy future, efforts to make CCUS commercially viable need to be stepped up.
Fortunately, CCUS momentum is already building. The experiences of the two power-retrofit projects in operation indicate that substantive cost reductions are possible and suggest that retrofitting of the existing coal fleet with CCUS could prove an important strategic hedge. This is particularly relevant for Asia’s young coal-fired fleet, for which the average age is less than 15 years.
Furthermore, several technological innovations that could reduce the cost of CCUS are now being tested at pilot scale. A prime example is the NET Power’s 50-MW Clean Energy Demonstration Plant in Texas, as this first-of-its-kind natural gas-fired power plant employs Allam cycle technology to use CO2 as a working fluid in an oxy-fuel, supercritical CO2 power cycle. In addition, Fuel Cell Energy in Connecticut is testing a system of molten carbonate fuel cells to capture CO2. Capturing CO2 from the flue gas stream of a host plant would also generate electricity, circumventing the parasitic load cost associated with traditional carbon capture on power plants. Industry research is also looking increasingly at using CO2 for such applications as cement production and CO2-based methanol production.
Concerning policies and regulations, the 2018 US Budget Bill passed in mid-February 2018 contains a provision that could prove a landmark for CCUS support, potentially unlocking many lower-cost industrial and fuel transformation CCUS opportunities, particularly in natural gas processing and refining and in ammonia and bioethanol production. The Budget Bill aims to stimulate investment in carbon capture by expanding incentives to companies that can use captured CO2 and reduce emissions as a result, and it raises the 45Q tax credit for permanently storing CO2 underground from the current USD 22 to USD 50 in 2026. This bill exemplifies how relatively small policy incentives can tip the scale when the infrastructure and industrial conditions are already in place, as the United States is already leveraging an existing market and pipeline network for EOR.
Support for CCUS is also mounting in Norway, the United Kingdom and the Netherlands. To reinforce this momentum, the UK government and the IEA hosted an International Carbon Capture, Utilisation and Storage Summit in Edinburgh on 28 November 2018. The Summit brought together ministers and energy industry leaders to promote accelerated deployment of CCUS technologies. The event highlighted the widespread buy-in from energy leaders around the world to accelerate CCUS scale-up.
© O
EC
D/IE
A, 2
018

CAPACITY INVESTMENT OUTLOOK
124 COAL 2018
Regional analyses This section provides an overview of export mining and infrastructure projects projected to come online over the forecast period in major coal-exporting countries. Information was obtained from a range of public and non-official sources, including company statements and annual reports, newspaper articles, official documents and permits, databases and interviews.
Australia
Investment in export mining capacity
Since publication of Coal 2017, several mines that had been placed in care-and-maintenance mode have resumed production. TerraCom’s Blair Athol thermal coal mine reopened, achieving its nameplate output of 2 Mtpa in December 2017. Glencore resumed the production of thermal and met coal at the Integra underground operation and the Collinsville open-cut mine. Fitzroy reopened the Broadlea North met coal mine, which had been in care and maintenance since 2009. Bounty Mining restarted met coal production at the Cook colliery, while the Baralaba Coal Company’s Baralaba North open-cut is also scheduled to restart met coal production in 2018. South32’s ramp up of coking coal production at Appin Area 9 appears to be on track, with the return of a two-longwall configuration slated to bring productive capacity up to 3.5 Mtpa by December 2018. Two greenfield projects also came online in 2018. In April, Sojitz Coal Mining began commercial production at the 1.5-Mtpa Meteor Downs South thermal coal mine in Queensland’s Bowen Basin. Mining operations also commenced at MACH Energy’s 10.5-Mtpa Mount Pleasant thermal coal operation in New South Wales, although as of June 2018 the run-of-mine coal is being stockpiled pending completion of a coal washery and rail loadout facility.
Construction of the Byerwen Coal Mine in the Bowen Basin began in the first quarter of 2018. The mine, owned by QCoal and JFE Steel, is a 10-Mtpa open-cast mine that has an expected lifetime of 50 years. It will primarily produce hard coking coal for the Asian steel market, along with a smaller thermal coal component.
There are also several less-advanced projects in Australia. Several large mines are planned for Queensland’s Galilee Basin, located west of the established Bowen Basin. The lack of coal transportation infrastructure is a serious problem for many projects in the Galilee Basin, however. Of the several large mines planned, Adani’s 25-Mtpa Carmichael thermal coal project is currently making the most progress. The company has all the necessary approvals in place to proceed and has reportedly secured funding for the mine itself but not the rail component, both of which are interdependent. After failing to secure funding for a dedicated 388-kilometre (km) standard gauge railway line linking the mine site and the Abbot Point coal terminal, Adani now seeks to build a shorter, less-costly 200-km narrow line that connects directly to the existing network. The future of Carmichael will determine the fate of other large projects in the Galilee Basin, such as GVK Hancock’s Alpha Coal (32 Mtpa), Kevin’s Corner (30 Mtpa), Waratah Coal’s China First (40 Mtpa), and China Stone (40 Mtpa).
With met coal prices soaring, potential developments in the Bowen Basin have also garnered renewed interest. In May 2018, South32 acquired a 50% stake in Aquila Resources’ Eagle Downs coking coal project. Developing Eagle Downs, which is fully permitted, would entail construction of an underground longwall mine with a potential capacity of 4.5 Mtpa and a dedicated train loadout facility, but commissioning is not expected before 2023.
© O
EC
D/IE
A, 2
018

CAPACITY INVESTMENT OUTLOOK
COAL 2018 125
Exxaro Resources and Anglo American are reportedly reassessing the Moranbah South coking coal project, which was put up for sale in 2017 but did not find a buyer. If developed, the 18-Mtpa mine would be one of the largest coking coal operations in the world. In late 2017, Pembroke Resources, backed by Denham Capital, a resources and energy-focused private equity investor, announced its intention to develop the 14-Mtpa Olive Downs coking coal project. In September 2018, a draft environmental impact statement (EIS) was published for comment.
All these projects, however, are at a very early stage of development and unlikely to proceed before 2023.
Overall, the Australian government’s Office of the Chief Economist reports 59 planned mine expansion or construction projects for the country, with a total estimated investment cost of AUD 83 billion. In terms of geographical distribution, there are 42 projects in Queensland, 16 in New South Wales and one in Victoria. This is a significant increase from last year’s 37 projects reported, reflecting the higher prevailing market prices.
Investment in export infrastructure
In 2017, the combined coal-loading capacity of Australia’s major coal terminals (Abbot Point, Hay Point, Dalrymple Bay, Gladstone and WICET, Brisbane, Newcastle and Port Kembla) was 508 Mtpa.
Both GVK Hancock and Adani are currently planning to expand the coal loading facilities at the Abbot Point coal terminal in Queensland to handle exports from their planned mines in the Galilee Basin. The project is uncertain, however, as it depends on development of the mines themselves and the associated railway infrastructure. There is also considerable public opposition to the port expansion based on claims of its potential impact on the nearby Great Barrier Reef. Furthermore, current spare capacity at Abbot Point is large enough to accommodate the Carmichael project’s first phase.
The only export-related infrastructure project currently proceeding is Phase 1 of the Hunter Valley Corridor Capacity Strategy, a multi-year project to raise the railway capacity linking the Hunter Valley Coal Chain in New South Wales and the port of Newcastle.
Colombia
Investment in export mining capacity
No progress has been reported in Yildirim’s projects in Colombia in the past year (the Papaya, Cañaverales and San Juan mines).
Little progress is also apparent for what has been dubbed the “P40 project” to expand the capacity of Cerrejón, Colombia’s largest thermal coal mine, by 8 Mtpa. It would involve the construction of additional loading facilities at Puerto Bolivar as well as improvements to existing road and rail infrastructure. The expansion is opposed by local tribes and appears to be proceeding very slowly.
Although it does not involve new investment, it is relevant that Drummond announced its intention to sell its Colombian coal assets, which include the Pribbenow and El Descanso mines located in the Cesar Coal Basin, their associated coal handling facilities, and Puerto Drummond, a deepwater port on the Caribbean coast.
© O
EC
D/IE
A, 2
018

CAPACITY INVESTMENT OUTLOOK
126 COAL 2018
Investment in export infrastructure
There are currently no investments in additional export infrastructure capacity planned. Plans to build a new coal port in the La Guajira department (designed to facilitate exports from Yildirim Holdings) appear to be on hold, like the development of the mines themselves.
South Africa
Investment in export mining capacity
Diversified, black-empowered South African mining company Exxaro Resources is pushing ahead with several new projects mainly targeting the export market. The first is the Leeuwpan Life Extension, which includes development of a 2.7-Mtpa open-cut thermal/coking coal pit at the Leeuwpan coal mine in Mpumalanga. Exxaro is also developing the greenfield Belfast project, a 2.7-Mtpa open-pit mine that will produce 6 000-kilocalorie-per-kilogramme (kcal/kg) thermal coal destined for the seaborne market. Construction began in November 2017 and production is expected to commence in 2020. In 2017, Exxaro also began to convert the Grootegeluk 2 (GG2) single-stage coal beneficiation plant at the Grootegeluk mine in Limpopo’s Waterberg coal fields to a new double-phase beneficiation plant called Grootegeluk 6 (GG6), which will produce up to 1.7 Mtpa of export-quality semi-soft coking coal. In addition, Ledjadja Coal has obtained financing to construct the Boikarabelo mine. With this and the offtake agreement with Noble Resources, the future of the mine seems more certain.
South32 is extending the life of its Klipspruit mine in Mpumalanga to 2037 (it would otherwise have closed in 2019). While the new pit at Klipspruit will produce 8 Mtpa of export coal, its proximity to the new Kusile coal-fired power station will offer opportunities for domestic sales as well.
There are more projects in South Africa, such as Exxaro’s Thabametsi and Sekoko’s Waterberg Coal Project, but they mainly target the domestic market.
Investment in export infrastructure
In 2017, Exxaro Resources and rail operator Transnet began construction of a 12-Mtpa rapid, multi-product loadout station near the Grootegeluk mine in Limpopo’s Waterberg coal fields, expanding the infrastructure needed to develop the fields. The loadout station will enhance the capacity of the Waterberg rail line, which links the mines in the Waterberg coal fields to the Richard’s Bay Coal Terminal (RBCT).
RBCT, which has a capacity of 91 Mtpa, is receiving investments to raise its coal-loading capacity by 3.6 Mtpa. While RBCT currently handles only around 80 Mtpa due to bottlenecks on the railway lines connecting the coal mining areas in Mpumalanga and Limpopo with the terminal, upgrades that would bring total line capacity up to 97.5 Mtpa are planned by Transnet, the operator of the freight rail network.
Mozambique
Investment in export mining capacity
In 2017, International Coal Ventures Ltd (ICVL) restarted the Benga mine, which had been idled in 2015 amid a slump in global coking coal prices. Current production capacity is 5 Mtpa, with potential to expand up to 12 Mtpa in the future.
© O
EC
D/IE
A, 2
018

CAPACITY INVESTMENT OUTLOOK
COAL 2018 127
Vale’s production capacity expansion to 22 Mtpa is now likely to be completed owing to an agreement made in 2017 with the Japanese company Mitsui, which purchased 15% of the 95% share that Vale had in Moatize coal mine and NLC.
Investment in export infrastructure
Development of the USD 2.7 billion Moatize-Macuse Logistics Corridor, which involves construction of a 639-km, 100-Mtpa-capacity railway line from Moatize to a new floating coal terminal off the coast at Macuse, has been given new momentum. A consortium led by Thai Mozambique Logistica (TML), a subsidiary of Thailand’s Ital-Thai Group, holds 60% of the equity, and Mozambique railways (CFM) and Codiza, a local company, each own 20% shares. Financing is provided entirely through public Chinese banks and the China Export & Credit Insurance Corporation (Sinosure). Construction is expected to begin in 2019 and works are scheduled for completion in 2022.
The Indian port company Essar Ports is planning to develop a new 10-Mtpa coal terminal at the port of Beira in southern Mozambique. The 580-km Sena railway line, in which Vale recently acquired a majority stake, links Beira to the Moatize coal basin, compared with the 912 km through the Nacala corridor.
In July 2017, dredging, berth-deepening and quay offset works were completed at the Terminal de Carvão da Matola (TCM), a dry bulk terminal designed to handle coal and magnetite at the Port of Maputo. It can now accommodate Panamax-size vessels and loading capacity rose from 7.5 Mtpa to 9 Mtpa.
Russia
Investment in export mining capacity
Industrial Metallurgical Holding (IMH), also called KOKS Group, a leading Russian producer of pig iron, coke, coking coal and iron ore, is currently expanding production at its new Tikhova coking coal mine in the Kuznetsk Basin, the heart of Russia’s coal industry. At full capacity, Tikhova is expected to produce up to 3.4 Mt of coking coal per year. Furthermore, the company is raising the capacity of its Butovskaya met coal mine to a projected 1.8 Mtpa.
Solntsevsky Coal Mine LLC, a subsidiary of the East Mining Company, is continuing to ramp up production at the Solntsevsky thermal coal mine on the island of Sakhalin in Russia’s Far East, just north of Hokkaido, Japan. Output is expected to reach 8 Mtpa in 2018, 4 Mt more than in 2017, and is projected to rise to 10 Mtpa by 2020. The coal is exported through the port of Shaktersk to buyers in East Asia.
Australia-listed Tigers Realm Coal has started producing semi-soft coking coal at its 1.6-Mtpa Amaam North coking coal project in Chukotka. The company plans to extend the operation by opening a second pit at Amaan, roughly 30 km south of the Amaan North mine.
Mechel is continuing to develop its Elga coal deposit in the South Yakutia basin. In 2017, run-of-mine production at Elga was 4.5 Mtpa, to be increased to 11.5 Mtpa in the near term. Nearly 75% of Elga’s production is high-quality coking coal and the remainder is thermal coal. The 320-km Ulak-Elga branch line, which has a carrying capacity of 4 Mtpa, links the project to the Baikal-Amur Main Line, providing direct rail access to coal loading terminals in the Russian Far East.
In April 2018, Kolmar commissioned a new 4-Mtpa coal beneficiation plant at the Denisovsky coking coal complex in South Yakutia. The Denisovsky coal complex includes the Denisovskaya Central mine
© O
EC
D/IE
A, 2
018

CAPACITY INVESTMENT OUTLOOK
128 COAL 2018
with a production capacity of 2 Mtpa and the Denisovsky open-pit mine with an annual capacity of 0.9 Mt. The company is planning construction of another mine (Denisovskaya East) with a total capacity of 4 Mtpa. Kolmar is also increasing the capacity of its Inaglinsky coal complex, which is home to the 2-Mtpa Inaglinsky open-pit coking coal mine. A second mine (Inaglinskaya-1) with a production capacity of 4 Mtpa is currently under construction, while a third mine (Inaglinskaya-2, 8 Mtpa) is in the early planning stage.
Investment in export infrastructure
Russia is upgrading its transportation links to facilitate coal exports, particularly through its coal terminals in the Far East. Even though several new mines are under development or ramping up production closer to the Pacific coast, the heart of Russia’s coal industry is (and will remain) the Kuznetsk Basin, which is responsible for most export-related production. Due to its location in southwestern Siberia between Tomsk and Novokuznetsk, the coal has to be railed very long distances to ports in Europe or Russia’s Far East. The Baikal-Amur Mainline and the Trans-Siberian Railway are the two principal lines linking the Kuznetsk Basin with Far East coal loading terminals. Upgrades to both lines are planned, to raise their combined capacity to 180 Mtpa.
In addition, Russia is investing heavily in expanding the coal-loading capacities of its ports.
In October 2018, a new dry bulk terminal at the port of Taman on Russia’s Black Sea coast started handling coal. The ice-free deepwater port is designed to handle up to 20 Mtpa of throughput and will be able to receive Capesize vessels. The port will facilitate exports to Turkey, North Africa and the wider Mediterranean, and opens a route to India’s west coast.
In March 2018, construction of the Lavna Coal Terminal began at the port of Murmansk, Russia’s gateway to the Arctic and North Atlantic oceans. Once completed, the terminal will be able to process up to 18 Mtpa.
In April 2018, the commercial seaport of Ust-Luga, home to Rosterminalugol, Russia’s principal Baltic Sea coal terminal, announced its intention to reconstruct and modernise the Yug-2 multipurpose terminal. Scheduled to be completed in 2020, the terminal is to be equipped with three new coal loading facilities with a combined capacity of 14 Mtpa. This is an addition to the existing capacity at Rosterminalugol, which transhipped 25 Mt of coal in 2017.
Coal-loading capacity is also being expanded in the Far East as Russia becomes an increasingly important supplier to Asia Pacific economies, especially China, Korea and Japan.
Upgrades to boost the capacity of Russia’s largest coal port on the Pacific, Vostochny, by up to 20 Mtpa are scheduled to be completed in 2020, bringing the terminal’s total capacity to more than 40 Mtpa.
In August 2018, JSC Daltransugol – a subsidiary of SUEK – entered into an agreement with the government of the Khabarovsk region in which it pledged to spend at least RUB 20 billion to boost the coal transhipment capacity of the port of Vanino, Russia’s other major coal terminal on the Pacific, to 40 Mtpa by 2023.
© O
EC
D/IE
A, 2
018

CAPACITY INVESTMENT OUTLOOK
COAL 2018 129
Indonesia
Investment in export mining capacity
Although the bulk of Indonesia’s production is thermal coal, some smaller met coal projects appear to be in various stages of development.
In August 2018, Cokal Limited announced that it had secured funding for the Bumi Barito Mineral (BBM) coal project, a pulverised coal injection (PCI) coal mine in Central Kalimantan. First production is expected by the end of 2018, and the coal is to be barged 700 km downriver to a coastal loading facility. Production of 4 Mt is expected within five years.
Adaro seeks to further develop seven coking coal concessions in Central and East Kalimantan in which it acquired a 75% stake from BHP Billiton in 2016. Adaro already produces coking coal (0.9 Mt in 2017) from one concession (Lahai), and another concession is the planned Maruwai mine, from which BHP had intended to produce up to 6 Mtpa of coking coal from 2020 onwards.
Furthermore, several new export-oriented thermal coal projects have been proposed. Kangaroo Resources is continuing exploration activities at its Pakar North, Pakar South and Graha Panca Karsa (GPK) concessions in East Kalimantan. The company aims to start thermal coal production at the Pakar North concessions by 2020, ramping up to 9 Mtpa thereafter. The coal would be barged on the Kedang Kepala River from Senyiur Port to the Balikpapan Coal Terminal. Other proposed projects include Indika Energy’s Mitra Energi Agung in East Kalimantan and Adaro’s Bukit Enim Energi and Mustika Indah Permai in Sumatra.
Canada
Investment in export mining capacity
High coking coal prices have triggered a flurry of renewed activity in Canada’s export mining sector. Mining operations at the 2.3-Mtpa Grand Cache coking coal mine in Alberta will resume in 2018. Production at Grand Cache, which consists of a surface and an underground mine, was suspended in 2015 when with the operator, Grand Cache Coal, declared bankruptcy during the slump in global coking coal prices. Teck Resource’s Quintette, a fully permitted coking coal mine in British Columbia that produced coal from 1982 to 2000, is in care-and-maintenance mode, but its restart is probable if high seaborne prices persist. Similarly, Conuma Coal Resources is planning to recommence mining at the Willow Creek open-cut mine in British Columbia, with a targeted capacity of 1.7 Mtpa of hard coking coal and low-volatile PCI coal.
Additional projects have been announced, but they are still at the early stages of development. Atrum Coal is conducting exploratory drilling at the Groundhog anthracite project in north-western British Columbia. The company aims to start operations at an initial 0.9 Mtpa, but phased expansions are planned to boost production in the future. In December 2017, the Canadian government approved HD Mining International’s 8-Mtpa Murray River coking coal project in British Columbia. The project is the first in Canada to be subject to a cap on greenhouse gas emissions: the developer is legally required to limit methane emissions to no more than 500 000 tonnes of CO2 equivalent (tCO2-eq) per year. The Australian Riversdale Mining company has applied for a permit to develop the Grassy Mountain Coal Project, a 3.9-Mtpa coking coal mine in a legacy mining area north of Blaimore, Alberta, that was abandoned in the early 1960s. Riversdale expects the permitting process to be completed in 2019 and aims to start commercial mining in 2021. Jameson Resources is seeking
© O
EC
D/IE
A, 2
018

CAPACITY INVESTMENT OUTLOOK
130 COAL 2018
to develop the Crown Mountain Project, an open-pit coking coal mine located in British Columbia’s Elk Valley. The valley is already home to five coal mines with a combined met and thermal output of over 21 Mtpa and railway infrastructure linking it to coal loading terminals on the Pacific coast. Crown Mountain would produce 1.7 Mtpa of coking coal over 16 years. In the same area, Montem is exploring development of the fully licenced Tent Mountain deposit, which was last mined in 1983, with the aim of setting up a 1.5-Mtpa coking coal operation. In November 2018, Allegiance Coal signed a binding joint venture with Japanese Itochu to develop the Tenas coking coal mine, part of the broader Telkwa project, which consists of the Tenas, Goathorn Creek and Telkwa North deposits. The developer is targeting a production rate of 0.75 Mtpa of saleable coal. The mining majors Anglo American and Glencore are also investigating new opportunities in Canada, both in British Columbia: Glencore at Sukunka (3 Mtpa, coking coal) and Anglo at Roman Mountain (up to 3 Mtpa, coking coal), but no progress has been reported recently.
Investment in export infrastructure
Plans to expand the capacity of Ridley Terminal to 25 Mtpa from 18 Mtpa seem to have been discarded.
United States
Investment in export mining capacity
Ramaco Resources, which bought the idled Knock Creek mine from Alpha Natural Resources, plans to expand production of both the Knock Creek and Berwind mines. These are small operations of only a couple of million tonnes, however.
Paringa Resources Ltd (PNL) plans to start mining activities at the 3.5-Mtpa Poplar Grove thermal coal mine in the Illinois Basin’s Buck Creek coal complex by the fourth quarter of 2018. Furthermore, PNL aims to begin construction of the Cypress Mine in neighbouring Kentucky, with commercial production expected in 2021. The mine would have a thermal coal capacity of 4.7 Mtpa.
Investment in export infrastructure
US port export capacity is around 230 Mtpa. The utilisation rate was a low 38% in 2017, leaving significant room for growth. There is a problem, however, concerning port location: while the eastern ports have some capacity to spare, western port capacity is tight. In fact, the Pacific Northwest does not have a dedicated coal export terminal, which limits exports of low-cost Powder River Basin coal to Asian markets.
On the east coast, dredging of the access channel to the Hampton Roads harbour is underway. This will improve vessel access to several coal terminals with significant loading capacity: the Lamberts Point Coal Terminal (50 Mtpa), the Dominion Coal Terminal (22 Mtpa) and the Pier XI bulk terminal (16 Mtpa).
Lighthouse Resources is trying to advance the 44-Mtpa Millennium Bulk Terminals-Longview in the Pacific Northwest, but the environmental impact assessment caused the state of Washington to deny the project a water permit, preventing it from going ahead. This decision is currently being challenged in court by the states of Montana and Wyoming, where the Powder River Basin is located; they also have the support of Kansas, Utah, South Dakota and Nebraska. Also being debated in court is Oakland’s ban on the operations of a coal terminal.
© O
EC
D/IE
A, 2
018

CAPACITY INVESTMENT OUTLOOK
COAL 2018 131
Mongolia
Investment in export mining capacity
Gobi Coal and Energy’s fully permitted Shinejinst coking coal project is located 300 km from the Chinese border crossing of Ceke and a haul road is currently under construction. When operational, the company expects to produce up to 5 Mtpa of coking coal for the Chinese market.
Australian-listed Aspire Mining Ltd is continuing to study the feasibility of developing the Nuurstei and Ovoot coking coal projects. Ovoot is the larger project, with reserves of 255 Mt and potential production of 10 Mtpa of saleable coal from an open-pit and an underground mine. The feasibility of both projects is, however, dependent on construction of a 547-km railway line linking Ovoot with Erdenet, where it would connect to an existing single-track line that connects Erdenet with the capital Ulaanbaatar and the Trans-Mongolian-Railway. From there, the coal could be railed to consumers and ports in either Russia or China.
Investment in export infrastructure
As noted above, Aspire Mining’s planned developments still hinge on construction of a rail corridor from the company’s Ovoot deposit to Erdenet, where it would link to the existing Mongolian network. The railway project is being managed by Aspire mining subsidiary Northern Railways LLC, and is part of a broader plan by China and Mongolia to develop a Northern Rail Corridor running from Ulaanbaatar through Erdenet and Ovoot to Kyzyl in Russia as part of China’s Belt and Road Initiative. To move the project forward, Aspire has partnered with China Gezhouba Group International Engineering Co. (CGGC), one of the largest Chinese construction companies. In April 2018, both companies signed a new memorandum of understanding (MOU). According to the MOU, the parties are to finalise a feasibility study on the railway project and conclude a lump-sum turnkey construction contract by November 2018, should Aspire be able to financially close the project. It is understood that both companies are also seeking funding from the Mongolian government. A pre-feasibility study concluded in October 2017 states that rail line capacity of about 20 Mtpa could be attained, and that 60 months would be required to build the entire railway section.
In addition, the Mongolian government is planning construction of a 267-km railway line from the Tavan Tolgoi coking coal mine in the Gobi Desert to the border crossing of Gashuun Sukhait, where it would connect to an existing Chinese branch line. The rail line would have a capacity of up to 30 Mtpa. On 9 July 2018, the Mongolian cabinet decided to create the Tavan Tolgoi Railway Company, owned 51% by the state and tasked with advancing the project. Funding for the project is currently lacking, however.
References IEA (International Energy Agency) (2017), Coal 2017: Analysis and Forecasts to 2022, OECD/IEA, Paris
© O
EC
D/IE
A, 2
018

ANNEX A. DATA TABLES
132 COAL 2018
ANNEX A. DATA TABLES
Table A.1. Coal demand (Mtce), 2016-23
2016 2017* 2019 2021 2023 CAAGR
Asia Pacific 3 891 3 960 4 029 4 094 4 107 0.6%
China 2 743 2 750 2 744 2 737 2 673 -0.5%
India 539 563 608 656 708 3.9%
Japan 162 164 162 157 153 -1.1%
Korea 116 129 132 131 131 0.3%
Southeast Asia 172 186 211 235 259 5.7%
North America 528 513 476 459 437 -2.6%
United States 488 473 446 432 413 -2.2%
Central and South America 46 45 53 49 48 1.1%
Europe 414 406 390 382 375 -1.3%
European Union 337 325 306 292 280 -2.5%
Middle East 12 10 10 12 12 1.9%
Eurasia 263 266 269 269 269 0.2%
Russia 164 172 173 170 168 -0.4%
Africa 154 156 162 166 170 1.5%
World 5 308 5 355 5 389 5 432 5 418 0.2% *Estimated. Note: CAAGR = compound average annual growth rate.
Table A.2. Thermal coal and lignite demand (Mtce), 2016-23
2016 2017* 2019 2021 2023 CAAGR
Asia Pacific 3 101 3 158 3 221 3 299 3 316 0.8%
China 2 104 2 101 2 103 2 118 2 069 -0.3%
India 483 505 541 581 625 3.6%
Japan 116 118 118 114 112 -1.0%
Korea 82 94 96 93 92 -0.4%
Southeast Asia 169 183 201 225 248 5.2%
North America 503 486 449 432 411 -2.7%
United States 471 454 427 413 395 -2.3%
Central and South America 28 25 32 30 29 2.5%
Europe 338 329 314 306 299 -1.6%
European Union 268 257 237 224 212 -3.1%
Middle East 9 8 8 10 9 2.4%
Eurasia 168 172 173 172 173 0.0%
Russia 98 107 106 102 101 -1.0%
Africa 150 151 157 161 165 1.5%
World 4 296 4 329 4 352 4 411 4 403 0.3% *Estimated.
© O
EC
D/IE
A, 2
018

ANNEX A. DATA TABLES
COAL 2018 133
Table A.3. Metallurgical (met) coal demand (Mtce), 2016-23
2016 2017* 2019 2021 2023 CAAGR
Asia Pacific 790 803 809 795 791 -0.3%
China 638 649 641 619 605 -1.2%
India 56 58 67 74 83 6.2%
Japan 46 45 44 43 41 -1.5%
Korea 34 35 36 38 39 2.0%
Southeast Asia 4 4 10 11 12 20.9%
North America 25 27 27 27 26 -0.5%
United States 17 19 19 19 18 -0.4%
Central and South America 18 19 21 19 18 -0.9%
Europe 76 77 76 76 76 -0.2%
European Union 69 69 68 68 68 -0.2%
Middle East 3 2 2 2 2 0.0%
Eurasia 95 93 96 97 97 0.6%
Russia 65 65 67 67 67 0.5%
Africa 4 5 5 5 5 1.1%
World 1 012 1 027 1 037 1 021 1 015 -0.2%
*Estimated.
Table A.4. Coal production (Mtce), 2016-23
2016 2017* 2019 2021 2023 CAAGR
Asia Pacific 3 735 3 848 3 880 3 931 3 921 0.3%
China 2 456 2 533 2 516 2 544 2 497 -0.2%
India 387 395 427 462 499 4.0%
Australia 417 420 420 434 438 0.7%
Indonesia 355 374 389 367 365 -0.4%
North America 550 586 547 531 512 -2.2%
United States 498 533 501 491 469 -2.1%
Central and South America 90 88 91 87 87 -0.3%
Europe 224 220 218 218 218 -0.1%
European Union 183 178 173 170 168 -0.9%
Middle East 1 1 1 1 1 -0.1%
Eurasia 396 406 418 422 429 0.9%
Russia 296 314 320 324 331 0.9%
Africa 216 224 234 242 251 1.9%
World 5 213 5 373 5 389 5 432 5 418 0.1%
*Estimated.
© O
EC
D/IE
A, 2
018

ANNEX A. DATA TABLES
134 COAL 2018
Table A.5. Thermal coal and lignite production (Mtce), 2016-23
2016 2017* 2019 2021 2023 CAAGR
Asia Pacific 2 934 3 044 3 077 3 141 3 137 0.5%
China 1 872 1 951 1 932 1 984 1 946 0.0%
India 378 386 418 453 490 4.1%
Australia 233 235 236 237 237 0.2%
Indonesia 352 372 386 364 362 -0.5%
North America 475 494 467 455 437 -2.0%
United States 449 469 450 440 424 -1.7%
Central and South America 86 83 86 82 82 -0.1%
Europe 205 202 199 199 199 -0.2%
European Union 164 160 155 152 150 -1.1%
Middle East 0 0 0 0 0 -0.5%
Eurasia 295 307 304 308 313 0.3%
Russia 215 230 225 229 235 0.3%
Africa 208 212 220 226 233 1.6%
World 4 203 4 343 4 352 4 411 4 403 0.2%
*Estimated.
Table A.6. Met coal production (Mtce), 2016-23
2016 2017* 2019 2021 2023 CAAGR
Asia Pacific 801 804 804 790 784 -0.4%
China 584 582 584 560 551 -0.9%
India 10 9 9 9 9 -0.2%
Australia 184 185 184 196 201 1.4%
Mongolia 19 25 23 21 19 -4.0%
North America 75 92 81 76 75 -3.4%
United States 49 65 51 51 45 -5.8%
Central and South America 4 6 5 5 5 -3.0%
Europe 19 18 19 19 19 0.5%
European Union 19 18 18 18 18 0.4%
Middle East 1 1 1 1 1 0.0%
Eurasia 102 99 114 114 115 2.7%
Russia 81 84 95 96 97 2.5%
Africa 8 12 14 16 17 6.5%
Mozambique 4 7 9 11 13 11.4%
World 1 010 1 030 1 037 1 021 1 015 -0.2%
*Estimated.
© O
EC
D/IE
A, 2
018

ANNEX A. DATA TABLES
COAL 2018 135
Table A.7. Seaborne steam coal imports (Mtce), 2016-23
2016 2017* 2019 2021 2023 CAAGR
Europe 122 115 102 95 87 -4.5%
Japan 115 117 118 113 111 -1.0%
Korea 81 93 95 92 91 -0.4%
Chinese Taipei 50 52 54 54 56 1.1%
China 152 144 135 116 106 -4.9%
India 105 119 123 129 135 2.2%
South Asia 73 86 101 122 140 8.5%
Other 55 54 76 60 57 1.0%
Total 754 779 803 780 782 0.1%
*Estimated.
Table A.8. Seaborne thermal coal exports (Mtce), 2016-23
2016 2017* 2019 2021 2023 CAAGR
Australia 178 176 176 179 181 0.5%
South Africa 66 67 72 74 77 2.5%
Indonesia 295 310 316 284 273 -2.1%
Russia 103 113 118 122 128 2.2%
Colombia 77 76 76 72 72 -0.9%
United States 14 25 30 28 29 2.2%
Other 22 13 15 20 22 9.2%
Total 754 779 803 780 782 0.1%
*Estimated.
Table A.9. Seaborne met coal imports (Mtce), 2016-23
2016 2017* 2019 2021 2023 CAAGR
Europe 57 59 58 57 57 -0.4%
Japan 46 45 44 43 41 -1.5%
Korea 34 35 36 38 39 2.0%
China 34 32 36 40 36 2.3%
India 47 49 58 65 74 7.2%
Other 36 39 35 36 36 1.3%
Total 254 258 268 279 285 1.7%
*Estimated.
© O
EC
D/IE
A, 2
018

ANNEX A. DATA TABLES
136 COAL 2018
Table A.10. Seaborne met coal exports (Mtce), 2016-23
2016 2017* 2019 2021 2023 CAAGR
Australia 183 172 181 193 198 2.4%
Canada 25 24 23 18 23 -1.3%
Mozambique 4 7 9 11 13 10.6%
Russia 15 15 18 18 19 3.7%
United States 23 34 31 31 26 -4.7%
Other 5 5 6 6 7 4.8%
Total 254 258 268 279 285 1.7%
*Estimated.
© O
EC
D/IE
A, 2
018

ANNEX B. CURRENT COAL MINING PROJECTS
COAL 2018 137
ANNEX B. CURRENT COAL MINING PROJECTS
Country Project Company Type Earliest
proposed start-up
Estimated capacity (Mtpa)
Resource Status
Australia Alpha Coal Project GVK Hancock N 2021 32 TC LA
Australia Appin Area 9 South32 E 2016 3.5 CC MA
Australia Arcturus Adamelia Resources N 2023+ 5 TC LA
Australia Alpha North Coal Project Waratah Coal N .. 40 TC LA
Australia Alpha West Coal Project GVK Hancock N .. 40 TC LA
Australia Ashton South East open-cut Yancoal Australia E 2017 3.6 TC, PCI LA
Australia Baralaba South Cockatoo Coal E 2019 4 PCI, TC LA
Australia Belview Stanmore Coal N 2023+ 0 CC LA
Australia Bluff Carabella Resources N 2017 1.2 PCI LA
Australia Broughton Coal Project U&D Mining Industry N 2018 3 CC LA
Australia Bundi MetroCoal N 2020 5 TC LA
Australia Byerwen Coal Project Qcoal/JFE Steel N 2018 10 CC, TC MA
Australia Bylong Coal Project Kepco N 2020 6.5 TC LA
Australia Carmichael Coal Project Adani N 2020 25 TC LA
Australia Caval Ridge Expansion BHP Billiton / Mitsubishi Alliance E 2019 7.2 CC MA
Australia China First (Galilee Coal project) Waratah Coal N 2022 40 TC LA
Australia China Stone MacMines Austasia N 2021 38 TC LA
Australia Clifford Stanmore Coal N .. 5 TC LA
Australia Clyde Park Project Clyde Park Coal Pty Ltd N .. 1.75 TC LA
Australia Codrilla Peabody N 2022 3.2 PCI LA
Australia Colton New Hope Group N 2023+ 0.5 CC LA
Australia Columboola Project SincoCoal And MetroMining N 2023+ 5 TC LA
Australia Comet Ridge Acacia Coal N 2016 0.4 TC, CC LA
Australia Curragh Extension Wesfarmers E 2018 10 CC, PCI LA
Australia Dawson West Civil & Mining Resources N .. 1.6 TC LA
Australia Dysart East Dysart Coal N .. 1.4 CC LA
Australia Eagle Downs Aquila Resources / Vale N 2023+ 4.5 CC MA
Australia Eaglefield Peabody Energy E .. 5 CC LA
Australia Elimatta New Hope N 2023+ 5 TC LA
Australia Ellensfield Ellensfield Coal Management N 2023+ 4.7 TC LA
Australia Wilton-Fairhill Wilton Coking Coal N .. .. CC LA
Australia Grosvenor West Carabella Resources N .. 3.5 TC, CC LA
Australia Kevin's Corner GVK N 2019 30 TC LA
Australia Moranbah South Anglo American / Exxaro N 2021 18 CC LA
Australia Moorlands Cuesta Coal N 2018 1.6 TC LA
Australia New Acland (Stage 3) New Hope Coal E 2019 7.5 TC LA
Australia New Lenton New Hope Coal N .. 2 CC LA
© O
EC
D/IE
A, 2
018

ANNEX B. CURRENT COAL MINING PROJECTS
138 COAL 2018
Country Project Company Type Earliest
proposed start-up
Estimated capacity (Mtpa)
Resource Status
Australia North Galilee Project FTB and Orion Mining N 2022 7 TC LA
Australia Okay Creek (Phase 2) Glencore, Sumisho, Itochu, Icra OC E 2018 20.9 CC LA
Australia Olive Downs Nippon Steel and Sumitomo Metal N 2023+ 14 TC, CC LA
Australia Red Hill Mining BHP Billiton / Mitsubishi Alliance N 2023+ 14.5 TC, CC LA
Australia Rolleston Expansion Project Glencore, Sumisho, IRCA E .. 19 TC LA
Australia Sarum Glencore, Itochu, Sumisho N .. 4.2 CC LA
Australia Saraji East BHP and Mitsubishi N 2023+ 7 CC LA
Australia South Burnett MRV Tarong Basin Coal N 2019 12.5 TC LA
Australia South Galilee Alpha Coal Management N 2023+ 17.5 TC LA
Australia Springsure Creek Adamelia Resources N 2023+ 7 TC LA
Australia Spur Hill Malabar Coal N 2023+ 6 TC, CC LA
Australia Styx Waratah Coal, Queensland Nickel N .. 1.5 TC, PCI LA
Australia Talwood Baosteel Resources Australia N 2023+ 3.6 TC, PCI, CC LA
Australia Taroborah Shenhua Energy N 2018 5.73 TC LA
Australia Teresa United Mining Group N .. 6 PCI, TC LA
Australia The Hume Coal Project POSCO N 2020 3.4 TC LA
Australia The Range Project Stanmore Coal N 2023+ 5 TC LA
Australia Togara North Glencore N .. 6 TC LA
Australia Vickery Whitehaven N 2024+ 4.5 TC LA
Australia Karin Vitrinite / Itochu Corporation N .. .. CC LA
Australia Wallarah 2 Coal Project Kores N 2024+ 5 TC LA
Australia Wandoan (Phase 1) Glencore, ICRA, Wandoan, umisho N 2024+ 22 TC LA
Australia Wards Well BHP Billiton / Mitsubishi Alliance N 2017 5 CC LA
Australia Washpool Aquila Resources N 2023+ 2.9 CC LA
Australia Watermark Shenhua Energy N 2023+ 6.15 TC LA
Canada Carbon Creek Cardero Coal N 2022 4.1 CC LA
Canada EB Wolverine (Perry Creek) Walter Energy E 2020 1.5 CC LA
Canada Crown Mountain Jameson Resources N 2019 1.7 CC LA
Canada Central South Glencore 0 2023 2.14 CC LA
Canada Roman Mountain Anglo American N 2022 2.84 CC LA
Canada Donkin Kameron Collieries ULC E 2021 2.75 CC MA
Canada Elko Pacific American Coal N .. .. .. LA
Canada Tent Hill Montem N .. 1.5 CC LA
Canada Echo Hill Hillsborough Resources N .. 1 TC LA
Canada Grand Cache Sonicfield Global E 2018 2.3 CC MA
Canada Grassy Mountain Riversdale Resources N 2021 3.9 CC LA
Canada Groundhog Atrum Coal N .. 0.88 A LA
Canada Murray River HD Mining N 2018 6 CC LA
© O
EC
D/IE
A, 2
018

ANNEX B. CURRENT COAL MINING PROJECTS
COAL 2018 139
Country Project Company Type Earliest
proposed start-up
Estimated capacity (Mtpa)
Resource Status
Canada Quintette Teck Resources N 2022 3.5 CC LA
Canada Tenas Allegiance Coal / Itochu N .. 0.75 CC LA
Canada Willow Creek Walter Energy E 2018 1.7 CC, PCI MA
Canada Sukunka Glencore N .. 3 CC LA
Colombia Cañaverales Yildirim Holding N 2019 2.5 TC LA
Colombia Cerrejón P40 Cerrejón E 2018 8 TC MA
Colombia El Descanso Drummond E .. 12 TC LA
Colombia Papayal Yildirim Holding N 2017 2.5 TC LA
Colombia San Juan Yildirim Holding N 2019 16 TC LA
Indonesia Bumi Barito Mineral Cokal N 2018 2 CC, PCI MA
Indonesia East Kutai Coal Project Churchill Mining / Ridlatama Group N .. 30 TC LA
Indonesia Adaro MetCoal Companies (AMC) Concessions Adaro N .. 20 CC LA
Indonesia Mitra Energi Agung Indika N .. .. TC LA
Indonesia Mustika Indah Permai Adaro N .. .. TC LA
Indonesia Arni Bersaudara PT Arni Bersaudara N 2023 1 TC LA
Indonesia Pakar North Kangaroo Resources N 2020 9 TC LA
Indonesia Pakar South Kangaroo Resources N .. .. TC LA
Indonesia Graha Panca Karsa Kangaroo Resources N .. .. TC LA
Indonesia Bukit Enim Energi Adaro N .. .. TC LA
Indonesia Tekno Orbit Persada MEC Coal N .. 17 TC LA
Mozambique Benga Extension ICVL E 2021 15 CC LA
Mozambique Midwest Beacon Hill Resources N .. 7 TC LA
Mozambique Moatize Vale/Mitsui E 2017 8 TC, CC MA
Mozambique Ncondezi Ncondezi Energy N 2018 7 TC LA
Mozambique Revuboe Nippon Steel and Sumitomo Metal N .. 7 TC, CC LA
Mozambique Zambeze ICVL N .. .. CC LA
Russia Amaam Tiger Realm Coal E 2022 2 CC MA
Russia Denisovskaya East Kolmar N 2018 4 CC MA
Russia Elegest OPK N 2020 1.3 CC LA
Russia Elga Mechel E 2018 11.7 TC, CC MA
Russia Inaglinsky-1 Kolmar N 2017 4 CC MA
Russia Inaglinsky-2 Kolmar N .. 8 CC LA
Russia Karakansky (Stage III) Karakan Invest N 2019 3 TC LA
Russia Yubileynaya TopProm E 2021 2 CC LA
Russia Sibirskaya Sibuglemet N 2023 0.5 TC LA
Russia Usinsky-3 NLMK N 2018 4.3 CC LA
Russia Zhernovskoye-1 NLMK N 2018 5.7 CC LA
Russia Zhernovski Gluboki NLMK N .. .. CC LA
© O
EC
D/IE
A, 2
018

ANNEX B. CURRENT COAL MINING PROJECTS
140 COAL 2018
Country Project Company Type Earliest
proposed start-up
Estimated capacity (Mtpa)
Resource Status
Russia Solntsevsky Solntsevsky Coal Mine LLC E 2020 10 TC LA
Russia Butovskaya Industrial Metallurgical Holding E .. 0.9 CC MA
Russia Tikhova Industrial Metallurgical Holding N 2018 3.4 CC MA
South Africa Argent Glencore/Shanduka N 2018 1.2 TC LA
South Africa Belfast Exxaro N 2019 2.7 TC MA
South Africa Boikarabelo Resource Generation N 2020 6 TC MA
South Africa Brakfontein Universal Coal N .. 1.2 TC LA
South Africa De Wittekrans Canyon Coal N 2018 0.4 TC MA
South Africa Grootegeluk 6 Phase 2 Exxaro Resources N 2020 1.7 TC MA
South Africa Impumelelo Sasol Mining N 2019 8.5 TC MA
South Africa Kangala Universal Coal E .. 3.3 TC MA
South Africa Leeuwpan Exxaro E 2018 2.7 TC, CC MA
South Africa Klipfontein Genet South Africa N .. 1 TC LA
South Africa Koornfontein OC Glencore/Optimum E .. 3.3 TC ..
South Africa Mafube Exxaro/Anglo American E 2019 3.1 TC MA
South Africa Makhado Coal of Africa E 2020 1.7 TC, CC MA
South Africa Moabsvelden Wescoal N 2018 1.1 TC MA
South Africa New Largo Seriti/Coalzar/IDC N .. 12 TC LA
South Africa Optimum Coal Mine Tegeta E .. 12 TC MA
South Africa Shondoni Sasol Mining N 2018 9.2 TC MA
South Africa Thabametsi Exxaro N 2020 3.9 TC MA
South Africa Vele Coal of Africa E 2019 3.43 TC, CC MA
Mongolia Erdenebulag Aspire Mining N .. .. TC ..
Mongolia Nuurstei Aspire Mining N 2019 1 CC LA
Mongolia Shinejinst Gobi Coal and Energy N 2018 1.35 CC MA
Mongolia Tavan Tolgoi Extension Erdenes Tavan Tolgoi E 2019 19 CC LA
Mongolia Ovoot Aspire Mining N 2020 10 CC LA
United States Blue Creek Number 1 Warrior Met Coal E 2020 6.67 CC LA
United States Berwind Ramaco Resources, Inc. N 2018 0.9 CC MA
United States Knox Creek Ramaco Resources, Inc. N 2017 0.1 CC MA
United States RAM Mining (PA) Ramaco Resources, Inc. N 2019 0.5 CC LA
United States Whigville B&N Coal Co. Inc. N 2017 0.2 TC MA
United States Poplar Grove Mine Paringa Resources Ltd. N 2018 3.5 TC MA
United States Panther Eagle Alpha Natural Resources N 2017 0.57 CC MA
United States Cypress Mine Paringa Resources Ltd. N 2021 4.7 TC LA
Notes: The table lists currently discussed mining projects according to publicly available information but has no claim to completeness. Data on the start-up data is according to public information but does not necessarily represent our view concerning expected export capacity additions. Data on the estimated capacity represent the targeted capacity, which is often not available in the year of start-up.
Type: N = New project, E = Expansion.
Resource: TC = thermal coal, CC = coking coal, AN = anthracite, PCI = pulverised coal injection.
Status: MA = More advanced, LA = Less advanced.
© O
EC
D/IE
A, 2
018

GLOSSARY
COAL 2018 141
GLOSSARY
Definitions Coal: Coal is a solid, combustible, fossil sedimentary rock. Coals come from buried vegetation transformed by the action of high pressure and temperature over millions of years.
Coal rank: The degree of transformation from the original plant source. It is loosely related to the age of the coal and is mainly determined from random reflectance of the vitrinite, one of coal’s organic components. The ranks of coal, in decreasing order of transformation from high to low, are: anthracite, bituminous coal, sub-bituminous coal, lignite and peat. This report more simply distinguishes between either hard coal (anthracite, bituminous and sub-bituminous coal) and lignite. Peat is not considered coal in this report.
Coal classifications: Refers to a whole range of ages, compositions and properties. There are many different classifications used around the world. The main parameter used for classifying coal is its rank (from anthracite to lignite), but final destination is also used (thermal coal versus metallurgical coal).
Coal quality: Consists of a large variety of properties exhibited by coal when it is used. Calorific value and impurity content are the main parameters defining the quality of thermal coal, whereas caking properties, resistance and impurity content are the main ones for coking coal.
Thermal (or steam) coal: In this report, refers to hard coal used for purposes other than metallurgy.
Coking coal: High-quality coal used to produce the coke utilised in blast furnaces to produce pig iron. The terms metallurgical coal and coking coal are sometimes used interchangeably.
Semi-soft coal: High-quality steam coal mixed with coking coal to produce coke for blast furnaces.
Pulverised coal injection (PCI) coal: A high-quality steam coal injected into a blast furnace to reduce coke consumption.
Metallurgical coal: In this report, it refers to coking coal, semi-soft coal and pulverised coal Injection (PCI) coal. Although anthracite is often used for metallurgical purposes, in this report it is classified as thermal coal.
Tonne of coal equivalent (tce): A unit of energy widely used internationally in the coal industry, defined as 7 million kilocalories (kcal). Therefore, the relationship between tce and physical tonnes depends on the net calorific value of the coal. One tonne of coal with a net calorific value of 7 000 kilocalories per kilogramme (kcal/kg) represents 1 tce.
Coal mining: A technique used in the removal of coal from a deposit. As coal deposits occur in the earth’s crust at various seam configurations and depths, the condition of the deposit determines the mining method used. Generally, deep deposits are mined by underground mining and shallow deposits are mined by open-cast mining. The strip ratio largely determines whether an open-cast mine is profitable or not.
Strip ratio: The overburden, or waste material (usually expressed in cubic metres [m3]), to be removed per unit of coal extracted (usually in tonnes). High strip ratios therefore make open-cast mining unprofitable.
© O
EC
D/IE
A, 2
018

GLOSSARY
142 COAL 2018
Open-cast mining: A mining method whereby the overburden is first drilled, then blasted, and finally removed. Once access has been gained, coal is removed in a similar way. For removal, truck and power/electric shovel, and sometimes conveyor belts, may be used as well as some extremely large mining machinery, such as draglines or bucket wheels. Open-cast mining is usually less labour-intensive than underground mining, but has higher consumable costs, e.g. tyres, diesel, explosives. Generally, it implies greater environmental impact than underground mining.
Underground mining: A mining method in which coal seam access is gained through shafts, galleries and tunnels. Although there are many ways to mine a coal deposit underground, coal is usually stripped by automatic shearers or continuous miners using either short/long walls or room-and-pillar exploitations. Underground mining is generally more labour-intensive and requires higher capital investments than open-cast mining.
Coal washing/upgrading: A process in which undesirable constituents (i.e. ash, moisture) are partially removed from raw coal to produce higher-quality coal.
© O
EC
D/IE
A, 2
018

REGIONAL AND COUNTRY GROUPINGS
COAL 2018 143
REGIONAL AND COUNTRY GROUPINGS
Coal 2018 main regional groupings
North America Canada, Mexico and the United States.
Central and South America
Argentina, Plurinational State of Bolivia (Bolivia), Brazil, Chile, Colombia, Costa Rica, Cuba, Curaçao, the Dominican Republic, Ecuador, El Salvador, Guatemala, Haiti, Honduras, Jamaica, Nicaragua, Panama, Paraguay, Peru, Suriname, Trinidad and Tobago, Uruguay, the Bolivarian Republic of Venezuela (Venezuela) and other Central and South American countries and territories.1
Europe Includes the EU regional grouping and Albania, Bosnia and Herzegovina, Iceland, the Former Yugoslav Republic of Macedonia, Gibraltar, Kosovo, Montenegro, Norway, Serbia, Switzerland and Turkey.
1 Individual data are not available and are estimated in aggregate for: Antigua and Barbuda, Aruba, the Bahamas, Barbados, Belize, Bermuda, Bonaire, the British Virgin Islands, the Cayman Islands, Dominica, the Falkland Islands (Malvinas), French Guiana, Grenada, Guadeloupe, Guyana, Martinique, Montserrat, Saba, Saint Eustatius, Saint Kitts and Nevis, Saint Lucia, Saint Vincent and the Grenadines, Saint Maarten, and the Turks and Caicos Islands.
© O
EC
D/IE
A, 2
018

REGIONAL AND COUNTRY GROUPINGS
144 COAL 2018
European Union (EU)
Austria, Belgium, Bulgaria, Croatia, Cyprus,2,3 the Czech Republic, Denmark, Estonia, Finland, France, Germany, Greece, Hungary, Ireland, Italy, Latvia, Lithuania, Luxembourg, Malta, the Netherlands, Poland, Portugal, Romania, the Slovak Republic, Slovenia, Spain, Sweden and the United Kingdom.
Africa
Algeria, Angola, Benin, Botswana, Cameroon, the Republic of the Congo (Congo), Côte d’Ivoire, the Democratic Republic of the Congo, Egypt, Eritrea, Ethiopia, Gabon, Ghana, Kenya, Libya, Mauritius, Morocco, Mozambique, Namibia, Niger, Nigeria, Senegal, South Africa, South Sudan, Sudan, the United Republic of Tanzania (Tanzania), Togo, Tunisia, Zambia, Zimbabwe and other African countries and territories.4
Middle East Bahrain, the Islamic Republic of Iran (Iran), Iraq, Israel,5 Jordan, Kuwait, Lebanon, Oman, Qatar, Saudi Arabia, the Syrian Arab Republic (Syria), the United Arab Emirates and Yemen.
Eurasia
Armenia, Azerbaijan, Belarus, Georgia, Kazakhstan, Kyrgyzstan, the Republic of Moldova, the Russian Federation (Russia), Tajikistan, Turkmenistan, Ukraine and Uzbekistan.
Asia Pacific
Includes the Southeast Asia regional grouping and Australia, Bangladesh, China, India, Japan, Korea, the Democratic People’s Republic of Korea, Mongolia, Nepal, New Zealand, Pakistan, Sri Lanka, Chinese Taipei and other countries and territories.6
China
Refers to the People's Republic of China, including Hong Kong.
Southeast Asia
Brunei Darussalam, Cambodia, Indonesia, the Lao People’s Democratic Republic (Lao PDR), Malaysia, Myanmar, the Philippines, Singapore, Thailand and Viet Nam. These countries are all members of the Association of Southeast Asian Nations (ASEAN).
2 Note by Turkey: The information in this document with reference to “Cyprus” relates to the southern part of the Island. There is no single authority representing both Turkish and Greek Cypriot people on the Island. Turkey recognises the Turkish Republic of Northern Cyprus (TRNC). Until a lasting and equitable solution is found within the context of United Nations, Turkey shall preserve its position concerning the “Cyprus issue”. 3 Note by all the European Union Member States of the OECD and the European Union: The Republic of Cyprus is recognised by all members of the United Nations with the exception of Turkey. The information in this document relates to the area under the effective control of the Government of the Republic of Cyprus. 4 Individual data are not available and are estimated in aggregate for: Burkina Faso, Burundi, Cabo Verde, the Central African Republic, Chad, Comoros, Djibouti, Equatorial Guinea, Gambia, Guinea, Guinea-Bissau, Lesotho, Liberia, Madagascar, Malawi, Mali, Mauritania, Réunion, Rwanda, Sao Tome and Principe, the Seychelles, Sierra Leone, Somalia, Swaziland, Uganda and Western Sahara. 5 The statistical data for Israel are supplied by and under the responsibility of the relevant Israeli authorities. The use of such data by the OECD and/or the IEA is without prejudice to the status of the Golan Heights, East Jerusalem and Israeli settlements in the West Bank under the terms of international law. 6 Individual data are not available and are estimated in aggregate for: Afghanistan, Bhutan, Cook Islands, Fiji, French Polynesia, Kiribati, the Lao People’s Democratic Republic, Macau (China), Maldives, New Caledonia, Palau, Papua New Guinea, Samoa, Solomon Islands, Timor-Leste and Tonga and Vanuatu.
© O
EC
D/IE
A, 2
018

LIST OF ACRONYMS, ABBREVIATIONS AND UNITS OF MEASURE
COAL 2018 145
LIST OF ACRONYMS, ABBREVIATIONS AND UNITS OF MEASURE
Acronyms and abbreviations API Argus/McCloskey’s Coal Price Index
ARA Amsterdam-Rotterdam-Antwerp (price index)
ASEAN Association of Southeast Asian Nations
AUSC advanced ultra-supercritical
B-BBEE Broad-Based Black Economic Empowerment (South Africa)
BBM Bumi Barito Mineral coal project
BFI blast furnace iron
BPDB Bangladesh Power Development Board
BSPI Bohai-Rim Steam Coal Price Index
CAAGR compound average annual growth rate
CCEA Cabinet Committee on Economic Affairs (India)
CCGT combined-cycle gas turbine
CCS carbon capture and storage
CCUS carbon capture, utilisation and storage
CFR cost and freight
CGGC China Gezhouba Group International Engineering Co.
CHP combined heat and power
CIF cost, insurance and freight
CIL Coal India Limited
CMNA Coal Mines Nationalization Act (India)
CO carbon monoxide
CO2 carbon dioxide
DES delivered ex ship
DMO domestic market obligation
dwt deadweight tonnage
EIA Energy Information Administration
EIS environmental impact statement
EOR enhanced oil recovery
© O
EC
D/IE
A, 2
018

LIST OF ACRONYMS, ABBREVIATIONS AND UNITS OF MEASURE
146 COAL 2018
ETT Erdenes Tavan Tolgoi mining company (Mongolia)
EU European Union
EU ETS European Union Emissions Trading System
FOB free on board
FSA fuel supply agreement
GAR gross as received
GDP gross domestic product
GPK Graha Panca Karsa concession
HBA coal price reference (Harga Batubara Acuan)
HPB benchmark coal price (Harga Patokan Batubara)
HDSA historically disadvantaged South African
HESC Hydrogen Energy Supply Chain project
ICI Indonesian Coal Index
ICVL International Coal Ventures Private Limited
IEA International Energy Agency
IGCC integrated gasification combined cycle
IGFC integrated gasification fuel cell
IMF International Monetary Fund
IMH Industrial Metallurgical Holding
IMO International Maritime Organisation
IPO initial public offering
IPCC Intergovernmental Panel on Climate Change
IPP independent power producer
KHW Katowicki Holding Węglowy mining company (Poland)
LNG liquefied natural gas
met metallurgical
MMC Mongolian Mining Corporation
MOU memorandum of understanding
MTCMR Medium-Term Coal Market Report
NDRC National Development and Reform Commission (China)
NEA National Energy Administration (China)
NLC Nacala Logistics Corridor (Mozambique)
© O
EC
D/IE
A, 2
018

LIST OF ACRONYMS, ABBREVIATIONS AND UNITS OF MEASURE
COAL 2018 147
NOX nitrogen oxide
OECD Organisation for Economic Co-operation and Development
OTC over the counter
PCI pulverised coal injection
PGE Polska Grupa Energetyczna (Polish Energy Group)
PGG Polska Grupa Górnicza mining company (Poland)
PGNiG Polskie Górnictwo Naftowe i Gazownictwo oil and gas company (Poland)
PLN Perusahaan Listrik Negara corporation (Indonesia)
PM particulate matter
PNL Paringa Resources Ltd
PV photovoltaic
RBCT Richards Bay Coal Terminal
RMCFA Reinforced Model for Coal Flow Analysis
ROW rest of world
SAEC South Africa Energy Coal
SCCL Singareni Collieries Company Limited (India)
SO2 sulphur dioxide
SSCC semi-soft coking coal
SUEK Siberian Coal Energy Company
TFR Transnet Freight Rail (South Africa)
TML Thai Mozambique Logistica
TPES total primary energy supply
TTF Title Transfer Facility
UHV ultra-high voltage
UK United Kingdom
ULV-PCI ultra-low volatile pulverised coal injection
US United States
USC ultra-supercritical
y-o-y year-on-year
WICET Wiggins Island Coal Export Terminal
© O
EC
D/IE
A, 2
018

LIST OF ACRONYMS, ABBREVIATIONS AND UNITS OF MEASURE
148 COAL 2018
Currency codes AUD Australian dollar
CNY Chinese yuan renminbi
COP Colombian peso
IDR Indonesian rupiah
RUB Russian ruble
USD United States dollar
ZAR South African rand
Units of measure bbl barrel
bcm billion cubic metres
Bt billion metric tonnes
°C degrees Celsius
dwt deadweight tonnage
g gramme
g/kWh grammes per kilowatt hour
Gt gigatonne
GW gigawatt
GWh gigawatt hour
kcal kilocalories
kg kilogramme
km kilometre
kW kilowatt
kWh kilowatt hours
m metre
m3 cubic metre
MBtu million British thermal units
mg milligramme
MJ megajoule
Mt million tonnes
Mtce million tonnes of coal equivalent
MtCO2 million tonnes of carbon dioxide
© O
EC
D/IE
A, 2
018

LIST OF ACRONYMS, ABBREVIATIONS AND UNITS OF MEASURE
COAL 2018 149
Mtpa million tonnes per annum
MW megawatt
MWh megawatt hour
Nm3 normal cubic metre
t tonne
TWh terawatt hours
µg microgramme

Onl
in
e bookshopPDF versions at 20% discount
web
store
.iea.org
Inte
rnat
iona
l Energy Agency
Secure Sustain
able T
oget
her
World Energy Outlook series
World Energy
Investment series
Energy Statistics series
Energy Policiesof IEA
Countriesseries
Energy Technology
Perspectives series
E-mail: books@
iea.org
Market ReportSeries
Oil
Coal
RenewableEnergy Energy
Efficiency
Gas
Global Gas Security series
EnergyPolicies
Beyond IEA Countriesseries

This publication reflects the views of the IEA Secretariat but does not necessarily reflect those of individual IEA member countries. The IEA makes no representation or warranty, express or implied, in respect of the publication’s contents (including its completeness or accuracy) and shall not be responsible for any use of, or reliance on, the publication.
Unless otherwise indicated, all material presented in figures and tables is derived from IEA data and analysis.
This publication and any map included herein are without prejudice to the status of or sovereignty over any territory, to the delimitation of international frontiers and boundaries and to the name of any territory, city or area.
IEA/OECD possible corrigenda on: www.oecd.org/about/publishing/corrigenda.htm
IEA PublicationsInternational Energy Agency
Website: www.iea.orgContact information: www.iea.org/about/contact
Typeset in France by IEA - December 2018Cover design: IEA; Photo credits: © GraphicObsession

€80 (61 2018 21 1E1)ISSN: 2520-2723
ISBN: 978-92-64-30680-6
9HSTCQE*dagiag+
COAL 2O18Analysis and Forecasts to 2O23
Ma
rk
et
Re
po
rt
Se
rie
s
Coal remains a major component of global fuel supplies, accounting for 27% of
all energy used worldwide and making up 38% of electricity generation. It plays
a crucial role in industries such as iron and steel. But concerns about air pollution
and greenhouse gas emissions cloud the future of coal. Coal 2018: Analysis and
Forecasts to 2023 addresses these key questions and more:
n Do China’s policies to limit urban coal use to ramp up natural gas and renewables
mean it is abandoning coal?
n Will the push for renewables in India lead to a peak in Indian coal demand?
n How significant will the growth in coal demand be in other parts of developing
Asia?
n How likely is it that coal demand will continue to decline in the United States
and Europe? Will this trend spread to other parts of the world?
n Will robust demand and high prices for seaborne coal lead to new investment in
coal mining?
This year’s annual IEA coal market report also presents recent trends and the IEA’s
five-year forecasts for global coal supply, demand, and trade.