Embed Size (px)
Citation preview
Market power and stability of CEE
banks
Ivan Huljak
Croatian National Bank – Financial Stability Department
19th Dubrovnik Economic conference
14/6/2013
2
Contents
Motivation
Stylized facts – standard banking data vs. empirical
indicators
Testing the competition – stability and related hypothesis
Conclusion and discussion
3
Motivation

Competition – fragility view –banks with market power
have higher opportunity cost of defaulting – they protect
their franchise value so they are more stable
Competition – stability view –banks with market power
have higher prices leading to increased risk in clients`
balance sheet which shifts into banks` balance sheet – risk
shifting paradigm
So which one is it? Theory allows both, empirical studies
confirm both
CEE countries - Swiss franc loans as a memory of the
period of increased competition (Others are doing it…)
Failing to reach an agreement…
Researchers started asking philosophical questions:
- Is the relationship linear?
- Is it necessarily intuitive?
- Is it case dependent?
- Is it to complex to understand?
…
While in the same time not having any doubt in Z-score or Lerner
index as indicators.
Beck (2011): Raises the question of spurious relationship between
some indicators and concludes that bank level research on this matter
offers most inconsistent findings

Stylized facts – standard banking data vs.
empirical indicators
6
7
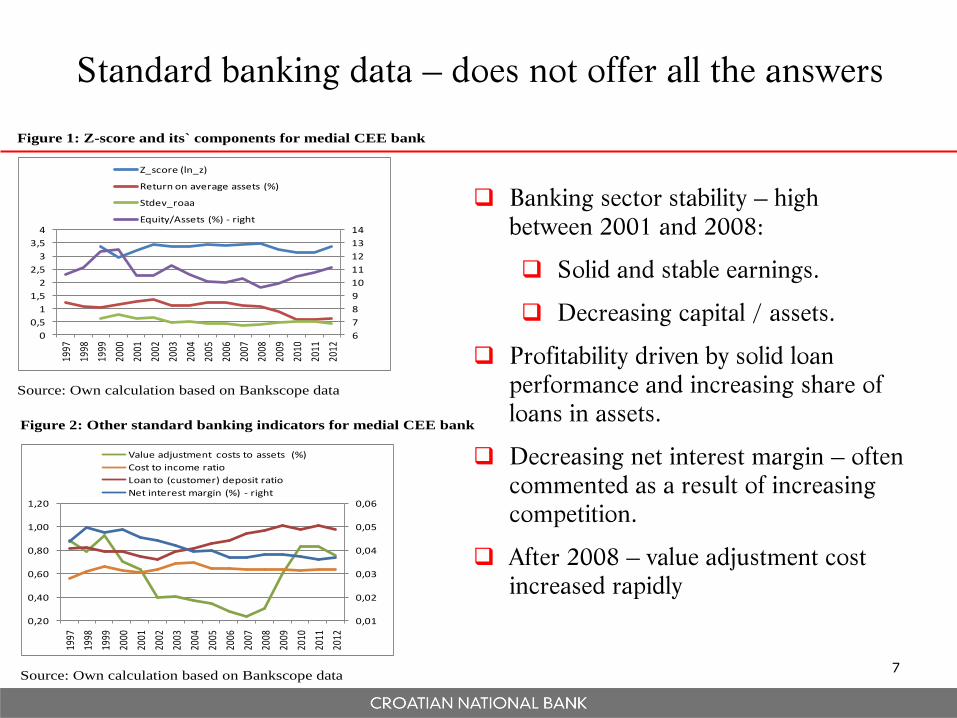
Standard banking data – does not offer all the answers
Banking sector stability – high
between 2001 and 2008:
Solid and stable earnings.
Decreasing capital / assets.
Profitability driven by solid loan
performance and increasing share of
loans in assets.
Decreasing net interest margin – often
commented as a result of increasing
competition.
After 2008 – value adjustment cost
increased rapidly
Figure 1: Z-score and its` components for medial CEE bank
6
7
8
9
10
11
12
13
14
0
0,5
1
1,5
2
2,5
3
3,5
4
1997
1998
1999
2000
2001
2002
2003
2004
2005
2006
2007
2008
2009
2010
2011
2012
Z_score (ln_z)
Return on average assets (%)
Stdev_roaa
Equity/Assets (%) - right
Source: Own calculation based on Bankscope data
Figure 2: Other standard banking indicators for medial CEE bank
0,01
0,02
0,03
0,04
0,05
0,06
0,20
0,40
0,60
0,80
1,00
1,20
1997
1998
1999
2000
2001
2002
2003
2004
2005
2006
2007
2008
2009
2010
2011
2012
Value adjustment costs to assets (%)
Cost to income ratio
Loan to (customer) deposit ratio
Net interest margin (%) - right
Source: Own calculation based on Bankscope data
8
Lerner index
Bank specific market power indicator derived from the microeconomic
theory.
Formula:
Popular, intuitive, easy to calculate providing we know marginal cost.
However, one has to keep in mind its specificity.
What does it really show?
It shows market power for a bank that uses market power to increase
prices!!!
It is closely related to profitability and could result in mechanical rather
than economical relationship with Z-score, net-interest margin, implicit
loan rates.
P
MCPL
9
Competition efficiency frontier (CEF)
Bolt and Humphrey (2010) to investigate competition in non-loan activities
Kraft and Huljak (2011) to investigate competition on different segments of the
same market
Advantage – not calculated from the prices, allows the possibility of non-pricing
strategy of a bank with market power
However, it is a relative indicator and it shows the power compared with the
weakest bank on the market
Technically, it is an efficiency measure (efficiency of the competition to restrain
the revenue) – Distribution free approach to dismantle error (in-efficiency and
random term) – random term will average out in 5 or 6 years
5
1
5
1
2
1
2
1
2
1
2
1
5
1
5
1
0 lnln2/1lnlnlnln2/1ln)ln(i i k m
mkkm
k
kk
k
kik
i
jiij
i
iii PPPPXxXXY
uePXXRocrev kji lnln)ln,ln,(ln)/ln(
1)/(1)lnexp(ln minmin uuuuCE iii

10
Other data – x-efficiency and franchise value
X-efficiency (Berger and Hannan, 1998) – to measure managerial cost
efficiency
Combines alocative and technical efficiency in unknown (X) ratio.
Not driven by economies of scale.
Calculated from translog function, DFA
Franchise value – approximating market value by discounting net income with
average cost of capital
,,, ijij
ij
ij
ij
ij
ij
ij EQBVAWACC
OPMVAL
BVA
MVAFV
with FV - franchise value, MVA - market value, BVA - book value,
OP - operating profit, WACC - weighted average cost of capital,
EQ - balance sheet equity.
11
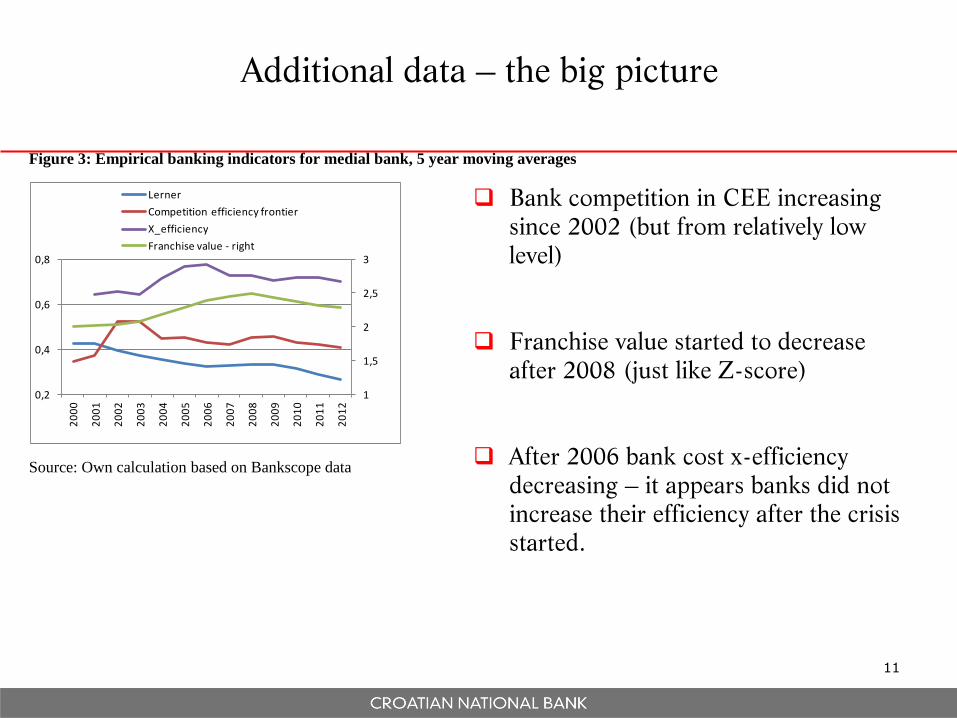
Additional data – the big picture
Bank competition in CEE increasing
since 2002 (but from relatively low
level)
Franchise value started to decrease
after 2008 (just like Z-score)
After 2006 bank cost x-efficiency
decreasing – it appears banks did not
increase their efficiency after the crisis
started.
Figure 3: Empirical banking indicators for medial bank, 5 year moving averages
1
1,5
2
2,5
3
0,2
0,4
0,6
0,8
20
00
20
01
20
02
20
03
20
04
20
05
20
06
20
07
20
08
20
09
20
10
20
11
20
12
Lerner
Competition efficiency frontier
X_efficiency
Franchise value - right
Source: Own calculation based on Bankscope data
12
Testing the competition – stability and
related hypothesis

Empirical strategy
Bankscope (Fitch) data
Starting with 3555 bank-year obs (15 countries, 16 years, unbalanced)
On average we cover 80% of national banking sector assets
After dealing with outliers and missing data we end up with 1421 obs (in Lerner spec.) and
579 (in CEF spec.)
Strategy at this point: Panel OLS and country fixed effects
Control: 2sls, bank fixed effects, lagged dependent var.
Chow test – to confirm it makes sense to break up the sample
Hausman test to confirm fixed effects
Running the regressions on sub samples and using separately two indicators of market
power
Also, decomposing the Z-score:
STALEVSTAPORROAADEVST
AEROAAZ __
__
/
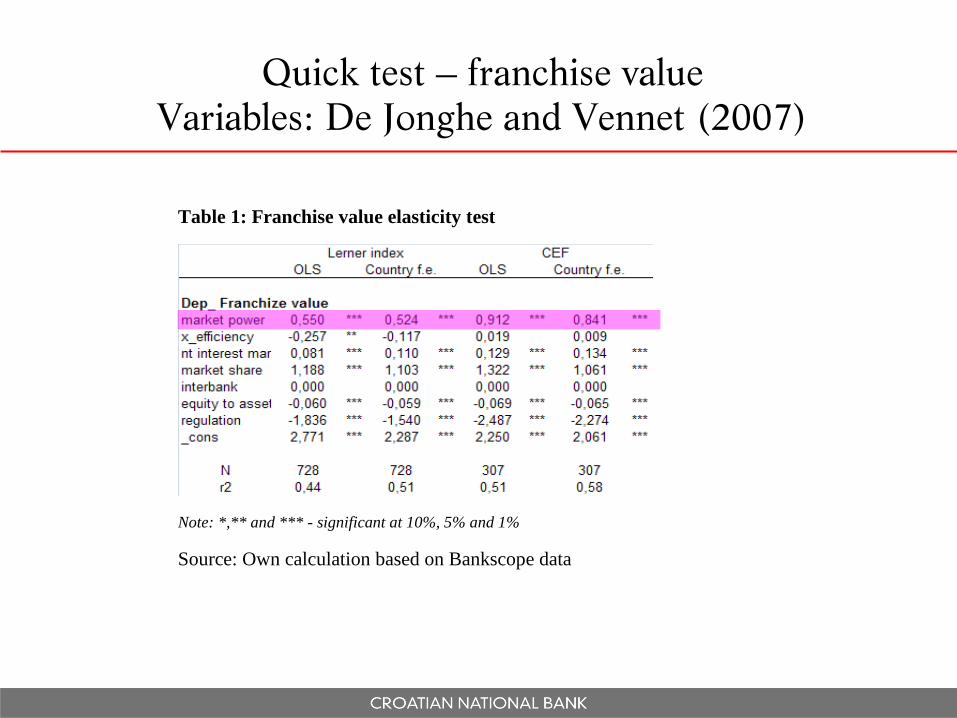
Quick test – franchise value
Variables: De Jonghe and Vennet (2007)
Table 1: Franchise value elasticity test
Note: *,** and *** - significant at 10%, 5% and 1%
Source: Own calculation based on Bankscope data
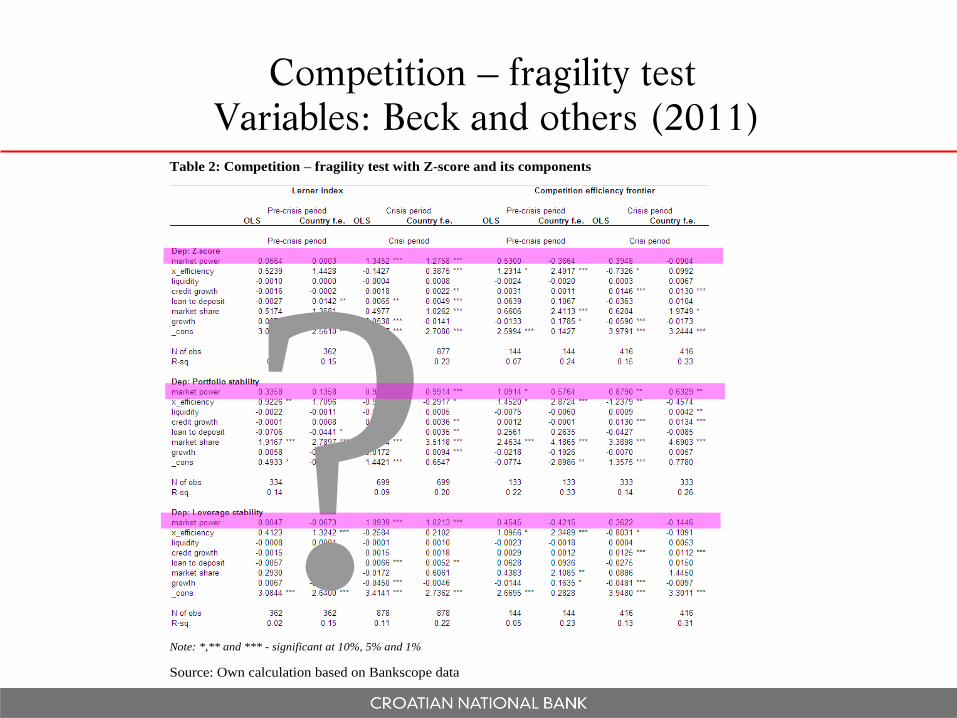
Competition – fragility test
Variables: Beck and others (2011)
Table 2: Competition – fragility test with Z-score and its components
Note: *,** and *** - significant at 10%, 5% and 1%
Source: Own calculation based on Bankscope data
?

Competition – cost of funding test
Table 3: Bank competition and cost of funding
Note: *,** and *** - significant at 10%, 5% and 1%
Source: Own calculation based on Bankscope data
X
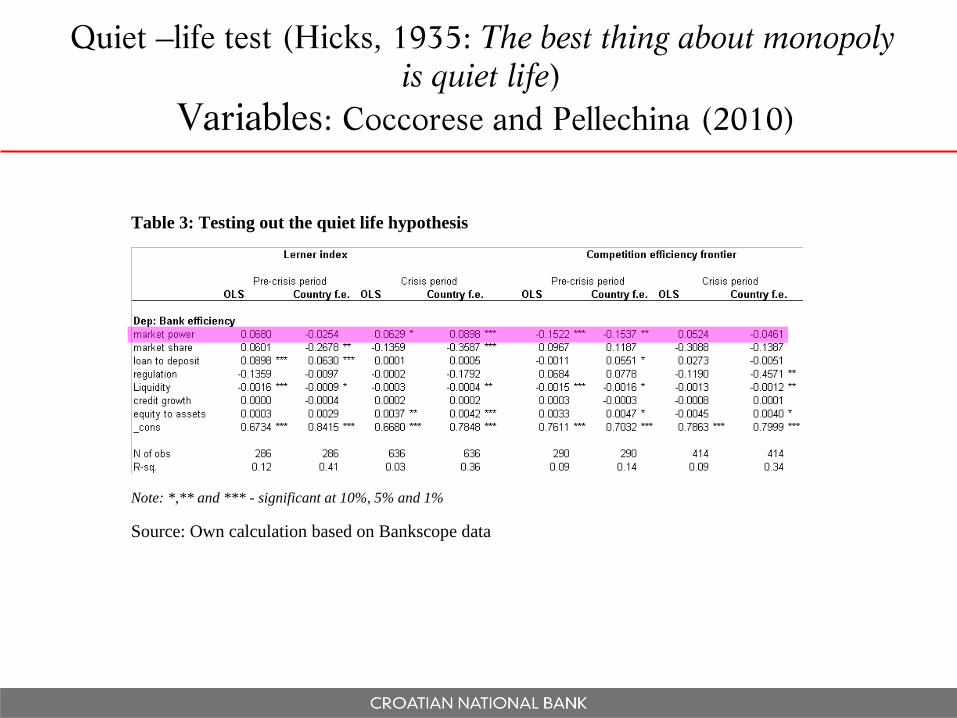
Table 3: Testing out the quiet life hypothesis
Note: *,** and *** - significant at 10%, 5% and 1%
Source: Own calculation based on Bankscope data
Quiet –life test (Hicks, 1935: The best thing about monopoly
is quiet life)
Variables: Coccorese and Pellechina (2010)

Conclusion
Market power and stability of CEE banks
CEE banks risk-build-up happened in the period of increasing
competition. Franchise value and Z-score decreased together after
2008.
Banks with more market power have higher franchise value and higher
stability. In good times, they do enjoy their Quiet life.
Their stability is the result of portfolio stability (better credit risk
management)
No evidence of market power leading to higher prices – no evidence of
risk shifting (no risk and no shifting)
We find evidence of franchise value being disciplining mechanism
leading to competition – fragility relationship
Informational rents instead of economic rents?

Technically
Perhaps researchers reached an agreement on the
indicators to soon to attend the techniques in this area?
Perhaps Lerner index of market power has to much of
market power?
Higher prices are not the only way to exercise your market
power
Future work – dynamic panel and allowing for the non-
linearity of the relationship
Policy implications
Franchise value seems to be a functional self-disciplining
mechanism.
More competition in banking does not mean higher social
welfare.
However, competition on CEE banking markets is
increasing (especially with market shrinking) leading to
franchise value decreasing.
Should someone take the role of franchise value in CEE?
The effect of joining Bank union?
Thank you