Embed Size (px)
Citation preview
Market Power and Electricity Market Reform in Northeast
ChinaZhang Xiaochun and John Parsons
MIT Energy and Environmental Policy Workshop, May 1, 2008
Timeline1985 -- end of the central govt monopoly in generation
– provincial and local governments
– state owned enterprises
– private investors, including foreign investors

Electricity System after Early Reforms

Timeline (cont.)1997 – corporatization
– transmission and generation assets moved from the Ministry of Electric Power to a State Power Corporation of China
– parallel reforms at provincial and local levels

Timeline (cont.)2002 -- break-up of SPC
– 2 main grid companies, with regional and provincial subsidiaries– 5 main generation companies– assorted engineering and other companies– creation of a regulator, SERC or State Electricity Regulatory Commission, but
continued involvement of NDRC in economic & industrial strategy
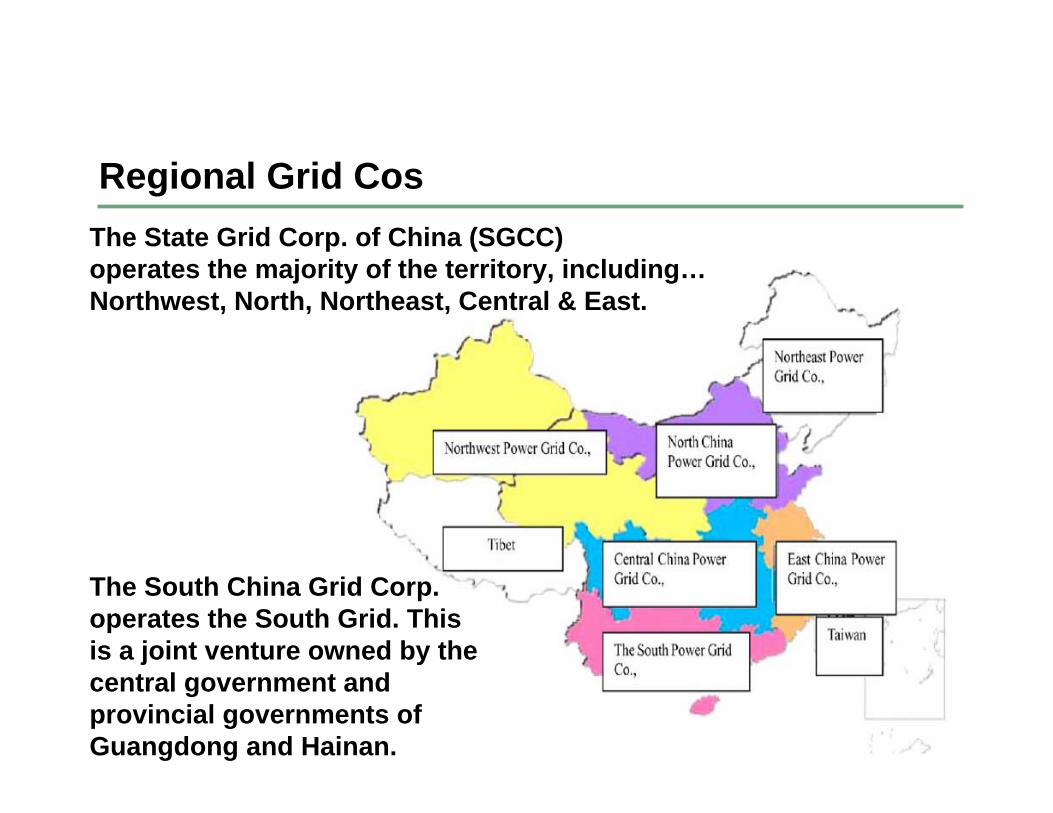
Regional Grid CosThe State Grid Corp. of China (SGCC)operates the majority of the territory, including…Northwest, North, Northeast, Central & East.
The South China Grid Corp. operates the South Grid. This is a joint venture owned by the central government and provincial governments of Guangdong and Hainan.

Generation Cos5 Gencos…majority owned by the central government
– Datang– GuoDian– HuaDian– Huaneng– China Power Investment Corp.
Assured that no company had more than 20% of the generating assets in any region.
State Grid also has generation.
Other 54% of generation continues…provincial, local, IPPs
Ownership structure is inadequately reported.
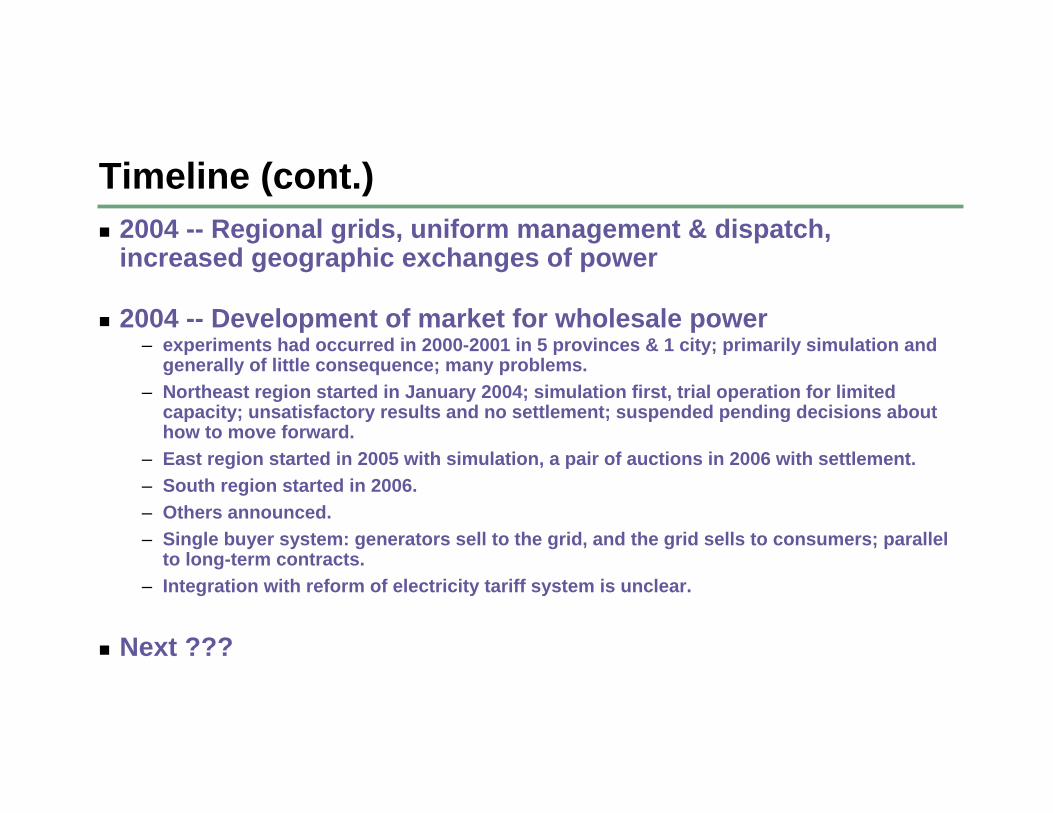
Timeline (cont.)2004 -- Regional grids, uniform management & dispatch, increased geographic exchanges of power
2004 -- Development of market for wholesale power– experiments had occurred in 2000-2001 in 5 provinces & 1 city; primarily simulation and
generally of little consequence; many problems.– Northeast region started in January 2004; simulation first, trial operation for limited
capacity; unsatisfactory results and no settlement; suspended pending decisions about how to move forward.
– East region started in 2005 with simulation, a pair of auctions in 2006 with settlement.– South region started in 2006.– Others announced.– Single buyer system: generators sell to the grid, and the grid sells to consumers; parallel
to long-term contracts.– Integration with reform of electricity tariff system is unclear.
Next ???

Our Analysis -- the Northeast Region
Liaoning, Jilin, Heilongjiang and the eastern portion of the Inner Mongolia Autonomous Region, encompassing the HulunbeierLeague,XinganLeague,TongliaoCity and ChifengCity

Territory Population GDP Electricity Generation Electricity Consumptionper capita per capita
(thousand km sq) (million) (billion Yuan) (Yuan) (Terawatt hours) (Terawatt hours) (kwh)[a] [b] [c] [d] [e] [f] [g] [h] [I] [j] [k] [l]
1,249 120 2,109 17,600 238 236 1,961
146 12% 43 36% 926 44% 21,700 101 42% 123 52% 2,876187 15% 27 23% 425 20% 15,600 46 19% 41 18% 1,515454 36% 38 32% 622 29% 16,300 65 27% 60 25% 1,562462 37% 12 10% 136 6% 11,400 27 11% 12 5% 986
NE
LJHIM
Northeast Region -- Overview

Jilin23%
E. Inner Mongolia
10%
Liaoning39%
Heilongjiang
28%
Figure 2Generation Capacity by Province
Installed capacity: 48 GW
Liaoning: 18 GW, 39% of the totalJilin: 11 GW, 23%Heilongjiang: 13 GW, 28%E. Inner Mongol: 5 GW, 10%

100 MW >15%
> 1,000 MW31%
1,000-500 MW26%
500-100 MW28%
Liaoning
500-100 MW32%
100 MW >17%
> 1,000 MW36%
1,000-
500 MW15%
Jilin
> 1,000 MW15%
100 MW >13%
500-100 MW32%
1,000-
500 MW40%
Heilongjiang
500-100 MW18%
> 1,000 MW28%
100 MW >18%
1,000-500 MW36%
e. Inner Mongolia
100 MW >7%
500-100 MW26%
1,000-
500 MW16%
> 1,000 MW51%
Figure 3Generation Capacity by Installation Size

Wind2%
Hydro13%
Thermal85%
LiaoningWind1%
Hydro8%
Thermal
91%
JilinWind2%
Hydro35%
Thermal
63%
HeilongjiangWind1%
Hydro6%
Thermal
93%
e. Inner MongoliaHydro6%
Wind6%
Thermal
88%
Figure 4Generation Capacity by Fuel Type

Self-Gen14%
Sold86%
Liaoning
Self-Gen15%
Sold85%
Jilin
Sold93%
Self-Gen7%
Heilongjiang
Self-Gen20%
Sold80%
e. Inner Mongolia
Self-Gen9%
Sold91%
Figure 5Generation Capacity by Outlet

Datang9%
GuoDian9%
Huaneng11%
CPIC12%
State Grid13%
other32%
HuaDian14%
Figure 6Generation Capacity by Ownership
e. Inner Mongoliaother13%
CPIC34%
Huaneng
20%
State Grid30%
Datang3%
Heilongjiang
GuoDian
7%
Datang12%
HuaDian
39%
State Grid5%
Huaneng
9%
other28%
Jilinother14%
Huaneng2%
State Grid31%
Datang
21%
GuoDian
20%
CPIC12%
Liaoning
other52%
CPIC17%
State Grid3%
Huaneng
15%
HuaDian
7%
GuoDian
6%

100%
2%
7%
2%
7%
6%
10%
23%
25%
11%
7%
[c]
Market Share
21,486Total
400Nenggang[10]
1,500Yuanbaoshan[9]
400Hunjiang[8]
1,600Suizhong[7]
1,200Jinzhou[6]
2,200CPIC[5]
4,940Huneng[4]
5,420Huadian[3]
2,420Guodian[2]
1,406Datang[1]
[b][a]
Capacity in MWCompany
Huadian and Huaneng 48%
CR4 = 70%
HHI = 1,582
Market Power in Trial Operation 2005

Datang7% Guodian
11%
CPIC10%
others24%
Huneng23%
Huadian25%
Market Power in Trial Operation 2005
Huadian and Huaneng 48%
CR4 = 70%
HHI = 1,582

100%
7%
2%
8%
14%
23%
27%
12%
7%
[c]
Market Share
20,260Total
1,500Yuanbaoshan[8]
400Nenggang[7]
1,600Suizhong[6]
2,805CPIC[5]
4,700Huneng[4]
5,420Huadian[3]
2,430Guodian[2]
1,405Datang[1]
[b][a]
Capacity in MWCompany
Huadian and Huaneng 50%
CR4 = 76%
HHI = 1,759
Market Power in Trial Operation 2006

Datang7% Guodian
12%
CPIC14%
others17%
Huneng23%
Huadian27%
Market Power in Trial Operation 2006
In Liaoning, Huaneng has 35% of the competitive capacity.
In Jilin, Guodian has 50% of the competitive capacity .
In Heilongjiang, Huadianhas 62% of the competitive capacity .
When there are transmission constraints and power shortages, there might be significant concentrations of market power in these provinces.

Prospects for an Expanded Regional Market
ExcludingAll Facilities Self-Generation
CR4 HHI CR4 HHI[a] [b] [c] [d]
[1] Northeast Region 50% 770 58% 1,035
[2] Liaoning 44% 580 51% 803[3] Jilin 83% 1,925 89% 2,202[4] Heilongjiang 67% 1,837 84% 2,850[5] E. Inner Mongolia 87% 2,427 96% 2,952
[6] Trial Regional Market 76% 1,759

Thanks