Embed Size (px)
Citation preview
Project co-finance by the FCH JU under FP7:
Market outlook for
Green Hydrogen
Daniel Fraile, Hinicio
CertifHy Public Launch, Brussels
April 23rd, 2015

Content
1. Hydrogen Global Outlook
2. Drivers for Green Hydrogen
3. Market outlook for H2Mobility
4. Market outlook for Power to Gas
5. Market outlook for Industry
6. Conclusions
Disclaimer: Figures presented here are still under consultation. They may be subjected to final review, after consultation with
stakeholders

INDUSTRY sector represents over 99% of all
hydrogen market
• The global demand in 2010
was approximately 43
Mtons and is foreseen toreach 53 Mtons by 2030,
• Europe represents 16% ofthe hydrogen global share35,87
44,31
6,83
7,09
0 10 20 30 40 50 60
2 0 1 0
2 0 3 0
MILLIONS TONS OF H2
H2 Demand Rest of the World Europe H2 Demand
23% Accumulated Growth

Ammonia accounts for over half of the total Industry consumption. Refineries are the second largest
consumer of hydrogen
80% of thedemand isconcentratedin two sectors(refineries andammoniaproduction forfertilizers)
Severalindustrialsectors count
for just 1% ofhydrogendemand.
Note: Market shares are based on global figures and are validated for Europe. H2 demand is
projected for Europe only.
Sources: Linde group, ICIS consulting, CEPS and Freedonia
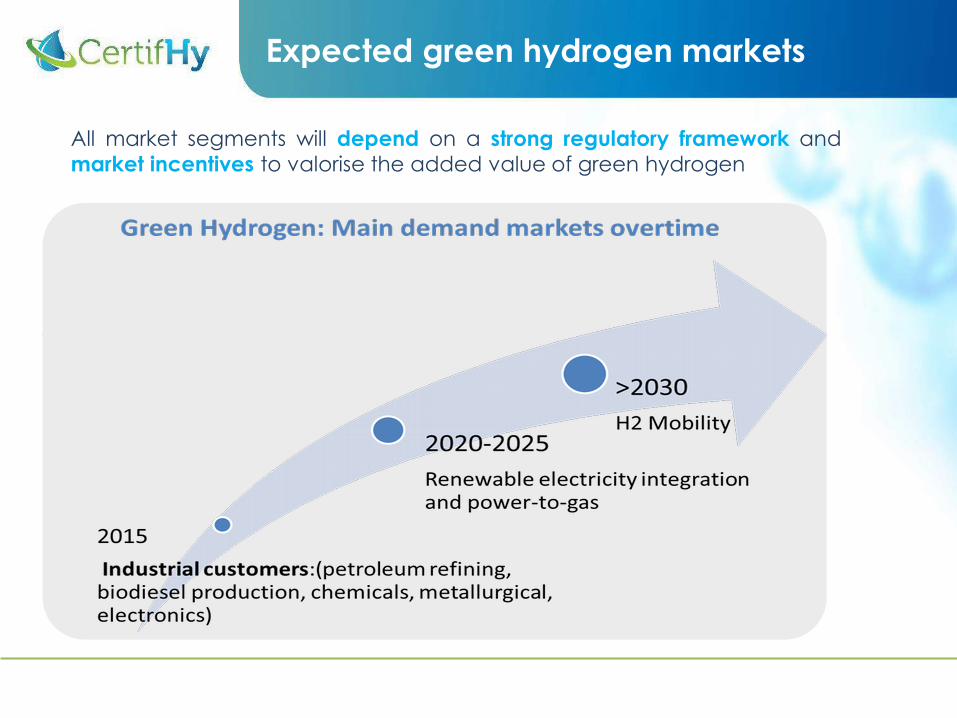
Expected green hydrogen markets
All market segments will depend on a strong regulatory framework and
market incentives to valorise the added value of green hydrogen

Regulatory drivers are essential to create a
market for green H2
* These are drivers for penetration of FCV, regardless the type of fuel/hydrogen
Mobility and
transport Power to gas
Refineries
Amonia
(other
chemicals)
metal
processing
Food, Glass
production,
Semiconductors,
aerospace
H2 use inFCVs
Energy storage
and system
transformation
Fuel quality directive
RED (including. Renewables Transport
target)
Emissions Performance standards for
passenger cars
Low Emissions Zones*
Alternative fuel infrastructure
directive*
ETS (Cap, exemptions, CO2 price)
Industry
Regulatory drivers

Market drivers are also important and will play an important role in the long term, including, in
niche industrial sectors
Mobility and
transport Power to gas
Refineries
Amonia
(other
chemicals)
metal
processing
Food, Glass
production,
Semiconductors,
aerospace
H2 use
inFCVs
Energy storage
and system
transformation
Oversupply of variable
renewable energy/ Energy
storage market
Consumers choice- clean
transportation
CSR- Green marketing/ Company
image
cost competitive vs. SMR or vs.
ICE vehicles (pushed by
technology development,
pulled by market subsidies)
Industry
Market & Economic drivers

Certifhy’s Policy driven scenario to 2030
A clear policy framework for alternative vehicles and
low-carbon fuels after 2020
Power
• Renewable Energy directive
Transport
• Target for renewables in transport by 2030
• Fuel Quality directive (10-12% saving target by 2030)
• CO2 regulation in cars (70g/km in 2025)
• National targets for refuelling infrastructure
Energy Intensive
• ETS CO2 market
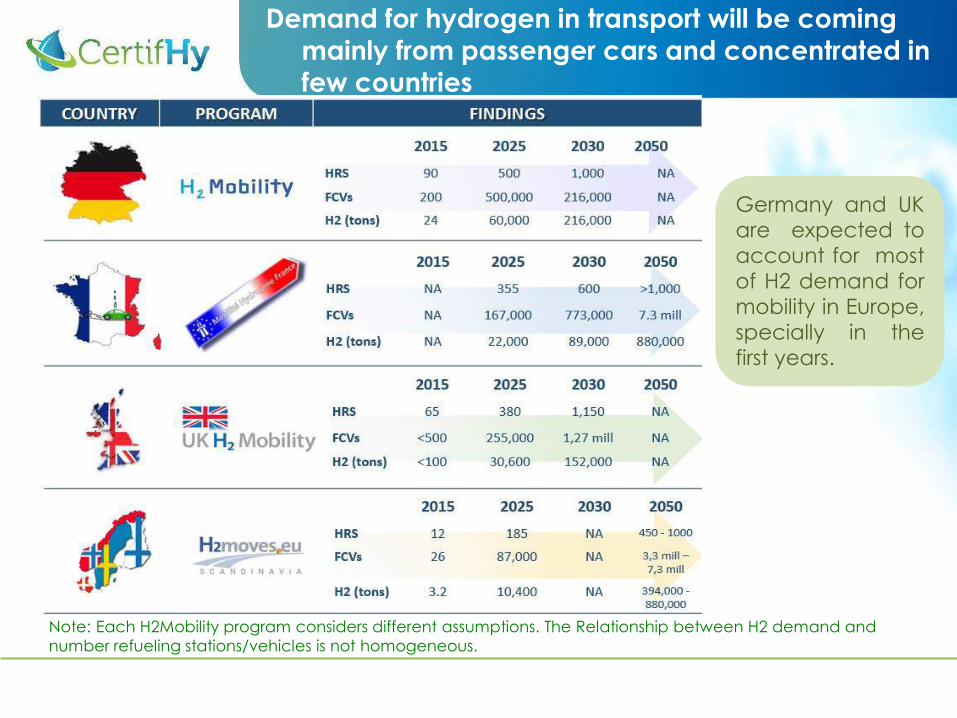
Demand for hydrogen in transport will be coming mainly from passenger cars and concentrated in
few countries
Germany and UK
are expected to
account for most
of H2 demand for
mobility in Europe,
specially in the
first years.
Note: Each H2Mobility program considers different assumptions. The Relationship between H2 demand and
number refueling stations/vehicles is not homogeneous.

Demand for FCV could lead to 0.8MTons of hydrogen by 2030, representing 6.5 million cars
H2mobility programsare more conservative& delaying the
penetration of FCV ascompared to previousstudies.
• We base our projections on the most recent H2mobility roadmaps.
• For 2015, demand is given by the UK, France, Germany and Scandinavia roadmaps.
• From 2025, we assumed these countries represents 60% of hydrogen demand forpassenger cars in Europe.
3 mill
0,0
0,5
1,0
1,5
2,0
2,5
3,0
2015 2020 2025 2030
H2
MTo
ns
H2 demand for road transport in Europe
Hinicio / H2 mobility Iniciatives Hyways scenario : high policy support-modest learning
Hyways scenario : high policy support-fast learning McKinsey power trains study
1.4 Mtons
0.8 Mtons
3 Mtons

Most demand in Mobility will need to come from green/low carbon sources
In the mid to
long-term, a
transition to FVCs
will only be
supported if
emissions saving
are significant.
By 2030, we
expect 75% to
be produced
from low-
carbon/RES
sources.
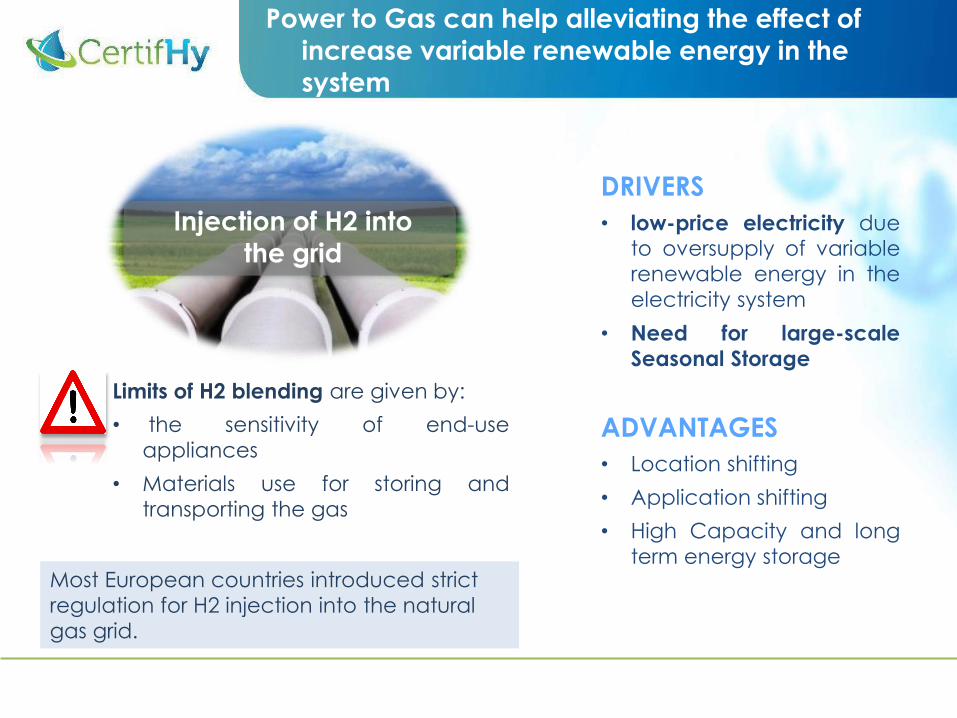
Power to Gas can help alleviating the effect of increase variable renewable energy in the
system
Injection of H2 into
the grid
Limits of H2 blending are given by:
• the sensitivity of end-use
appliances
• Materials use for storing and
transporting the gas
Most European countries introduced strict
regulation for H2 injection into the natural
gas grid.
DRIVERS
• low-price electricity dueto oversupply of variable
renewable energy in the
electricity system
• Need for large-scale
Seasonal Storage
ADVANTAGES
• Location shifting
• Application shifting
• High Capacity and long
term energy storage

Hydrogen injection could in theory allows
for a yearly absorption of up to 35TWh
• Bounded by the pipeline flow rate during low consumption periods, thus during
SUMMER
• 3 scenarios: Low (1%), Medium (2%) and High (5%) hydrogen volume blending
• We have only considered direct injection (no methanization)
Calculation
-
0,50
1,00
1,50
2,00
2,50
3,00
3,50
-
20.000
40.000
60.000
80.000
100.000
120.000
2020 2025 2030
Ton
s o
f H
2M
illio
ns
GW
h
P2G
1% H2 blending 2% H2 blending 5% H2 blending
Maximum Theoretical: 20%

Hydrogen injected in the natural gas grid will be mainly from renewable energy sources
2025 it is assumed 1% of H2 volume blending
2030 it is assumed 2% of H2 blending

• Largely depending on legal requirements (specially beyond
2020) and policy incentives:
• Potential new requirements (heavy oils for maritime transport)
• Substitution to low-carbon hydrogen will need to compete
againts other fuel CO2 reduction alternatives (biofuels,
electricity, upstream emissions, type of crude, etc.)
Refineries represent the industry sector with the largest potential for green hydrogen use

The main driver in other Energy-intensive
Industry might by CO2 prices
• Large uncertainty of CO2 prices. But we expect them to
increase in the long term
• Industry use of low carbon H2 will heavily depend on the cost
of producing that H2, or the price of a low-carbon GoO
• Substitution to low-carbon H2 will also depend on other CO2
emission reduction options (efficiency, renewable energy
input, etc.)
• Possible new requirements for Ammonia (fertilizers) producers
could lead to new drivers

Green hydrogen use in Industry
Under discussion…

Under a CO2 policy driven scenario, green hydrogen demand
could grow to significant levels in the mid-to long term (up to 17%by 2030)
If climate change and energy independence continue to dominate EU
action and national industry roadmaps for mobility materialize
Conclusions (I)
Provisional

Conclusions (II)
• Disconnecting the production site from the demand for green
hydrogen through the use of a GoO system will be essential for
an effective use of green hydrogen.
• Ideally, a good GoO scheme should be flexible enough to
serve both objectives: proof of renewable origin and of a low-
emission content.
• A clear long-term decarbonisation strategy is needed. EU
should set a concrete and ambitious legislative framework for
the post-2020 period.