Embed Size (px)
Citation preview

MARKET ENVIRONMENT REPORT Winter 2013

MERCER Market Environment Report Winter 2013 (As of 12/31/2012) 2
About MercerMercer is a global provider of investment services, and offers customized guidance at each stage of the investment decision, risk management, and investment monitoring process. We have been dedicated to meeting clients’ needs for more than 40 years, and work with the fiduciaries of retirement funds, foundations, endowments, wealth management firms and other investors in more than 60 countries. We offer clients a continuum of services in order to tailor solutions specific to their unique requirements and governance objectives. Our services include:
For further information contact:Sue Crosby, Endowments and Foundations, [email protected] or at 212 345 9264John Nussbaumer, Retirement Plans and Health Care, [email protected] or at 404 442 3280David Eisenberg, Wealth Management Providers, [email protected] or at 617 747 9454
Missed our recent publications? Mercer Investment Forum – Boston June 13-14, 2013 - http://www.mercer.com/insights/investment-consulting Endowment and Foundations – Video with Richard Anderson – http://www.mercer-hammond.mercer.com/home Top Pension Risk Management Priorities for 2013 - http://www.mercer.com/press-releases/1494665 10 Steps for DC Plan Sponsors in 2013 - http://www.mercer.com/usdc Global Asset Manager Fee Survey - http://www.mercer.com/articles/1503475 Understand ETFs and Evaluation of their Uses - http://www.mercer.com/articles/understanding-exchange-traded-funds Building a Responsible Investment Portfolio - http://www.mercer.com/articles/building-a-responsible-investment-portfolio

MERCER Market Environment Report Winter 2013 (As of 12/31/2012) 3
Overview
Table of Contents
Market commentary 4
PerformanceGlobal equities climbed the wall of worry 5
Investors enjoyed strong returns in 2012 6
Macro environmentThe Fed expanded QE3 7
The tax deal reduced the risk of a recession 8-9
Global economic growth appears to have bottomed 10-11
Financial marketsMacro conditions should have less impact in 2013 12-13
Global equities: Valuations still attractive 14
US equities: Profits appear to be peaking 15
US equity style: Maintain quality focus, reduce growth bias 16
Emerging market equities topped developed markets for the year 17
International developed equity valuations remain more attractive than the US 18-19
Fixed income: Credit rallied in 2012, but little upside remains 20-21
Currencies: A race to the bottom 22-23
Fundamentals supportive of local currency debt 24
Global REITs produced strong returns in 2012 25Private equity stacks up well against public markets 26
Hedge funds lagged balanced portfolios in 2012 27
Liability driven investing: Maintain tactical under-hedge 28
Executive Summary
Global equity markets posted strong returns in 2012 as the MSCI ACWI index rose 16.1%. Treasuries returned a modest 2.0%, while investment-grade bonds gained 9.8% and high yield bonds rose 15.8%.
While the secular economic outlook for the developed world is weak and 2013 will likely bring more flare-ups, the macro environment appears to be stabilizing. The ECB has reduced left-tail risks in the Eurozone, although the crisis is likely to persist as a source of uncertainty. The Chinese economy appears to have avoided a hard landing and growth is improving. The US was able to avoid the full brunt of the fiscal cliff, but economic and employment growth is likely to remain subpar.
Expected returns on bonds have plunged as a result of the financial crisis and central bank actions. Meanwhile, equities and some other riskier assets offer significantly better valuations than they did before the crisis. Institutions that have not revisited their strategic allocations in some time may wish to do so as the long-term risk-reward trade- off between stocks and bonds has changed materially over the past five years.
Global equity valuations remain neutral to attractive on an absolute basis, but compelling relative to sovereign bonds and credit. US equity valuations are elevated on cyclically-adjusted measures, but high profit margins could persist for some time. International developed equities are attractively priced, especially against US equities. Emerging market equities are likely to remain highly sensitive to macro sentiment, but are priced to outperform developed equities.
Domestically, we continue to suggest tilts toward high quality stocks and away from small caps. Given the strong outperformance of growth relative to value over the past six years, we suggest adopting a more style neutral domestic equity portfolio. Outside the US, quality sectors appear less attractively priced. Investors that have distinct non- US quality allocation could consider reducing the size of quality overweights.
While we continue to favor credit over Treasuries, potential excess returns have fallen as spreads have narrowed. Yields on investment-grade bonds fell to record lows, although spreads relative to Treasuries remain above historical averages. The yield on high yield bonds also dipped to a record low. High yield bonds are reasonably attractive relative to Treasuries, but equities offer better risk-adjusted returns.
Spreads on illiquid debt securities have not compressed to the same extent as they have in public markets. This can be capitalized upon through private debt partnerships and some hedge funds. A diminishment in the importance of macro factors should result in a re-focus by the market on fundamental value, providing opportunities for alpha generation through asset allocation tilts and security selection.

MERCER Market Environment Report Winter 2013 (As of 12/31/2012) 4
Market commentary January 2013Despite an uncertain macro environment and lackluster economic growth, global equities posted strong gains in 2012, with the MSCI ACWI index rising 16.1%. This came with significant intra-year volatility with two sell-offs greater than 10%. The S&P 500 finished 16.0% ahead for the year. Despite underperforming the S&P by 650 basis points in the first half of the year, the MSCI EAFE index edged ahead of the S&P with a 17.3% return for the year. Emerging market equities outperformed developed equities for the year with a gain of 18.2%. The reduction of macro risk was likely the primary driver of stock returns in 2012. The ECB showed its willingness to preserve the euro zone through the OMT program, reducing the likelihood of a disorderly break- up. In addition, fears of a hard landing in China receded as growth bottomed and began to recover. Finally, the US will avoid the brunt of the fiscal cliff in 2013, reducing the likelihood of a recession. Of course, macro risks remain. The developed world remains overly-indebted and is likely in for an extended period of slow growth. However, conditions seem to be stabilizing, and the likelihood of disaster scenarios have been reduced by policy actions. A diminished impact of macro on markets should mean lower correlations within and across asset classes, increasing the value of diversification. The injections of liquidity by the Federal Reserve and other central banks have fundamentally altered the outlook for fixed income. Yields on almost all types of fixed income instruments are at or near record lows. Cash rates will likely be near zero for at least two more years, and as measured by TIPS, Treasury investors will lose ground to inflation for maturities out to nearly 20 years. Investors reacted to this dynamic by shifting to credit, resulting in outsized gains in 2012. Investment grade bonds returned 9.8% on the year as the yield declined by 103 basis points to a meager 2.7%. High yield bonds jumped 15.8%, as yields declined from 8.4% to just 6.1%. Investment-grade corporate bonds yield 1.8% more than Treasuries, which remains above the historical average, and high yield bonds yield 5.2% more than Treasuries, which is in line with the historical average and reasonable in light of the short-term default outlook. We continue to favor credit over Treasuries, but with absolute yields so low, returns will largely be limited to income. Credit investors could look to private credit markets for higher returns. Spreads on illiquid debt securities have not compressed to the same extent as they have in public markets.The short-term outlook for equities is mixed. Stabilization of macro risk is a positive for equities, but short-term sentiment indicators hint a degree of complacency and investor surveys suggest excessive bullishness, raising the possibility of a pullback. In addition, the VIX index has dipped to the low teens in January, and the cost of portfolio protection has dropped. For investors with
longer time horizons, however, equities continue to offer compelling value versus Treasuries and credit. Despite their strong performance in 2012, global stocks appear reasonably priced. US equities are a bit rich when using cyclically-adjusted earnings measures. However, companies are benefitting from an accommodative Fed policy through lower interest rates. Non-US equities offer better valuations, but with greater risks.Corporate managements are signaling the attractiveness of equity relative to credit. US corporations are taking advantage of artificially low rates by issuing debt—over $1.5 trillion in the US in 2012. Over half of this was used to refinance existing debt at lower rates, which falls directly to the bottom line. However, companies are also increasing debt loads. In many cases, this is offering high quality companies a form of arbitrage, as debt costs are usually below earnings yields and often below dividend yields. In this low growth environment, companies are generally not investing with proceeds from debt issuance, but instead are returning money to equity shareholders through dividends, buybacks and cash mergers. Over the last two years (through 3Q12), non-financial companies have issued $840 billion in new debt securities (+18% of outstanding), while retiring $871 billion in equity (-6% of outstanding).While companies are reducing the supply of equities through buybacks and mergers, we may begin to see an increase in demand for stocks as investors rotate out of bonds. This could push valuations higher. Institutional investors have generally been reducing allocations to equities for more than a decade due to two brutal bear markets, high volatility and a remarkable bull market in bonds. However, the dismal return outlook for fixed income securities has become unavoidably clear, while prospective equity returns are reasonable even in a low-growth world. If macro conditions stabilize, investors may shift their focus toward meeting long-term needs, which in most cases will require a higher allocation to equities.In summary, while financial stress has receded over recent months, the macro environment remains uncertain; however, we suspect that these risks are well- recognized by market participants and discounted in prices. Given the paltry returns offered by fixed income securities, institutions should consider reexamining their strategic policies to determine the appropriate mix between defensive and risky assets. We endorse equity investments as an important tool to meet long-term objectives; however, we continue to recommend diversifying growth assets among a greater number of return drivers, such as private equity, private debt, hedge funds and real asset-oriented investments. Finally, a diminishment in the importance of macro should result in a re-focus by the market on fundamental value, providing opportunities for alpha generation through asset allocation tilts and active management.

MERCER Market Environment Report Winter 2013 (As of 12/31/2012) 5
Global equities climbed the wall of worry
2012 Global Equity Market Performance
-10
-5
0
5
10
15
20
Dec
-11
Jan-
12
Feb-
12
Mar
-12
Apr-
12
May
-12
Jun-
12
Jul-1
2
Aug-
12
Sep-
12
Oct
-12
Nov
-12
Dec
-12
(%)
S&P 500 Russell 2000MSCI EAFE MSCI Emg Mkts
2012 Returns for Global Markets
15.617.3
8.2
18.2
24.6
16.0
19.1
17.3
21.622.5
17.016.0
0
5
10
15
20
25
US (S&P500)
MSCI EAFE Europe Japan Pacif ic ExJapan
EmergingMkts
(%)
US $
Local Currency
2012 Style Performance
18.118.515.8
17.020.2
12.814.615.1
0
5
10
15
20
25
Gro
wth
Valu
e
Gro
wth
Valu
e
Gro
wth
Valu
e
Def
ensi
ve
Dyn
amic
Russell Top 200 Russell Midcap Russell 2000 Russell 1000
(%)
2012 S&P 500 Sector Performance (%)
2.3
7.5
12.2
15.2
26.3
-2.9
12.5
12.5
21.9
13.2
-5 0 5 10 15 20 25 30
Utilities
Energy
Cons. Staples
Materials
Industrials
Telecom
Info Tech
Health Care
Cons. Disc.
Financials
Foreign equities made-up a large deficit to US in the second half.
Reduced macro tensions and central bank actions lifted equities in the second half of 2012.
Europe lagged the US in loca l currencies, but outperformed in US$ as the euro rallied. Since the end of May, Europe has outperformed the S&P 500 by 1530 bps in US$.
The plunge in the yen helped the Japanese market, bu t weighed on US$ returns.
Emerging currencies appreciated modestly.
An improving housing market helped to boost financials.
Oil prices declined 7%.
Tech stocks fell 5.2% in Q4.
Value outperformed growth across all capitalizations as financial stocks posted strong gains.
Cyclical, high-beta stocks outperform ed defensive stocks.
Despite tepid growth, consumer discretionary stocks outperformed staples.
Currency wa s neutral for EAFE.
Source: Bloomberg
Source: Bloomberg Source: Bloomberg, MSCI
Source: Bloomberg
The dispersion of cap and style returns was narrow in 2012.
Global equities finished the first quarter with strong returns, but tumbled in the second quarter.

MERCER Market Environment Report Winter 2013 (As of 12/31/2012) 6
Fourth Quarter Performance (%)
3.3
4.1
6.6
6.0
1.9
0.7
-0.1
0.0
-6.3
-2.4
-0.4
-0.2
5.6
5.8
1.1
1.8
2.9
-3.1
-10 -5 0 5 10
Commodity Futures
Natural Res Stks
Intl Fixed
US Large-Cap Stks
US MBS
US Treasuries
T-Bills
US TIPS
US I/G Corp Bonds
Funds of Hedge Funds
US Small-Cap Stks
US Mid-Cap Stks
US High Yield Bonds
Emerg Mkt Debt (Local)
Emerg Mkt Stocks
Global REITs
Intl Sm-Cap Stks
Intl Large-Cap Stks
2012 Performance (%)
16.8
17.3
28.720.0
16.0
7.0
2.6
5.2
-1.1
1.5
2.0
2.2
17.3
18.2
9.8
15.8
16.3
0.1
-5 0 5 10 15 20 25 30
Commodity Futures
T-Bills
Intl Fixed
US Treasuries
Natural Res Stks
US MBS
Funds of Hedge Funds
US TIPS
US I/G Corp Bonds
US High Yield Bonds
US Large-Cap Stks
US Small-Cap Stks
Emerg Mkt Debt (Local)
US Mid-Cap Stks
Intl Large-Cap Stks
Emerg Mkt Stocks
Intl Sm-Cap Stks
Global REITs
Gold prices fell 6.7%, while oil prices were flat.
The intl fixed index, with a large weighting to Japan, was impacted by the sharp decline in the yen. The index was up 1.2% in hedged terms.
The S&P 500 did not participate in the fourth quarter rally.
Funds of hedge fund s outperformed US stocks and bonds in Q4.
Despite the expansion of QE3, the yield on the 10-year Treasury rose from 1.65% to 1.78% in Q4.
Europe gained 7% as financial tensions receded.
Small-caps outperformed large-caps by 270 bps in December.
The yield on junk bonds fell from 8.4% to 6.1% during the year.
Emerging currencies rallied against th e dollar in Q4.
US REITS earned 18.1% for the year.
Europe: 19.1%Japan: 8.2%
US large-caps were outperforming mids and smalls until December.
Emerging market US$ bonds were up 18%.
Europe/ME: 24.3% Asia: 20.8%Latin America: 8.7%
Financials: 14.6%Industrials: 7.6%
The Inflation breakeven rate on 10-year TIPS rose from 2.0% to 2.5%.
Commodity futures were the only major asset class to decline in 2012.
US Treasuries lagged credit.
Equity and credit investors enjoyed strong returns in 2012
Source: DatastreamSource: Datastream

MERCER Market Environment Report Winter 2013 (As of 12/31/2012) 7
The Fed expanded QE3 at its December meeting to include $45B a month in longer-term Treasury purchases on top of its existing $40B monthly MBS purchases. This puts the Fed on a pace to expand its balance sheet by more than a third in 2013, or $1 trillion. In addition, the Fed shifted its policy guidance from time-based to economic data-based. The FOMC stated that the Fed Funds target rate is likely to stay near
zero as long as unemployment is above 6.5% and forward looking intermediate-term inflation expectations are below 2.5%. At current labor participation rates and the recent pace of job creation, unemployment will not fall to 6.5% until late-2015 or early-2016. If participation rates return to pre-recession levels, unemployment could remain above the Fed’s target until early-2018. The FOMC’s December meeting minutes showed some disagreement
over when the current round of asset purchases should end, with some members suggesting they should conclude prior to year end.
Despite QE3, the yield on the 10-year Treasury increased slightly during the fourth quarter, rising from 1.65% to 1.78%. The real yield on 10-year TIPS rose from -0.77% to -0.67%, while inflation breakeven rates were relatively unchanged. TIPS price in inflation of 2.5% over ten years, in-line with historical averages. The economic impact of the Fed’s monetary policies is questionable at best
since borrowing costs are not what ails the economy. While risks of the Fed’s stimulus seem limited in the short-run, it carries significant longer-term risks. Over the near-term, inflation is likely to remain subdued and within the
Fed’s target range given economic slack. Labor costs, which are a substantial component of final goods prices, should be constrained by high unemployment. Inflationary pressures are most likely to arise from commodities since they are priced globally, and therefore less impacted by slack in the US economy and more sensitive to any weakening of the dollar. The larger the Fed’s balance sheet, the more difficult it will be to unwind
once economic conditions normalize. The bond market may struggle to absorb new Treasury debt plus Fed sales, which could lead to an unintended spike in rates and declining stock prices. However, if the Fed is too slow to sell bonds, inflationary expectations could rise, which would also lead to higher interest rates. The Fed might be powerless to end a negative feedback loop between inflation and interest rates.
The Fed expanded QE3
Decomposition of 10-Year Treasury Yield
-1.0
-0.5
0.0
0.5
1.0
1.5
2.0
2.5
3.0
3.5
4.0
Jan-
08
Jul-0
8
Jan-
09
Jul-0
9
Jan-
10
Jul-1
0
Jan-
11
Jul-1
1
Jan-
12
Jul-1
2
Real Yield on 10-Yr TIPSInflation Breakeven Rate
Fed Balance Sheet and Bank Excess Reserves
0
500
1,000
1,500
2,000
2,500
3,000
3,500
4,000
Dec
-07
Jun-
08
Dec
-08
Jun-
09
Dec
-09
Jun-
10
Dec
-10
Jun-
11
Dec
-11
Jun-
12
Dec
-12
$ B
illio
ns
Fed Balance Sheet
Bank Excess Reserve
At the current rate of expansion, the Fed’s balance sheet could exceed $4T by the end of a year. The Fed currently owns 15% of Treasuries and 13% of agency and agency- backed debt. The Fed’s holdings of Treasury and agency debt exceeds those of China.
If bank excess reserves start to shrink, it would be good for growth, but it could generate inflation and force the Fed to unwind (sell) its holdings.
The inflation breakeven rate on 10-year TIPS is 2.5%, in-line with historical averages. It is just 2.1% on 5-year TIPS, suggesting benign inflation.
The real yield on Treasuries is sharply negative and unlikely to return to positive territory in the near future.
Source: Bloomberg
Source: Bloomberg
MERCER Market Environment Report Winter 2013 (As of 12/31/2012) 8
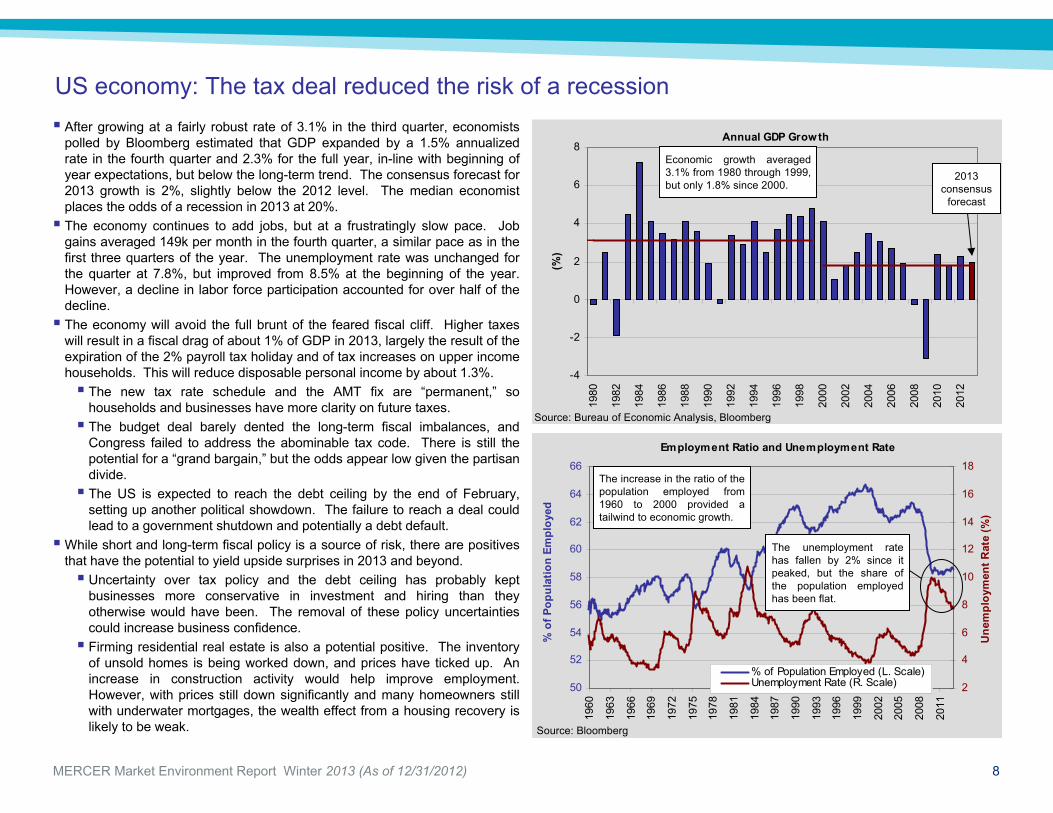
US economy: The tax deal reduced the risk of a recession After growing at a fairly robust rate of 3.1% in the third quarter, economists
polled by Bloomberg estimated that GDP expanded by a 1.5% annualized rate in the fourth quarter and 2.3% for the full year, in-line with beginning of year expectations, but below the long-term trend. The consensus forecast for 2013 growth is 2%, slightly below the 2012 level. The median economist places the odds of a recession in 2013 at 20%. The economy continues to add jobs, but at a frustratingly slow pace. Job
gains averaged 149k per month in the fourth quarter, a similar pace as in the first three quarters of the year. The unemployment rate was unchanged for the quarter at 7.8%, but improved from 8.5% at the beginning of the year. However, a decline in labor force participation accounted for over half of the decline. The economy will avoid the full brunt of the feared fiscal cliff. Higher taxes
will result in a fiscal drag of about 1% of GDP in 2013, largely the result of the expiration of the 2% payroll tax holiday and of tax increases on upper income households. This will reduce disposable personal income by about 1.3%. The new tax rate schedule and the AMT fix are “permanent,” so
households and businesses have more clarity on future taxes. The budget deal barely dented the long-term fiscal imbalances, and
Congress failed to address the abominable tax code. There is still the potential for a “grand bargain,” but the odds appear low given the partisan divide. The US is expected to reach the debt ceiling by the end of February,
setting up another political showdown. The failure to reach a deal could lead to a government shutdown and potentially a debt default.
While short and long-term fiscal policy is a source of risk, there are positives that have the potential to yield upside surprises in 2013 and beyond. Uncertainty over tax policy and the debt ceiling has probably kept
businesses more conservative in investment and hiring than they otherwise would have been. The removal of these policy uncertainties could increase business confidence. Firming residential real estate is also a potential positive. The inventory
of unsold homes is being worked down, and prices have ticked up. An increase in construction activity would help improve employment. However, with prices still down significantly and many homeowners still with underwater mortgages, the wealth effect from a housing recovery is likely to be weak.
Annual GDP Growth
-4
-2
0
2
4
6
8
1980
1982
1984
1986
1988
1990
1992
1994
1996
1998
2000
2002
2004
2006
2008
2010
2012
(%)
Employment Ratio and Unemployment Rate
50
52
54
56
58
60
62
64
66
1960
1963
1966
1969
1972
1975
1978
1981
1984
1987
1990
1993
1996
1999
2002
2005
2008
2011
% o
f Pop
ulat
ion
Empl
oyed
2
4
6
8
10
12
14
16
18
Une
mpl
oym
ent R
ate
(%)
% of Population Employed (L. Scale)Unemployment Rate (R. Scale)
The unemployment rate has fallen by 2% since it peaked, but the share of the population employed has been flat.
The increase in the ratio of the population employed from 1960 to 2000 provided a tailwind to economic growth.
Source: Bureau of Economic Analysis, Bloomberg
Source: Bloomberg
Economic growth averaged 3.1% from 1980 through 1999, but only 1.8% since 2000.
2013 consensus
forecast

MERCER Market Environment Report Winter 2013 (As of 12/31/2012) 9
Net Business Investment(% of GDP)
0
1
2
3
4
5
6
1947
1951
1955
1959
1963
1967
1971
1975
1979
1983
1987
1991
1995
1999
2003
2007
2011
(%)
Net Business Investment
Rolling 10-yr Average
US economy: The tax deal reduced the risk of a recession (cont.)
NFIB Small Business Optimism Index
75
80
85
90
95
100
105
110
1975
1977
1979
1981
1983
1985
1987
1989
1991
1993
1995
1997
1999
2001
2003
2005
2007
2009
2011
Business investment is a key driver of long-term economic growth. The low level of investment over the last decade helps explain weak growth.
Business investment has recovered, but remains far below normal levels.
Small businesses have been dour since the financial crisis, which is a concern since they tend to drive employment growth. Sentiment took a hit following the election. It remains to be seen whether avoiding most of the fiscal cliff will improve sentiment.
Case-Shiller 10-City Housing Index
50
100
150
200
250
300
350
1996
1997
1998
1999
2000
2001
2002
2003
2004
2005
2006
2007
2008
2009
2010
2011
2012
1996
= 1
00
Residential Real Estate Investment as % of GDP
0
1
2
3
4
5
6
7
8
1950
1954
1958
1962
1966
1970
1974
1978
1982
1986
1990
1994
1998
2002
2006
2010
(%)
The Case-Shiller housing index has recovered somewhat. However, it remains nearly a third below its peak, suggesting underwater mortgage s remain rampant. The prospects of a renewed wealth effect appear dim.
Real estate prices nearly tripled from 1996 to 2006.
Prices are currently at 2004 levels.
Source: Bureau of Economic Analysis
Source: Bureau of Economic Analysis
Source: Bloomberg
Source: Bloomberg
Residential real estate investment’s share of GDP reached an unprecedented low in this cycle. The inventory of unsold homes is slowly being cleared and household formation is improving, which should contribute to a recovery, although it will likely take years to get back to average.
Investment increased by 9% over the last four quarters.

MERCER Market Environment Report Winter 2013 (As of 12/31/2012) 10
Global economic growth appears to have bottomed
2012 was another turbulent year for the global economy, but there are signs that global growth has bottomed. The willingness of the ECB to act as lender of last resort helped ease financial stress in the Eurozone, reducing the risk of an imminent break-up. Two-year Spanish bond yields fell from 6.6% in July to 2.8% at year-end, and the credit spread on banks declined. However, the structural issues are largely unresolved and the region remains in a shallow recession. The ECB’s actions have reduced near-term risk and bought fiscal policy makers more time, but the crisis is likely to remain a source of uncertainty and the recent calm could lead to complacency. Economists polled by Bloomberg project that the Eurozone economy
shrank 0.4% in 2012 and will contract further in the first half of this year. However, some leading economic indicators point to stabilization and analysts anticipate a mild recovery beginning in the second half of 2013. The periphery has made solid progress in reducing labor costs and
adjusting public finances. Current account deficits have fallen and several countries now have or are approaching primary budget surpluses. Nevertheless, deleveraging and improving competiveness will be long and painful, particularly in the absence of growth. High unemployment in the periphery is likely to persist, creating intense social and political pressures.
Fears of a hard landing in China was another source of anxiety in 2012. The Chinese economy grew an estimated 7.7% in 2012, its slowest rate since 1998. However, the slowdown appears to be ending, reducing fears of a hard landing. The HSBC manufacturing PMI hit a 19-month high in December and exports grew 14.1% year-over-year in December. While weak developed world growth will continue to weigh on growth through trade links, economists project that the economy will expand 8.1% this year. Policy makers have room to further loosen monetary and fiscal policies to support growth, but must avoid worsening existing investment and credit excesses. From a long-term perspective, China must rebalance its economy away from fixed investment and toward local consumption. The global macro environment in 2012 was dominated by the Eurozone debt
crisis and the Chinese slowdown and those issues are likely to remain the key issues in 2013 and beyond. The secular economic outlook for the developed world is likely to be weak for the foreseeable future given debt and demographic issues, while the outlook for emerging economies remains bright due to their structural advantages, although they will not be able to fully decouple from the developed world.
Consensus Economic Growth Expectations
3.5
1.0
2.2
-0.1
0.9
-1.4
1.7
7.7
5.3
-2.1
2.0
-0.8
-1.5
0.7
5.6
8.1
1.1 0.8
-4
-2
0
2
4
6
8
10
US
UK
Ger
man
y
Italy
Spai
n
Japa
n
Chi
na
Indi
a
Braz
il
(%)
2012 (e)2013 (f)
India is struggling with a bloated budget and current account deficits.
Slowing commodity demand weighed on Brazil.
The Italian and Spanish economies are projected to contract a cumulative 7.4% and 5.4%, respectively, between 2008-2013, while Germany grew 4.4%.
2013 GDP GrowthConsensus Expectations
-0.5
0.0
0.5
1.0
1.5
2.0
2.5
3.0
3.5
May
-11
Jul-1
1
Sep-
11
Nov
-11
Jan-
12
Mar
-12
May
-12
Jul-1
2
Sep-
12
Nov
-12
(%)
US EurozoneUK Japan
Economists have become much less sanguine for 2013 growth forecasts since 2011, although forecasts for the US and UK have stabilized.
The new Japanese government proposed a round of stimulus and encouraged the BoJ to adopt a 2% inflation target.
Source: Bloomberg
Source: Bloomberg

MERCER Market Environment Report Winter 2013 (As of 12/31/2012) 11
Global economic growth appears to have bottomed (cont.)
Bond Yields
0
1
2
3
4
5
6
7
8
9
Dec
-10
Mar
-11
Jun-
11
Sep-
11
Dec
-11
Mar
-12
Jun-
12
Sep-
12
Dec
-12
(%)
Italy 2-yr Spain 2-YrItaly 10-yr Spain 10-yr
Bank Credit Default Swap Pricing
0
100
200
300
400
500
600
Dec
-10
Mar
-11
Jun-
11
Sep-
11
Dec
-11
Mar
-12
Jun-
12
Sep-
12
Dec
-12
Per $
10,0
00 o
f Pro
tect
ion
Europe US Asia
Chinese Retail Sales Growth
0
5
10
15
20
25
2000
2001
2002
2003
2004
2005
2006
2007
2008
2009
2010
2011
2012
(%)
Chinese retail sales grew a robust 15% in 2012. Importantly, the growth rate has increased over the last four months. Chinese imports grew just 6% y-o-y in December, but import growth has improved relative to the summer months.
LTRO Draghi’s save the euro speech.
LTRODraghi’s save the euro speech.
Banking sector risk in Europe has declined, but remains elevated due to risk of further debt restructurings.
With financial stress reduced, the focus in 2013 will likely be on economic growth, implementation, and greater integration.
Citigroup Economic Surprise Index
-150
-100
-50
0
50
100
Jan-
04
Jul-0
4
Jan-
05
Jul-0
5
Jan-
06
Jul-0
6
Jan-
07
Jul-0
7
Jan-
08
Jul-0
8
Jan-
09
Jul-0
9
Jan-
10
Jul-1
0
Jan-
11
Jul-1
1
Jan-
12
Jul-1
2
Jan-
13
G-10
Emerging Markets
Economic surprise indexes spent a good part of 2012 in negative territory. However, the index has returned to positive territory in developed markets and the index fo r emerging markets is close to neutral.
Source: BloombergSource: Bloomberg
Source: BloombergSource: Bloomberg

MERCER Market Environment Report Winter 2013 (As of 12/31/2012) 12
Macro risks abound; however, conditions appear to be stabilizing and we suspect the risks are well-recognized by market participants and discounted into prices. While 2013 will likely bring more flare-ups, macro factors should be a less important driver of returns. This could mean lower correlations within and across asset classes, increasing the value of diversification. Loose central bank policies in the US and in most overseas economies
assure poor real returns from safe assets. Investors desiring to preserve or grow purchasing power must prudently accept risk. Credit strategies enjoyed strong returns in 2012 as spreads plummeted.
Nevertheless, we continue to favor credit within fixed income strategies because spreads to Treasuries offer a favorable risk-to-reward. Yet with absolute yields so low, investors should not expect capital gains. Returns will largely be limited to income. While public market credit securities have limited upside, illiquidity is still
well rewarded in private credit markets. Spreads on illiquid debt securities have not compressed to the same extent as they have in public markets. Private debt partnerships and some hedge funds can capitalize on this. In this low rate world, global equities continue to offer attractive risk
premiums relative to Treasuries and credit. While equity volatility could remain high, stocks are very likely to outperform bonds over the intermediate-term even in a risky, low-growth world. Despite the strong returns from equities over the past year, we favor overweight positions to equities versus bonds. The price of tail risk protection is at a post-financial crisis low, although it
is not cheap by longer-term historical standards. Investors with long time horizons could consider selling protection should premiums rise in 2013 as a result of a market correction. A diminishment in the importance of macro should result in a re-focus by
the market on fundamental value, providing opportunities for alpha generation through asset allocation tilts and security selection.
Expected returns on bonds have plunged as a result of the financial crisis and central bank actions. Meanwhile, equities and some other riskier assets offer significantly better valuations than they did before the crisis. Institutions that have not revisited their strategic allocations in some time may wish to do so as the long-term risk-reward trade-off between stocks and bonds has changed materially over the past five years.
Macro conditions should have less impact in 2013
Average Correlation Among Risky Assets(Daily Correlation of Rolling 90-day Returns)
0.1
0.2
0.3
0.4
0.5
0.6
0.7
2005
2006
2007
2008
2009
2010
2011
2012
Pre- and post-Lehman
S&P 500 - Equity Risk Premium Versus Long-Term Treasuries
-2
-1
0
1
2
3
4
5
6
7
1990
1992
1994
1996
1998
2000
2002
2004
2006
2008
2010
2012
(%)
The prospective equity risk premium over long-term Treasuries remains healthy by historical standards at 4%.
This calculation uses normalized earnings, which assumes earnings 22% less than current levels. Based on reported earnings, the risk premium exceeds 5%.
We estimate global equities price a risk premium of over 5%.
The correlation of risky assets has been much higher post-Lehman. Correlations should decline if macro worries recede.
Source: Bloomberg, Datastream, JP Morgan, Mercer
Source: Mercer, S&P, Bloomberg
Median since 1956
Note: Includes MSCI World, MSCI Emerg, Barclays High Yield, GSCI, DXY (inverse), EM fx
MERCER Market Environment Report Winter 2013 (As of 12/31/2012) 13
Macro conditions should have less impact in 2013 (cont.)
Cost of One-Year Put Options on the S&P 500Protection Beyond 20% Loss
0
2
4
6
8
10
12
1994
1996
1998
2000
2002
2004
2006
2008
2010
2012
(%)
S&P 500 Normalized Earnings Yield Less High Yield Real Yield
-16
-14
-12
-10
-8
-6
-4
-2
0
2
4
1987
1989
1991
1993
1995
1997
1999
2001
2003
2005
2007
2009
2011
(%)
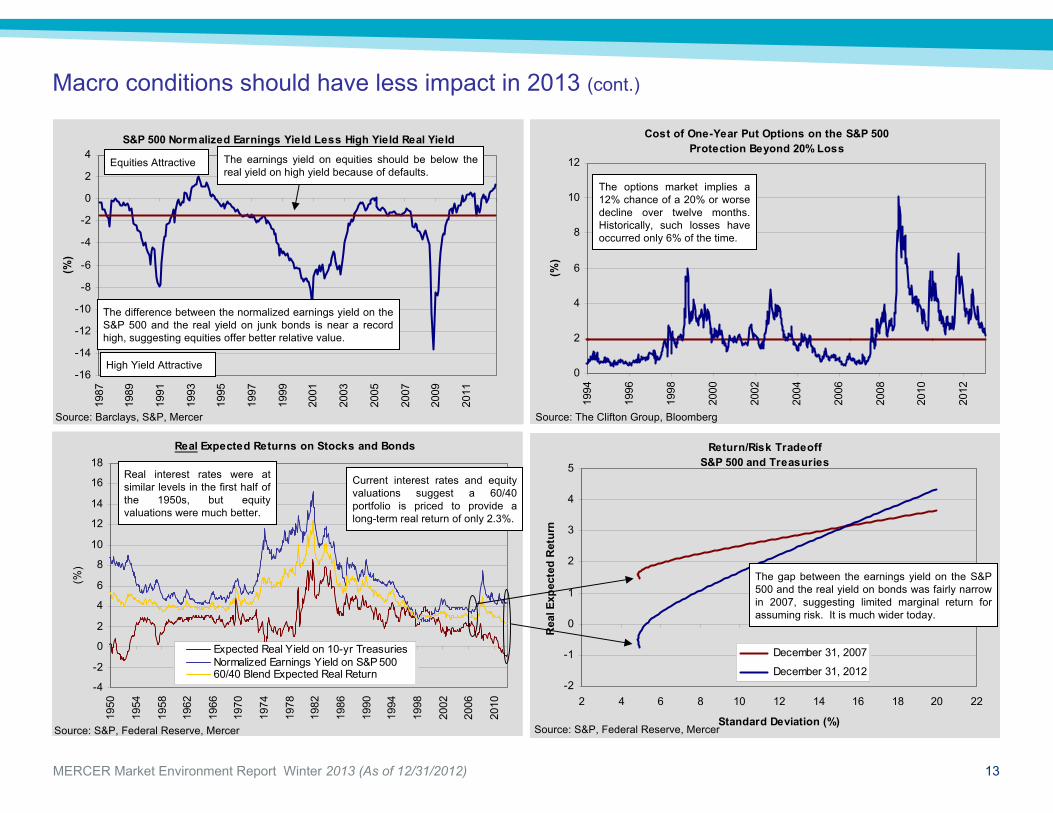
The options market implies a 12% chance of a 20% or worse decline over twelve months. Historically, such losses have occurred only 6% of the time.
Real Expected Returns on Stocks and Bonds
-4
-2
0
2
4
6
8
10
12
14
16
18
1950
1954
1958
1962
1966
1970
1974
1978
1982
1986
1990
1994
1998
2002
2006
2010
(%)
Expected Real Yield on 10-yr TreasuriesNormalized Earnings Yield on S&P 50060/40 Blend Expected Real Return
Return/Risk TradeoffS&P 500 and Treasuries
-2
-1
0
1
2
3
4
5
2 4 6 8 10 12 14 16 18 20 22
Standard Deviation (%)
Rea
l Exp
ecte
d R
etur
n
December 31, 2007
December 31, 2012
The gap between the earnings yield on the S&P 500 and the real yield on bonds was fairly narrow in 2007, suggesting limited marginal return for assuming risk. It is much wider today.
Source: S&P, Federal Reserve, Mercer Source: S&P, Federal Reserve, Mercer
Source: Barclays, S&P, Mercer Source: The Clifton Group, Bloomberg
The difference between the normalized earnings yield on the S&P 500 and the real yield on junk bonds is near a record high, suggesting equities offer better relative value.
Equities Attractive
High Yield Attractive
The earnings yield on equities should be below the real yield on high yield because of defaults.
Current interest rates and equity valuations suggest a 60/40 portfolio is priced to provide a long-term real return of only 2.3%.
Real interest rates were at similar levels in the first half of the 1950s, but equ ity valuations were much better.

MERCER Market Environment Report Winter 2013 (As of 12/31/2012) 14
Global equities: Valuations still attractive after 2012 gains
Global Valuations
24.6
20.7
1.5 1.1 1.73.7
2.2
12.7
14.613.3 13.212.112.8
9.58.07.27.6
2.2 2.72.3
0
5
10
15
20
25
30
MSCI US MSCI Europe MSCI Japan MSCI EM
P/E TrailingP/E NormalizedP/CFP/BDividend Yield
The earthquake stil l impacts the trailing 12 month earnings.
Source: MSCI, Bloomberg, Mercer
Return-On-Equity for Global Markets
-5
0
5
10
15
20
25
1975
1977
1979
1981
1983
1985
1987
1989
1991
1993
1995
1997
1999
2001
2003
2005
2007
2009
2011
(%)
MSCI Emerg Mkts MSCI EuropeMSCI Japan MSCI US
Profitability in Europe and emerging markets is in-line with historical averages, while margins remain elevated in the US.
The dividend yield on Japanese stocks is particularly attractive relative to miserable local bond yields.
Europe trades at a sizable discount to the US on all valuation measures.
Global equities enjoyed a very good year despite the macro headwinds, an example of the unreliable link between economic growth and equity returns. The MSCI ACWI index surged 16.1% for the year, although it followed a poor 2011. MSCI ACWI earned an annualized 3.7% for the two-year period, and the five-year return, which includes the financial crisis, was -1.2%. Valuations on global equities were attractive at the beginning of the year, but
they are clearly higher now after the strong 2012. Nonetheless, valuations remain neutral to attractive on an absolute basis. In comparison to sovereign bonds and credit, the valuation of equities is compelling. The earnings outlook is an ongoing concern. In the US, profit margins are
unsustainably high. Outside the US however, margins are at or below normal levels. While earnings in Europe and emerging markets declined in 2012, it appears they have bottomed. Short-term sentiment indicators suggest that confidence has improved
considerably, which could be interpreted as a contrarian indicator. However, retail and institutional investors have been slow to move back into equities. This is a medium-term positive as the low rate environment and high risk premiums could spark a rotation back into equities, especially if the perception of macro risk declines.
MSCI World Valuations
0.0
0.5
1.0
1.5
2.0
2.5
3.0
3.5
4.0
4.5
5.0
1975
1978
1981
1984
1987
1990
1993
1996
1999
2002
2005
2008
2011
P/B
0
2
4
6
8
10
12
14
16
18
20
P/C
F
P/B
P/CF
Source: MSCI, Datastream
Source: MSCI, Datastream
The P/B ratio on MSCI World is in the bottom 36% of observations since 1975, while P/CF is near the median.

MERCER Market Environment Report Winter 2013 (As of 12/31/2012) 15
S&P 500 Profit Margin on Sales
0
1
2
3
4
5
6
7
8
9
10
1956
1959
1962
1965
1968
1971
1974
1977
1980
1983
1986
1989
1992
1995
1998
2001
2004
2007
2010
(%)
Trailing 12-Months
10-Yr Moving Average
Average Since 1956
S&P 500 - P/E Ratio
0
5
10
15
20
25
30
35
40
45
50
1956
1959
1962
1965
1968
1971
1974
1977
1980
1983
1986
1989
1992
1995
1998
2001
2004
2007
2010
Shiller's (10-yr Avg. Real Earnings)Normalized EarningsReported Earnings
US equities: Profits appear to be peaking The S&P 500 declined as much as 5.8% in Q4, but pared losses as a deal
emerged on the fiscal cliff, finishing the quarter down 0.4%. For 2012, the S&P 500 added 16.0%, marking its fourth consecutive year of gains and strongest year since 2009. There are growing signs that earnings and profit margins are topping. The
profit margin on sales ticked down from 8.5% to 8.2% during the year. Based on estimated fourth quarter earnings, reported earnings were virtually flat in 2012, while operating earnings increased only 3%. We suspect 2013 will be another lackluster year for profit growth. Productivity gains have lost steam, signaling that companies have
exhausted cost cutting as a source of profit growth. Future aggregate earnings growth will need to increasingly come from investment and hiring, which will put downward pressure on margins. Companies continue to buy back shares, which can increase earnings
per share without aggregate profit growth. Stock analysts expect double-digit operating earnings growth in 2013,
which is exceedingly optimistic. Analysts are widely-recognized as an overly optimistic bunch, so it’s doubtful that the market is pricing in such high growth.
The strong return from the S&P 500 lifted valuations in 2012. The P/E ratio on reported earnings increased from 14.5 to 16.4 for the year. This is still below the median of 17.1 since 1956. With margins so high, cyclically- adjusted earnings show a much less favorable picture for equity valuations. Based on normalized earnings, which assume profit margins decline by 22%, the P/E ratio on the index stood at 20.7, which is above the historical median of 17.1 (since 1956). Based on average 10-year real earnings (Shiller’s methodology), the P/E finished the quarter at 21.1 compared to a median of 18.9 (since 1956). While we expect profit growth to remain constrained, margins could stay
above historical norms for quite some time. The Fed’s monetary policy provides a substantial subsidy to corporations, allowing them to slash interest costs. This effect will continue to help profitability as companies re-finance higher rate debt. Further, the slack in the labor market should keep a lid on wages, which is usually the most significant cost for companies. Despite elevated cyclically-adjusted valuations, we consider US equity
valuations as neutral since high profit margins could persist for some time. We find equity valuations attractive when viewed against bond yields.
Profit margins tend to mean revert.
Margins have been trending upwards over the past two decades.
Source: S&P, Bloomberg
Source: S&P, Mercer
The trailing P/E on the S&P 500 is attractive at 16.4, but profit margins are near historical highs. The P/E on cyclically-adjusted earnings measures is higher.

MERCER Market Environment Report Winter 2013 (As of 12/31/2012) 16
US equity style: Maintain quality focus, reduce growth bias In 2012, large-cap value stocks slightly outperformed growth, but since the
start of 2007, large-cap growth trounced value by a cumulative 29.7 percentage points (30.4 vs. 0.7%). At the start of the run, large-cap growth offered compelling relative valuations; however, the valuation gap has closed. While styles have a tendency to overshoot, suggesting that growth’s run could extend, we have less conviction in our previous call to overweight growth and suggest moving towards a style neutral domestic equity portfolio. We continue to suggest an overweight to quality stocks. Valuations remain
attractive, and they are well-positioned to take advantage of the Fed’s policies. Many of these companies can borrow at rates less than their dividend yields. The broader low volatility universe has less appeal because high dividend plays appear pricey relative to the market. Stocks with moderate dividend yields and growth potential offer better value than those with high yields. We continue to suggest underweighting small-caps due to relative valuations.
While small-caps slightly outperformed large-caps in 2012, they trailed on a beta-adjusted basis. Momentum appears to be shifting in favor of large-caps and given relative valuations, we suspect that this is the start of a multi-year period of small-cap underperformance.
Valuation of Russell 1000 Growth to Valueand Subsequent Performance
0.0
0.3
0.5
0.8
1.0
1.3
1.5
1.8
2.0
1980
1982
1984
1986
1988
1990
1992
1994
1996
1998
2000
2002
2004
2006
2008
2010
2012
R10
00G
/R10
00V
Rel
ativ
e to
Mea
n
-20
-15
-10
-5
0
5
10
15
20
Subs
eque
nt 5
-Yr R
elat
ive
Perf
orm
ance
(%)
Valuation of R1000G/R1000VSubsequent 5-Yr Relative Return (R1000G - R1000V)
Sector Valuations - Ratio of High Quality to Low Quality(Based on Average of P/B, P/E and P/CF)
0.7
0.9
1.1
1.3
1.5
1.7
1.9
2.1
2.3
2.5
2.7
1995
1997
1999
2001
2003
2005
2007
2009
2011
Rel
ativ
e Va
luat
ion
ofH
igh
Qua
lity
/ Low
Qua
lity
US Equity Valuations by Capitalization
10.513.0
16.7
2.4
15.2
10.18.8
11.5
24.4
14.6
1.7
19.9
6.9
13.215.1
1.5
23.8
0
10
20
30
P/E - TrailingReported
P/E - 5 YrAverageEarnings
P/CF P/E - 1Yr.Forw ard(I/B/E/S)
DividendYield
EPS Grow th -Last 10 Yrs
Russell Top 200
Russell Midcap
Russell 2000
Quality stocks appea r attractively valued, trading below their historical premium.
Small-caps appear expensive relative to large caps based on most valuation measures. Small-caps' trailing P/E of 24 is 60% higher than that of large caps, and they trade at a 30% premium on P/CF. On forward earnings, small-caps traded at a 15% premium to large-caps.
Growth and value are trading at normal relati ve valuations.
Large-caps have grown earnings faster.
Source: Russell, Mercer
Source: Russell Source: Datastream, Mercer
There was a -0.7 correlation between the relative valuation and subsequent 5-yr return.
56.4
Value attractive Growth outperforms
Growth attractive Value outperforms
Quality attractive
Quality unattractive

MERCER Market Environment Report Winter 2013 (As of 12/31/2012) 17
Emerging market equities topped developed markets for the year
After tumbling 18.4% in 2011, emerging market stocks rebounded 18.2% in 2012, outperforming the S&P 500 by 220 basis points. Regional performance showed some dispersion, with Asian stocks rising a robust 20.8%, while Latin American equities returned just 8.7%. The macro outlook for emerging economies appears to be improving.
Earnings declined about 3.5% over the last twelve months, but appear to have bottomed after gaining 3% over the prior three months. Even after the strong rally, emerging market valuations remain compelling. Based on P/B and P/CF, emerging stocks are trading 7% below their historical median since 1996. Based on our measure of normalized earnings, they trade at a P/E of 13, a 40% discount to the US. The best values in emerging markets come from the more cyclical, globally-
sensitive sectors, such as energy. Locally-focused sectors (e.g., consumer staples) trade at large premiums to developed markets. Emerging market equities are likely to remain highly sensitive to the macro
sentiment given their high beta. However, they appear attractively valued in absolute and relative terms and remain priced to outperform developed market equities. We continue to suggest an overweight.
MSCI Emerging MarketsP/E Ratios
0
5
10
15
20
25
30
35
40
1996
1997
1998
1999
2000
2001
2002
2003
2004
2005
2006
2007
2008
2009
2010
2011
2012
Normalized P/ETrailing P/E
Valuation of MSCI Emerging Markets to Developed Markets(Based on an average of P/E, P/B and P/CF)
-60
-50
-40
-30
-20
-10
0
10
20
1996
1997
1998
1999
2000
2001
2002
2003
2004
2005
2006
2007
2008
2009
2010
2011
2012
(%)
Emerging markets are trading in-line with their historical median since 1996. However, they traded at a normalized of P/E of just 13, which is 15% below our estimate of fair value.
Based on a mix of valuation measures, EM stocks are trading at a 10% discount to developed equities. They are trading in-line with Japanese and European stocks, but at a 28% discount to US stocks.
The historical discount has been larger, but developing economies are structurally more sounder than they were in the 1990s, and developed economies are less stable.
Discount/Premium of MSCI Emerging Markets Sectors to Developed Markets Sectors
(Based on an average of P/B, P/CF, and P/E)
-30-20-10
010203040506070
Hea
lth C
are
Con
s. S
tapl
es
Tele
com
Fina
ncia
ls
Indu
stria
ls
Con
s. D
isc.
Mat
eria
ls
Utili
ties
I.T.
Ener
gy
Inde
x
(%)
Investors might be overpaying for exposure to local consumption. Sectors that have more exposure to local growth are trading at significant premiums to developed world equities, while more cyclical, global sectors are trading at discounts.
Source: BloombergSource: Datastream, Mercer
Source: Bloomberg, Mercer
Health care and consumer staples trade at P/E ratios of 29 and 26, respectively, in emerging markets.
MERCER Market Environment Report Winter 2013 (As of 12/31/2012) 18
European Equity Valuations
0.0
0.5
1.0
1.5
2.0
2.5
3.0
3.5
4.0
4.5
1975
1978
1981
1984
1987
1990
1993
1996
1999
2002
2005
2008
2011
P/B
0
2
4
6
8
10
12
14
16
18
P/C
F
P/B
P/CF
International developed equity valuations remain more attractive than US
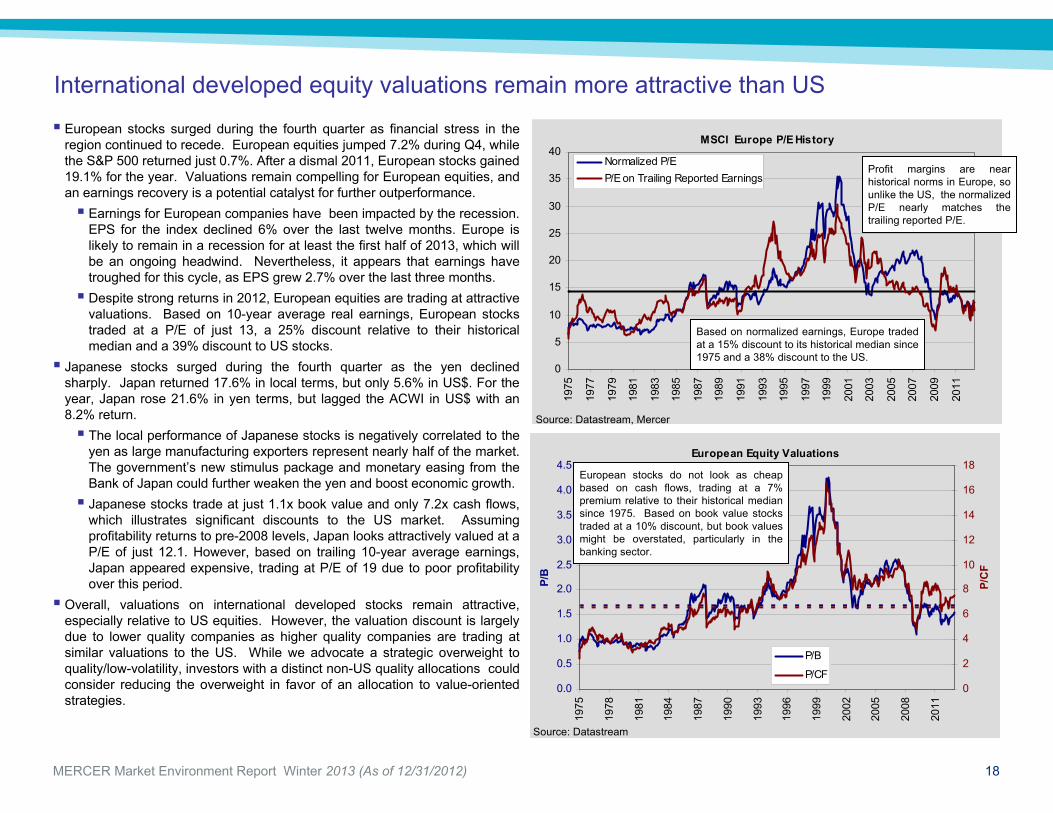
European stocks surged during the fourth quarter as financial stress in the region continued to recede. European equities jumped 7.2% during Q4, while the S&P 500 returned just 0.7%. After a dismal 2011, European stocks gained 19.1% for the year. Valuations remain compelling for European equities, and an earnings recovery is a potential catalyst for further outperformance. Earnings for European companies have been impacted by the recession.
EPS for the index declined 6% over the last twelve months. Europe is likely to remain in a recession for at least the first half of 2013, which will be an ongoing headwind. Nevertheless, it appears that earnings have troughed for this cycle, as EPS grew 2.7% over the last three months. Despite strong returns in 2012, European equities are trading at attractive
valuations. Based on 10-year average real earnings, European stocks traded at a P/E of just 13, a 25% discount relative to their historical median and a 39% discount to US stocks.
Japanese stocks surged during the fourth quarter as the yen declined sharply. Japan returned 17.6% in local terms, but only 5.6% in US$. For the year, Japan rose 21.6% in yen terms, but lagged the ACWI in US$ with an 8.2% return. The local performance of Japanese stocks is negatively correlated to the
yen as large manufacturing exporters represent nearly half of the market. The government’s new stimulus package and monetary easing from the Bank of Japan could further weaken the yen and boost economic growth. Japanese stocks trade at just 1.1x book value and only 7.2x cash flows,
which illustrates significant discounts to the US market. Assuming profitability returns to pre-2008 levels, Japan looks attractively valued at a P/E of just 12.1. However, based on trailing 10-year average earnings, Japan appeared expensive, trading at P/E of 19 due to poor profitability over this period.
Overall, valuations on international developed stocks remain attractive, especially relative to US equities. However, the valuation discount is largely due to lower quality companies as higher quality companies are trading at similar valuations to the US. While we advocate a strategic overweight to quality/low-volatility, investors with a distinct non-US quality allocations could consider reducing the overweight in favor of an allocation to value-oriented strategies.
MSCI Europe P/E History
0
5
10
15
20
25
30
35
40
1975
1977
1979
1981
1983
1985
1987
1989
1991
1993
1995
1997
1999
2001
2003
2005
2007
2009
2011
Normalized P/EP/E on Trailing Reported Earnings
Based on normalized earnings, Europe traded at a 15% discount to its historical median since 1975 and a 38% discount to the US.
European stocks do not look as cheap based on cash flows, trading at a 7% premium relative to their historical median since 1975. Based on book value stocks traded at a 10% discount, but book values might be overstated, particularly in the banking sector.
Source: Datastream
Source: Datastream, Mercer
Profit margins are nea r historical norms in Europe, so unlike the US, the normalized P/E nearly matches the trailing reported P/E.

MERCER Market Environment Report Winter 2013 (As of 12/31/2012) 19
International developed equity valuations remain more attractive than US (cont.)
Discount/Premium of MSCI EMU to MSCI US (Based on average of P/E, P/B, P/CF)
-70
-60
-50
-40
-30
-20
-10
0
10
Tele
com
Utili
ties
Con
s. D
isc.
Ener
gy
Mat
eria
ls
Fina
ncia
ls
Indu
stria
ls
Hea
lth C
are
Con
s.St
aple
s
Info
. Tec
h
Inde
x
(%) Cyclical and “local” stocks are
trading at a significant discount to the US. These stocks are most exposed to break-up risk and the recession. Given these discounts, deep value managers hold some appeal.
Defensive sectors and those with a global orientation are trading in-line with their US counterparts.
The index trades at a sizable discount to the US based on a mix of valuation measures
Global Equity Valuations
11.5
1.43.7
18.913.3
n/a
24.6
13.612.9
14.4
7.67.17.2
8.4
0.81.11.5
2.3
2.22.9
0
5
10
15
20
25
30
Large Small Large Small
Europe Japan
P/E Trailing P/E Forw ard
P/CF P/B
Div. Yield
Japanese Equity Valuations
0.0
1.0
2.0
3.0
4.0
5.0
6.0
1975
1978
1981
1984
1987
1990
1993
1996
1999
2002
2005
2008
2011
P/B
0
5
10
15
20
25
30
P/C
F
P/B
P/CF
Shiller's P/E Ratio for MSCI Japan (Based on 10-year Average Real Earnings)
0
20
40
60
80
100
120
1980
1982
1984
1986
1988
1990
1992
1994
1996
1998
2000
2002
2004
2006
2008
2010
2012
PE
0
2
4
6
8
10
12
RO
E (%
)
PE (L. scale)
ROE (R. scale)
Historical valuation comparisons must be made with caution for Japan due to the enormous bubble that inflated in the 1980s. Still, the P/B ratio is in the bottom decile of historical observations, while the P/CF ratio is in the bottom third.
As in the US, European small-caps appear richly-valued relative to large- caps. Japanese small-caps, however, are relatively attractive.
Source: Bloomberg
Source: Datastream
Source: Datastream
Source: Datastream
Shiller’s P/E ratio on Japan remains high at 19 due to low profitability. Profitability is slowly recovering, but has not yet reached pre-bust norms.

MERCER Market Environment Report Winter 2013 (As of 12/31/2012) 20
Bond Yields
0.9
1.7 2.32.7
6.1
2.2
5.5
3.7
1.0
2.22.7
8.4
2.8
6.6
1.9
3.83.73.0
4.0
7.56.7
0
2
4
6
8
10
Agg. Treas GSE MBS I/G Corp HY Corp Munis Local EMD
(%)
Dec-12 Dec-11 Dec-10
Treasury Yield Curve
-2
-1
0
1
2
3
4
5
3 mo 6 mo 1 yr 2 Yr 3 Yr 5 yr 7 yr 10 yr 20 yr 30 yr
(%)
Treasuries at 12/31/10 TIPS at 12/31/10Treasuries at 12/31/11 TIPS at 12/31/11Treasuries at 12/31/12 TIPS at 12/31/12
Fixed income: Credit rallied in 2012, but little upside remains The Barclays Treasury index returned 2.0% in 2012, its lowest annual return
since 2009. Several macro factors in Europe and the US contributed to yield volatility throughout the year. The 10-year Treasury yield reached a record low of 1.47% in June and rose to 1.78% by year end, only 9 bps lower than where it started the year. While nominal yields did not move much in 2012, real yields on TIPS plunged
deeper into negative territory on higher inflation expectations. At year end, 10-year TIPS yielded -0.67%, down from -0.07% at the start of the year. The inflation breakeven rate on 10-year TIPS increased by 49 bps to 2.45%. Extremely low yields mean Treasury investors are all but certain to lose
purchasing power over the intermediate-term. The Fed does not intend to raise short-term interest rates until unemployment reaches 6.5% or inflation climbs above 2.5%, which should anchor the yield curve, and the Fed will absorb a third of the new Treasury supply in 2013. While we do not expect a significant increase in rates over the short-term, the risks are decidedly asymmetric. Over 1-year, the 10-year Treasury’s yield only needs to rise to 2.0% for capital losses to offset the yield. Apart from liability hedging purposes, there is little reason to take significant duration risk in Treasuries. A big story in 2012 was the continued improvement in credit strategies.
Investment grade bonds surged 9.8% for the year, as the yield on the Barclays I/G Corporate index fell by 103 bps, finishing the year at only 2.7%. It’s unlikely that yields will decline materially from present levels, meaning that future upside will be limited to the current yield less the impact of downgrades/defaults. Credit still offers reasonable value relative to Treasuries, as the spread of 1.4% is above the 1% historical median. We continue to favor credit over Treasuries. Should Treasury yields rise, we expect the spread to narrow further, cushioning losses for credit. The credit rally led to a 15.8% return for high yield bonds in 2012. The yield
on junk bonds finished at a record low 6.1%. Net of full cycle typical default losses, high yield bonds are priced to return only 3% to 4%. High yield bonds still appear reasonably attractive relative to Treasuries with a spread of 5.1%, and the short-term default outlook is favorable. An intermediate-term concern is that new issuance quality has worsened. Of course, high yield tends to behave more like equities than bonds, and equities currently offer a much better risk-to-reward for longer-term investors. Private credit investments still have appeal. Spreads on illiquid debt
securities have not compressed to the same extent as they have in public markets.
Source: Federal Reserve
The premium for extending duration remains small by historical standards. Real yields on TIPS are negative out to nearly 20 years.
Source: Barclays
Yields in several fixed income markets finished the year at or near record lows.
Yields declined across all fixed income sectors during 2012.
Despite the Fed’s purchases of MBS under QE3, the yield increased during the fourth quarter.

MERCER Market Environment Report Winter 2013 (As of 12/31/2012) 21
High Yield Bond Credit Spread
0
2
4
6
8
10
12
14
16
18
20
1987
1989
1991
1993
1995
1997
1999
2001
2003
2005
2007
2009
2011
(%)
Investment-Grade Corporate Bond Credit Spread
0
1
2
3
4
5
6
7
1990
1992
1994
1996
1998
2000
2002
2004
2006
2008
2010
2012
(%)
Fixed income: Credit rallied in 2012, but little upside remains (cont.)
Although absolute yields on investment grade are near record lows, the spread remains 39 bps above the historical median.
Source: Barclays
Ultra-low yields give investors little cushion to protect against future interest rate increases. Tilting toward corporate bonds improves the picture, but they suffer from the same dynamic as well.
Fed policy is likely to anchor rates over the next few years. However, if the 5-year returns to its 2011 high of 2.3% over three years, it would mean losses of 0.3%, annualized.
Source: Bloomberg, Mercer
Source: Barclays
The spread on junk bonds decreased 188 bps in 2012 to 5.1%, only 0.2% above the historical median. A benign default outlook and a continued search for yield should support low spreads.
Corporate Bond Issuance by Year
613696
1,020
843
132
1,114
880
1,074
809750
977
733
59 132 101 149 148 66
288
163244
354
0
500
1,000
1,500
2,000
2002 2003 2004 2005 2006 2007 2008 2009 2010 2011 2012
$ B
illio
ns Investment Grade
High Yield
EndingYield (%) 1 Yr (%) 2 Yr (%) 3 Yr (%)
5-Year Treasury (YTM = 0.72)0.3 2.4 1.3 1.00.8 0.3 0.6 0.71.0 (0.4) 0.3 0.51.5 (2.3) (0.4) 0.22.0 (4.2) (1.2) (0.1)2.5 (6.1) (1.9) (0.5)
Breakeven Yield 0.9 1.2 1.810-Year Treasury (YTM = 1.78)
1.5 4.2 2.8 2.41.9 0.7 1.3 1.52.0 (0.1) 0.9 1.32.5 (4.1) (0.9) 0.23.0 (8.0) (2.7) (0.9)3.5 (11.7) (4.5) (2.0)
Breakeven Yield 2.0 2.3 2.6
Annualized Return Over Period
2012 saw record issuance of both investment grade and high yield bonds. Much of this was used to refinance existing debts at lower rates, which improves cash flow.
Source: Bloomberg

MERCER Market Environment Report Winter 2013 (As of 12/31/2012) 22
2012 Performance of Foreign Currencies Versus the Dollar
-15
-10
-5
0
5
10
Mex
ican
Pes
o
Kore
an W
on
New
Zea
land
Dol
lar
GB
Poun
d
Taiw
an D
olla
r
Can
adia
n D
olla
r
Swis
s Fr
anc
Aust
ralia
n D
olla
r
Euro
Chi
nese
Yua
n
Indi
an R
upee
Braz
ilian
Rea
l
Japa
nese
Yen
(%)
Currencies: A race to the bottom
Source: Bloomberg
The yen declined 10.1% in the fourth quarter alone, while the euro added 2.6% in Q4.
On a trade-weighted basis, the dollar declined 0.8% in the fourth quarter and finished the year down 2.0%. The euro appreciated by 2.6% against the dollar during the quarter, reflecting the further easing of financial tensions. The most notable action was for the yen, which plunged 10.1% in Q4 as newly elected Prime Minister Shinzo Abe introduced fiscal stimulus and pressured the Bank of Japan to increase its inflation target. It was generally a good year for emerging market currencies, with the Indian rupee and Brazilian real being notable exceptions. Central bank policies are likely to continue to heavily influence currency
markets in 2013. While the Fed pursued an aggressive QE program in 2012, the negative effect on the dollar was relatively muted as other major central banks took part in monetary easing programs. The expansion of QE3 reinforces monetary policy risks for the dollar.
The Fed continues to be among the most aggressive of global central banks. On the other hand, the dollar remains undervalued against most developed currencies based on relative purchasing power parity. The US still has a very high current account deficit, but the boom in natural gas should help reduce this due to falling net energy imports. The long-term bearish case for the yen is compelling in light of the
country’s weak growth, oppressive debt loads and rising trade deficit. However, the country is still experiencing mild deflation (which is bullish) and it is unclear how aggressive the Bank of Japan will actually be in attempting to hit its new 2% inflation target. We also caution that the short yen trade has quickly become a favorite among currency speculators, hinting the potential for a reversal. The outlook for the euro is mixed, with a bias toward weakness. The ECB
has stepped up and reinforced its role as lender of last resort, which has reduced systemic risk, but unlike the Fed, it has resisted monetary stimulus and still has a 0.75% overnight lending rate. Of course, the economic challenges facing the Eurozone are daunting. Further, the euro appears fairly expensive once again on purchasing power parity. These factors are likely to leave the currency susceptible to declines. The Australian dollar has been a favorite among speculators and carry
traders because it is one of only a few developed economies offering a positive real return. However, the overvaluation based on purchasing power parity exceeds 30% relative to the US dollar.
Central Bank Balance Sheet Growth
50
100
150
200
250
300
350
400
450
500
Jan-
08
May
-08
Sep-
08
Jan-
09
May
-09
Sep-
09
Jan-
10
May
-10
Sep-
10
Jan-
11
May
-11
Sep-
11
Jan-
12
May
-12
Sep-
12
(1/2
008=
100)
US EMUUK JapanSw itzerland
Source: Bloomberg
The central bank balance sheets of the US, UK and Switzerland have more than tripled since the crisis. The ECB and BoJ have been more restrained.
The euro’s modest appreciation for the year bucked the consensus call for depreciation.

MERCER Market Environment Report Winter 2013 (As of 12/31/2012) 23
Net Speculative Positioning in Euro and JPY
-250
-200
-150
-100
-50
0
50
100
150
200
2005
2005
2006
2006
2007
2007
2008
2008
2009
2009
2010
2010
2011
2011
2012
2012
Bill
ion
Con
trac
ts
EURJPY
Currency Valuation Versus US Dollar(Based on Relative PPP)
-30
-15
0
15
30
45
1990
1992
1994
1996
1998
2000
2002
2004
2006
2008
2010
2012
(%)
Euro UK PoundYen Sw iss Franc
Source: Bloomberg
The euro trades at about a 14% premium to the dollar based on relative purchasing power parity.
Dollar Cheap
Dollar Expensive
Global Central Bank Rates
0
2
4
6
8
10
12
14
16
2007
2008
2009
2010
2011
2012
(%)
US EuropeJapan UKChina IndiaBrazil
Real Interest Rates and Current Account Balances
-4
-3
-2
-1
0
1
2
3
4
Switz
erla
nd
Taiw
an
Chi
na
Kore
a
Japa
n
Euro
zone
Mex
ico
Braz
il
US
UK
Can
ada
Indi
a
Aust
ralia
Rea
l Int
eres
t Rat
e (%
)
-12
-9
-6
-3
0
3
6
9
12
Cur
rent
Acc
ount
Bal
ance
(% o
f GD
P)
Real 3M rate (LS)
Current Account Balance (2012F, RS)
Currencies: A race to the bottom (cont.)
Speculative short positions in the yen are at their highest since the carry trade craze in 2006/07.
Traders have slashed their short positions in the euro since the OMT program.
Source: Bloomberg
Source: Bloomberg
Source: Bloomberg
The Eurozone current account balance is close to flat.
All but three countrie s shown here have negative real interest rates.
Japan’s real interest rates are higher than those in most other developed economies due to low inflation.

MERCER Market Environment Report Winter 2013 (As of 12/31/2012) 24
Fundamentals supportive of local currency emerging debt Local currency emerging market debt posted strong returns in 2012. The
JPMorgan GBI-EM Global Diversified index appreciated 16.8% as declines in local yields and currency appreciation boosted returns. The 5.45% yield on local emerging debt is at an all time low; however,
fundamental factors remain supportive relative to developed economies. Emerging governments are less indebted than developed governments
and the credit quality of their debt has been steadily improving. While inflation risks are higher in emerging economies relative to most
developed peers, the credibility of many emerging central banks has improved as a result of successful policies targeted at containing inflation. Volatile commodity prices could have an outsized effect on short-term inflation; however, in the long run, the trend of converging inflation in emerging and developed economies should continue. Strong growth rates, favorable current account balances and currency
reserves could lead to currency appreciation for emerging economies. A cause of concern is that yields are now approaching levels that may cause
“growth asset” investors to question the use of emerging debt as a substitute for equities.
Local Currency EM Debt Yields and Inflation
0
2
4
6
8
10
12
2002
2003
2004
2005
2006
2007
2008
2009
2010
2011
2012
(%)
Yields
Inflation
Real yields on local currency EM debt are positive; however, they have contracted to approximately 1% based on projected 12- month inflation.
Source: Datastream, IMF, JPMorgan, Mercer
Government Debt (% of GDP)
0
20
40
60
80
100
120
2000
2002
2004
2006
2008
2010
2012
2014
2016
(%)
Developed
Emerging
Emerging market debt burdens are likely to decline over the next several years given fast GDP growth rates.
Source: IMF
Emerging Market Debt Credit Spread(US$ Denominated)
0
2
4
6
8
10
12
14
1993
1995
1997
1999
2001
2003
2005
2007
2009
2011
(%)
Source: Barclays
Credit spreads on US$ denominated EM debt have fallen below historical averages, although credit quality has been improving. We continue to favor local currency EM debt over US$ debt.

MERCER Market Environment Report Winter 2013 (As of 12/31/2012) 25
The global real estate securities market performed well during the fourth quarter of 2012 with all regions posting positive returns. The FTSE EPRA NAREIT Developed index gained 5.8% during the fourth quarter and ended up 28.7% for 2012. The US REIT benchmark gained 2.6% for the quarter and 18.1% for the year. As of December 31, 2012, the US REIT dividend yield stood at 3.7% while
the global property securities dividend yield was 3.6%. Movements in REIT share prices continued to be influenced by the risk-
on/risk-off shifts of the broader equity market. According to Green Street Advisors, US REITs trade at a 13% premium
to their net asset value. Most international REITs continue to trade at discounts. US REIT valuations are unattractive given their premium to NAV and low
dividend yields. On a global basis, REIT valuations appear more reasonable, however the potential for volatility should be factored in as well. REITs also currently provide yield in an environment where such investment options are in short supply.
In the private real estate market, the NCREIF ODCE total return before fees for 3Q12 was 2.77% (1.31% income and 1.45% appreciation) compared to 2.58% during the second quarter and 3.52% one year ago. This quarter marked an uptick in appreciation for the first time in the last four quarters with a slight increase of 22 bps. The combination of low rates on 10-year US Treasuries and cap rates
that have seen little compression during 2012, spreads on commercial real estate remain attractive. Property values for core assets have risen at a steady pace over the last
twelve months and values are now, on average, within a couple of percentage points of their 2007 highs. Occupancy for properties in the index increased for the eighth
consecutive quarter to 90.3% but it remains below the pre-recession level of 91.5% reported at the end of 2007. Leverage for the funds in the index fell in the third quarter, dropping to
22.7% from 23.0% last quarter. Other than a slight uptick in the fourth quarter 2011, leverage has fallen steadily since peaking at 33.5% in the fourth quarter of 2009.
Global REITs produced strong returns in 2012
Yield Premium on US REITS Versus Real Long Bond Yields
0
1
2
3
4
5
6
7
8
9
10
1990
1992
1994
1996
1998
2000
2002
2004
2006
2008
2010
2012
(%)
Source: Federal Reserve, NAREIT
US REIT dividend yields are near all-time lows, but the spread to long-term Treasury yields is close to historical norms. REITS and other high dividend equities are susceptible to a back-up in Treasury yields.
Source: RREEF
Dividend Yields REITs and Real Long Bond Yield
0
2
4
6
8
10
12
1990
1992
1994
1996
1998
2000
2002
2004
2006
2008
2010
2012
(%)
US REITSNon-US REITSReal Long Treasury Yield
Source: Federal Reserve, Datastream, NAREIT

MERCER Market Environment Report Winter 2013 (As of 12/31/2012) 26
US Private Equity Commitments by Year
0
50
100
150
200
250
300
350
1995
1996
1997
1998
1999
2000
2001
2002
2003
2004
2005
2006
2007
2008
2009
2010
2011
2012
$ B
illio
ns
Venture Buyouts Distressed & Other PE Mezzanine Secondary FOFs
Performance of Private Equity vs. Public Equities(as of 6/30/2012)
0% 5% 10% 15% 20% 25%
5 Yr
10 Yr
15 Yr
20 Yr
All Venture Capital All Buyouts
All Private Equity Wilshire 5000 (6/30/2012)
Private equity performance stacks up well against public markets US private equity performance has been positive for 12 of the last 13 quarters
ending 6/30/2012. Second quarter performance was down versus the prior quarter, but that is to be expected given that private equity tends to lag public equities, and public equities declined as well. On a longer-term basis, private equity has outperformed public markets by a reasonable margin over 5, 10, 15 and 20-year periods. The fundraising dynamics in venture capital, favoring information technology
funds over all else, have led to a noticeable lack of capital for early stage life science funds. Life science venture investment activity was down about 15% in 2012 compared to 2011. The shift in sentiment away from life science is creating an imbalance that might present an attractive opportunity for those willing to commit to the space. Buyout investment activity (by dollar volume) was down 12% in 2012 as
political and economic uncertainties weighed on investors. Interestingly, large transactions (over $1 billion in value) represented 66% of total volume, over twice their 10-year average. This might indicate that mega-buyout funds raised in the boom years of 2006-2008 are forcing capital to work before investment periods expire. Venture exit volume was up 24% by dollar volume in 2012 led primarily by a
receptive IPO market. M&A exits were down about 11%, but are still active. In summary, 2012 looks to be a strong year for the private equity industry. If
exit activity is any indication, then we would expect 2012 performance data to be solidly positive when it is reported. Buyouts – US middle market buyout funds appear more attractive than
their larger peers. We favor strong operators globally. Venture Capital – Capital flows argue for over-weighting life science
funds. Growth strategies are still attractive. Special Situations – Emphasis continues to be on control-oriented
distressed strategies rather than trading strategies. Europe could provide some opportunity. Investors with existing exposure should underweight. Mezzanine strategies – Mezzanine debt strategies offer interesting risk-
adjusted returns for investors with a desire for income. Limited upside makes this more interesting as an alternative to liquid credit exposure rather than as a part of a private equity allocation. Secondaries – Although market pricing levels do not argue for allocating
new capital, we have a positive outlook for high quality managers that have continued to extract value from this market.
Source: Venture Economics
Source: Venture Economics
+2.9%
+4.0%
+2.0%
+3.8%
Private equity ha s meaningfully outperform ed public equities across all time periods.
2012 fundraising surpassed 2011 in all strategies

MERCER Market Environment Report Winter 2013 (As of 12/31/2012) 27
Hedge Fund Performance
1.3
4.2
3.2
1.9
0.9
-1.2
2.9
0.2
4.8
8.6
7.4
3.0
-0.4
16.2
4.2
1.2
1.9
2.9
10.4
8.6
-4 2 8 14
HFRI FOF
HFRI Distressed
HFRI Event-Driven
HFRI Convertible Arbitrage
HFRI Equity Hedge
HFRI Merger Arb
HFRI Equity Market Neutral
HFRI Macro
MSCI ACWI
Barclays Agg
(%)
Fourth Quarter2012
S&P 500 Inter-Stock Correlation
0.4
0.5
0.6
0.7
0.8
0.9
Sep-07
Mar-08
Sep-08
Mar-09
Sep-09
Mar-10
Sep-10
Mar-11
Sep-11
Mar-12
Sep-12
Rol
ling
3-M
onth
Cor
rela
tion
-25
-20
-15
-10
-5
0
5
HFR
X C
umul
ativ
e R
etur
n (%
S&P 500 Inter-Stock Correlation (L-Scale)HFRX Global (R-Scale)
Hedge funds lagged balanced portfolios in 2012
Source: Bloomberg, Hedge Fund Research
Source: Hedge Fund Research
Hedge funds posted modest absolute performance in 2012
The fourth quarter marked a quiet end to a relatively modest year for hedge fund performance. With the exception of the second quarter, it was primarily a “risk-on” year, as markets shrugged off macro risks. As opposed to “risk- on” periods of the recent past, the markets were more discriminate, which created a more favorable backdrop for hedge fund investing. Despite this, hedge funds only posted a 4.8% return for the year, topping bonds but meaningfully underperforming a broad 60/40 mix (60% MSCI ACWI / 40% Barclays Agg), which earned 11.5%. Distressed and event-driven strategies led the quarter and the year, as a
result of favorable developments in a number of restructuring and liquidation holdings. Generally, exposure to special situation equities was beneficial. At the aggregate, long/short equity had a disappointing year. Dispersion
among equities was broadly accommodative (illustrated bottom right), with many managers generating positive stock selection alpha on both the long and short sides of the portfolio. However, the 7.4% return generated by the strategy was mostly explained by long exposure. Anecdotally, managers increased their long exposure into year-end. Convertibles benefitted from generally improved economic sentiment, a
relatively light uptick in new issue volume and decent opportunities related to capturing volatility. Merger arbitrage strategies produced positive returns in what was a
relatively difficult year. Spreads were reasonable as was deal flow. However, a series of difficulties in a handful of larger deals, including some deal breaks, weighed on performance for the year. Fundamentals still appear supportive of the M&A cycle forward looking. Macro strategies were the laggard of 2012. A lack of sustainable trends
created a challenging environment for systematic strategies, with commodity-related exposure being generally punished. Discretionary managers, particularly those focused outside of Europe, fared better with increased trading opportunities resulting from policy actions. A consensus short yen position saved many managers’ year in Q4.
Over the past five years, we have witnessed historic spikes in correlations, which has led securities to move broadly in-lock step with one another. Unsurprisingly, these periods have created challenges for hedged, security selection specialists. While correlations remain elevated relative to historical levels, we have begun to see improvement, which should prove beneficial to these strategies.
Spikes in correlations among securities create challenges for hedge fund investing.

MERCER Market Environment Report Winter 2013 (As of 12/31/2012) 28
Liability driven investing: Maintain tactical under-hedge
Spot Yield Curve Versus Fair Value(As of January 9, 2013)
0.0%
0.5%
1.0%
1.5%
2.0%
2.5%
3.0%
3.5%
4.0%
4.5%
5.0%
0 5 10 15 20 25 30
Years
Yield curve Fair Value Yield Curve
For the fair value yield curve, we assume that future spot short rates converge to a long term real yield of 2.1%, an assumed inflation rate of 2.5% and an inflation risk premium of 0.3%. We assume that future spot short rates for the next three years follow forward rates and revert to our long-term rates over the ensuing five years.
Mercer’s assumed fair value rates are on average 82 bps in excess of current rates at tenors over 20 years and 58 bps in excess of current rates from 5 to 20 years.
We define fair value rates as those rates applying today that would allow a plan to lengthen duration with no change in expected return. As of January 9, Mercer’s assumed fair value rates are on average 82 bps in excess of current rates at tenors over 20 years, making long rates extremely unattractive. However, due to the recent small spike in rates following the partial resolution of the fiscal cliff this has improved from last quarter’s 91 bp gap. At the medium part of the curve from 5 to 20 years, fair value rates are on
average 58bps in excess of current spot rates, also making them extremely unattractive, but an improvement of 66 bps as of last quarter. Given the current low rate environment, for those plans that are currently under their target interest rate hedge ratio, we support maintaining a measured tactical under-hedged position. The Treasury curve has flattened since the announcement of QE3 resulting in
less yield advantage over the swap curve. Sponsors looking to extend duration via swaps (receive fixed) receive better yields in the short to medium tenors (out to about 10 years). Treasury futures and STRIPS offer relatively richer yields in the longer end of the curves, thus are more attractive for duration exposure than swaps. Investment-grade credit spreads have compressed and are currently
approximately half a standard deviation above the long term average. We still see these instruments as favorable for hedging purposes and favor an overweight credit spread exposure relative to the strategic benchmark, after taking note of any credit exposure the plan may obtain through its equities. The recent funding stabilization bill has given flexibility to the way that plans
can calculate minimum cash contributions. The investment implications of funding stabilization depend to a great degree on a sponsor’s objectives, time horizon and balance between cash funding and investment returns. Sponsors may wish to consider revisiting the LDI and investment strategy. We have seen an increase in interest from sponsors in using insurance
solutions as a risk management option, in particular following GM’s recent announcement that it would transfer $26bn of retiree liabilities through a combination of lump sums and a buy-out. In addition, Verizon announced that it would settle $7.5m of retiree liabilities through a buyout transaction, around 25% of its pension obligations. In both cases, the sponsors made significant additional contributions to fund these transactions in return for reduced volatility going forward.
Treasuries Versus Swaps(As of January 9, 2013)
0.0
0.5
1.0
1.5
2.0
2.5
3.0
3.5
4.0
0 5 10 15 20 25 30
Years
(%)
Treasury Curve
USD Sw ap Curve

MERCER Market Environment Report Winter 2013 (As of 12/31/2012) 29
Important NoticesReferences to Mercer shall be construed to include Mercer LLC and/or its associated companies.
© 2013 Mercer LLC. All rights reserved.
This contains confidential and proprietary information of Mercer and is intended for the exclusive use of the parties to whom it was provided by Mercer. Its content may not be modified, sold or otherwise provided, in whole or in part, to any other person or entity, without Mercer’s prior written permission.
The findings, ratings and/or opinions expressed herein are the intellectual property of Mercer and are subject to change without notice. They are not intended to convey any guarantees as to the future performance of the investment products, asset classes or capital markets discussed. Past performance does not guarantee future results. Mercer’s ratings do not constitute individualized investment advice.
Information contained herein has been obtained from a range of third party sources. While the information is believed to be reliable, Mercer has not sought to verify it independently. As such, Mercer makes no representations or warranties as to the accuracy of the information presented and takes no responsibility or liability (including for indirect, consequential or incidental damages), for any error, omission or inaccuracy in the data supplied by any third party.
This does not constitute an offer or a solicitation of an offer to buy or sell securities, commodities and/or any other financial instruments or products or constitute a solicitation on behalf of any of the investment managers, their affiliates, products or strategies that Mercer may evaluate or recommend.
For the most recent approved ratings of an investment strategy, and a fuller explanation of their meanings, contact your Mercer representative.
For Mercer’s conflict of interest disclosures, contact your Mercer representative or see www.mercer.com/conflictsofinterest.
Mercer universes: Mercer’s universes are intended to provide collective samples of strategies that best allow for robust peer group comparisons over a chosen timeframe. Mercer does not assert that the peer groups are wholly representative of and applicable to all strategies available to investors.
The value of your investments can go down as well as up, and you may not get back the amount you have invested. Investments denominated in a foreign currency will fluctuate with the value of the currency. Certain investments, such as securities issued by small capitalization, foreign and emerging market issuers, real property, and illiquid, leveraged or high-yield funds, carry additional risks that should be considered before choosing an investment manager or making an investment decision.
Returns for periods greater than one year are annualized. Returns are calculated gross of investment management fees, unless noted as net of fees.
Style analysis graph time periods may differ reflecting the length of performance history available.
THE FOLLOWING PROVISIONS APPLY TO DATA OR OTHER SERVICES PROVIDED BY THE FOLLOWING COMPANIES: Where “End User” appears before the Vendor name, a direct end-user license with the Vendor is required to receive some indices. You are responsible for ensuring you have in place all such licenses as are required by Vendors.
BARCLAYS: © Barclays Bank PLC 2013. This data is provided by Barclays Bank PLC. Barclays Bank PLC and its affiliated companies accept no liability for the accuracy, timeliness or completeness of such data which is provided “as is.” All warranties in relation to such data are hereby extended to the fullest extent permitted under applicable law.
BARCLAYS CAPITAL: The Barclays Indices are a proprietary product of Barclays. Barclays shall maintain exclusive ownership of and rights to the Barclays Indices and that inclusion of the Barclays Indices in this Service shall not be construed to vest in the subscriber any rights with respect to the Indices. The subscriber agrees that it will not remove any copyright notice or other notification or trade name or marks of Barclays that may appear in the Barclays Indices and that any reproduction and/or distribution of the Barclays Indices (if authorized) shall contain such notices and/or marks.
BLOOMBERG L.P.: © 2013 Bloomberg L.P. All rights reserved. BLOOMBERG, BLOOMBERG PROFESSIONAL, BLOOMBERG FINANCIAL MARKETS, BLOOMBERG NEWS, BLOOMBERG TRADEMARK, BLOOMBERG BONDTRADER, AND BLOOMBERG TELEVISION are trademarks and service marks of Bloomberg L.P. a Delaware Limited Partnership.
BNY Mellon Asset Servicing: Source: © 2013 BNY Mellon Performance Risk and Analytics, LLC. All Rights Reserved.
CITIGROUP GLOBAL MARKETS (formerly SALOMON SMITH BARNEY): Smith Barneysm and Citigroup Global Equity Indexsm are service marks of Citigroup Inc. "BECAUSE ACCURACY COUNTS®" is a registered service mark of Citigroup Inc. FloatWatch© is a trade mark of Citigroup Inc. Citigroup Global Equity Index Systemsm , Citigroup Broad Market Indexsm, Citigroup Primary Market Indexsm, Citigroup Extended Market Indexsm, Citigroup Cap-Range Indexsm, Citigroup Internet Index (NIX)sm, Citigroup Style Indices (Growth/Value)sm, Citigroup Property Indexsm are service marks of Citigroup Inc. ©2013 Citigroup Inc All rights reserved. Any unauthorized use, duplication or disclosure is prohibited by law and may result in prosecution. Citigroup, including its parent, subsidiaries and/or affiliates ("the Firm"), usually makes a market in the securities discussed or recommended in its report and may sell to or buy from customers, as principal, securities discussed or recommended in its report. The Firm or employees preparing its report may have a position in securities or options of any company discussed or recommended in its report. An employee of the Firm may be a director of a company discussed or recommended in its report. The Firm may perform or solicit investment banking or other services from any company discussed or recommended in its report. Securities recommended, offered, or sold by SSB: (i) are not insured by the Federal Deposit Insurance Corporation; (ii) are not deposits or other obligations of any insured depository institution (including Citibank); and (iii) are subject to investment risks, including the possible loss of the principal amount invested. Although information has been obtained from and is based upon sources SSB believes to be reliable, we do not guarantee its accuracy and it may be incomplete or condensed. All opinions and estimates constitute SSB’s judgment as of the date of the report and are subject to change without notice. Its report is for informational purposes only and is not intended as an offer or solicitation for the purchase or sale of a security. Its report does not take into account the investment objectives or financial situation of any particular person. Investors should obtain advice based on their own individual circumstances before making an investment decision.

MERCER Market Environment Report Winter 2013 (As of 12/31/2012) 30
Important NoticesCREDIT SUISSE FIRST BOSTON LLC. (CSFB): Copyright © 1996 – 2013 Credit Suisse First Boston LLC and/or its affiliate companies. All rights reserved.
DataStream : Source: ThomsonReuters Datastream
Dow Jones: The Dow Jones IndexesSM are proprietary to and distributed by Dow Jones & Company, Inc. and have been licensed for use. All content of Dow Jones IndexesSM © 2013 is proprietary to Dow Jones & Company, Inc.
“End User” FTSE™ : is a trade mark of the London Stock Exchange PLC and The Financial Times Limited and is used by FTSE International Limited under license. Russell Investment Group Europe Ltd is licensed by FTSE International Limited to distribute FTSE Advanced Service and other FTSE indices. FTSE shall not be responsible for any error or omission in FTSE data. All copyright and database rights in FTSE products belong to FTSE or its licensors. Redistribution of the data comprising the FTSE products is not permitted. You agree to comply with any restrictions or conditions imposed upon the use, access, or storage of the data as may be notified to you by FTSE or Russell/Mellon Europe Ltd. You are not permitted to receive the FTSE Advanced Service unless you have a separate agreement with FTSE. “FTSE™”, “FT-SE™” and “Footsie™” are trade marks of London Stock Exchange PLC and The Financial Times Limited and are used by FTSE International Limited under license.
The FTSE Private Investor Indices are owned and calculated by FTSE International and are produced in association with APCIMS (Association of Private Client Investment Managers and Stockbrokers). ã FTSE International Limited 2013
The UK Value and Growth Indices are owned and calculated by FTSE International Limited in association with Russell Investment Group. ã FTSE International Limited 2013.
RUSSELL INVESTMENT GROUP: Russell Investment Group is the source and owner of certain of the data contained or reflected in this material and all trademarks and copyrights related thereto. The material may contain confidential information and unauthorized use, disclosure, copying, dissemination or redistribution is strictly prohibited. This is a user presentation of the data. Russell Investment Group is not responsible for the formatting or configuration of this material or for any inaccuracy in presentation thereof. Returns and security data for the Russell indices are provided by Mellon Analytical Solutions. Russell indices are trademarks/service marks of the Russell Investment Group. Russell® is a trademark of the Russell Investment Group.
HFRI: Source: Hedge Fund Research, Inc., © HFR, Inc. 2013, www.hedgefundresearch.com
JPMORGAN: The JPMorgan EMBI Index (i) is protected by copyright and JPMorgan claims trade secret rights, (ii) is and shall remain the sole property of JPMorgan, and (iii) title and full ownership in the JPMorgan EMBI Index is reserved to and shall remain with JPMorgan. All proprietary and intellectual property rights of any nature, including patents, copyrights, trademarks and trade secrets regarding the JPMorgan EMBI Index, and any and all parts, copies, modifications, enhancements and derivative works are owned by, and shall remain the property of JPMorgan and its affiliates. The JPMorgan EMBI Index and related materials and software were developed, compiled, prepared and arranged by JPMorgan through expenditure of substantial time, effort and money and constitute valuable intellectual property and trade secrets of JPMorgan. The JPMorgan EMBI Index shall not be used in a manner that would infringe the property rights of JPMorgan or others or violate the laws, tariffs, or regulations of any country.
LIPPER: Performance data was supplied by Lipper, A Thomson Reuters Company, subject to the following: Copyright 2013 © Thomson Reuters. All rights reserved. Any copying, republication or redistribution of Lipper Information, including by caching, framing or similar means, is expressly prohibited without the prior written consent of Lipper. Lipper shall not be liable for any errors or delays in the Information, or for any actions taken in reliance thereon. Lipper performance data is total return, and is preliminary and subject to revision. The data contained herein has been obtained from company reports, financial reporting services, periodicals, and other resources believed to be reasonable. Although carefully verified, data on compilations is not guaranteed by Lipper Inc. - A Reuters Company and may be incomplete. No offer or solicitations to buy or sell any of the securities herein is being made by Lipper. Portions of the information contained in this report was derived by Mercer using Content supplied by Lipper, A Thomson Reuters Company.
MERRILL LYNCH: The Merrill Lynch Indices are used with permission. Copyright 2013, Merrill Lynch, Pierce, Fenner & Smith Incorporated. All rights reserved. The Merrill Lynch Indices may not be copied, used, or distributed without Merrill Lynch’s prior written approval.
This Product is not sponsored, endorsed, sold or promoted by Merrill Lynch. Merrill Lynch makes no guarantees, representations or warranties of any kind, express or implied, to any person, including, without limitation, any member of the public regarding the use of the Indices in the Product, the advisability of investing in securities generally or of the ability of the Index to track any market performance. Merrill Lynch’s only relationship to Mellon Analytical Solutions or any other person or entity in respect to this Product is limited to the licensing of the Merrill Lynch Indices, which are determined, composed, and calculated by Merrill Lynch without regard to Mellon Analytical Solutions or this Product. Merrill Lynch retains exclusive ownership of the Indices and the programs and trademarks used in connection with the Indices. Merrill Lynch has no obligation to take the needs of Mellon Analytical Solutions or the purchasers, investors or participants in the Product into consideration in determining, composing or calculating the Indices, nor shall Merrill Lynch have any obligation to continue to calculate or provide the Indices in the future. Merrill Lynch may, in its absolute discretion and without prior notice, revise or terminate the Indices at any time. IN NO EVENT SHALL MERRILL LYNCH OR ANY OF ITS PARTNERS, AFFILIATES, EMPLOYEES, OFFICERS, DIRECTORS OR AGENTS HAVE ANY LIABILITY TO ANY PERSON OR ENTITY FOR ANY INDIRECT, PUNITIVE, SPECIAL, OR CONSEQUENTIAL DAMAGES, INCLUDING LOST PROFITS.
MOODY’S INVESTORS SERVICE: Moody’s © Copyright 2013, Moody’s Investors Service, Inc. (“Moody’s). Moody’s ratings (“Ratings”) are proprietary to Moody’s or its affiliates and are protected by copyright and other intellectual property laws. Ratings are licensed to Distributor by Moody’s. RATINGS MAY NOT BE COPIED OR OTHERWISE REPRODUCED, REPACKAGED, FURTHER TRANSMITTED, TRANSFERRED, DISSEMINATED, REDISTRIBUTED OR RESOLD, OR STORED FOR SUBSEQUENT USE FOR ANY SUCH PURPOSE, IN WHOLE OR IN PART, IN ANY FORM OR MANNER OR BY ANY MEANS WHATSOEVER, BY ANY PERSON WITHOUT MOODY’S PRIOR WRITTEN CONSENT. Moody’s® is a registered trademark of Moody’s Investors Service, Inc.

MERCER Market Environment Report Winter 2013 (As of 12/31/2012) 31
Important Notices
MSCI®: Portions of this report are copyright MSCI 2013. Unpublished. All Rights Reserved. This information may only be used for your internal use, may not be reproduced or redisseminated in any form and may not be used to create any financial instruments or products or any indices. This information is provided on an “as is” basis and the user of this information assumes the entire risk of any use it may make or permit to be made of this information. Neither MSCI, any of its affiliates or any other person involved in or related to compiling, computing or creating this information makes any express or implied warranties or representations with respect to such information or the results to be obtained by the use thereof, and MSCI, its affiliates and each such other person hereby expressly disclaim all warranties (including, without limitation, all warranties of originality, accuracy, completeness, timeliness, non-infringement, merchantability and fitness for a particular purpose) with respect to this information. Without limiting any of the foregoing, in no event shall MSCI, any of its affiliates or any other person involved in or related to compiling, computing or creating this information have any liability for any direct, indirect, special, incidental, punitive, consequential or any other damages (including, without limitation, lost profits) even if notified of, or if it might otherwise have anticipated, the possibility of such damages. MSCI is a registered trademark of MSCI, Inc.
NAREIT: NAREIT® is the exclusive registered mark of the National Association of Real Estate Investment Trusts.
NCREIF: All NCREIF Data - Copyright by the National Council of Real Estate Investment Fiduciaries. This information is proprietary and may not be reported in whole or in part without written permission.
STANDARD & POOR’S: Standard & Poor’s information contained in this document is subject to change without notice. Standard & Poor’s cannot guarantee the accuracy, adequacy or completeness of the information and is not responsible for any errors or omissions or for results obtained from use of such information. Standard & Poor’s makes no warranties or merchantability or fitness for a particular purpose. In no event shall Standard & Poor’s be liable for direct, indirect or incidental, special or consequential damages from the information here regardless or whether such damages were foreseen or unforeseen.
WILSHIRE ASSOCIATES: Copyright © 2013 Wilshire Associates Incorporated.
Investment advisory services provided by Mercer Investment Consulting, Inc.