Embed Size (px)
Citation preview

1
Market efficiency, cross hedging and price forecasts: California’s natural-gas markets
C.K. Wooa,b,*, A. Olsona, I. Horowitzc,d,e
a Energy and Environmental Economics, Inc., 353 Sacramento Street, Suite 1700, San Francisco,
CA 94111 USA
b Hong Kong Energy Studies Centre, Hong Kong Baptist University, Hong Kong
c Decision and Information Sciences, Warrington College of Business Administration, University
of Florida, Gainesville, FL 32611-7169
d Information and Decision Systems, College of Business Administration, San Diego State
University, San Diego, CA 92182-8234
e School of Accounting and Finance, Hong Kong Polytechnic University, Hong Kong
Received 7 September 2004
Abstract
An extensive North American pipeline grid that physically integrates individual natural-
gas markets, in conjunction with economic ties binding the California markets to those at Henry
Hub, Louisiana and the New York Mercantile Exchange via an array of financial instruments,
suggests that the spot prices at Henry Hub will impact those in California. We verify the
suggestion via a partial-adjustment regression model, thus affirming that California traders can
exploit the cross-hedging opportunities made available to them via market integration with
Henry Hub, and that they can accurately forecast the price they will have to pay to meet future
demand based solely on the price of futures at Henry Hub and the price of a California natural-
gas basis swaps contract.
* Corresponding author. Tel: +1-415-391-5100; Fax: +1-415-391-6500.
Email address: [email protected] (C.K. Woo)

2
1. Introduction
Natural-gas market reform and deregulation has been an on-going process for almost two
decades, resulting in the emergence of wholesale spot markets that span North America [1].
Previous empirical evidence supports the hypothesis of market integration and price convergence
across these markets [2-8]. That evidence notwithstanding, California’s natural-gas price
skyrocketed from nearly $5 per million British thermal units (MMBtu) to over $50/MMBtu from
November to December 2000 [9], a ten-fold increase that far exceeded the contemporaneous rise
in spot prices at Henry Hub in Louisiana, the nation’s largest natural-gas spot market.
Notwithstanding the pipeline explosion in New Mexico in August 2000 [13], the
California natural-gas price spike has been attributed to dysfunction in the state’s natural-gas
markets that “fed off misconduct, including gas transaction misreporting and wash trading.” [10,
p. 3]. Since the end of the California energy crisis in June 2001, however, California’s natural-
gas spot markets have once again been relatively calm. This suggests that the California market
dysfunction is an isolated event, at odds with the economic ties that directly bind the California
markets to those at Henry Hub, including the futures market operated by the New York
Mercantile Exchange (NYMEX), comprise a variety of financial instruments, including swaps,
basis contracts, and futures contracts.
As shown in Fig. 1, the physical ties evolving from the pipeline grid both directly and
indirectly link the California markets to those throughout North America, including Canada.
These economic and physical ties lead us to posit that the California electricity and natural-gas
crisis period was an intermediate-term two-pronged aberration from the long-term tendency of
those gas markets to behave efficiently, insofar as their spot-price movements are linked to those
at Henry Hub. And if the California natural-gas markets are efficient, this opens up the

3
possibility of traders taking advantage of the aforementioned financial instruments in order to
inure themselves from the risks that go along with reliance on potentially volatile natural-gas
spot markets.
We address these issues simultaneously through a single-equation partial-adjustment
regression model that pays due obeisance to a California trader’s ability to cross hedge via the
Henry Hub futures market. Admittedly simple, the model parsimoniously characterizes the
California natural-gas price behavior. A case in point is the energy-crisis issue. Based on the
Federal Energy Regulatory Commission's (FERC) 2003 report [10] on price manipulation in the
Western markets and the chronology of events detailed by various researchers [8, 11-15], the
model incorporates dummy variables to account for each of the prongs, notably, the electricity-
crisis period from May 2000 to June 2001, and the natural-gas crisis period from November 2000
to May 2001 and estimates the dollar impact of these crises on the daily spot prices in two
California gas markets: PG&E Citygate and SoCal Gas (Topock).1
With regard to the market-efficiency and cross-hedging issues, the estimated regression
coefficients enable us to infer that, except for the aberrant period identified by the FERC [10]
and other researchers [8, 11-15], California’s natural-gas spot markets have indeed been
efficient, with prices in those markets moving in synch with those at Henry Hub. The inference,
in turn, has important implications for traders in two related regards. First, California traders can
accurately forecast the price they will have to pay to meet future demand based solely on the
futures price at Henry Hub, or in tandem with the price of a California natural-gas basis swaps
1 One can econometrically identify the crisis periods by solving for the crisis' beginning and ending dates that minimize (maximize) the regression model's sum of squared errors (likelihood function). We did not do so because of (a) the evidence already documented in the extant literature on the California energy crisis; and (b) the unlikely gain in insights from such an econometric exercise. As will be seen in Section 5, our choice of crisis periods yields estimates of the anomalous increases in California natural-gas prices that are close to those found by FERC [10].

4
contract when such is traded. Second, traders in California’s spot markets can cross hedge via the
NYMEX futures market for Henry Hub delivery in order to reduce their exposure to the risk
entailed in the price volatility common to commodity markets in general.
2. Modeling considerations
Natural-gas traders are concerned with both the current spot price, P, at which they may
have to acquire gas and the price they will pay to meet demand at some future time t, Pt. They
may, however, have the option of locking in the latter price through the purchase of one or more
fixed-price forward contracts. NYMEX, for example, has been offering monthly natural-gas
futures contracts since April 1990, with the future currently extending as far as a 72-month time
horizon. Moreover, in addition to being able to purchase natural-gas futures for delivery in an
external market such as Henry Hub at a fixed price of PF per MMBtu, NYMEX also offers to
traders buying gas in local markets such as PG&E Citygate or SoCal Gas natural-gas swaps
contracts at a price of PSF. In this case, the trader has a perfect forecast of the time-t price:
PFt = PSF + PF. (1)
To determine whether the trader will actually be willing to pay that price at time t,
consider a spot-price regression that relates the spot price for a local delivery location without
forward/futures trading, such as PG&E Citygate, and the spot price PEt in an external market
with forward/futures trading, such as Henry Hub:
Pt = α + βPEt + εt. (2)
Here, α and β are coefficients to be estimated, and εt is a random-error term with the usual
normality properties, including zero mean and finite and constant variance σ2 > 0.

5
Buyers can cross-hedge their costs per MMBtu by going to the external market, buying β
MMBtu of forward gas at the fixed price of PF, taking delivery at future time t, and then selling β
MMBtu in that external market at the market’s spot price of PEt. The buyer thus earns a profit of
β(PEt – PF). The buyer that pays Pt in the local spot market therefore has a net cost per MMBtu
of Pt - β(PEt – PF) = α + βPEt + ε – β(PEt – PF) = α + βPF + ε. The net-cost variance is the σ2 > 0
that cannot be reduced by cross hedging.
If PFt < α + βPF, the buyer’s expected profit per MMBtu is (α - PSF) + (β - 1)PF. The
buyer earns that profit by purchasing basis swap contracts at a cost of PSF and external-market
futures at a price of PF, and selling natural-gas forward to another trader at a price of α + βPF.
Conversely, if PFt > α + βPF, a trader can cross-hedge the local-market spot price and sell both
basis swap contracts and Henry Hub futures contracts so as to earn an expected positive profit of
(PSF - α) + (1 - β)PF per MMBtu. Since a positive expected profit cannot persist in a market with
active spot and futures trading, in order for Eq. (2) to hold it must be true that α = PSF and β = 1,
in which case Eq. (1) provides a perfect natural-gas price forecast.
The estimates of α and β, denoted by a and b, are obtained through a partial-adjustment
model that is a variation on a theme explicated in detail in [16, 17]. Using the present notation,
that model permits one to infer a and b from the parameter estimates of Eq. (3):2
Pt = θ + γPEt + φPt-1+ μt. (3)
2 Eq.(3) is a linear specification as implied by the law of one price and the economic reality that traders’ cross- hedging strategies are based upon the prices in the separate markets rather than upon the logarithms of those prices. The linear specification thus allows for a straightforward test of the market-efficiency hypothesis of α = 0 and β = 1 under negligible transportation costs. That being said, we acknowledge that others (e.g. [7]) have explored the market-integration issue through a log-linear specification, albeit not with our hedging perspective. In recognition of that alternative, we also estimated the regression models reported in Section 4 in log-linear form. At least in terms of the signs of the parameter estimates and their statistical significance, as well as corresponding tests on the residuals, there was nothing to distinguish the linear and the log-linear specifications.

6
Here, θ = α λ, γ = β λ, φ = (1 - λ), and μt = λεt; where 0 ≤ λ ≤ 1 measures the extent to which
daily prices adjust to an unobservable long-run equilibrium price for that day, with λ = 0
implying a complete lack of adjustment and λ = 1 implying instantaneous adjustment.
When μt has the familiar white-noise properties that we would like to ascribe to a
random-error term, using ordinary least squares (OLS) to estimate Eq. (3) will yield unbiased
and precise coefficient estimates so long as the random errors, μt, are not serially correlated. To
allow for the possibility of serial correlation in which the random-error term follows a kth-order
autoregressive process, AR(k), we set μt = Σjρjμt-j + ωt, where ωt is white noise (with the desired
normality properties) and j = 1,…, k [18, Chapter 10]. We then substitute μt = Σjρjμt-j + ωt into
Eq. (3) and estimate it using the maximum likelihood (ML) procedure, thus avoiding any
potential bias caused by the possible correlation between Pt-1 and μt.
3. Data
Fig. 2 shows daily natural-gas prices at PG&E Citygate and SoCal Gas for the historical
period that spans our sample data: namely, some six years in the former and eight years in the
latter case. These data span the energy-crisis periods for the Western electricity and natural-gas
markets. Fig. 2 indicates relatively stable gas prices of under $10/MMBtu, except for the natural-
gas-crisis period of November 2000 to May 2001 when daily prices at times exceeded
$50/MMBtu.
Fig. 3 shows electricity prices at South of Path 15 (SP15) and North of Path 15 (NP15),
the two major delivery points in California’s wholesale electricity market. This figure shows that
the daily peak period (06:00-22:00, Monday-Saturday) electricity prices were typically below

7
$100/MWh, except during the electricity-crisis period of May 2000 to June 2001 when the prices
at times exceeded $500/MWh.
To capture in our model the effects of these two known crises, we introduce into Eq. (3) a
pair of binary independent variables: (a) Cel = 1 during the electricity-crisis period of May 2000
to June 2001, and zero otherwise; and (b) Cng = 1 during the natural-gas crisis period of
November 2000 to May 2001, and zero otherwise. The crisis indicators isolate the price effect of
these two unusual events characterized by extreme weather, capacity shortage, market-power
abuse, and falsely reported natural-gas prices [10-15, 19]. Thus, we apply ML estimation to the
following regression equation:
Pt = θ + κ1Cel + κ2Cng + γPEt + φPt-1+ Σjρjμt-j + ωt. (4)
The estimate of κj is denoted kj and that of ρj is denoted rj. The estimates of θ, γ, φ, and λ are
denoted f, g, h, and l, respectively.
Two sets of data provided by Platts comprise our two samples of observations for the
dependent variable. The first sample contains 1,930 daily PG&E Citygate volume-weighted
average prices for the period of May 1998 to mid-August 2003. The second sample contains
2,598 daily SoCal Gas (Topock) volume-weighted average prices for the period of July 1996 to
mid-August 2003. Corresponding observations are available for the daily Henry Hub volume-
weighted average spot prices. Although “the quality of reporting to price index developers
(including Platts) improved substantially” after 2002 [19, p. 2], some of the earlier data, most
notably during the energy crisis, reflect trade manipulation and gaming the market by large
traders such as Enron. Insofar as any “epidemic” of false reporting impacts our estimates, one
would expect that impact to detract from our ability to draw statistically-significant conclusions
that support our model. As will be seen, however, this does not appear to be the case.

8
Table 1 reports summary statistics for the prices at PG&E Citygate, SoCal Gas and Henry
Hub, for the full sample as well as for sub-samples of the pre-crisis, crisis, and post-crisis
periods. The summary statistics reveal that during the full sample period the California spot-
market prices tended to be both higher and more volatile than were the Henry Hub prices, while
being moderately correlated (0.70 ≤ r ≤ 0.73) with those at Henry Hub.
Prior to going forward with the ML estimation of Eq. (4), it is first necessary to assure
that the time series for the two economic variables in the equation, Pt and PEt, are stationary.
Were they otherwise, this would violate an underlying assumption of regression analysis and
lead to what Granger and Newbold [20] dubbed a spurious regression whose high coefficient of
determination and t statistics belie any true economic meaning. The acknowledged test for
stationarity is the Augmented Dickey-Fuller test [21], the results of which are also reported in
Table 1. The critical value of the Augmented Dickey-Fuller (ADF) statistic for our sample sizes
of n1 = 1,930 and n2 = 2,598 is –2.86 (p = 0.05) [18, p.708, Table 20.1]. An ADF test statistic
below –2.86 allows us to reject the hypothesis that the time series is not stationary and has a unit
root.

9
The ADF statistics in Table 1 are computed with one lagged difference, a non-zero mean
(drift), and no trend. We have also run this model using the Phillips-Perron test [22] and the
statistical inferences are precisely the same.3 We have also run alternative versions of both tests,
with trend, and with lagged differences of up to ten days, and verified that our results and the
inferences are robust, insensitive to the specification of either the Dickey-Fuller fundamental
“testing” equation or the test employed. We therefore conclude that none of the three price
series is non-stationary, either before the electricity crisis or over the entire sample period – from
mid-1998 for PG&E City gate and from mid-1996 for SoCal Gas, through mid-August 2003.
This empirical evidence of stationary price series’ is an exception to the common finding in
extant literature [e.g., 3-7] that energy prices typically follow a random walk. We do not have a
ready explanation for this exception, other than the fact that our data series cover a more recent
sample period that extends from the mid 1990s to August 2003.
We cannot, however, reject the unit-root hypothesis for either the PG&E Citygate or
SoCal Gas time series after the electricity crisis, or for the Henry Hub sequence of prices during
the crisis. Though only present in the sub-periods, non-stationary price series raise the possibility
that our regression results may be spurious [18, 20-24]: the estimated version of Eq. (4) indicates
an apparently significant relationship between California and Henry Hub natural-gas prices when
in fact no such relationship exists. Hence, our estimation of Eq. (4) will include a cointegration
test of the null hypothesis that the regression residuals follow a random walk [18, Chapter 20],
3 We ran these additional tests in response to the urgings of a referee whom we thank for helping us to solidify our confidence in the results and their implications. Our focus on the ADF test statistics rather than the Phillips-Perron test statistics is prompted by Green's [23, p. 645] observation that "[t]he Dickey-Fuller procedures have stood the test of time as robust tools that appear to give good results over a wide range of applications. The Phillips-Perron tests are very general, but appear to have less optimal small-sample properties." Assuredly, with our large-sized samples the latter qualification would not apply.

10
causing spurious regression results due to the California and Henry Hub natural-gas prices
drifting apart without limit over time.
Both before and after the crisis, the differences between the average prices and their
standard deviations for the three markets are quite modest, which suggests that the higher overall
means and standard deviations for the California markets relative to those at Henry Hub is an
aberration of the crisis period. The lowest correlations, which range from 0.57 to 0.66, of the
California-market prices with those at Henry Hub also occur during the crisis period, hinting at a
market disconnection during this period, which reduces the correlation coefficients for the entire
sample.
4. The estimated regression coefficients
4.1 PG&E Citygate
Table 2A reports the estimated coefficients for four autoregressive-error forms of the
PG&E Citygate price regression: AR(1), AR(2), AR (3), and AR(4). The numbers in parentheses
are the respective t-ratios. With almost identical root-mean-squared-errors, all four regressions
explain at least 96% of the PG&E Citygate price variance, suggesting that the NYMEX natural-
gas futures is an effective hedge instrument. The likelihood (LLH) ratio test results and the
Akaike information criterion (AIC) values indicate that the errors may follow an AR process of
the fourth or higher order. With the exceptions of the intercept, the electricity-crisis indicator,
and one AR(4) parameter (r3 = 0.009), all of the coefficient estimates are statistically significant
(p < 0.05).
The estimates for any single regression parameter vary across the four AR specifications.
Irrespective of the AR specification, however, the values for h are highly significant. Since the

11
corresponding values for l are determined from l = 1 – h, when h is significantly different from
zero, l is significantly different from one and decisively rejects the instantaneous-adjustment
hypothesis.
To illustrate the sensitivity of the estimates to AR specification, consider the estimated
coefficients for l: namely, l = 1 – 0.779 = 0.221 under the AR(1) specification, l = 0.297 under
the AR(2) specification, l =0.322 under the AR(3) specification, and l = 0.144 under the AR(4)
specification. Based on (1 / l) which is an estimate of (1 / λ), the corresponding numbers of days
required for the local market to regain a perturbed equilibrium are 4.5, 3.4, 3.1, and 6.9,
respectively. The speed with which the market returns to the local equilibrium price suggests it is
feasible to apply the equilibrium-price condition for the purpose of forecasting prices for an
extended period of time, say over a year.
The combined effect of the electricity crisis and the natural-gas crisis on the daily spot
price is the sum of the estimated regression coefficients, k1 and k2. This effect ranges from a high
of k1 + k2 = 0.248 + 1.441 = $1.689 per MMBtu for the AR(3) specification to a low of 0.079 +
0.696 = $0.775 per MMBtu for the AR(4) specification. At the market equilibrium, the effect is
magnified by a factor of 1/l. Taking the four values of l into account gives estimates of
1.15/0.221 = $5.20 per MMBtu for the AR(1) specification, 1.55/0.297 = $5.20 per MMBtu for
the AR(2) specification, 1.690/0.322 = $5.25 for the AR(3) specification, and 0.775/0.144 =
$5.38 per MMBtu for the AR(4) specification. This large effect confirms the earlier hint that
during the energy-crisis period, the PG&E Citygate market disconnected from the Henry Hub
market. In all four cases, however, k2 dwarfs k1, so that only a minor portion of the rise in
natural-gas prices during the energy crisis can be attributed solely to the electricity crisis.

12
Further support for our assertion that except for the crisis periods, the PG&E Citygate
and Henry Hub prices are cointegrated is provided by the ADF statistics on the residuals from
the four regressions. These statistics enable us to reject the null hypothesis that the residuals
follow a random walk and have a unit root [18, Chapter 20].
Table 2A suggests that the estimates are sensitive to the AR error specification. If this
sensitivity extends to a and b in the market-equilibrium condition, it forces us to question the
validity of using cross hedging to develop a natural-gas price forecast. Hence, we test the
hypothesis that neither α nor β varies by AR error specification. If the data do not reject this
hypothesis, we can safely conclude that the equilibrium-price condition is robust and suitable for
developing a market-based natural-gas price forecast.
Table 2B presents the results of testing two null hypotheses: α = 0 and β = 1. The former
tests the hypothesis that the basis differential is equal to zero. The latter tests the hypothesis that
the PG&E Citygate and Henry Hub natural-gas markets are efficient without persistent arbitrage
profit; and with β equal to unity being the optimal hedge ratio, which would be the case when the
traders’ objective is to use hedging to minimize the price variance [25]. Neither of the null
hypotheses can be rejected at even the loosest of possible rejection standards (p = 0.75, say),
irrespective of the AR specification. Assuredly, on any given day the basis swaps price might
deviate from zero. Our estimate of a ≈ 0 is the average basis swaps price for the sample period,
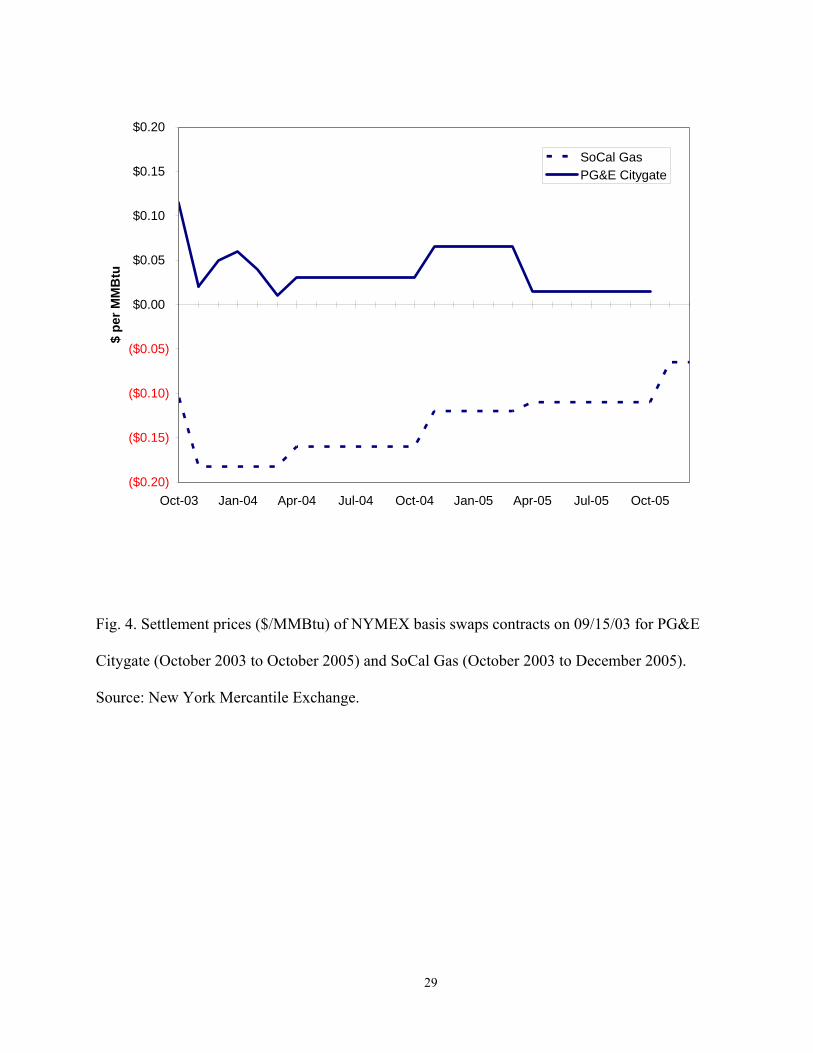
which fails to reject the hypothesis that α = 0. Fig. 4, for example, displays the NYMEX basis
swaps prices for PG&E Citygate on September 15, 2003 for the 25-month period of October
2003 to October 2005. These prices fall well within the 95% confidence interval for the basis
differential estimate in Table 2B, thus lending statistical and visual support to our conclusion
that, except for the crisis periods, the PG&E Citygate market is efficient.

13
4.2. SoCal Gas
Table 3A reports the analogous results for the SoCal Gas spot-price regression with
AR(1), AR(2), AR(3), or AR(4) error specification. All four regressions have identical root-
mean-squared-errors and each regression accounts for 97% of the spot-price variance. The LLH
ratio test results and AIC values indicate an AR error process that is unlikely to be of the fifth or
higher order. With the exception of the intercept, the electricity-crisis indicator and two AR
parameters, all coefficient estimates are statistically significant (p < 0.05).
The coefficient estimates vary across the first three AR specifications, but not between
the third and the fourth. Once again, however, the estimates for φ are highly significant,
decisively rejecting the hypothesis of instantaneous adjustment. Specifically, the four estimates
of λ are l = 0.450 under the AR(1) specification, l = 0.490 under the AR(2) specification, l =
0.344 under the AR(3) specification, and l = 0.345 under the AR(4) specification. The
corresponding numbers of days required for the local market to regain equilibrium is 2.2, 2.0,
2.4, and 2.9, respectively. This range of required days is smaller than the one for PG&E Citygate
because as Fig. 1 shows, the major supply basins (San Juan Basin, Permian Basin, and Anadarko
Basin) serving Southern California are better inter-connected with Henry Hub than those
(Western Canadian Sedimentary Basin and Rocky Mountain Basin) serving Northern California.
This narrow range of small values further reinforces the notion that it is feasible to apply the
equilibrium-price condition for the purpose of forecasting natural-gas prices for an extended
period of time.
Table 3A indicates that the spot-price effect of the electricity and natural-gas crises
ranges from a high of 0.800 + 2.912 = $3.712 per MMBtu for the AR(2) specification to a low of

14
0.425 + 2.317 = $2.742 per MMBtu for the AR(4) specification. At the market equilibrium, the
effects are 3.475/0.450 = $7.72 per MMBtu for the AR(1) specification, 3.712/0.490 = $7.58 per
MMBtu for the AR(2) specification, 2.741/0.344 = $7.97 for the AR(3) specification, and
2.742/0.345 = $7.95 per MMBtu for the AR(4) specification. As was true for PG&E Citygate,
this large effect again confirms the earlier hint that during the energy crisis, the SoCal Gas
market disconnected from the Henry Hub market, although the disparities between the k2 and k1
values are not as great as in the earlier case. Thus, the electricity crisis played a more important
role in the rise in SoCal Gas prices during the energy crisis than was the case for PG&E Citygate
prices.
Finally, again as was the case with the PG&E sample, the ADF statistics for the unit-root
test reject the hypothesis that the residuals for the SoCal Gas regressions have a unit root, which
suggests that the coefficient estimates are not susceptible to spurious interpretation.
Since Table 3A suggests that the coefficient estimates are sensitive to AR error
specification, Table 3B tests the sensitivity of a and b to any such error. As was true for PG&E
Citygate, Table 3B shows that the equilibrium-price condition is robust, and thus suitable for
developing a market-based natural-gas price forecast. And once again we cannot reject the null
hypothesis α = 0 and β = 1, which implies that except for the crisis periods, the SoCal Gas and
Henry Hub natural-gas markets are efficient without persistent arbitrage profit, and with an
average basis differential of zero and an optimal hedge ratio of unity.
Fig. 4 shows that the NYMEX basis swaps prices for SoCal Gas on 09/15/03 for October
2003 to December 2005 fall well within the 95% confidence interval for the basis differential
estimate in Table 3B, thus affirming our conclusion that the SoCal Gas market is efficient.
15
5. Conclusions
The integration of natural-gas markets since open access and deregulation in the mid-
1980s suggests that those of California should be efficient and bereft of the potential for
persistent arbitrage profit. With the caveat that the energy-crisis period was an important
exception, our analysis supports the suggestion. Specifically, the average difference between the
California and Henry Hub prices is close to zero. Ceteris paribus, a $1 per MMBtu change in the
Henry Hub price translates into a $1 per MMBtu change in the California price, over all AR error
specifications.4
A key implication of our model is that traders can accurately forecast the natural-gas
prices they will have to pay to meet demand. When there is trading for natural-gas futures and
basis swaps contracts, this price forecast is the price of a Henry Hub futures contract and the
price of a basis swaps contract. When the only trading is in natural-gas futures, the price forecast
is simply the price of a Henry Hub futures contract, because the estimated basis differential is not
significantly different from zero. In light of the short time required for the restoration of a
perturbed equilibrium and the current availability of five-year futures contracts, a five-year
forecast time horizon seems eminently viable. And an accurate five-year price forecast provides
an important input to management in three especially salient decision-making contexts.
First, a spot-price forecast is useful to natural-gas suppliers that are involved in pricing a
natural-gas forward contract, a usage demonstrated by [26] for the closely related case of
electricity. Second, the forecast and its dispersion are critical input data for cost-risk
management by such purchasers of natural gas as local distribution companies (LDCs) that resell
the gas to their retail end-users and gas-fired generation owners, an application demonstrated by

16
[16, 27, 28] for an electricity LDC. Third, evaluating the cost-effectiveness of natural-gas
demand management (e.g., boiler efficiency improvement) requires a comparison of the gas-
price forecast and the cost of reducing gas demand.
Finally, during the energy crisis the PG&E Citygate spot price is estimated to have been
more than $5/MMBtu in excess of the non-crisis price expectation, and the SoCal Gas spot price
is estimated to have been almost $8/MMBtu in excess of the non-crisis price expectation. These
estimates corroborate the corresponding $4.18/MMBtu and $7.03/MMBtu figures found by
FERC [10]. Under the conservative assumption of a marginal generation unit’s heat rate of
10,000 BTUs per kilowatt hour, the excess above normally expected natural-gas price levels
could have contributed $50 to $70 per megawatt hour to the electricity price spike during the
California electricity crisis. This is notwithstanding that it has been shown that other factors,
such as capacity shortages and market-power abuses by large electricity suppliers, have
contributed to the electricity price spike [8, 11-15, 29]. An important policy implication of this
finding is that unless the fuel input markets are workably competitive with active spot and
futures trading, an electricity market reform may fail to deliver safe and reliable service at stable
and reasonable prices [30].
4 As a final check, we also estimated the partial-adjustment model with a time-dependent variance specification, GARCH(1, 1) [18, Chapter 16]; and once again we obtained estimates of a ≈ 0 and b ≈ 1.

17
Acknowledgement
This paper is based on our analysis of the California natural-gas markets performed in
2003 as part of an avoided cost estimation project sponsored by the California Public Utilities
Commission (CPUC). We thank the staff of the CPUC, the California Energy Commission, and
the participating LDCs for their input throughout the project, and to three anonymous reviewers
for their very helpful suggestions on an earlier draft. Only the authors, however, bear
responsibility for the final product and any errors adhering thereto.

18
References
[1] Doane MJ, Spulber DF. Open access and the evolution of the U.S. spot market for natural
gas. Journal of Law and Economics 1994; 37(2): 477-517.
[2] National Energy Board. Price convergence in North American natural gas markets.
Calgary: National Energy Board, 1995.
[3] Walls, WD. An econometric analysis of the market for natural gas futures. Energy
Journal 1995; 16(1): 71-83.
[4] DeVany AS, Walls WD. The emerging new order in natural gas – market versus
regulation. Westport: Quorum Books, 1995.
[5] King M, Cuc M. Price convergence in North American natural gas markets. Energy
Journal 1996; 17(2): 47-62.
[6] Serlatis A. Is there an East-West split in North American natural gas markets? Energy
Journal 1997; 18(1): 47-61.
[7] Serlatis A, Herbert J. The message in North American energy prices. Energy Economics
1999; 21(5): 471-483.
[8] Lee WW. US lessons for energy industry restructuring based on natural gas and
California electricity incidences. Energy Policy 2004; 32(2): 237-259.
[9] California Energy Commission. 2003 integrated energy policy report, Docket No.02-IEP-
1. Sacramento: California Energy Commission, 2003.
[10] Federal Energy Regulatory Commission. Final report on price manipulation in Western
markets, Docket No. PA02-02000. Washington D.C.: Federal Energy Regulatory
Commission, 2003.

19
[11] Wolak FA. Diagnosing the California electricity crisis. Electricity Journal 2003; 16(7):
11-37.
[12] Jurewitz JL. California electricity debacle: a guided tour. Electricity Journal 2002; 15(4):
10-29.
[13] Faruqui A, Chao HP, Niemeyer V, Platt J, Stahlkopf K. Analyzing California's power
crisis. Energy Journal 2001; 22(4): 29-52.
[14] Sweeney JL. The California electricity crisis. Palo Alto: Hoover Institution, 2002.
[15] Woo CK. What went wrong in California’s electricity market? Energy 2001; 26(8): 747-
758.
[16] Woo CK, Olson A, Orans R. Benchmarking the price reasonableness of an electricity
tolling agreement. Electricity Journal 2004; 17(5): 65-75.
[17] Woo CK, Horowitz I, Olson A, Horii B, Baskette C. Efficient frontiers for electricity
procurement by an LDC with multiple purchase options. OMEGA 2004; in press.
[18] Davidson R, MacKinnon JG. Estimation and inference in econometrics. New York:
Oxford, 1993.
[19] Federal Energy Regulatory Commission. Report on natural gas and electricity price
indices, Docket Nos. PL03-004 and AD03-7-004. Washington D.C.: Federal Energy
Regulatory Commission, 2004.
[20] Granger C, Newbold P. Spurious regressions in econometrics. Journal of Econometrics
1974; 2(2): 111-120.
[21] Dickey D, Fuller WA. Distribution of the estimates for autoregressive time series with a
unit root. Journal of the American Statistical Association 1979; 74: 427-431.

20
[22] Phillips PCB, Perron P. Testing for a unit root in time series regression. Biometrika
1988; 75(2): 335-46.
[23] Greene W. Econometric analysis (5th Edition). Upper Saddle River, NJ: Prentice Hall,
2004.
[24] Enders, W. Applied econometric time series (2nd Edition). Hoboken, NJ: John Wiley &
Sons, Inc., 2004.
[25] Chen SS, Lee CF, Shrestha K. Futures hedge ratios: a review. Quarterly Review of
Economics and Finance 2003; 43(3): 433-465.
[26] Woo CK, Horowitz I, Hoang K. Cross hedging and value at risk: wholesale electricity
forward contracts. Advances in Investment Analysis and Portfolio Management 2001; 8:
283-301.
[27] Woo CK, Karimov R, Horowitz I. Management electricity procurement risk by a local
distribution company. Energy Policy 2003; 32(2): 635-645.
[28] Woo, CK, Horowitz I, Horii B, Karimov R. The efficient frontier for spot and forward
purchases: an application to electricity. Journal of the Operational Research Society
2004; 55(11): 1130-1136.
[29] Bernstein S, Bushnell J, Wolak F. Measuring market inefficiencies in California’s
restructured wholesale electricity market. American Economic Review 2003; 92(5):
1376-1405.
[30] Woo CK, Olson A, Horowitz I, Luk S. Bi-directional causality in California’s electricity
and natural-gas markets. Energy Policy in press.

21
Table 1: Summary and ADF statistics (“*” = “significant at p = 0.05”) for the three spot-gas
price series supplied by Platts, and pair-wise correlations between a California price and the
Henry Hub price. The sample periods are: (a) PG&E Citygate - 05/01/98-08/12/03 with 1930
daily observations; (b) SoCal Gas price - 07/02/96-08/12/03 with 2,598 daily observations; and
(c) Henry Hub price – same as (b).
PG&E Citygate price ($/MMBtu) SoCal Gas price ($/MMBtu) Henry Hub price ($/MMBtu)
Period
Mean ($/MM
Btu)
Std. ($/MM
Btu)
ADF statistic
Correl-ation
Mean ($/MM
Btu)
Std. ($/MM
Btu)
ADF statistic
Correl-ation
Mean ($/MM
Btu)
Std. ($/MM
Btu)
ADF statistic
Full sample 4.19 3.46 -6.74* 0.73 4.01 4.07 -7.53* 0.70 3.27 1.57 -4.38* Before the
electricity crisis 2.49 0.38 -6.14* 0.70 2.37 0.46 -4.02* 0.92 2.35 0.48 -3.55*
During the electricity crisis
8.05 5.54 -4.25* 0.66 10.02 7.24 -4.28* 0.57 5.22 1.64 -1.58
After the electricity crisis
3.69 1.31 -2.53 0.95 3.68 1.30 -2.84 0.93 3.86 1.55 -4.08*

22
Table 2A. Maximum-likelihood estimates under alternative orders of the autoregressive (AR)
process for the PG&E Citygate daily price regression. The sample period is 05/01/98-08/12/03,
with 1930 daily observations. The t statistics are in parentheses and “*” = “Significant at p =
0.05”.
Coefficient First Order Second Order Third Order Fourth Order f = la 0.026 (0.34) 0.072 (0.64) 0.089 (0.82) 0.027 (0.50) k1 0.125 (1.21) 0.200 (1.44) 0.248 (1.58) 0.078 (1.07) k2 1.024 (5.47)* 1.325 (0.28) 1.441 (5.02)* 0.696 (5.18)* g = lb 0.214 (7.00)* 0.276 (6.38)* 0.296 (6.96)* 0.137 (6.10)* h = 1 - l 0.779 28.93)* 0.703 (14.19)* 0.678 (13.70)* 0.856 (45.60)* r1 0.525 (14.05)* 0.534 (10.29)* 0.567 (10.91)* 0.385 (14.19)* r2 0.138 (5.66)* 0.172 (6.42)* 0.148 (5.91)* r3 -0.061 (-2.64)* 0.009 (0.37) r4 -0.208 (-8.73)* Root-mean-squared error 0.65 0.65 0.64 0.63 Total R2 0.96 0.97 0.97 0.97 Log-likelihood (LLH) at convergence -1906.5 -1889.5 -1886 -1855.5 LLR ratio test of H0: AR(1) against H1: AR(j > 1): χ2 statistic with d.f. = j -1 34* 7* 68* Akaike information criterion (AIC) 3835 3793 3788 3729 ADF statistics for the unit-root test on the regression residuals -28.4* -29.2* -30.3* -30.7*

23
Table 2B. Testing H1: α = 0 and H2: β = 1. The bounds are those of a 95% confidence interval.
Basis differential (a in $/MMBtu) Optimal hedge ratio (b)
Order of AR
process
Estimate Standard error
Lower bound
Upper bound
t-stat. to test H1: α
= 0
Estimate Standard error
Lower bound
Upper bound
t-stat. to test H2: β
= 1
1 0.116 0.343 -0.556 0.788 0.339 0.972 0.098 0.781 1.163 -0.287 2 0.243 0.359 -0.461 0.947 0.676 0.931 0.111 0.713 1.148 -0.626 3 0.277 0.337 -0.383 0.937 0.824 0.815 0.096 0.628 1.003 -1.927 4 0.187 0.336 -0.472 0.847 0.557 0.948 0.105 0.744 1.153 -0.493

24
Table 3A. Maximum-likelihood estimates under alternative orders of the autoregressive (AR)
process for the SoCal Gas daily price regression. The sample period is 07/02/96-08/12/03 with
2,598 daily observations. The t statistics are in parentheses and “*” = “Significant at p = 0.05”.
Coefficient First Order Second Order Third Order Fourth Order f = la -0.102 (-0.79) -0.086 (-.61) -0.109 (-1.00) -0.109 (-1.00) k1 0.674 (3.05)* 0.799 (3.25)* 0.425 (2.27)* 0.425 (2.26)* k2 2.801 (8.85)* 2.912 (8.36)* 2.316 (6.79)* 2.317 (6.66)* g = lb 0.480 (11.20)* 0.515 (13.16)* 0.377 (8.16)* 0.377 (8.07)* h = 1 - l 0.550 (17.10)* 0.510 (13.12)* 0.656 (15.77)* 0.655 (15.31)* r1 0.770 (30.07)* 0.823 (19.58)* 0.680 (15.51)* 0.680 (15.00)* r2 -0.031 (-1.19) -0.069 (-2.92)* -0.069 (-2.91)* r3 0.096 (4.88)* 0.096 (4.02)* r4 -0.000 (-0.00) Root-mean-squared error 0.71 0.71 0.71 0.71 Total R2 0.97 0.97 0.97 0.97 Log-likelihood (LLH) at convergence -2794 -2793 -2784 -2784 LLR ratio test of H0: AR(1) against H1: AR(j > 1): χ2 statistic with d.f. = j -1 2 18* 18* Akaike information criterion (AIC) 5600 5600 5584 5586 ADF statistics for the unit-root test on the regression residuals -38.2* -37.9* -35.5* -35.5*

25
Table 3B. Testing H1: α = 0 and H2: β = 1. The bounds are those of a 95% confidence interval.
Basis differential (a in $/MMBtu) Optimal hedge ratio (b)
Order of AR
process
Estimate Standard error
Lower bound
Upper bound
t-stat. to test H1: α
= 0
Estimate Standard error
Lower bound
Upper bound
t-stat. to test H2: β
= 1
1 -0.227 0.289 -0.794 0.341 -0.783 1.067 0.085 0.900 1.234 0.786 2 -0.176 0.295 -0.754 0.403 -0.595 1.052 0.087 0.881 1.222 0.594 3 -0.316 0.324 -0.951 0.32 -0.973 1.095 0.126 0.848 1.342 0.756 4 -0.315 0.326 -0.954 0.324 -0.966 1.095 0.097 0.906 1.285 0.985

26
Fig.1. Natural-gas pipelines and supply basins in Western North America. Major supply basins
serving California include the Western Canadian Sedimentary Basin, serving Northern
California, the San Juan, Permian and Anadarko Basins, serving Southern California, and the
Rocky Mountain Basin, serving both. Source: California Energy Commission.

27
$0
$10
$20
$30
$40
$50
$60
Jul-98 Jan-99 Jul-99 Jan-00 Jul-00 Jan-01 Jul-01 Jan-02 Jul-02 Jan-03 Jul-03
$/M
MB
tu
Henry Hub
SoCal Gas
PG&E Citygate
Fig. 2. Daily spot natural-gas prices for Henry Hub, SoCal Gas, and PG&E Citygate, July 1998
to July 2003. Source: Platts.

28
$0
$100
$200
$300
$400
$500
$600
$700
$800
Jan-99 Jul-99 Jan-00 Jul-00 Jan-01 Jul-01 Jan-02 Jul-02 Jan-03 Jul-03
$/M
Wh
SP15NP15
Fig. 3. Daily peak period (06:00 – 22:00, Monday-Saturday) bilateral electricity prices for SP15
(Southern California) and NP15 (Northern California). Source: Platts.
29
($0.20)
($0.15)
($0.10)
($0.05)
$0.00
$0.05
$0.10
$0.15
$0.20
Oct-03 Jan-04 Apr-04 Jul-04 Oct-04 Jan-05 Apr-05 Jul-05 Oct-05
$ pe
r MM
Btu
SoCal GasPG&E Citygate
Fig. 4. Settlement prices ($/MMBtu) of NYMEX basis swaps contracts on 09/15/03 for PG&E
Citygate (October 2003 to October 2005) and SoCal Gas (October 2003 to December 2005).
Source: New York Mercantile Exchange.