Embed Size (px)
DESCRIPTION
Market Efficiency and Behavioral Finance. Market Price Behavior. Learning Goals Describe the characteristics of an efficient market, explain what market anomalies are, and note some of the challenges that investors face when markets are efficient. - PowerPoint PPT Presentation
Citation preview

Market Efficiency and Behavioral
Finance

Copyright ©2014 Pearson Education, Inc. All rights reserved. 9-2
Market Price Behavior
• Learning Goals
1. Describe the characteristics of an efficient market, explain what market anomalies are, and note some of the challenges that investors face when markets are efficient.
2. Summarize the evidence which indicates that the stock market is efficient.
3. List four “decision traps” that may lead investors to make systematic errors in their investment decisions.

Copyright ©2014 Pearson Education, Inc. All rights reserved. 9-3
Market Price Behavior
• Learning Goals (cont’d)
4. Explain how behavioral finance links market anomalies to investors’ cognitive biases.
5. Describe some of the approaches to technical analysis.
6. Compute and use technical trading rules for individual stocks and the market as a whole.
Copyright ©2014 Pearson Education, Inc. All rights reserved. 9-4
Random Walks and Efficient Markets
• Random Walk: the theory that stock price movements are unpredictable, so there is no way to know where prices are headed
– Studies of stock price movements indicate that they do not move in neat patterns
– This random pattern is a natural outcome of markets that are highly efficient and respond quickly to changes in material information
– Definition of random walk: The best prediction of the future price is today’s price.

Copyright ©2014 Pearson Education, Inc. All rights reserved. 9-5
Random Walks and Efficient Markets (cont’d)
• Efficient Market: a market in which securities reflect all possible information quickly and accurately
• To have an efficient market, you must have:– Many knowledgeable investors actively analyzing and
trading stocks
– Information is widely available to all investors
– Events, such as labor strikes or accidents, tend to happen randomly
– Investors react quickly and accurately to new information

Copyright ©2014 Pearson Education, Inc. All rights reserved. 9-6
Figure 9.1 Walmart QuarterlyRevenues

Copyright ©2014 Pearson Education, Inc. All rights reserved. 9-7
Figure 9.2 Walmart’s Stock Price

Copyright ©2014 Pearson Education, Inc. All rights reserved. 9-8
Efficient Market Hypothesis
• Efficient Market Hypothesis (EMH): information is reflected in prices—not only the type and source of information, but also the quality and speed with which it is reflected in prices. The more information that is incorporated into prices, the more efficient the market becomes.
• Levels of the EMH– Weak Form EMH– Semi-strong Form EMH– Strong Form EMH

Copyright ©2014 Pearson Education, Inc. All rights reserved. 9-9
Levels of EMH
• Weak Form EMH– Past data on stock prices are of no use in predicting future
stock price changes– Everything is random– Should simply use a “buy-and-hold” strategy
• Semi-strong Form EMH– Abnormally large profits cannot be consistently earned
using public information– Any price anomalies are quickly found out and the stock
market adjusts
• Strong Form EMH– There is no information, public or private, that allows
investors to consistently earn abnormally high returns

Copyright ©2014 Pearson Education, Inc. All rights reserved. 9-10
Figure 9.3 Daily Stock Price Reactions Surrounding Positive Earnings News
Source: Andreas Neuhierl, Anna Scherbina, and Bernd Schlusche. “Market Reaction to Corporate Press Releases,” forthcoming in the Journal of Financial and Quantitative Analysis.

Copyright ©2014 Pearson Education, Inc. All rights reserved. 9-11
Market Anomalies
• Calendar Effects– Stocks returns may be closely tied to the time of
year or time of week– Questionable if really provide opportunity– Examples: January effect, weekend effect
• Small-Firm Effect– Size of a firm impacts stock returns– Small firms may offer higher returns than larger
firms, even after adjusting for risk– (market impact of trading?)

Copyright ©2014 Pearson Education, Inc. All rights reserved. 9-12
Market Anomalies (cont’d)
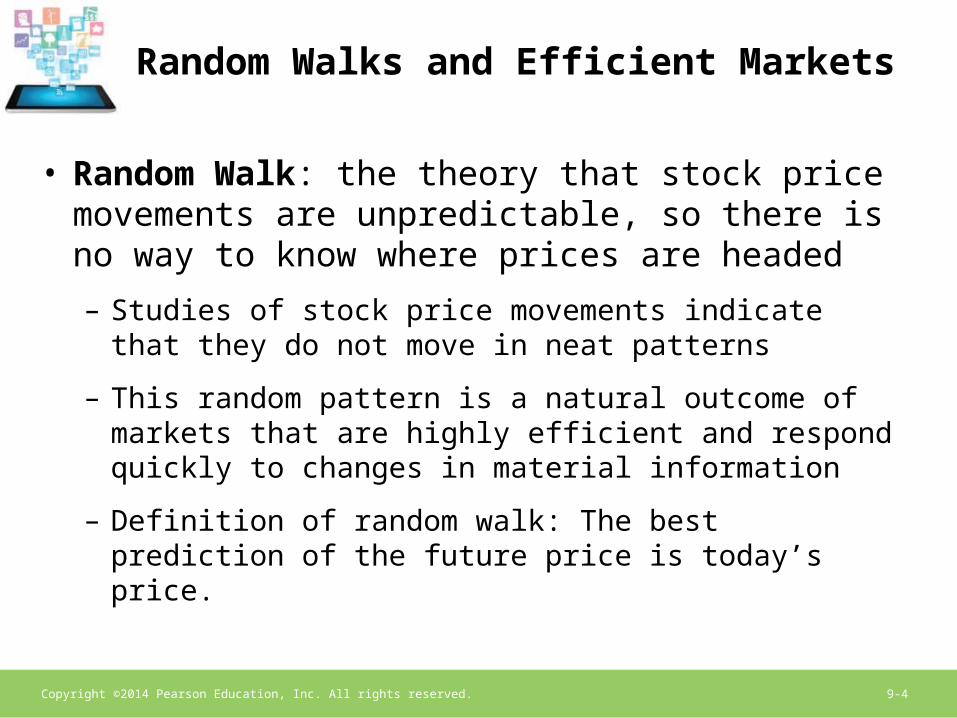
• Post Earnings Announcement Drift (Momentum)– Stock price adjustments may continue after
earnings adjustments have been announced– Unusually good quarterly earnings reports may
signal buying opportunity
• Value Effect– Uses P/E ratio to value stocks– Low P/E stocks may outperform high P/E stocks,
even after adjusting for risk
Copyright ©2014 Pearson Education, Inc. All rights reserved. 9-13
Figure 9.4 Post EarningsAnnouncement Drift

Copyright ©2014 Pearson Education, Inc. All rights reserved. 9-14
Possible Explanations
• Stocks that appear to earn abnormally returns are actually riskier, so higher returns merely represent compensation for risk
• Some anomalies may simply be patterns in that data that appeared by chance and are thus not likely to persist over time
• Behavioral biases may cause investors to make systematic mistakes when they invest, and those mistakes create inefficiencies in the market

Copyright ©2014 Pearson Education, Inc. All rights reserved. 9-15
Investor Behavior and Security Prices
• Overconfidence– Investors tend to be overconfident in their judgment,
leading them to underestimate risks
• Self-Attribution Bias– Investors tend to take credit for successes and blame
others for failures– Investors will follow information that supports their beliefs
and disregard conflicting information
• These biases may cause investors to trade too often

Copyright ©2014 Pearson Education, Inc. All rights reserved. 9-16
Investor Behavior and Security Prices (cont’d)
• Loss Aversion– Investors dislike losses much more than gains– Investors will hang on to losing stocks hoping
they will bounce back
• Representativeness– Investors tend to draw strong conclusions from
small samples– Investors tend to underestimate the effects of
random chance
Copyright ©2014 Pearson Education, Inc. All rights reserved. 9-17
Investor Behavior and Security Prices (cont’d)
• Narrow Framing– Investors tend to analyze a situation in isolation,
while ignoring the larger context
• Belief Perseverance– Investors tend to ignore information that
conflicts with their existing beliefs
• Familiarity Bias– Investors buy stocks that are familiar to them
without regard to whether the stocks are good buys or not
Copyright ©2014 Pearson Education, Inc. All rights reserved. 9-18
Behavioral Finance at Work in the Markets
• Stock Return Predictability– It maybe profitable to buy underperforming
stocks when they are out-of-favor
– Momentum of stock prices up and down tends to continue over 6- to 12-month time horizons
– Value stocks may outperform growth stocks

Copyright ©2014 Pearson Education, Inc. All rights reserved. 9-19
Behavioral Finance at Work in the Markets (cont’d)
• Investor Behavior– Investors who believe they have superior
information tend to trade more, but earn lower returns
– Investors tend to sell stocks that have risen in value rather than declined
– Investors acting on emotions instead of facts may reduce market efficiency
Copyright ©2014 Pearson Education, Inc. All rights reserved. 9-20
Behavioral Finance at Work in the Markets (cont’d)
• Analyst Behavior
– Analysts may be biased by “herding” behavior, where they tend to issue similar recommendations for stocks
– Analysts may be overly optimistic about a favorite stock’s future
Copyright ©2014 Pearson Education, Inc. All rights reserved. 9-21
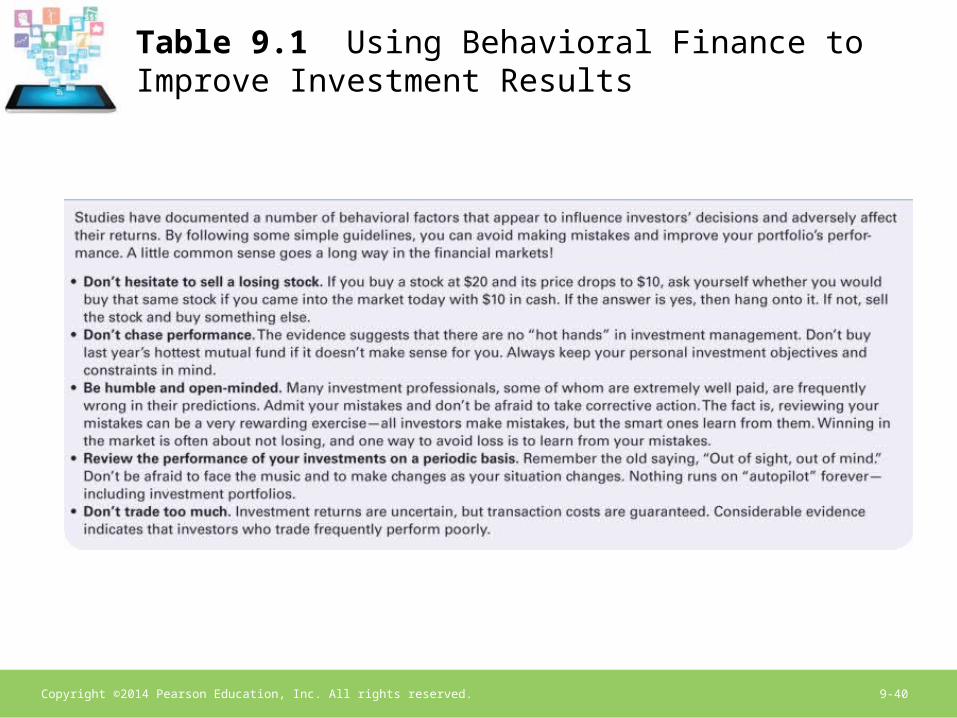
Using Behavioral Finance to Improve Investment Results (Table 9.1)
• Don’t hesitate to sell a losing stock
• Don’t chase performance
• Be humble and open-minded
• Review the performance of your investment on a periodic basis
• Don’t trade too much

Copyright ©2014 Pearson Education, Inc. All rights reserved. 9-22
Technical Analysis
• Before financial data/financial statements were required to be disclosed, investors could only watch the stock market itself to determine buy-or-sell decisions
• Investors began keeping “charts” of stock market movements to look for patterns, or “formations” that indicated whether to buy or sell
• Studies have shown that anywhere from 20% to 50% of the price behavior of a stock can be traced to overall market forces

Copyright ©2014 Pearson Education, Inc. All rights reserved. 9-23
Technical Analysis (cont’d)
• Technical Analysis is the study of the various forces at work in the marketplace and their affect on stock prices.– Focus is on trends in a business’ stock price and the
overall stock market
– Stock prices are a function of supply and demand for shares of stock
– Used to get a general sense of where the stock market is going in the next few months
– Several technical indicators may be used together

Copyright ©2014 Pearson Education, Inc. All rights reserved. 9-24
Market Technical Indicators
• Confidence Index– Looks at ratio between yields on high-grade
corporate bonds compared to intermediate-grade corporate bonds
– Optimism and pessimism about the future outlook is reflected in the bond yield spread
– Trend of “smart money” is revealed in bond market before it shows up in stock market

Copyright ©2014 Pearson Education, Inc. All rights reserved. 9-25
Market Technical Indicators (cont’d)
• Market Volume– Pure supply and demand analysis for
common stocks
– Strong market when volume goes up
– Weak market when volume goes down

Copyright ©2014 Pearson Education, Inc. All rights reserved. 9-26
Market Technical Indicators (cont’d)
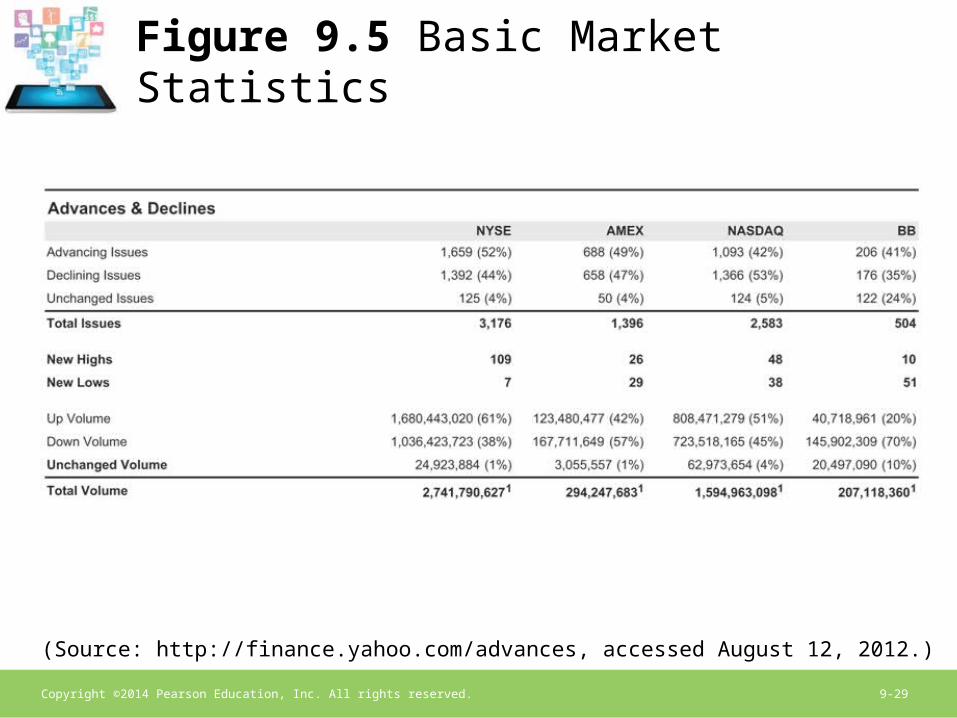
• Breadth of the Market– Looks at number of stock prices that go up
(advances) versus number of stock prices that go down (declines)
– Strong market when advances outnumber declines
– Weak market when declines outnumber advances

Copyright ©2014 Pearson Education, Inc. All rights reserved. 9-27
Market Technical Indicators (cont’d)
• Short Interest– Looks at number of stocks that have been sold
short at any given time
– Can give two different interpretations:• Measure of Future Demand for Stock
– Strong market when short sales are high since guarantees future stock sales to cover the short positions
• Measure of Present Market Optimism or Pessimism – Weak market when short sales are high since professional
short sellers think stocks will decline

Copyright ©2014 Pearson Education, Inc. All rights reserved. 9-28
Market Technical Indicators (cont’d)
• Contrary Opinion and Odd-Lot Trading– Measures the volume of small traders
– Assumes that small traders will do just the opposite of what should be done
• Panic and sell when market is low• Speculate and buy when market is high
– Bull market when odd-lot sales significantly outnumber odd-lot purchases
– Bear market when odd-lot purchases significantly outnumber odd-lot sales
Copyright ©2014 Pearson Education, Inc. All rights reserved. 9-29
Figure 9.5 Basic Market Statistics
(Source: http://finance.yahoo.com/advances, accessed August 12, 2012.)

Copyright ©2014 Pearson Education, Inc. All rights reserved. 9-30
Trading Rules and Measures
• Advance-Decline Line
– Measures the difference between stocks closing higher and stocks closing lower than previous day
– Difference is plotted on graph to view trends
– Used as signal to buy or sell stocks
– Bull market when advances outnumber declines
– Bear market when declines outnumber advances

Copyright ©2014 Pearson Education, Inc. All rights reserved. 9-31
Trading Rules and Measures (cont’d)
• New Highs–New Lows
– Measures the difference between stocks reaching a 52-week high and stocks reaching a 52-week low
– 10-day moving average is plotted on graph to view trends
– Used as signal to buy or sell stocks
– Bull market when highs outnumber lows
– Bear market when lows outnumber highs

Copyright ©2014 Pearson Education, Inc. All rights reserved. 9-32
Trading Rules and Measures (cont’d)
• The Arms Index or Trading Index (TRIN)– Combines advance-decline line with trading volume
– Used as signal to buy or sell stocks
– Bull market when TRIN values are lower
– Bear market when TRIN values are higher

Copyright ©2014 Pearson Education, Inc. All rights reserved. 9-33
Trading Rules and Measures (cont’d)
• Mutual Fund Cash Ratio (MFCR)– Tracks cash position of mutual funds
– High cash positions in mutual funds provides liquidity for future stocks purchases or protection from future mutual fund withdrawals
– Bull market when MFCR values are higher
– Bear market when MFCR values are lower

Copyright ©2014 Pearson Education, Inc. All rights reserved. 9-34
Trading Rules and Measures (cont’d)
• On Balance Volume– Tracks the volume to price change relationship
as a running total– Up-volume occurs when stock closes higher and
is added to running total; down-volume occurs when stock closes lower and is subtracted from running total
– Direction of indicator is more important than actual value
– Used to confirm price trends– Bull market when OBV values are higher– Bear market when OBV values are lower
Copyright ©2014 Pearson Education, Inc. All rights reserved. 9-35
Using Technical Analysis
• Charting– Shows visual summary of stock activity over
time
– Easy to use and to understand
– Use to spot developing trends

Copyright ©2014 Pearson Education, Inc. All rights reserved. 9-36
Using Technical Analysis
• Chart Formations– Looking for patterns, or formations, that
historically meant that stocks were going up or down
– Buy when stocks break through a “line of resistance”
– Sell when stocks break through a “line of support”

Copyright ©2014 Pearson Education, Inc. All rights reserved. 9-37
Figure 9.6 Some Popular Chart Formations

Copyright ©2014 Pearson Education, Inc. All rights reserved. 9-38
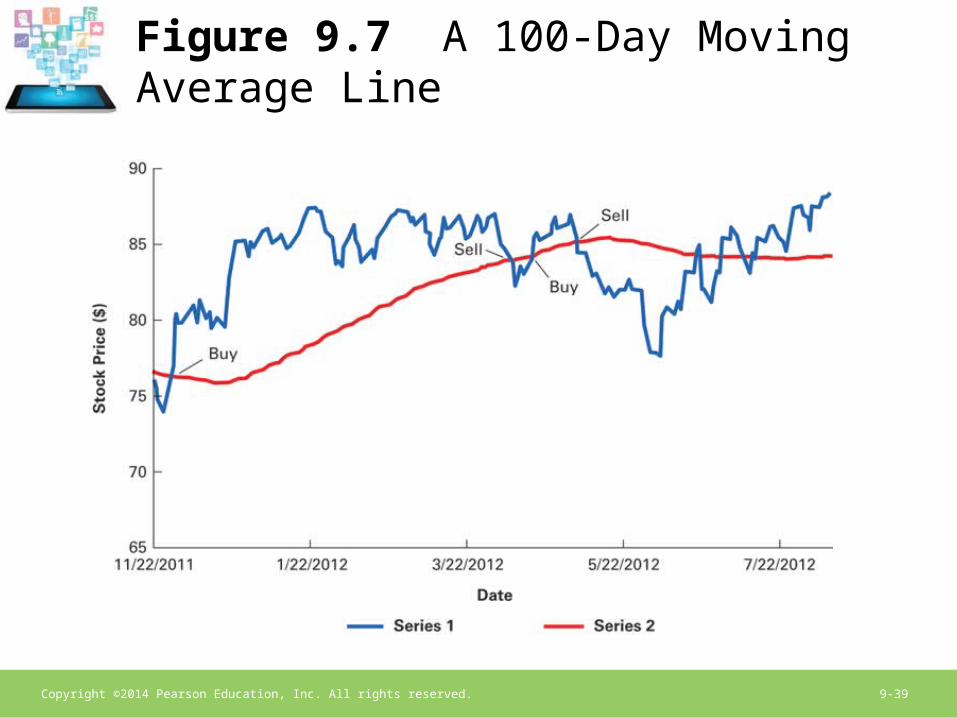
Using Technical Analysis (cont’d)
• Moving Averages– Tracks data (usually stock price) as average
value over time
– Used to “smooth out” daily fluctuations and focus on underlying trends
– Usually calculated over periods ranging from 10 to 200 days
Copyright ©2014 Pearson Education, Inc. All rights reserved. 9-39
Figure 9.7 A 100-Day Moving Average Line
Copyright ©2014 Pearson Education, Inc. All rights reserved. 9-40
Table 9.1 Using Behavioral Finance to Improve Investment Results