Embed Size (px)
Citation preview
Market & Cycle How Long Can We Stay
Profitable?A Canadian Perspective
Presented by:Kevin A. Lee FCAS, FCIAExecutive Vice-President
IAO Actuarial Consulting Services Inc.

IAO Actuarial Consulting Services Inc.
Table of Contents
• P&C Industry ROE
• Market Composition
• Regional / Line of Business Results
• Auto Some More
• What is to Blame for the Cycle?
• Can the Cycle be avoided?
• What to Expect
IAO Actuarial Consulting Services Inc.
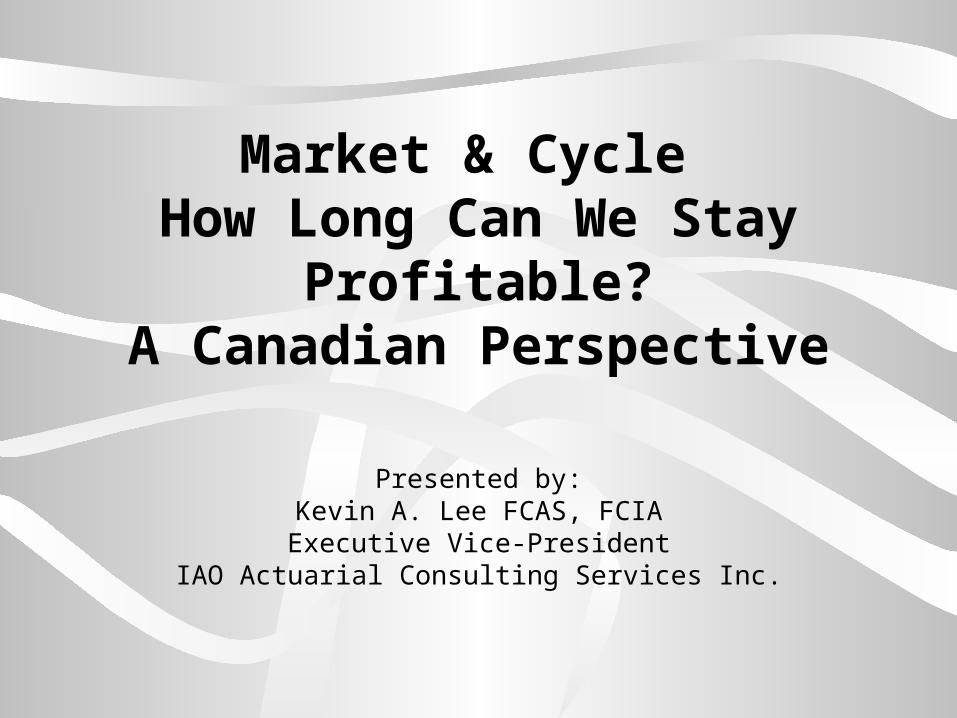
P&C Industry - ROE
Annually After-Tax Return on Equity
-12%
-7%
-2%
3%
8%
13%
18%
1,998 1,999 2,000 2,001 2,002 2,003 2,004 2,005 2,006 2,007
Insurers
Reinsurers
IAO Actuarial Consulting Services Inc.
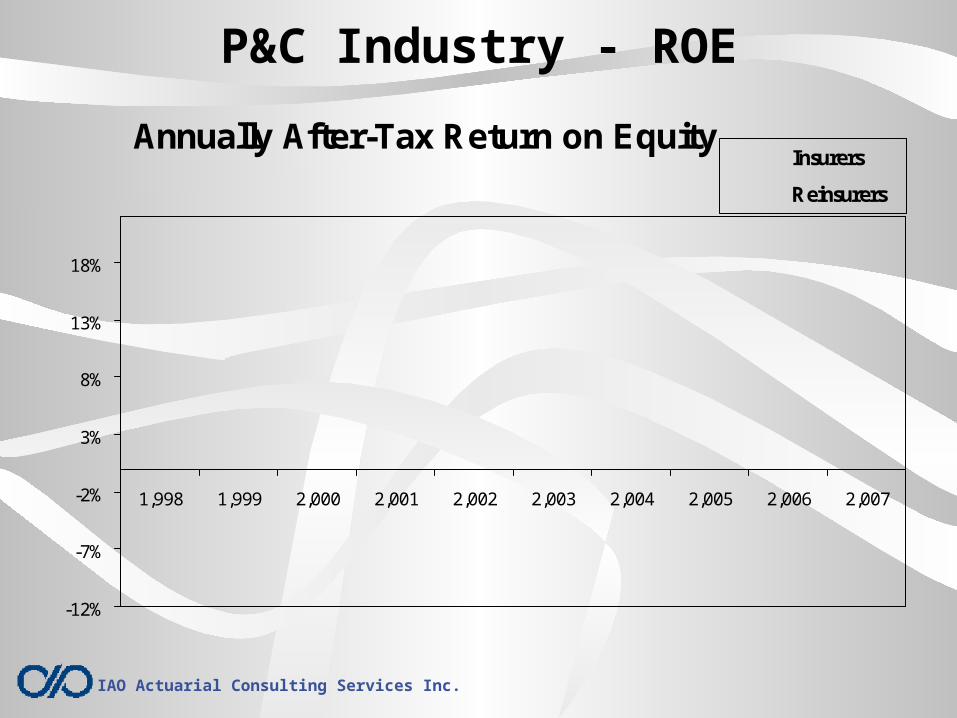
P&C Industry - ROE
Annually After-Tax Return on Equity
-10%
-5%
0%
5%
10%
15%
20%
25%
1,998 1,999 2,000 2,001 2,002 2,003 2,004 2,005 2,006 2,007
Top 5 Large
Medium Small
IAO Actuarial Consulting Services Inc.
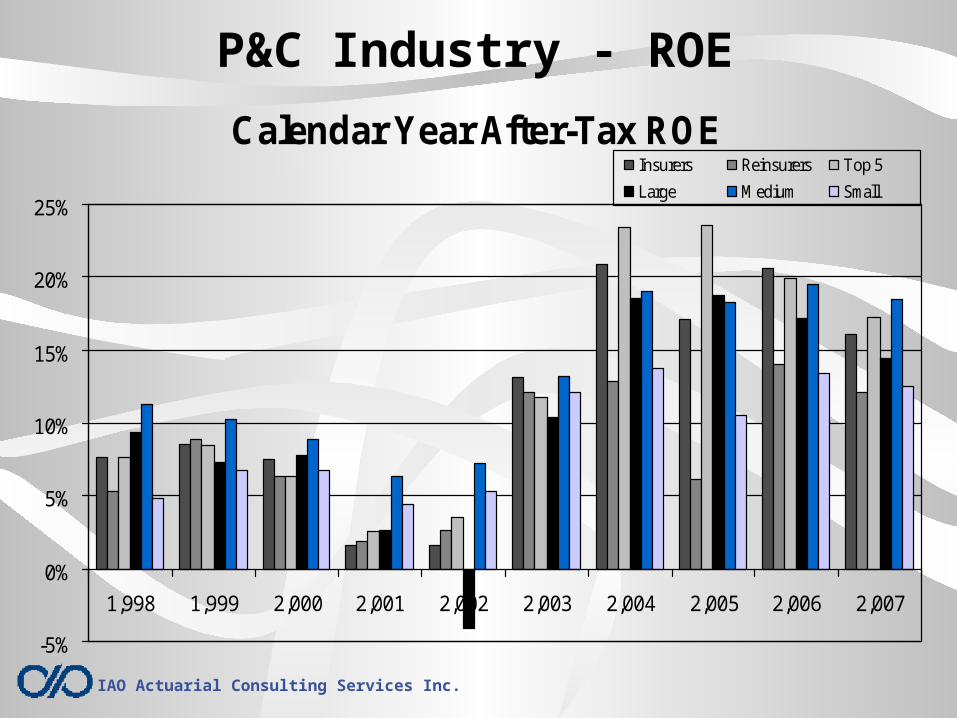
Calendar Year After-Tax ROE
-5%
0%
5%
10%
15%
20%
25%
1,998 1,999 2,000 2,001 2,002 2,003 2,004 2,005 2,006 2,007
Insurers Reinsurers Top 5
Large Medium Small
P&C Industry - ROE
IAO Actuarial Consulting Services Inc.
ROE Comments• Cycle is evident• Most recent is very short and severe – trough
to peak in 3 years• 9/11 what was the impact?• Most drastic in history?• Insurers better than reinsurers in latest peak• Small had less extremes then largest• Raises interesting questions – more later

IAO Actuarial Consulting Services Inc.
Market Composition Insurers (2007)
49%
17%
16%
15%
3%
Auto
Personal Property
Commercial Property
Commercial Liability
All Other
IAO Actuarial Consulting Services Inc.
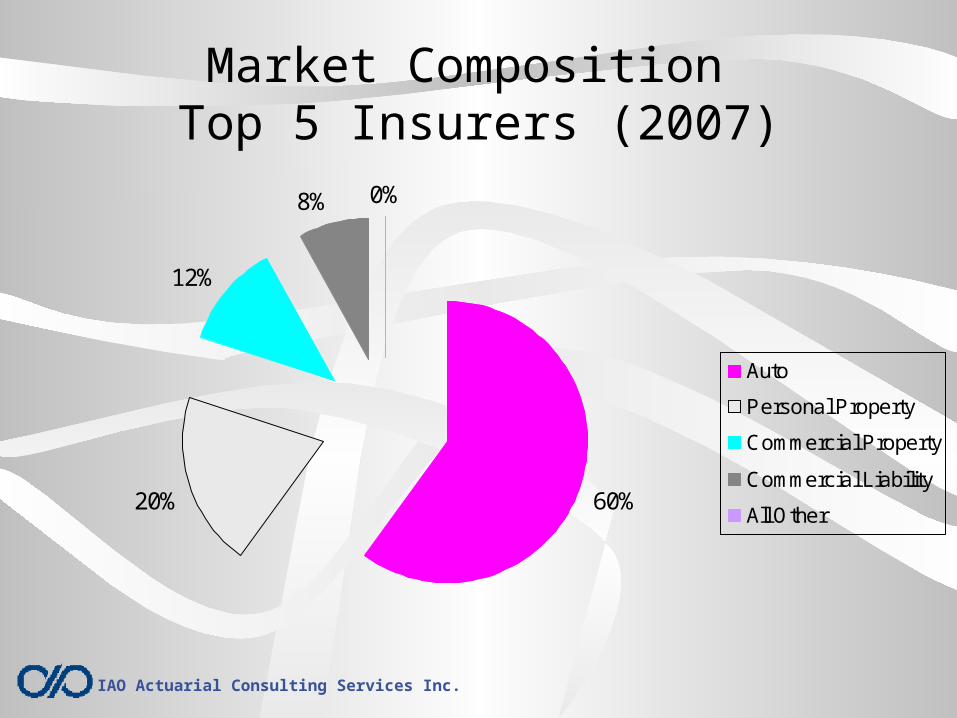
Market Composition Top 5 Insurers (2007)
60%20%
12%
8% 0%
Auto
Personal Property
Commercial Property
Commercial Liability
All Other
IAO Actuarial Consulting Services Inc.
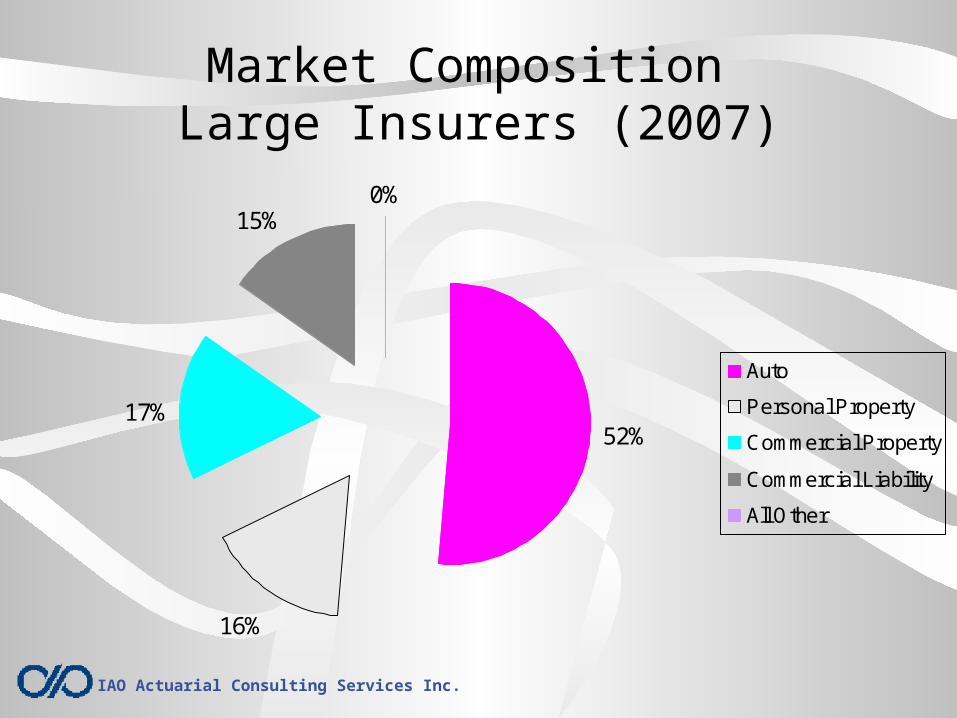
Market Composition Large Insurers (2007)
52%
16%
17%
15%0%
Auto
Personal Property
Commercial Property
Commercial Liability
All Other
IAO Actuarial Consulting Services Inc.
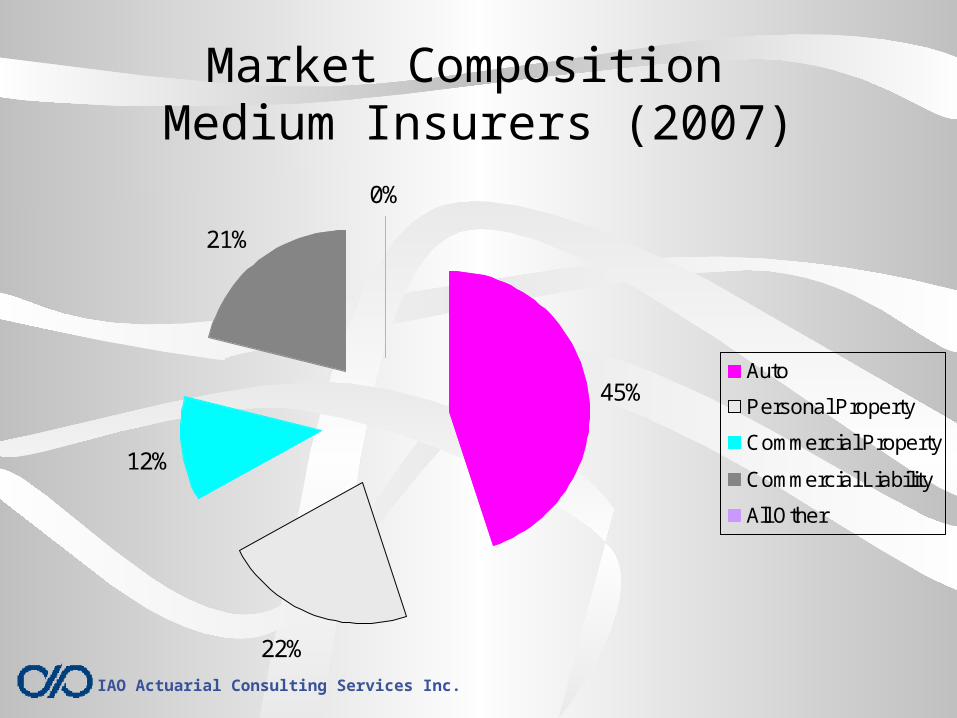
Market Composition Medium Insurers (2007)
45%
22%
12%
21%
0%
Auto
Personal Property
Commercial Property
Commercial Liability
All Other
IAO Actuarial Consulting Services Inc.
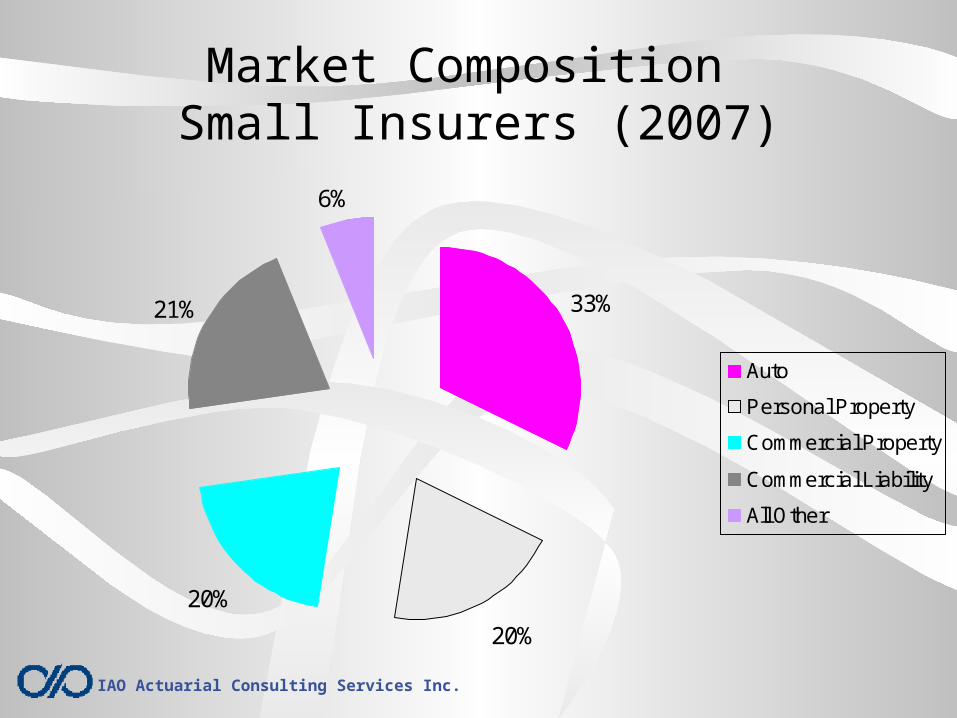
Market Composition Small Insurers (2007)
33%
20%
20%
21%
6%
Auto
Personal Property
Commercial Property
Commercial Liability
All Other
IAO Actuarial Consulting Services Inc.
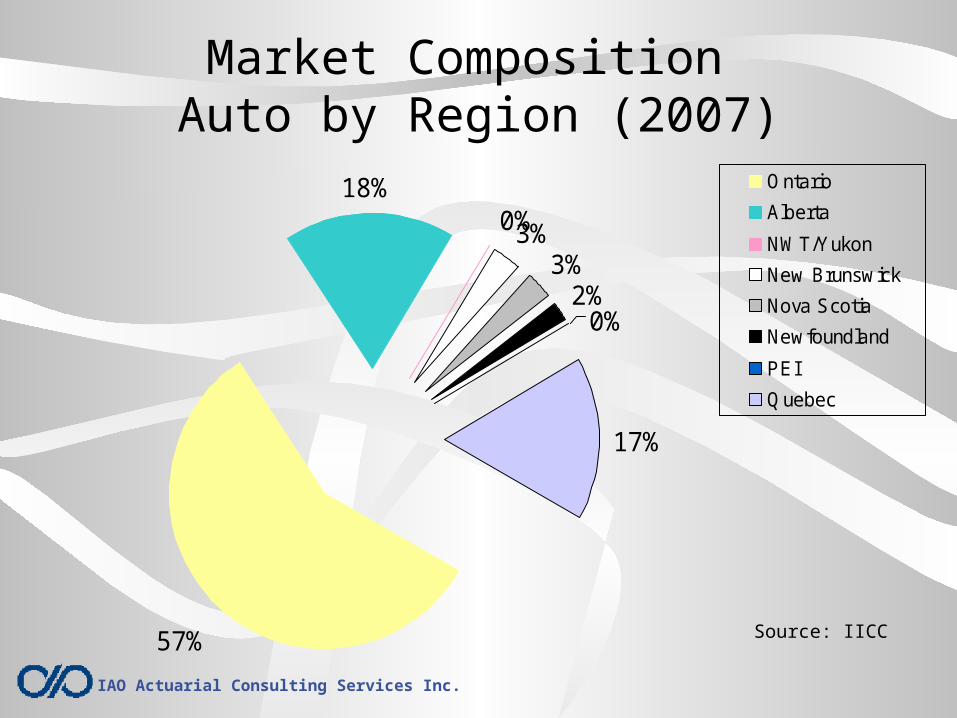
Market Composition Auto by Region (2007)
57%
18%0%3%
3%2%
17%
0%
Ontario
Alberta
NWT/Yukon
New Brunswick
Nova Scotia
Newfoundland
PEI
Quebec
Source: IICC
IAO Actuarial Consulting Services Inc.
Market Composition Comments
• Huge auto share
• As auto goes, so goes the industry
• More rate regulation in auto makes cycle more severe – a dam that bursts
• Large companies have larger share of auto – helps explain some of the earlier ROE slides
IAO Actuarial Consulting Services Inc.
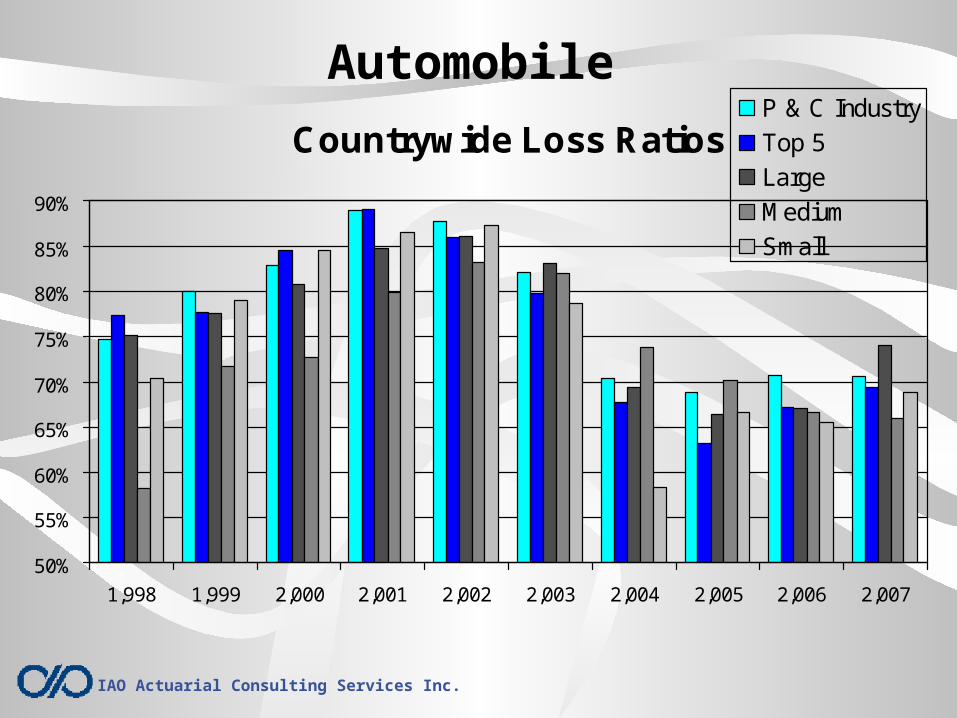
Automobile
Countrywide Loss Ratios
50%
55%
60%
65%
70%
75%
80%
85%
90%
1,998 1,999 2,000 2,001 2,002 2,003 2,004 2,005 2,006 2,007
P & C Industry
Top 5
Large
Medium
Small
IAO Actuarial Consulting Services Inc.
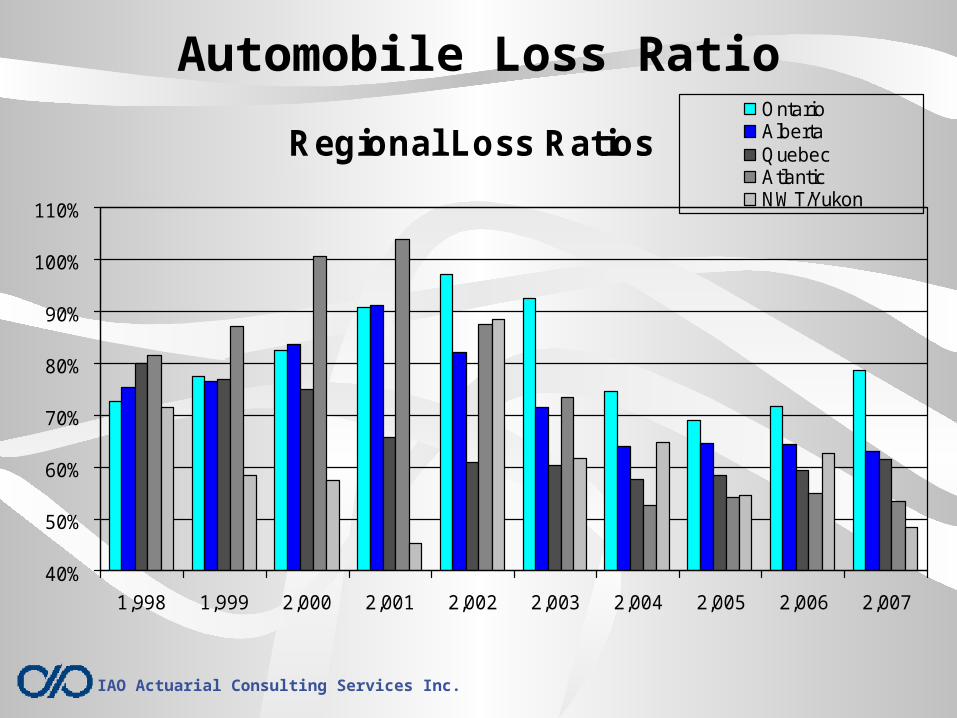
Automobile Loss Ratio
Regional Loss Ratios
40%
50%
60%
70%
80%
90%
100%
110%
1,998 1,999 2,000 2,001 2,002 2,003 2,004 2,005 2,006 2,007
OntarioAlbertaQuebecAtlanticNWT/Yukon
IAO Actuarial Consulting Services Inc.
Automobile ROE
Regional ROE
-10%
0%
10%
20%
30%
40%
1,998 1,999 2,000 2,001 2,002 2,003 2,004 2,005 2,006 2,007
Ontario Alberta
Quebec AtlanticNWT/Yukon
IAO Actuarial Consulting Services Inc.
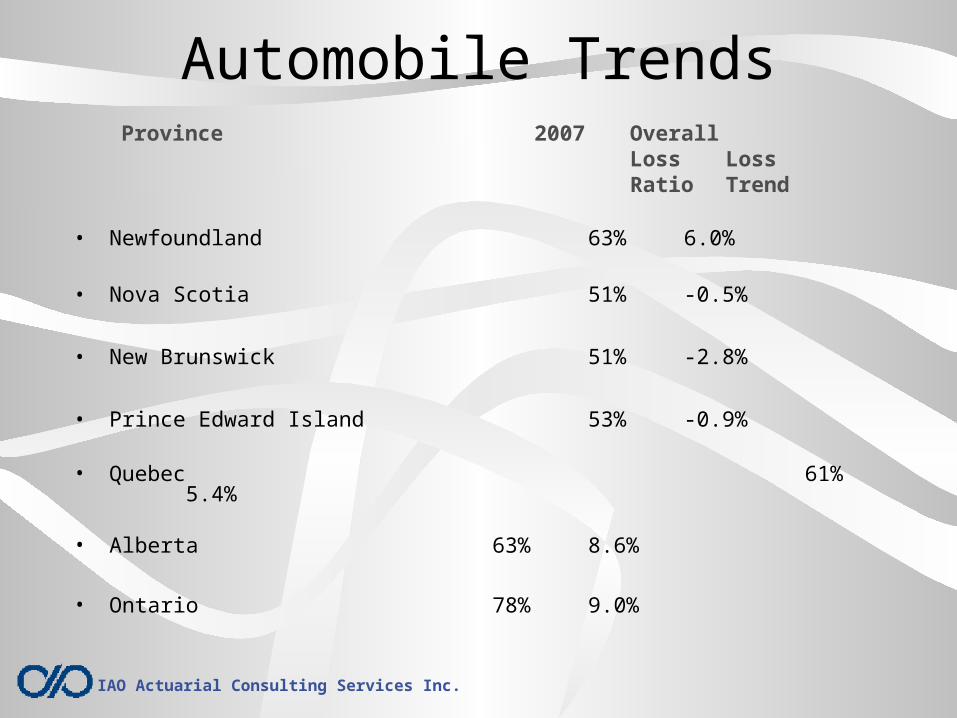
Province 2007 OverallLoss Loss Ratio Trend
• Newfoundland 63% 6.0%
• Nova Scotia 51% -0.5%
• New Brunswick 51% -2.8%
• Prince Edward Island 53% -0.9%
• Quebec 61% 5.4%
• Alberta 63% 8.6%
• Ontario 78% 9.0%
Automobile Trends

IAO Actuarial Consulting Services Inc.
Personal PropertyCountrywide Loss Ratios
40%
50%
60%
70%
80%
90%
1,998 1,999 2,000 2,001 2,002 2,003 2,004 2,005 2,006 2,007
P & C Industry
Top 5
Large
Medium
Small
IAO Actuarial Consulting Services Inc.
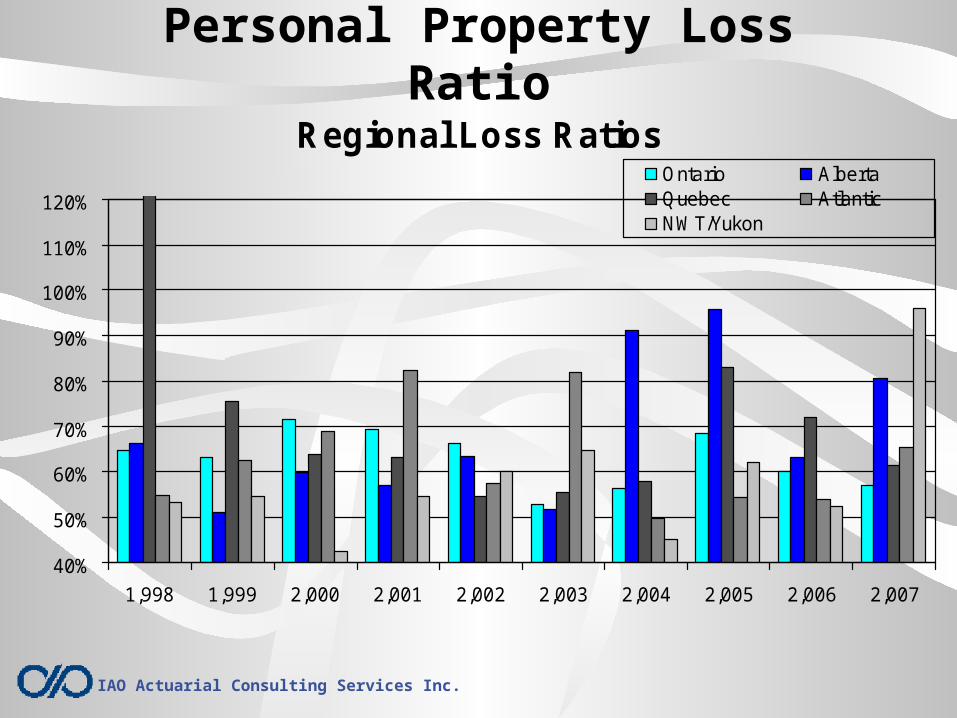
Personal Property Loss Ratio
Regional Loss Ratios
40%
50%
60%
70%
80%
90%
100%
110%
120%
1,998 1,999 2,000 2,001 2,002 2,003 2,004 2,005 2,006 2,007
Ontario AlbertaQuebec AtlanticNWT/Yukon
IAO Actuarial Consulting Services Inc.
Personal Property ROE
Regional ROE
-35%
-25%
-15%
-5%
5%
15%
25%
35%
45%
1,998 1,999 2,000 2,001 2,002 2,003 2,004 2,005 2,006 2,007
Ontario Alberta
Quebec Atlantic
NWT/Yukon
IAO Actuarial Consulting Services Inc.
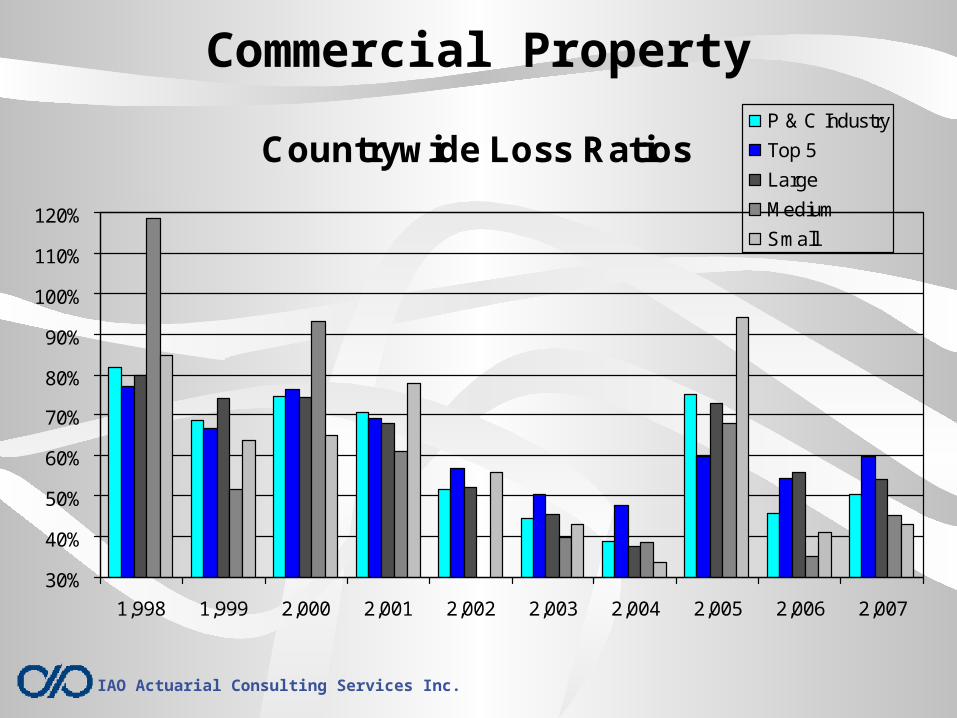
Commercial Property
Countrywide Loss Ratios
30%
40%
50%
60%
70%
80%
90%
100%
110%
120%
1,998 1,999 2,000 2,001 2,002 2,003 2,004 2,005 2,006 2,007
P & C Industry
Top 5
Large
Medium
Small
IAO Actuarial Consulting Services Inc.
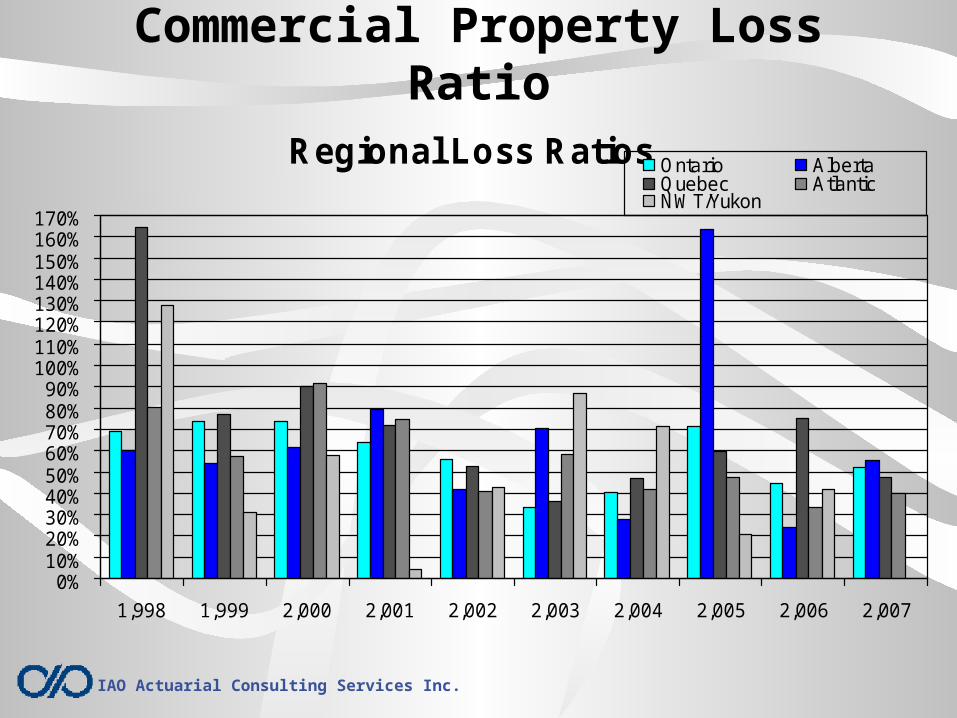
Commercial Property Loss Ratio
Regional Loss Ratios
0%10%20%30%40%50%60%70%80%90%
100%110%120%130%140%150%160%170%
1,998 1,999 2,000 2,001 2,002 2,003 2,004 2,005 2,006 2,007
Ontario AlbertaQuebec AtlanticNWT/Yukon
IAO Actuarial Consulting Services Inc.
Commercial Property ROE
Regional ROE
-80%-70%-60%-50%-40%-30%-20%-10%
0%10%20%30%40%50%60%70%80%90%
1,998 1,999 2,000 2,001 2,002 2,003 2,004 2,005 2,006 2,007
Ontario Alberta
Quebec Atlantic
NWT/Yukon
IAO Actuarial Consulting Services Inc.
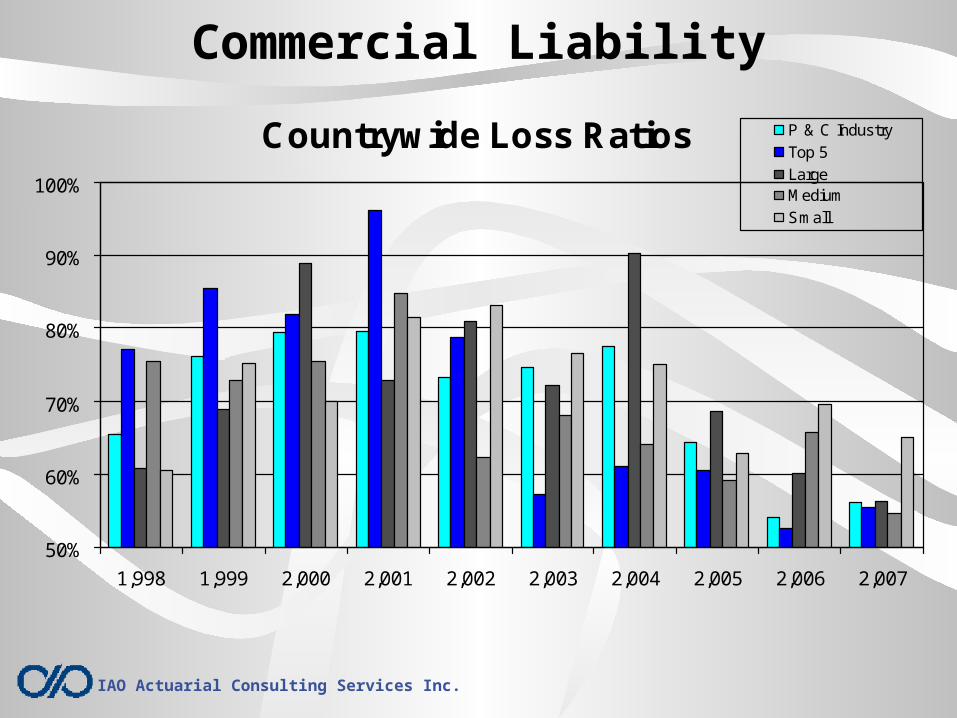
Commercial Liability
Countrywide Loss Ratios
50%
60%
70%
80%
90%
100%
1,998 1,999 2,000 2,001 2,002 2,003 2,004 2,005 2,006 2,007
P & C IndustryTop 5LargeMediumSmall
IAO Actuarial Consulting Services Inc.
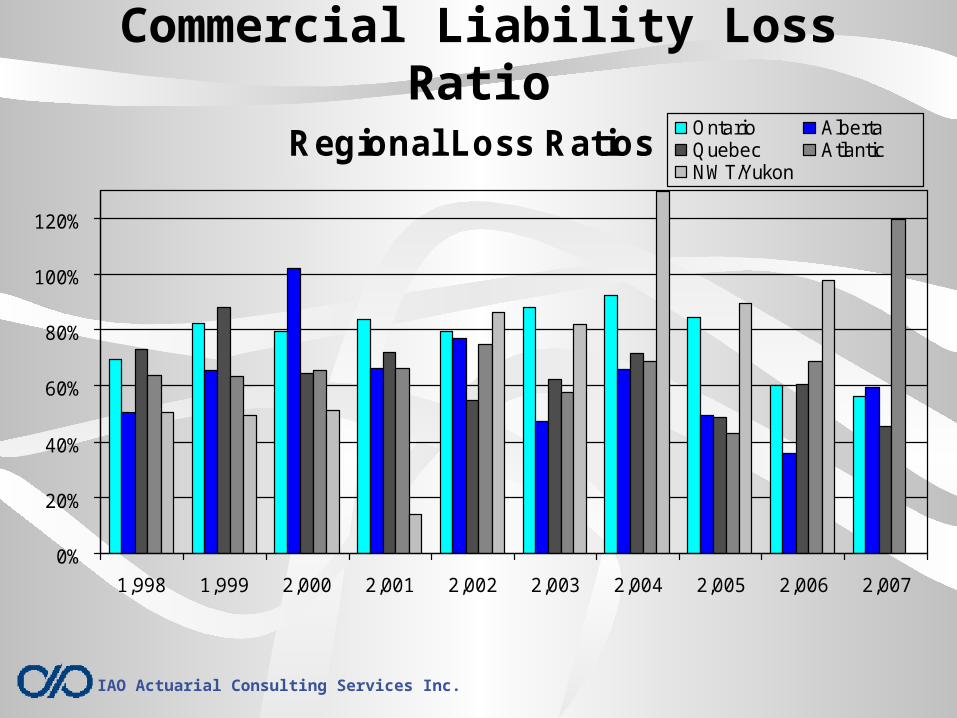
Commercial Liability Loss Ratio
Regional Loss Ratios
0%
20%
40%
60%
80%
100%
120%
1,998 1,999 2,000 2,001 2,002 2,003 2,004 2,005 2,006 2,007
Ontario AlbertaQuebec AtlanticNWT/Yukon
IAO Actuarial Consulting Services Inc.
Commercial Liability ROE
Regional ROE
-50%
-40%
-30%
-20%
-10%
0%
10%
20%
30%
40%
50%
60%
70%
80%
1,998 1,999 2,000 2,001 2,002 2,003 2,004 2,005 2,006 2,007
Ontario Alberta
Quebec Atlantic
NWT/Yukon
IAO Actuarial Consulting Services Inc.
Regional / Line of Business Comments
• Wild ride in Atlantic Canada – always ignored
• Prepare for one in Alberta – auto minor injury regulation
• Property relatively stable
• Auto is the culprit
IAO Actuarial Consulting Services Inc.
Auto Some More• Joe Average hates auto insurance• Auto insurance in Canada is highly politicized • Rate regulators put constant downward
pressure on rates• Companies eventually respond• Public outcry• Changes to the auto product • If changes are initially successful, calm
ensues,• But . . . the cycle eventually repeats
IAO Actuarial Consulting Services Inc.
What is to Blame?• Yes, yes . . . Economic cycles,
catastrophic events, etc.
• But …• The product itself• Human nature in general
– Company management– actuaries
IAO Actuarial Consulting Services Inc.
Can Anything Be Done?• Yes, but we will always have a cycle• Do your rate indications – where are
they?• Do your rate indications – do them more
often• Stop being so passive – leadership is
needed• Better communication
IAO Actuarial Consulting Services Inc.
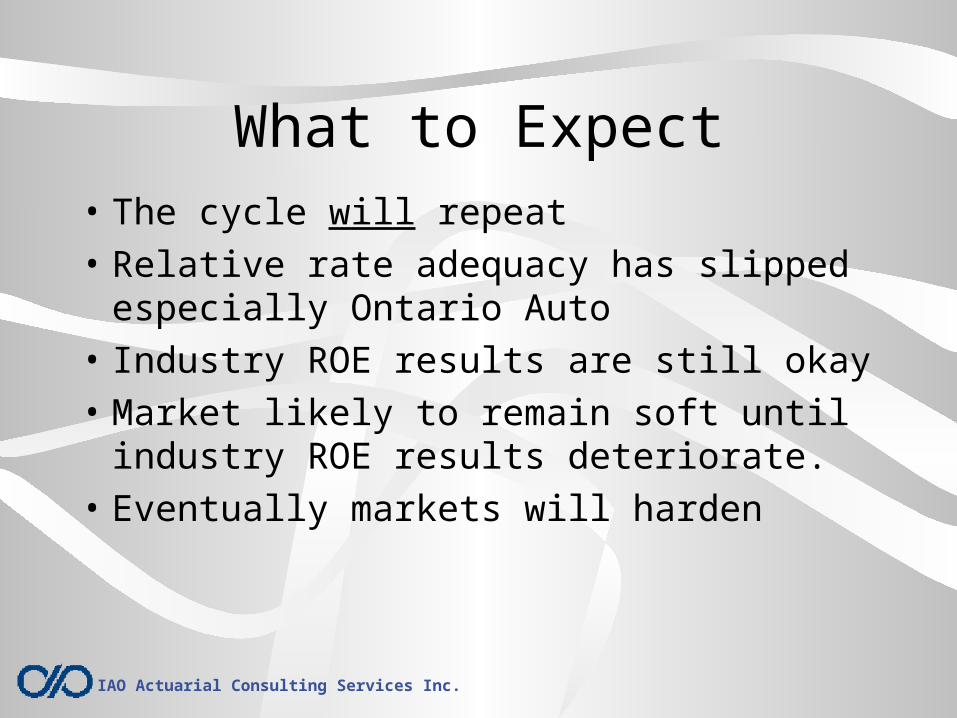
What to Expect
• The cycle will repeat
• Relative rate adequacy has slipped especially Ontario Auto
• Industry ROE results are still okay
• Market likely to remain soft until industry ROE results deteriorate.
• Eventually markets will harden
IAO Actuarial Consulting Services Inc.
END OF PRESENTATION