Embed Size (px)
Citation preview

Market AssessmentSilver Lane Corridor Study Committee
Town of East Hartford, CT | May 2017
April, 2017

22
• Market Areas
• Retail Market Assessment
• Housing Market Assessment
• Conclusions
• Development Opportunity Sites
• CRCOG Transportation Study
• Next Steps
Agenda

33
Market Areas
Market Type Local Regional
Retail Trade Areas
5-Minute Drive TimeNeighborhoods immediately surrounding Silver Lane. Reflects the short distances that residents or workers are willing to
travel for their day-to-day shopping needs.
30-Minute Drive TimeCentral and Eastern Hartford County and
parts of Tolland, Middlesex, and New Haven Counties. Aligns with the core market area for
the Outlet Shoppes at Rentschler Field.
Housing Market Areas
Town of East HartfordOpportunities to capture natural
population and household growth within the Town of East Hartford
Hartford CountyOpportunities to capture people who
commute to jobs in East Hartford - 60% of workforce lives within Hartford County
Different geographic areas were used to assess local and regional retail and housing markets

44
Business InventoryBusiness Type
Occupied Space (Sq. Ft.)
Number of Businesses
Institutional 13,568 2Government Bui lding 13,568 2
Leisure, Hospitality, and Food Service 122,631 18Amusement, Gambl ing, and Recreation 60,908 3Ful l -Service Restaurants (Si t Down) 17,000 9Hotels/Motels 32,094 1Limited-Service Eating Places (Takeout) 12,629 5
Professional and Office 46,813 17Bank 10,517 2Information/Media 2,896 1Legal Services 1,607 1Medica l Offices 11,175 4Other Profess ional Offices 20,618 9
Retail and Services 467,805 47Automotive Parts , Accessories , and Ti re Stores 13,220 4Beer, Wine, and Liquor Stores 14,394 3Chi ld Day Care 23,882 1Clothing Stores 100,700 2Convenience Stores 3,540 2Department Stores 35,000 1Dry-cleaning/Laundry/Tai loring 2,700 1Funera l Home/Mortuary 1,740 1Furni ture Stores 6,799 1Gasol ine Stations 3,391 3Grocery Stores 88,941 2Mobi le Phone Stores 900 2Nurs ing Home/Res identia l Care 94,335 2Other Genera l Merchandise Stores 2,200 1Other Miscel laneous Store Reta i lers 7,500 3Pawn Shop 9,183 1Personal Care Services (ha i r/na i l sa lons , etc.) 16,500 10Pharmacy and Drug Stores 28,110 2Specia l ty Food Stores 10,370 3Sporting Goods , Hobby, and Mus ic Stores 4,400 2
Total Occupied Businesses 650,817 84Vacant Commercial Space 213,257 25Commercial Vacancy Rate 24.7%
• Business inventory conducted in January through field survey - inventoried commercial units, number of occupied units, and square footages
• 84 businesses and 25 vacant commercial units identified for a total of 864,000 square feet of commercial use
• Total commercial vacancy rate is 24.7%• Occupied commercial space composition:
• 72% is retail and service• 19% is leisure, hospitality, food service• 7% in professional office
Existing Business Mix

55
Silver Lane: Recent Developments
Commercial Development
Address: 801 Silver LaneYear Built: 2008 Size: 17,000 SF
Aldi Supermarket
Address: 735 Silver LaneYear Built: 2017 (est.) Size: 7,500 SF
Dollar General (Approved)Address: 972 Silver LaneYear Built: 2012 Size: 14,500 SF
CVS Pharmacy
Address: 364 Silver LaneYear Built: 2009 Size: 2,400 SF
Dunkin Donuts

66
Major Vacant Spaces
Commercial Vacancy
Vacant Units: 1 Vacant Sq. Ft.: 65,847 SFFor Sale: $5,000,000
Showcase Cinemas (Movie Theater)
Vacant Units: 2 Vacant Sq. Ft.: 14,857 SFFor Lease: $10/SF/Year
467-479 Silver Lane (Class B Office)Vacant Units: 2 Vacant Sq. Ft.: 26,078 SFFor Lease: Negotiable
Charter Oak Mall (Retail)
Vacant Units: 15 Vacant Sq. Ft.: 112,115 SFFor Sale or Lease? N/A
Silver Lane Plaza (Retail)

77
Local Retail Trade Area
Map based on ESRI 5-minute drive time buffer from 500 Silver Lane
5-Minute Drive Time from 500 Silver Lane
500 Silver Lane
Local Retail Trade Area5-minute drive time from 500 Silver Lane – represents the short distances residents and workers are willing to travel for their day-to-day shopping needs such as groceries, pharmacy, and other convenience items

88
Local Retail Trade Area
Demographic Trends
• Large population within a 5-minute drive of Sliver Lane ~24,500 residents as of 2016• Modest population growth since 2000 – largely driven by increasing household size• Population and households are projected to grow slowly up to 2021 – however, this is
dependent on available housing. If new housing units are developed, population growth could be higher
• Large daytime population – nearly 20,000 workers within a 5-minute drive of Silver Lane –• Including 7,400 workers at Pratt & Whitney/UTC as of 2015

99
Local Retail Trade Area
Demographic Trends
• Resident population is younger (median age of 36.0 years old) than Town of East Hartford (38.7 years old) and Hartford County (40.8 years old)
• Population will age over next five years – larger proportion of persons over age 65 and smaller proportion of children under age 18
• Population consists mostly of low and moderate income households – median income of $40,057 is 12% lower than Town of East Hartford and 37% lower than Hartford County

1010
Retail Leakage Surplus
Local Retail Trade Area
Retail Sales: $528.9 million
Retail Spending Potential: $287.7 million
Retail Gap: $241.2 million surplus
• Leakage/surplus analysis compares retail sales (supply) to retail spending potential (demand) in a trade area
• One of the main weaknesses of leakage/surplus analysis is that it only looks at the spending potential of the resident population and does not take into consideration workers – underestimates retail spending potential in areas with a large employment base like Silver Lane
• If residents spend more than is captured in local sales, there is a retail leakage. This means that area residents shop for some goods and services outside of the trade area
• If retailers sell more goods than are demanded by the local population, there is a retail surplus. This indicates that local retailers draw in customers from outside the surrounding area or capture spending from daytime workers and visitors in the area

1111
Local Retail Trade AreaLeakage Sectors in the Local Trade Area
• Six sectors have a retail leakage, meaning that residents shop for these goods outside of Silver Lane. These sales could potentially be captured within the Silver Lane corridor. Leakage Factor measures the extent of the retail leakage – 100 means all consumer spending is done outside the trade area while a factor of 0 indicates that supply and demand are equal
• Approved Dollar General captures retail leakage in “General Merchandise Stores” sector• Remaining leakage in “GAFO*” sectors likely captured by Outlet Shoppes at Rentschler Field• Food & Beverages and Food Service & Drinking Places have the greatest opportunity of
being captured on Silver Lane – also supported by employment base and Outlet Mall shoppers
Sectors most likely to be captured locally
“GAFO” sectors most likely captured at regional-scale retailers *
* GAFO represents merchandise that is normally sold in department stores. It stands for General Merchandise, Apparel and Accessories, Furniture, and Other Sales

1212
Consumer Spending – Resident Population
Local Retail Trade Area
Consumer Spending Total SpendingAverage Spent per Household
Spending Potential Index
Apparel & Services $14,998,468 $1,584.79 79Education $10,858,629 $1,147.36 81Entertainment/Recreation $20,157,308 $2,129.89 73Food at Home $36,354,027 $3,841.30 77Food Away from Home $22,506,891 $2,378.16 77Health Care $34,519,743 $3,647.48 69Household Furnishings/Equipment $12,242,611 $1,293.60 73Personal Care Products and Services $5,174,109 $546.71 75Shelter $119,069,588 $12,581.32 81Support Payments/Cash Contributions/Gifts $14,765,980 $1,560.23 67Travel $12,412,149 $1,311.51 70Vehicle Maintenance & Repair $7,141,853 $754.63 73Total $310,201,356 $32,777 -
Source: ESRI Marketplace Profile - 2016
Lower than average consumer spending across all categories
A spending potential index of 100 represents the
national average household spending in each category.

1313
Local Retail Trade AreaConsumer Spending - Workforce• Large employment base surrounding Silver
Lane bolsters consumer spending in the area
• East Hartford has well-paid jobs – average wage of $69,400 is higher than state and national averages
• According to a 2011 data from ICSC, the average suburban office worker spends an average of $11,786 dollars annuallygetting to work, over the course of the business day, and after work before going home
Most common expenditures for office workers were transportation (including gasoline); grocery stores; fast food/delis/lunch eateries; and full-service restaurants
Average Annual Suburban Office Worker Spending
Type of SpendingAverage Annual
Expenditures (2011)Transportation & Online Purchase $4,167.28
Transportation $1,958.84Online Purchase Made form Office (Personal) $2,208.44
Full Service Restaurants and Fast Food $1,500.72Full-Service Restaurants $679.12Fast Food/Deli/Lunch Eateries $821.60
Goods & Services $6,118.32Department Stores $469.56Discount Stores $589.16Drug Stores $395.20Grocery Stores $1,122.16Clothing Stores $230.36Shoe Stores $176.80Sporting Goods Stores $181.48Electronics/Phone/Computer Stores $464.36Jewelry $195.00Office Supplies/Stationary, Novelty $385.32Warehouse Clubs $640.64Other Goods (florist, non-food vendors) $195.00Personal Care Shops $299.52Personal Services $258.44Other Services $254.80Entertainment $260.52
Total $11,786.32Source: International Counci l of Shopping Centers , Suburban Office Worker Spending
https ://www.downtowndevelopment.com/pdf/icsc-report_office-worker-spending.pdf

1414
Local Retail Trade Area
CompetitorsImportant to understand Silver Lane’s position relative to nearby commercial areas• Spencer Street – overlaps the
eastern end of Silver Lane trade area (east of Forbes)
• Putnam Bridge – overlaps the southern end of Silver Lane trade area (south of Ensign)
• School Street – overlaps northern end of Silver Lane trade area (north of I-84)
Trade areas based on 5-minute drive time buffers developed by ESRI
5-Minute Drive Time from 500 Silver Lane
5-Minute Drive Time from competing commercial areas

1515
Competitors• Silver Lane has the highest trade-area population and second highest retail spending
potential. Also has the lowest median disposable income and traffic volumes
• Silver Lane has a larger employment base than the competing trade areas
• Spencer Street has the strongest performance of competing commercial areas – coupled with excellent highway access makes it the most likely location for future big box retail
• Silver Lane is unlikely to support additional “big box” retail anchors in the near future –traffic volumes are below those required by large national chains
Local Retail Trade Area
Characteristics of Silver Lane and Comparable Commercial Areas

16
Takeaways• Local demographics indicate that resident consumers are price conscious and likely to shop at
value-oriented retailers – aligns with recent commercial developments in area (Aldi, Dollar General)
• Recent developments show preference for smaller single-occupant buildings with frontage on Silver Lane
• More local spending power needed to support and grow neighborhood retail in the corridor –new housing development is key
• Opportunities to capture retail “leakage” in the food sales and food service sectors – caters not only to resident population, but also area workers, outlet mall shoppers, and Rentschler Field patrons
• Large, well-paid workforce consumer base. Employment growth at Pratt & Whitney/UTC campus provides opportunity to further bolster consumer spending in sectors catering to local workforce such as gas stations, food service/lunch establishments, and convenience retail
• Current B-1 zoning district is intended for big box stores, but additional big box development unlikely to be supported
• Strongest competition from Spencer Street area of Manchester
16
Local Retail Trade Area

17
Regional Retail Trade Area• 30-Minute Drive Time from 500 Silver Lane - representative of the Outlet Mall’s core
market area (Horizon Group market study used 25 miles)
17
Regional Retail Trade Area
30-Minute Drive Time from 500 Silver Lane
Source: ESRI Business Analyst – 30 Minute Drive Time Trade Area
25-Mile Radius from Horizon Group Market Study

1818
Regional Retail Trade Area
Outlet Shoppes Impacts• Approximately 350,000 square feet of
Gross Leasable Area (GLA)• Marketed towards mid- and high-end
retailers• Tenant Mix:
• 90% to 95% of space to be leased to retailers (clothing, apparel, specialty food, home furnishings, health & personal care stores etc.)
• Remaining space to be leased to restaurants and eating places
Photo courtesy of the Horizon Group and the Hartford Courant

1919
Outlet Shoppes Impacts• Estimated 1,333 full-time equivalent jobs
generating $36.6 million in annual direct labor income into the region • Many workers likely to come from
surrounding neighborhood – bolsters consumer spending in the local trade area
• Significant traffic volumes generated from the Outlet Shoppes• 12,840 trips on weekdays and 19,800
trips in Saturdays• About 70% of traffic will bypass Silver
Lane• However, Silver Lane still projected
to see modest boost in traffic –increase of ~1,900 trips on weekdays and ~3,000 trips on Saturdays
Regional Retail Trade Area
Outlet Shoppes Traffic Impacts
Outlet Shoppes Site
of trips to Roberts St/I-84
60%
of trips access site from Brewer Street
10%
of trips to access the site from north
90%

2020
Regional Retail Trade Area
Demographic Trends
• Over 1.05 million people within a 30-minute drive of Silver Lane• Stable household size • Slow population growth since 2000 – projected to continue in near future• Reflects overall stagnant economy in Greater Hartford as a whole – future population
trends tied to regional economic conditions

2121
Regional Retail Trade Area
Demographic Trends
• Older population than local retail trade area – median age of 40.3 years old• Aging population – persons age 65+ projected to make up 18.5% of population in 2021• Larger number of high-income households – 30.5% of families make $100,000+ per year –
projected to grow to 34.3% of households by 2021• Median household income projected to grow 9% by 2021

2222
Regional Consumer Spending
Regional Retail Trade Area
Higher than average consumer spending across all measuresRegional consumers spend about 50% more than local consumers
Consumer Spending Total SpendingAverage Spent per Household
Spending Potential Index
Apparel & Services $969,644,693 $2,327.68 116Education $748,489,346 $1,796.78 127Entertainment/Recreation $1,370,129,303 $3,289.06 113Food at Home $2,326,378,429 $5,584.58 112Food Away from Home $1,459,883,959 $3,504.52 113Health Care $2,439,047,853 $5,855.05 111Household Furnishings/Equipment $836,110,764 $2,007.12 114Personal Care Products and Services $347,051,923 $833.11 114Shelter $7,706,500,649 $18,499.80 115Support Payments/Cash Contributions/Gifts $1,075,667,500 $2,582.19 111Travel $907,724,065 $2,179.03 117Vehicle Maintenance & Repair $480,236,593 $1,152.83 111Total $20,666,865,077 $49,612 -
Source: ESRI Marketplace Profile - 2016 A spending potential index of 100 represents the
national average household spending in each category.

23
Sector Retail Leakage Leakage FactorFurniture & Home Furnishings Stores $139,953,471 12.6
Electronics & Appliance Stores $45,926,341 2.4
Gasoline Stations $92,093,452 5.2
Clothing & Clothing Accessories Stores $289,594,563 14.4
Sporting Goods, Hobby, Book & Music Stores $60,677,976 5.5
Miscellaneous Store Retailers $130,934,581 9.9Food Services & Drinking Places $29,270,278 0.8
Source: ESRI Leakage Surplus Assessment: 2016
23
Regional Retail Trade Area
Leakage Sectors in the Regional Trade Area
Sectors directly captured by the Outlet Shoppes
• Leakage Factor measures the extent of the retail leakage – 100 means all consumer spending is done outside the trade area while a factor of 0 indicates that supply and demand are equal. Most sectors have a small leakage factor
• Outlet Shoppes to capture retail sales in the Clothing & Clothing Accessories sector, Furniture & Home Furnishings, and Sporting Goods, Hobby, Book & Music sectors
• Other sectors may be opportunities for spillover retail in the Silver Lane corridor

2424
Regional Retail Trade AreaOutlet Mall Opportunities• Surveyed off-site complementary retailers at 5 similar developments – all businesses located
between development and highway interchanges. Most likely complementary retailers: • Restaurants (Fast Casual, Coffee, National Chains) • Electronics Stores (Mobile Phones)• Furniture & Home Furnishings• Gas Stations
• The top four complementary retailers all have regional retail leakages – sales could be captured
Complementary Retailers at Similar Developments, by Sector

2525
Regional Retail Trade Area
Takeaways• Outlet Mall to draw in a wealthier regional consumer base• Opportunity to generate “spinoff” commercial development, particularly for food
service & restaurants, gasoline stations, mobile phone stores, furniture stores• These businesses frequently locate near outlet malls and also have regional retail
leakage• Most Outlet Mall traffic will bypass Silver Lane• Greatest opportunity for spinoff commercial development is in the vicinity of the
Roberts Street and Silver Lane intersection, which has the greatest visibility to Outlet Mall traffic
• Unique, niche use, or cluster of niche uses needed to stimulate the traditional commercial core of Silver Lane

2626
Local Housing Market Area
Local Housing Market

2727
Local Housing MarketDemographic Trends• Population growth since 2000 reverses trend of population loss from previous decades
• Number of households shrunk slightly between 2000 and 2010 limiting demand for new housing – population growth driven by increasing household size
• Median household income of $48,369 – about 40% lower than the county average• Median household income for homeowners is $67,199 compared to just $26,800 for renters • Younger householders more likely to rent, older householders more likely to own• Growing number of family households, but fewer number of married-couple families

28
Housing Stock• Rental Vacancy Rate – 6.8%• Homeowner Vacancy Rate – 2.2%
28
Local Housing Market
Housing Unit Characteristics NumberPercent of Total
Vacancy Rate
Occupied Housing Units 20,225 91.4%Owner Occupied 11,429 51.7%Renter Occupied 8,796 39.8%
Vacant Housing Units 1,891 8.6%For rent 598 2.7% 6.8%Rented, not occupied 265 1.2%For Sale only 256 1.2% 2.2%Sold, not occupied 0 0.0%For seasonal, recreational, or occasional use 0 0.0%Migrant worker housing 0 0.0%Other vacant 772 3.5%
Total Housing Units 22,116 100.0% -Source: American Community Survey 5-Year Estimates: 2011-2015

29
Housing Stock• Aging housing stock – owner-
occupied housing slightly older (1957) than renter-occupied housing (1962)
• Very few renter-occupied units built since 1990
29
Local Housing Market
Year Built Number Percent Number PercentBuilt 1939 or earlier 1,272 11.1% 1,467 16.7%
Built 1940 to 1949 1,566 13.7% 633 7.2%
Built 1950 to 1959 3,861 33.8% 1,775 20.2%
Built 1960 to 1969 2,505 21.9% 2,208 25.1%
Built 1970 to 1979 798 7.0% 1,302 14.8%
Built 1980 to 1989 833 7.3% 1,134 12.9%
Built 1990 to 1999 268 2.3% 149 1.7%
Built 2000 to 2009 310 2.7% 89 1.0%
Built 2010 or later 16 0.1% 39 0.4%
Total 11,429 100.0% 8,796 100.0%Median Year Built
Owner-Occupied Renter Occupied
1957 1962Source: American Community Survey 5-Year Estimates: 2011-2015
Housing Unit Year Built, by Tenure Status: 2015

3030
Local Housing Stock
Address: 181 Nutmeg LaneRent Range: $910 to $1,100 per monthYear Built: 1971 Units: 561
Woodcliff EstatesAddress: 66 Plain DriveRent Range: Income dependent Year Built: 1953 Units: 398
Summerfield Townhouses
Address: 126-140 Silver LaneRent Range: $725 to $950 per monthYear Built: 1966 Units: 115
Stone Creek ApartmentsAddress: 446 Main StreetRent Range: Income dependent Year Built: 1980 Units: 96
Willow Arms Apartments

31
Home Sales
31
Local Housing Market
• Strong recovery in single-family home sales over last three years• Affordable single-family housing stock – 2016 median sale price was $146,500 -
about 50% lower than county-wide median• Condominium sales remain well below pre-recession levels

32
Housing Permit Activity
32
Local Housing Market
• 261 housing permits issued since 2000 – peaking at 79 permits in 2006• Almost entirely single-family permits – mostly infill projects on vacant land• 150 demolition permits issued since 2000 – net gain of 91 housing units• Net loss of housing units since 2010 – 30 construction permits and 33 demolition
permits issued

3333
East Hartford: Recent Major Developments
Residential Development
Address: 973 Silver LaneYear Built: 2006 Units: 60
Phillips Farm (55+)Address: Cartway Lane and Footpath LaneYear Built: 2006 to 2009 Units: 39
Cartway Lane/Footpath Lane
Address: Joanne Drive and Vincent CircleYear Built: 2006 Units: 56
Goodwin Village (55+)
No major residential developments have occurred in East Hartford since the mid 2000s.

3434
Estimate of Local Housing Demand
Assumptions• East Hartford’s population will grow at the same annualized rate (0.21%) as it did from
2000 to 2016. Town population will grow to 53,377 by 2025• Household size will remain stable at 2.50 persons per household• The same housing tenure and household income distribution as today• Local Housing Unit Demand only captures units needed to accommodate natural
population growth. Does not factor in employment growth at Pratt & Whitney
Projected Local Housing Demand: 2025Population 2025: 53,377New Residents: 989Local Housing Unit Demand: 396

3535
Local Housing Demand
• Local demand for 224 owner-occupied units and 172 renter-occupied units• Rental demand caters to low and middle income population – over 75% of projected
new rental demand for households who make less than $50,000 per year (max of $1,250 per month for housing costs)
• Over two-thirds of homeowner demand is for households making more than $50,000 per year (greater than $1,250 per month for housing costs)
Projected Price Points of New Local Housing Demand
Household IncomeOwner-Occupied
Unit DemandRenter-Occupied
Unit DemandTotal Unit Demand
Maximum Monthly Housing Costs
Less than $25,000 24 79 103 Less than $625$25,000 to $49,999 50 52 102 $625 to $1,250$50,000 to $74,999 50 22 72 $1,250 to $1,875$75,000 to $99,999 41 11 52 $1,875 to $2,500$100,000 or more 59 8 67 Greater than $2,500Total 224 172 396 -
MMI calculations based on 2015 income and tenure distribution data from American Community Survey
All values are in 2015 dollars ($)

3636
Local Housing Demand
• Recent population growth attributed to increasing household size – has not translated into an increased demand for housing units
• Resident renter population has much lower incomes than homeowner population –however, this is likely reflecting the quality of existing multi-family housing stock
• No large multi-family residential projects built in East Hartford over the last 20 years• Over the last 20 years, almost all new developments have been single-family infill projects
on vacant land• Local residential demand yields an estimated 396 additional dwelling units by 2025
• Owner-occupied units cater towards higher-income households while rental occupied units cater largely towards lower-income households
• Town should continue to encourage of diversification of housing stock – demolition of substandard housing and construction of new units, particularly for market rate multi-family
Takeaways

3737
Regional Housing Market Area
Regional Housing Market
Opportunity to capture those who work in East Hartford in market rate housing (notably new hires at Pratt & Whitney)
38
Housing Permit Activity
38
Regional Housing Market
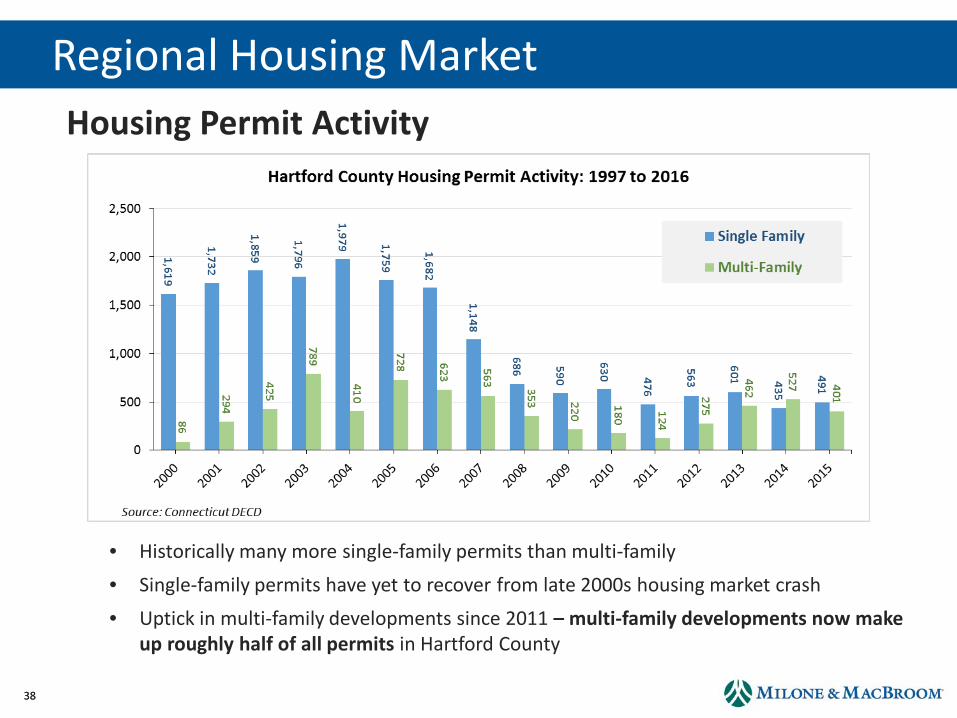
• Historically many more single-family permits than multi-family• Single-family permits have yet to recover from late 2000s housing market crash• Uptick in multi-family developments since 2011 – multi-family developments now make
up roughly half of all permits in Hartford County

3939
Regional Housing Market
Multi-Family Housing Projects in Surrounding Communities
• Over 1,100 multi-family units built or approved in surrounding communities• Market rate developments with on-site amenities (pool, fitness center, etc.) and
proximity to shopping, restaurants, and entertainment• Prices ~$1,400+ for a 1 BR Apartment and ~$1,750+ for a 2 BR apartment
Project Town Type # of Units Year BuiltTempo Evergreen Walk South Windsor Apartments 200 Under Construction
Glastonbury Mews Glastonbury Apartments/Condos 145 Under Construction
The Tannery Glastonbury Apartments 250 Under Construction
Broadleaf Boulevard (Phase I) Manchester Apartments 224 2015
Broadleaf Boulevard (Phase II) Manchester Apartments 135 Approved
South Windsor Woods South Windsor Condominium 155 2016
Total All Developments 1,109

4040
Residential Market AnalysisCRDA Housing Projects in Downtown Hartford
• All Downtown Hartford projects have received financial assistance from CRDA• Most new developments have vacancy rates under 20% as of 6/30/16 - many are still
in lease-up period
Project Town Type # of Units Year Built Vacancy Rate 1
777 Main Street Hartford Apartments 285 2015 13%
The Grand on Ann Hartford Apartments 26 2014 15%
179 Allyn Hartford Apartments 63 2015 3%
Front Street Lofts Hartford Apartments 121 2015 35%
Spectra Hartford Apartments 190 2015 7%
36 Lewis Hartford Apartments 6 2015 67%
38-42 Elm Hartford Apartments 6 2015 33%
Capewell Lofts Hartford Apartments 72 2017 Now Leasing
Capitol Lofts Hartford Apartments 112 2017 Now Leasing
1279-83 Main Hartford Apartments 8 Approved -
370 Asylum Hartford Apartments 60 Approved -
Raddison Hartford Apartments 96 Approved -
CRDA Approved Housing 1,0451. Vacancy rate as of June 30, 2016
Source: CRDA Annual Report: 2015-16.

4141
Regional Housing MarketPratt & Whitney Impacts• Pratt & Whitney currently employs approximately 7,000 workers in East Hartford• Expansion at Pratt & Whitney over next decade - 8,000 new hires in Connecticut
• Nearly 70% of new hires will replace retiring workers • However, still sizable net growth in employment - estimated 2,240 new jobs
statewide
Pratt & Whitney Workforce Characteristics, East Hartford Facility: 2014
Source: U.S. Census Bureau LODES Dataset, 2014

4242
Regional Housing Market
Pratt & Whitney Impacts• About 4.3% of Pratt & Whitney workers at the East Hartford facility and 1.6% of workers at
the Middletown facility live in East Hartford
Where do Pratt & Whitney Workers Live?East Hartford Facility: 2014
Source: U.S. Census Bureau LODES Dataset: 2014

4343
Estimate of Regional Housing Demand
Assumptions• New hires will be younger working adults (under age 45) – housing tenure based on existing
distribution for householders under age 45 for Hartford County• 52.4% of Hartford County householders under age 45 live in renter-occupied housing
• Made assumptions on salary distribution in order to project maximum monthly housing costs
• Yields demand for 2,240 housing units – this only accounts for new positions
MMI Assumptions Median salary at Pratt & Whitney was $76,000 per year according to payscale.com
Job ClassEstimated Percent
of New JobsEstimated Salary
RangeEntry Level Engineer or Skilled Trades 50% $50,000 to $74,999Mid-Level Engineer 30% $75,000 to $99,999Management 20% $100,000 or more

4444
Regional Housing Demand
• Yields additional demand of 1,174 rental units and 1,066 homeowner units region wide• If the same number of new workers live in East Hartford as today, the Town would
see a demand for 86 new housing units• More higher-income rental demand compared to local housing market – most demand is
in the $1,250 to $2,500 per month price range. Rental units in this price range typically have on-site amenities (fitness center, pool, etc.) and proximity to entertainment, dining and shopping.
• East Hartford does not currently have many rentals leasing at these price points –however, the Outlet Shoppes, nearby riverfront and trail amenities, and the potential for CTfastrak expansion in the area could enhance the corridor’s position in the regional multi-family marketplace
Projected Price Points of Pratt & Whitney Housing Demand
Household IncomeOwner-Occupied
Unit DemandRenter-Occupied
Unit DemandTotal Unit Demand
Maximum Monthly Housing Costs
Less than $25,000 - - 0 Less than $625$25,000 to $49,999 - - 0 $625 to $1,250$50,000 to $74,999 533 587 1,120 $1,250 to $1,875$75,000 to $99,999 320 352 672 $1,875 to $2,500$100,000 or more 213 235 448 Greater than $2,500Total 1,066 1,174 2,240 -
4545
Regional Housing Demand
Takeaways• Large increase in region’s multi-family housing inventory in recent years. Surrounding
communities have added or approved over 2,000 multi-family units since 2014• Proximity to shopping, entertainment, and restaurants a key for all recent
developments in surrounding towns – can the Outlet Shoppes and CTfastrak East help reposition East Hartford within the regional multi-family marketplace?
• Existing zoning steers multi-family developments into Design Development District (DDD) zones
• No vacant land in the R-5 district (Multi-Family Residential zone)• DDD-1 zone permits multi-family development as part of a large, mixed-use, master-
planned development (such as Goodwin College/Riverfront Area or Rentschler Field)• Riverfront area ripe for market rate housing due to location and nearby amenities
• Pratt & Whitney hiring program to bolster demand for market rate rental housing – East Hartford needs to diversity its multi-family housing stock if it wants to capture

4646
Market Analysis Conclusions• Opportunities: UTC job expansion, Outlets Shoppes at Rentschler Field,
CTfastrak• Challenges: Current local spending power, lack of connection between
Rentschler Field and significant redevelopment sites, Goodwin College/ Riverfront capitalizing on potential housing market
• Impact to local area spending power from jobs created by Outlets yet to be determined
• Unique, niche use or cluster of niche uses needed to stimulate the traditional commercial core of Silver Lane
• More local spending power needed to support neighborhood retail in the corridor – new housing development
• Mixed-use redevelopment that capitalizes on UTC employees, recreational amenities (riverfront and greenway), the Outlets, and CTfastrak may offer greatest potential for revitalization

47
WetlandsWetland Delineation

48
Opportunity Areas
RENTSCHLER GATEWAY
COMMERCIAL CORE
NEIGHBORHOOD NODE

49
Development Opportunity Sites
Detailed Map Will Be Reviewed

50
Next Steps
• Developers Panel• Branding (Corridor/ Projects)• Site-Specific Redevelopment Feasibility Analyses