Embed Size (px)
Citation preview

INTERNATIONAL MONETARY FUND AND THE WORLD BANK
Market Access for Developing Country Exports—Selected Issues
Prepared by the Staffs of the IMF and the World Bank
Approved by Timothy Geithner and Gobind Nankani
September 26, 2002
Contents Page List of Abbreviations .................................................................................................................3 Executive Summary ...................................................................................................................4
I. Introduction.............................................................................................................................8
II. Market Access Issues and Policy Implications: Overview..................................................10 A. Patterns of Protection ..............................................................................................10 B. Contingent Protection..............................................................................................15 C. Standards and Nontariff Barriers to Trade ..............................................................16 D. Trade Preferences....................................................................................................17 E. Policy Implications ..................................................................................................20
III. Market Access Issues in Agriculture..................................................................................21 A. Agriculture in the Multilateral Trading System ......................................................21 B. Market Access, Agricultural Support, and Policy Trends in OECD Countries ......23 C. Agricultural Trade Policy in Non-OECD Countries ...............................................28 D. Costs of Protection and Benefits of Liberalization .................................................31 E. Distributional Implications of Reform and Adjustment Needs ...............................33 F. Policy Implications ..................................................................................................34
IV. Barriers to Trade in Textiles and Clothing ........................................................................35 A. Developing Country Exports of Textiles and Clothing...........................................35 B. Textiles and Clothing in the Multilateral Trading System ......................................36 C. Remaining Market Access Barriers to Exports of Textiles and Clothing ...............40 D. The Cost of Barriers and Benefits of Liberalization ...............................................42 E. Adjustment Needs Following Liberalization...........................................................44 F. Policy Implications ..................................................................................................47
V. Conclusions.........................................................................................................................47

- 2 -
Figures 1. Quad Countries: Trends in Trade-Distorting Agricultural Supports, 1986–88 to 1999–2001 ..........................................................................................28 2. Exports of Textiles and Clothing by Region, 1965–98................................................37 Text Tables 1. Effective Ad Valorem Tariff Equivalents on Bilateral Trade Flows ...........................12 2. Initiations of Antidumping Investigations, 1995-2001 ................................................15 3. Summary Indicators of Agricultural Support, 2001.....................................................24 4. MFN Tariff Peaks in Developed Country Markets on Agricultural Imports from Developing Countries, 1998–99 ............................................................................26 5. Costs of Agricultural Distortions, 1997 .......................................................................32 6. Exports of Textiles and Clothing, 2001 .......................................................................38 7. Export Tax Equivalents of MFA Quotas and Tariffs on Textile and Clothing Imports in Quad Countries, 1997...........................................................................39 8. Number of Quotas Eliminated by Integration in ATC Stages 1 and 2.........................41 9. Income and Export Revenue Losses Due to MFA Quotas and T&C Tariffs...............43 Text Boxes 1. Market Access at a Glance.............................................................................................9 2. Technical Standards and Barriers to Trade ..................................................................17 3. Uruguay Round Principal Commitments on Agriculture.............................................22 4. Barriers to Brazilian and Argentine Agricultural Exports ...........................................25 5. Main Features of the U.S. Farm Security and Rural Investment Act of 2002 .............29 6. The EU’s Common Agricultural Policy (CAP) Reform Proposals .............................30 7. The Agreement on Textiles and Clothing....................................................................40 8. Labor Standards and Cambodia’s Exports of Textiles and Clothing...........................46 Annex ......................................................................................................................................50 References................................................................................................................................52

- 3 -
List of Abbreviations
ACP African, Caribbean, and Pacific Countries AGOA African Growth and Opportunity Act (U.S.) AMS Aggregate Measure of Support ASEAN Association of South East Asian Nations ATC Agreement on Textiles and Clothing (Uruguay Round) AVEs Ad Valorem Tariff Equivalents CAP Common Agricultural Policy (EU) CDE Constant Difference in Elasticities CES Constant Elasticity of Substitution EBA Everything-but-Arms Initiative (EU) EC European Community EPAs Economic Partnership Agreements EU European Union GATT General Agreement on Tariffs and Trade GDP Gross Domestic Product GEP Global Economic Prospects GSP Generalized System of Preferences GTAP Global Trade Analysis Project LDCs Least Developed Countries MFA Multifiber Arrangement MFN Most-Favored-Nation MPS Market Price Support NAFTA North American Free Trade Agreement OECD Organization for Economic Cooperation and Development SAARC South Asian Association for Regional Cooperation SACU Southern African Customs Union SPS Sanitary and Phytosanitary (Standards/Regulations) T&C Textiles and Clothing TBT Technical Barriers to Trade TRQs Tariff Rate Quotas USDA United States Department of Agriculture USITC United States International Trade Commission WTO World Trade Organization

- 4 -
EXECUTIVE SUMMARY
The IMF and the World Bank—each within their respective areas of expertise—have a mandate and a role to play in supporting trade liberalization and an open international trading system. There are several avenues through which the Bank and the Fund contribute to these objectives, while cooperating closely with the WTO and other partners. First, by raising awareness of the benefits of free trade for all member countries, and of the costs imposed by market access restrictions. Second, through advice to and programs with member countries, aimed at helping create policy and institutional environments conducive, inter alia, to trade. And third, by providing technical assistance and promoting complementary reforms that allow countries to make the most of the trading opportunities open to them. The present joint paper, with its focus on market access for developing countries, is one element in this work program. In this paper, the Bank and the Fund have drawn together available research findings on the benefits of trade liberalization as well as on the obstacles to trade-oriented development. As regards the balance of the agenda, trade policy research in both institutions is, over the near term, guided by the challenges set out in the Doha Development Agenda. The country-level advisory and program work, especially in relation to social and poverty impact and the integration of trade into broader development and poverty reduction strategies, will be informed by ongoing reviews of trade policy advice conducted by the Fund and by the Bank’s operations evaluation department. Finally, both institutions participate actively in the Integrated Framework, an inter-institutional effort chaired by the WTO, which aims to strengthen trade-related, institutional capacity in least developed countries. Integration into global markets offers the potential for more rapid growth and poverty reduction. But market barriers to some key developing country exports have made it harder for them to take full advantage of this opportunity. This paper examines patterns of protection in merchandise trade, with a particular focus on market access in agriculture and on barriers to trade in textiles and clothing, and suggests ways of making the multilateral trading system more supportive of development. While the emphasis is on industrial country policies, the paper points out that trade regimes in developing countries often erect barriers against the same products, at a cost to themselves and to their trading partners. It should also be noted that liberalization of services, an issue not handled in this paper, may be of equal importance to developing countries as merchandise trade. Protection carries a high price in both industrial and developing countries. Estimates of the welfare gains from eliminating barriers to merchandise trade—in both industrial and developing countries—range from US$250 billion to US$620 billion annually, with about one-third to one-half accruing to developing countries. According to a World Bank analysis, more rapid growth associated with a global reduction in protection could reduce the number of people living in poverty by as much as 13 percent in 2015, and make a valuable

- 5 -
contribution to meeting the Millennium Development Goals. Significant as these estimated gains may be, it needs to be kept in mind that they represent orders of magnitude only and should be interpreted in light of the assumptions underlying these results. Pockets of protection remain in products of particular interest to developing countries. Between 6 percent and 14 percent of Quad (Canada, the EU, Japan, and the United States) tariff lines are subject to “tariff peaks.” In Canada and the United States, tariff peaks are concentrated in textiles and clothing; in the EU and Japan, in agriculture, food products and footwear. This pattern of protection creates hurdles for countries taking first steps up the technology ladder. The effect of these tariffs is aggravated by the subsidization of agriculture in OECD countries (which depresses world prices of commodities and increases their volatility), by remaining quotas in textiles and clothing trade, and by high barriers in inter-developing country trade. Agricultural markets are among the most heavily distorted. About three-quarters of the world’s poor still live in rural areas, mostly dependent on agriculture. On agricultural exports to the OECD they face tariffs that exceed those on typical inter-OECD exports (of all products) by factors of 10 or more. Including subsidies, OECD agriculture received support amounting to US$311 billion or 1.3 percent of GDP in 2001. Much of this support increases with the level of output, contributing to excess production that competes with developing country farmers for markets. While the need for reforms has been broadly recognized, recent policy signals have been mixed, with, for example, the new U.S. Farm Act representing a step back from reform. Agricultural liberalization in both industrial and developing countries is likely to have long-term, dynamic effects on developing country production and trade. Static gains alone would be on the order of US$30 billion in income and US$120 billion in exports per year. Increased investment and enhanced technologies could magnify the benefits of liberalization, but require a framework of supportive domestic policies and infrastructure (transport, logistics, credit, technical assistance). Textiles and clothing exports have been central to industrialization strategies, but barriers continue to be very high. Developing countries account for some 50 percent of world textile exports and 70 percent of world clothing exports. Several have developed a high dependence on these exports. Tariff barriers far exceed those on other manufactured products, in industrial and developing countries alike. Despite an international agreement to phase out quotas on textile and clothing trade, the vast majority is still in place. The backloading of quota removal by Canada, the EU, and the United States is set to cause sharp adjustment pressures at the end of the implementation period in early 2005, as quotas have protected less competitive suppliers in both industrial and developing countries. Protection often imposes disproportionate burdens on the poor. Protection has raised the prices of necessities in industrial countries, with a larger share in the consumption basket of

- 6 -
lower-income households, relative to other goods. In developing countries, barriers to exports of labor-intensive goods have slowed job-creation. It is estimated that industrial country restrictions on trade in textiles and clothing have prevented the creation of well over 20 million jobs in developing countries, many of which would represent a step out of rural poverty. A further concern is the growing frequency of trade remedy actions and the proliferation of technical barriers to trade. Antidumping measures have become far more common in recent years, with developing countries increasingly active. There is a risk that this trend might intensify as statutory protection declines. Furthermore, technical barriers (including health, safety, and product standards) have been accumulating at a fast pace, and many developing countries are ill-prepared to meet their complexity and cost. Most developing countries have preferential access to industrial country markets through GSP schemes, but the benefits are often limited. Preference margins are smaller for “sensitive” products—which are also the most protected. Utilization rates of GSP schemes tend to be low, partly due to restrictive rules of origin or social and environmental requirements. While still subject to conditions and residual uncertainty over their duration, recent initiatives to grant more generous access to least developed countries offer the prospect of additional benefits at a fairly low cost in terms of trade diversion. Improving market access for developing country exports requires a comprehensive approach to liberalization. The Doha Development Agenda contains important commitments but this initial effort needs to be sustained. Particular issues include: • The phasing out by all countries of tariff peaks (tariffs of 15 percent or higher) and
escalation (tariffs rising with the degree of processing of imports) is critical to the development dimension of the current round of multilateral trade negotiations, and could best be achieved through formula approaches that ensure deep across-the-board reductions.
• Disciplines on the application of trade remedy action should be strengthened—including through reviews of existing rules to deter their use as protectionist devices—and developing countries should receive more assistance to implement product and process standards.
• Schemes that provide unrestricted market access for all least developed countries should be extended by all large trading nations (with liberal rules of origin) but set within a framework of multilateral liberalization.
• In agriculture, meaningful liberalization must cover border protection and subsidies in industrial as well as developing countries. OECD countries should seek to de-link agricultural income support from production levels. Reforms of subsidy and tariff

- 7 -
regimes should proceed in parallel in order to soften the impact on net food importing countries.
• In textiles and clothing, the priority must be to accelerate the removal of quotas in order to avoid an adjustment shock in 2005 as a result of the phasing out of quotas under the Uruguay Round Agreement on Textiles and Clothing. The simultaneous reduction in import tariffs would help to mitigate adjustment pressures.
• Reform of market access in developing countries themselves would contribute as much to a development-oriented multilateral trading system as OECD policies. Apart from domestic efficiency gains and a reduction in remaining anti-export biases, developing countries are increasingly large markets for each other.
Like all reforms, these will have distributional effects which should be recognized and anticipated. Food security issues and the concerns of poor consumers, in particular, must be addressed as part of national poverty-reduction and development strategies. Trade policy is unlikely to be the most effective and appropriate instrument to pursue these objectives.

- 8 -
I. INTRODUCTION 1. World trade in products of export interest to developing countries remains heavily distorted. Market access barriers and trade-distorting subsidies imposed by industrial countries tend to be skewed toward labor-intensive manufactures and agricultural products. The trade policies of the developing countries themselves target many of the same products, adding substantially to the burden they face in increasing and diversifying their exports. The need for greater coherence between trade and development policies, including better market access for developing country exports, is a central focus of the Doha Development Agenda of the World Trade Organization (WTO).1
2. Since last year’s joint Bank-Fund paper on “Market Access for Developing Countries’ Exports” (SM/01/137, Revision 1, 8/23/01) the global economy, and with it world trade, have continued to perform poorly. Against this background, protectionist pressures have increased notably, including in steel and farm trade. More significant, however, there has been progress in launching a new round of multilateral trade negotiations. Perhaps reflecting the start of negotiations, changes in market access conditions have otherwise been limited.
3. This paper reviews the patterns of protection and considers policies that would support a development-oriented liberalization of the multilateral trading system. While other studies have underscored the importance of trade policy reform in developing countries,2 this paper focuses primarily on industrial country policies. The focus on industrial markets should not be taken to suggest that developing nations could not benefit equally from liberalizing their own markets. Indeed, both theory and practical experience indicate that trade restrictions impose the greatest costs on the country that erects them. However, arguably, the industrial countries carry a particular responsibility for the multilateral trading system. Liberalization initiatives by industrial countries would send a strong signal to developing countries about the importance and urgency of following up with their own reforms. Moreover, industrial countries have committed, at Doha and at the UN
1 The status of negotiations under the Doha Development Agenda is reviewed in a companion paper, “World Trade Organization--The Doha Development Agenda and Selected Activities of Interest to the Fund,” (SM/02/225, 7/15/02). The World Bank paper “Leverage Trade for Development: The World Bank Group’s Agenda” summarizes its activities in support of the Doha Development Agenda (SCM2002-0221).
2 See, for example, World Bank Global Economic Prospects 2002: Making Trade Work for the World’s Poor. Beyond this and other broad reviews, both the Fund and the Bank have analyzed domestic trade policies in developing countries extensively as part of their respective surveillance and programs in developing countries.
- 9 -
Financing for Development Conference in Monterrey, to helping ensure greater coherence between their trade policies and development assistance.
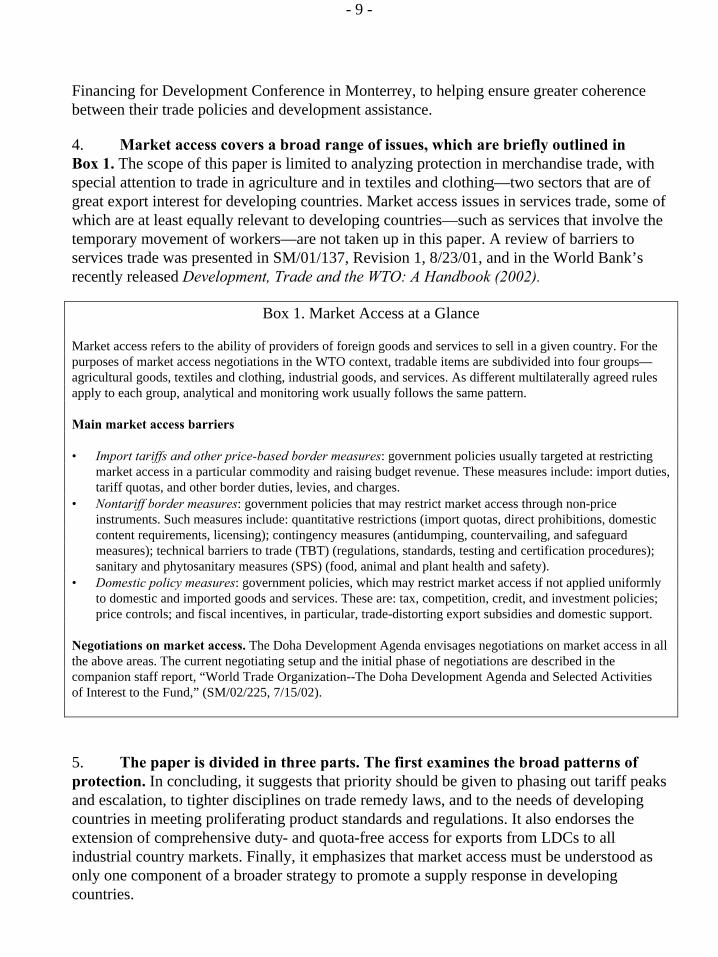
4. Market access covers a broad range of issues, which are briefly outlined in Box 1. The scope of this paper is limited to analyzing protection in merchandise trade, with special attention to trade in agriculture and in textiles and clothing—two sectors that are of great export interest for developing countries. Market access issues in services trade, some of which are at least equally relevant to developing countries—such as services that involve the temporary movement of workers—are not taken up in this paper. A review of barriers to services trade was presented in SM/01/137, Revision 1, 8/23/01, and in the World Bank’s recently released Development, Trade and the WTO: A Handbook (2002).
Box 1. Market Access at a Glance Market access refers to the ability of providers of foreign goods and services to sell in a given country. For the purposes of market access negotiations in the WTO context, tradable items are subdivided into four groups—agricultural goods, textiles and clothing, industrial goods, and services. As different multilaterally agreed rules apply to each group, analytical and monitoring work usually follows the same pattern. Main market access barriers • Import tariffs and other price-based border measures: government policies usually targeted at restricting
market access in a particular commodity and raising budget revenue. These measures include: import duties, tariff quotas, and other border duties, levies, and charges.
• Nontariff border measures: government policies that may restrict market access through non-price instruments. Such measures include: quantitative restrictions (import quotas, direct prohibitions, domestic content requirements, licensing); contingency measures (antidumping, countervailing, and safeguard measures); technical barriers to trade (TBT) (regulations, standards, testing and certification procedures); sanitary and phytosanitary measures (SPS) (food, animal and plant health and safety).
• Domestic policy measures: government policies, which may restrict market access if not applied uniformly to domestic and imported goods and services. These are: tax, competition, credit, and investment policies; price controls; and fiscal incentives, in particular, trade-distorting export subsidies and domestic support.
Negotiations on market access. The Doha Development Agenda envisages negotiations on market access in all the above areas. The current negotiating setup and the initial phase of negotiations are described in the companion staff report, “World Trade Organization--The Doha Development Agenda and Selected Activities of Interest to the Fund,” (SM/02/225, 7/15/02).
5. The paper is divided in three parts. The first examines the broad patterns of protection. In concluding, it suggests that priority should be given to phasing out tariff peaks and escalation, to tighter disciplines on trade remedy laws, and to the needs of developing countries in meeting proliferating product standards and regulations. It also endorses the extension of comprehensive duty- and quota-free access for exports from LDCs to all industrial country markets. Finally, it emphasizes that market access must be understood as only one component of a broader strategy to promote a supply response in developing countries.

- 10 -
6. The second part takes a closer look at agricultural trade. Recent agricultural policy initiatives in the OECD countries provide mixed signals about the prospects for reform. The paper presents the case for a comprehensive approach, covering border protection and subsidies, in industrial as well as developing countries. This argues for the de-coupling of domestic support from production. While liberalization has the potential to significantly raise incomes and exports, reform of agricultural trade may also have complex distributional implications, within and between countries.
7. The third part of the paper considers trade in textiles and clothing. As in the case of agriculture the efficiency gains from liberalization of trade in this sector would likely be significant for developing and industrial countries alike. At the same time though, the removal of quota restrictions—already agreed under the Uruguay Round and set to be completed by 2005—may cause shifts in competitiveness, and, at least in the near term, affect the balance of payments positions of those exporters whose market access is effectively protected by the current system. On balance, the paper concludes that priority should be accorded to accelerating the removal of quotas; the current backloading may turn what could otherwise be a gradual adjustment process into a shock at the end of the implementation period. It also concludes that general tariff reductions as well as the elimination of tariff peaks in this sector and the strengthening of preferential regimes would help to mitigate adjustment pressures.
II. MARKET ACCESS ISSUES AND POLICY IMPLICATIONS: OVERVIEW 8. In the context of the Doha Development Agenda, WTO members are committed to negotiations aimed at substantially improving market access for agricultural and industrial products, in particular for developing countries.3 This section examines the nature of current market access barriers and attempts to identify where the lowering of barriers is most likely to benefit developing countries. It focuses on border measures and on the broad patterns of protection. Measures of domestic support and the detailed effects of remaining quantitative restrictions are taken up in the context of those sectors where these measures are particularly prominent, namely agriculture and textiles and clothing, respectively.4
A. Patterns of Protection 9. Successive rounds of multilateral negotiations have lowered average levels of protection. Industrial countries have generally set applied tariff rates close to their tariff
3 Doha Ministerial Declaration, paragraphs 13 and 16 (WTO Document WT/MIN(01)/DE/W/1).
4 Where relevant, this section updates the analysis of SM/01/137, Revision 1, 8/23/01.

- 11 -
bindings, enhancing the predictability and transparency of market access regimes. 5 In contrast, most developing countries bind their tariffs at levels well above their applied rates so that they could in principle substantially increase their applied tariffs without infringing their WTO commitments. Applied tariff rates in 2001 varied considerably across country groupings. Despite the significant progress made in recent years, sub-Saharan African countries continue to have the highest simple average tariff protection (17.2 percent), followed by the Middle East and North Africa (16.8 percent). Among broad country groupings, it is notable that the average tariff of least developed countries (LDCs) (17.9 percent) is higher than that of other developing countries (14.0 percent) and well above that of industrial countries (5.2 percent).6
10. Averages of most-favored-nation (MFN) applied tariffs by importing country or region provide, however, an incomplete picture of protection. First, a number of barriers are not covered by the standard MFN databases, including specific tariffs (that is an absolute monetary value per unit of imports), tariff rate quotas, prohibitions, contingent protection,7 the costs of rules of origin, and environmental and technical standards. Second, the averages do not capture the impact of tariff dispersion, in particular tariff peaks and escalation.8 Third, because of preference schemes and differing export structures, the barriers faced by exporters to the same market can vary widely. And, finally, uncertainty over market access, related to contingent protection, interpretation of norms and procedures, and the discretionary nature of many preference schemes, may represent a further disincentive to exporters.
11. Developing countries generally face higher barriers to their exports than industrial countries. However, underlying that general result, there are large variations in market access conditions depending on the type of product and the particular exporter-importer combination. Table 1 presents combined ad valorem tariff equivalents (AVEs) of a
5 Tariff bindings are legally committed maximum tariff rates.
6 Simple averages of applied Most-Favored-Nation (MFN) tariffs (IMF Trade Policy Information Database).
7 Contingent protection refers to import barriers which, rather than being permanent, are introduced on a temporary and often selective basis in response to certain events (import surges, alleged unfair trading practices).
8 So-called international tariff peaks are defined as tariffs of 15 percent or higher. Escalation refers to tariffs rising with the degree of processing of imports, and the resultant high levels of effective protection.

- 12 -
Least Other Middle- AllDeveloped Low-Income Income Developing
Importers Countries Countries Countries Countries OECD
Canada 6.7 5.4 4.4 4.4 …
European Union 2.81
7.0 10.3 7.2 …
Japan 4.9 6.4 4.5 4.7 …
United States 13.61
6.2 3.6 4.5 …
Other OECD 8.7 13.1 10.4 10.2 …
Developing Countries … … … 7.5 …
Middle Income Countries 8.1 11.9 12.7 … …
Canada 3.4 18.7 16.3 17.5 33.7
European Union 7.61
13.4 24.8 20.0 41.6
Japan 29.1 16.3 21.2 21.9 28.3
United States 28.11
9.5 13.0 12.7 14.5
Other OECD 19.6 28.0 35.4 32.5 42.1
Developing Countries … … … 17.0 14.5
Middle Income Countries 18.2 18.4 23.1 … …
Canada 7.7 4.2 2.0 2.9 2.0
European Union 0.01
5.7 5.5 4.5 2.5
Japan 0.1 5.0 1.4 2.5 1.2
United States 8.01
5.9 2.1 3.6 1.6
Other OECD 5.0 10.8 5.7 7.4 7.4
Developing Countries … … … 6.4 6.9
Middle Income Countries 6.0 11.1 10.9 … …
2 The protection levels of importing countries in this table are weighted by the imports of the reference group this country belongs to, with the grouping criteria being GDP per capita. This is done to minimize the potential endogeneity bias of using national import weights (a high tariff can limit imports, and in the extreme could carry zero weight if its level is prohibitive).
(Total Trade)
Exporters
Table 1. Effective Ad-Valorem Tariff Equivalents on Bilateral Trade Flows1,2
1 The information in the table does not yet reflect the EU’s EBA initiative and the United States’ AGOA. Taking account of the former would reduce AVEs on EU agricultural imports from LDCs significantly, though not to zero (restrictions remain on sugar, rice and bananas for a transition period). AGOA would lower AVEs on both agricultural and manufactured imports into the United States for some African LDCs and low-income countries, but the extent of the reduction is hard to predict. Of 36 African countries that have qualified in principle for AGOA only 15 have met the technical conditions required to benefit from the preferences on certain exports; of these, around half are not LDCs. These data do, however, incorporate the effects of other preferential tariff schemes such as the Generalized System of Preferences (GSP), and the EU's ACP.
Trade in Manufactures
(Trade in Agriculture)
Source: International Trade Centre (ITC). For the methodology in calculating AVES, see Bouët and others (2001)

- 13 -
range of protective measures, while taking into account preferences and export structures.9 The results suggest that EU protection is heavily skewed against imports from middle-income developing countries, and U.S. protection against imports from LDCs. The geographical patterns of Canadian and Japanese protection are less marked, although the former’s protection pattern appears tilted against LDCs and the latter against other low-income countries. Levels of protection in other OECD markets, and in middle-income developing countries as a group tend to be well above those in the Quad. Given the potential for trade among the developing countries, now at 40 percent of their total exports, barriers to this trade are increasingly significant.
12. The evidence indicates that impediments to trade in agricultural products remain far greater than in manufacturing trade (Table 1). In the context of the Uruguay Round, quantitative restrictions and other nontariff measures (NTMs) were converted into tariffs. While improving transparency, the modalities of conversion have in many cases allowed an increase in effective protection. Specific tariffs and tariff-rate quotas (TRQs), which are most frequent in agricultural trade, account for a significant share of the AVEs.10 Ad valorem tariff equivalents of middle-income developing countries are broadly comparable with those of the Quad. Note that these AVEs cover neither domestic measures of support nor the effect of export subsidies (discussed in Section III).
13. As average industrial tariffs fell over successive trade rounds, pockets of protection have survived in products of particular interest to developing countries. Between 6 and 14 percent of Quad tariff lines are subject to tariff peaks, in some cases at rates well over 100 percent. Tariff peaks are also a prominent feature of tariff regimes in developing countries. Most preference schemes, moreover, offer little relief from tariff peaks
9 The Market Access Maps database has been developed recently by the International Trade Centre, Geneva, and offers broader coverage of restrictions and preference schemes than other sources. It incorporates the market access regimes of 137 countries, including preferential regimes, antidumping measures, and ad valorem equivalents of specific duties and tariff rate quotas (the current release does not yet incorporate recent preferential agreements, such as the EU’s “Everything-but-Arms” (EBA) initiative and the United States’ African Growth and Opportunity Act (AGOA), which would further reduce applied tariffs on imports from LDCs; see footnote to Table 1 for discussion). These data are combined with bilateral product-specific trade flows from the United Nations’ COMTRADE database. Information on tariff and other barriers refers to 2000, on trade flows to the most recent available year. For more information about this database and the methodology for calculating AVEs, see Bouët and others (2001).
10 For instance, the average rate of duty on agricultural imports into Quad markets from LDCs, excluding specific tariffs and effect of tariff-rate quotas, is 1.7 percent, see Bacchetta and Bora (2002).

- 14 -
(Hoekman and others, 2001). In Canada and the United States, tariff peaks are concentrated in textiles and clothing, and in the case of the EU and Japan, in agriculture, food products and footwear. Notably, estimates suggest that the capping of all peaks at the threshold of 15 percent would reduce AVEs in textiles and clothing by around 20 percent for imports from most source countries into the United States, and by 59 percent for imports from China. In agriculture and food products, they would decline by 40–60 percent on imports into the EU.11
14. The pattern of protection creates particular hurdles for countries taking the first steps up the technology ladder. Protection is relatively low for primary products, but increases sharply for low-technology, labor-intensive food processing and light industries, declines somewhat in the medium-technology range—such as automotive products—and is lowest at the upper end of the technology spectrum (Cernat and others, 2002). Since low-income country exports tend to be labor-intensive, the impact on their exports can be substantial: a recent study shows that revenue from duties collected by the United States on imports from Bangladesh is similar to that on imports from France, which are twelve times larger (Gresser, 2002). A similar pattern can be observed within processing chains, where tariff escalation remains a major concern. By reducing demand for more processed imports from developing countries, tariff escalation hampers the expansion of their processing industries and export diversification.
15. Protection is costly to both industrial and developing countries. Estimates of the static income gains from eliminating barriers to merchandise trade are substantial, ranging from US$250 billion to US$620 billion annually, of which around one-third to one-half would accrue to developing countries. A large share of the gains to industrialized countries would be due to the elimination of restrictions on trade in apparel and agriculture.12 Additional dynamic gains would stem from the supply response to the more favorable international trade regime (World Bank, 2002). Since much of the remaining protection is in agriculture, food products, and textiles and clothing, its impact is revisited in Sections III and IV.
11 Bouët and others (2001); this covers reduction in specific tariffs and out-of-quota tariffs.
12 The joint Bank-Fund paper (SM/01/137, Revision 1, 8/23/01) reported simulation results by Anderson and others (2000) of US$254 billion annually in income gains from full liberalization, of which US$108 billion would accrue to developing countries. Subsequently, the Bank’s GEP estimated the global gains from trade to be US$355 billion measured in 2015 income (2002, p. 171), which, adjusting for growth, is equivalent to US$265 billion and thus comparable to the earlier findings. The same Bank study included a dynamic estimate (with appropriate qualifications as to sensitivity to assumptions) that included a productivity response to trade opening, resulting in income gains by 2015 of US$832 billion.

- 15 -
B. Contingent Protection13 16. Statutory protection in the form of tariffs and quotas is aggravated by contingent protection. Among the trade remedies permitted under WTO rules, antidumping has become by far the most widely used, in both industrial and developing countries.14 Since 1995 over 1,800 antidumping investigations have been initiated (Table 2). While industrial countries have traditionally been the main users of such measures, developing countries have been more active in recent years, led by India, Argentina, Brazil, and South Africa. In the seven years to 2001, developing countries initiated almost two thirds of all investigations, well in excess of their share in world trade. However, developing countries have also been the target of nearly 60 percent of investigations, mostly initiated by other developing countries.
Initiating CountryIndustrial Countries
United States EU
Developing Countries
Transition Countries Total
Number of investigations 511 102 313 1,086 248 1,845 Industrial countries 128 17 67 363 114 605 Of which: United States 79 0 46 146 30 255 EU 15 6 0 165 66 246 Developing countries 379 85 242 718 131 1,228 Transition countries 4 0 4 5 3 12
Percent of investigations 28 6 17 59 13 100 Industrial countries 21 3 11 60 19 100 Of which: United States 31 0 18 57 12 100 EU 6 2 0 67 27 100 Developing countries 31 7 20 58 11 100 Transition countries 33 0 33 42 25 100Source: WTO Secretariat.
Table 2. Initiations of Antidumping Investigations, 1995-2001
Affected countries
17. The recent steep rise in antidumping investigations puts at risk the predictability and nondiscriminatory application of trade policies. Recent enforcement practices have
13 See footnote 7 for a definition.
14 Other trade remedy measures recognized by the WTO are countervailing duties and safeguard measures. The latter was most recently invoked to raise tariffs on U.S. steel imports, but is less frequently resorted to.

- 16 -
raised serious concerns about the influence of special interests on public policy, and may impose large costs on consumers and downstream industries in importing countries.15 Moreover, the deterrent effect of an investigation typically reaches well beyond the targeted exporter, and impedes incentives to pass on efficiency gains (Finger, 1993). The frequency of antidumping measures increases during, and may thus reinforce, economic downturns.16 Small firms and countries face greater uncertainty as they often lack the resources to challenge antidumping. Several reform proposals suggest that the introduction of competition law principles and of public interest clauses, giving affected importers and users legal standing to argue against protection, would reduce the protectionist bias of antidumping (Hoekman and Mavroidis, 1996).
C. Standards and Nontariff Barriers to Trade 18. Many developing countries are concerned that they are ill-prepared to meet increasingly complex and burdensome standards and regulations. Standards and regulations on products and production processes play an important role in facilitating trade by ensuring quality, safety and technical compatibility. However, there is often a risk that such regulations may be captured by special interests, particularly when regulatory processes are not transparent. Conditions might then be imposed that are tighter than needed to achieve the safety and health objectives in order to serve a protectionist purpose.
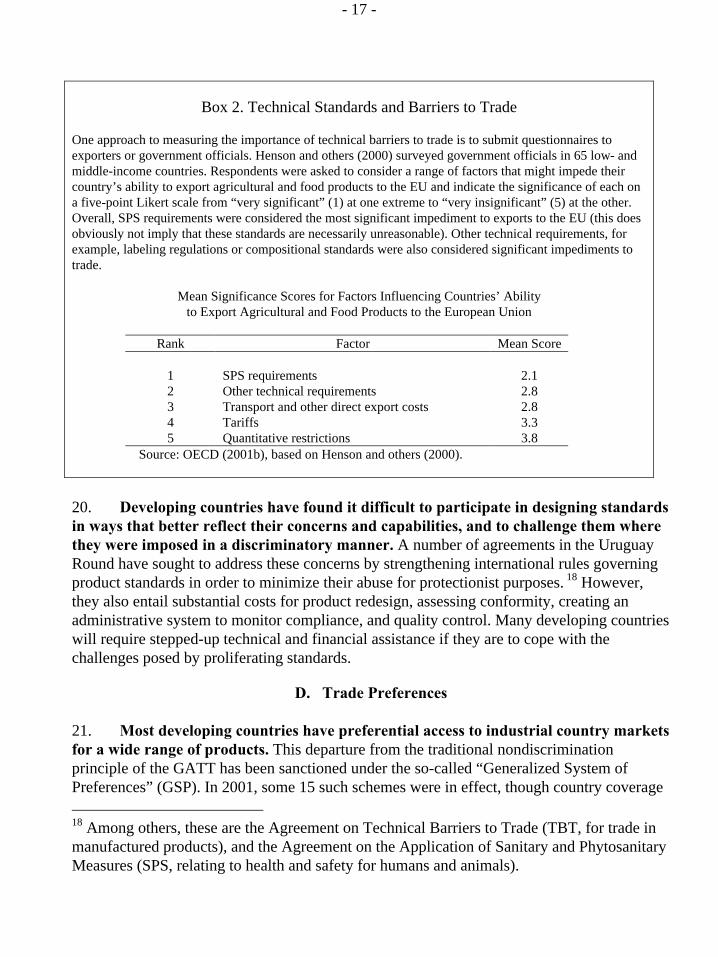
19. Technical barriers have become a key concern regarding market access. Annual notifications of new technical barriers (including health and safety standards, and product standards) to GATT/WTO increased steadily from a dozen or two in the early 1980s to over 400 in 1999. Low- and middle-income countries reported that over the period from 1996–99 more than 50 percent of their potential exports of fresh and processed fish, meat, fruit and vegetables into the EU were “prevented” by their inability to comply with SPS requirements (OECD, 2001b). SPS and other technical requirements have been viewed by developing country trade officials as a greater constraint on their ability to export than tariffs and quantitative restrictions (Box 2).17
15 Note that, in 2000, 77 percent of Indian antidumping investigations involved chemicals products, and 80 percent of U.S. antidumping investigations involved steel products. In both sectors, antidumping action is particularly prevalent at the low end of the technology spectrum.
16 Knetter and Prusa (2000) relate the incidence of antidumping action to business cycles.
17 See also Otsuki, Wilson, and Sewadeh (2001) on the impact of EU aflatoxin standards on African exports of nuts, cereals and dried fruits.
- 17 -
Box 2. Technical Standards and Barriers to Trade
One approach to measuring the importance of technical barriers to trade is to submit questionnaires to exporters or government officials. Henson and others (2000) surveyed government officials in 65 low- and middle-income countries. Respondents were asked to consider a range of factors that might impede their country’s ability to export agricultural and food products to the EU and indicate the significance of each on a five-point Likert scale from “very significant” (1) at one extreme to “very insignificant” (5) at the other. Overall, SPS requirements were considered the most significant impediment to exports to the EU (this does obviously not imply that these standards are necessarily unreasonable). Other technical requirements, for example, labeling regulations or compositional standards were also considered significant impediments to trade.
Mean Significance Scores for Factors Influencing Countries’ Ability to Export Agricultural and Food Products to the European Union
Rank Factor Mean Score
1
SPS requirements
2.1
2 Other technical requirements 2.8 3 Transport and other direct export costs 2.8 4 Tariffs 3.3 5 Quantitative restrictions 3.8
Source: OECD (2001b), based on Henson and others (2000). 20. Developing countries have found it difficult to participate in designing standards in ways that better reflect their concerns and capabilities, and to challenge them where they were imposed in a discriminatory manner. A number of agreements in the Uruguay Round have sought to address these concerns by strengthening international rules governing product standards in order to minimize their abuse for protectionist purposes. 18 However, they also entail substantial costs for product redesign, assessing conformity, creating an administrative system to monitor compliance, and quality control. Many developing countries will require stepped-up technical and financial assistance if they are to cope with the challenges posed by proliferating standards.
D. Trade Preferences 21. Most developing countries have preferential access to industrial country markets for a wide range of products. This departure from the traditional nondiscrimination principle of the GATT has been sanctioned under the so-called “Generalized System of Preferences” (GSP). In 2001, some 15 such schemes were in effect, though country coverage 18 Among others, these are the Agreement on Technical Barriers to Trade (TBT, for trade in manufactured products), and the Agreement on the Application of Sanitary and Phytosanitary Measures (SPS, relating to health and safety for humans and animals).

- 18 -
and preference margins over applied MFN tariffs varied widely. An important recent development has been the proliferation of bilateral and regional free trade agreements between industrial and developing countries. 19 According to WTO rules, such agreements have to cover substantially all trade, unlike GSP schemes. However, some of the problems of preferential schemes reviewed below—in particular the drawbacks related to rules of origin—apply in equal measure.
22. Irrespective of their broader merits or shortcomings within the multilateral trading system, the benefits of many GSP schemes for their beneficiaries have been limited. Typically, preference margins are smaller for products that the importing country deems to be sensitive—which are also among the most protected. Moreover, as a large number of countries with often similar export structures tend to benefit from these and other schemes, the competitive advantage they convey is reduced.20 In addition, country- and product-specific graduation mechanisms may make exports ineligible for GSP treatment, and hence detract from incentives to invest in anticipation of continued benefits.21 In this context, there is evidence to suggest that the availability of unreciprocated market access preferences has undermined the incentives of benefiting countries to engage in trade liberalization, thus at times perpetuating anti-export biases in their trade regimes (Ozden and Reinhardt, 2002).
23. Preferential trade regimes invariably bring with them the monitoring of rules of origin to avoid transshipment. This appears to have reduced the benefits expected from such schemes. Rules of origin are akin to local content requirements (Krishna and Krueger, 1995). Costs arise both from exporters seeking to benefit from preferences by procuring inputs from less efficient sources (trade diversion), and from the administration of, and accounting for, origin. Under NAFTA, clothing imports into the United States market are subject to the “triple transformation rule,” according to which sourcing at all stages of prior transformation (yarn, fabric, cutting/assembly) must obey value added thresholds. In the case of the EU, a recent study found that, partly as a result of unattractive rules of origin, only one-
19 Preferential access for developing country exports on a reciprocal basis (pertaining to GATT Article XXIV) is a vast topic in its own right and cannot be dealt with here. SM/01/137, Revision 1, 8/23/01, discusses some of the issues involved.
20 In fact, under the EU trade regime only 9 countries are subject to regular MFN treatment, although these account for over 40 percent of EU imports. In addition, relatively few countries are subject to the EU’s general GSP (many of these are in the Commonwealth of Independent States (CIS)), while many more are beneficiaries of preferential agreements or free trade schemes.
21 For instance, in 1999 the EU withdrew some of the preferences for shrimp imports from Thailand, contributing to the drop in Thailand’s market share from 11–12 percent in the mid-1990s to less than 5 percent in January–October 2001 (see “Comext” database).

- 19 -
third of imports that were eligible for preferential treatment did in fact enter the EU market with reduced duties. This problem is particularly acute for textiles and clothing. In the case of Albanian exports, for instance, 84 percent of exports to the EU were eligible for preferential treatment, but only 2 percent actually requested or were granted such preferences (Brenton and Manchin, 2002). Cumulation of origin across beneficiary countries can mitigate the burden of rules of origin, though often at the expense of greater administrative complexity.22
24. Market access under GSP schemes has recently been enhanced on a regional basis, in particular for African countries. To date, 36 sub-Saharan African countries have qualified in principle for preferential access under the United States’ AGOA, adopted in 2000. Margins of preference are substantial for textile and apparel products as well as for a range of other light manufactures and food products. In order to benefit from this scheme, countries have to meet, in addition to relatively tight rules of origin and standard GSP criteria, requirements relating to child labor and the protection of internationally recognized workers’ rights. The administrative requirement involved in documenting eligibility may explain why only 15 countries had availed themselves of benefits under this scheme in the year to March 2002, with most of the benefits accruing to four countries—Gabon, Lesotho, Nigeria, and South Africa—and with fuel accounting for 85 percent of AGOA imports.23 Nevertheless, since initiation of the scheme, sub-Saharan African exporters have increased their U.S. market share in textiles and clothing from approximately 1 percent in 2000 to 1.6 percent in mid-2001 (in value terms). Conservative estimates suggest that by 2008 the volume of African exports to the U.S. market may rise by an additional 6-7 percent (Mattoo and others, 2002). However, effective preference margins will decline as quotas under the WTO Agreement on Textiles and Clothing are phased out (see Section IV).
25. A number of industrialized countries have recently granted comprehensive tariff and quota free access to LDCs. The EU’s EBA initiative has extended such preferential access since coming into effect in March 2001. It covers all products, except for sugar, bananas, and rice, which are to be liberalized more gradually.24 Unlike the EU’s GSP scheme, benefits under the EBA are extended on an indefinite basis, subject however to broad safeguards.25 At the G-8 Summit in Kananaskis, the Canadian government announced that
22 Thus, the EU’s EBA initiative allows cumulation, subject to certain limits, between LDCs, ASEAN, SAARC, and EU countries.
23 USITC website.
24 Following a phased reduction in tariffs and increase in quotas, bananas are to be fully liberalized by 2006, and sugar and rice by 2009.
25 The EU Commission has recently been given the mandate to negotiate broader Economic Partnership Agreements (EPAs) with African, Caribbean and Pacific (ACP) countries, as a successor to the Cotonou Agreement which expires in 2008. One feature of the EPAs would
(continued…)

- 20 -
duty- and quota-free access would be extended to imports from LDCs effective January 2003, with the exception of certain supply-managed agricultural products (dairy, poultry and eggs). Schemes providing for virtually unqualified duty- and quota-free access for LDCs have also been adopted by New Zealand, Norway, and Switzerland. Results of the EBA initiative are not yet available, but earlier experience in the EU has shown that broad-based tariff-free market access for LDCs can assist in diversifying their export structures (Bacchetta and Bora, 2002). Recent research suggests that under such schemes, if adopted by all Quad markets, LDC exports to the Quad might increase by US$2.5 billion, or about 11 percent, with relatively limited cost in terms of trade diversion.
E. Policy Implications 26. The phasing out of tariff peaks and escalation is a critical element of the development dimension of the current round of multilateral trade negotiations. Tariff peaks and escalation bias protection in both industrialized and developing countries against agricultural, labor-intensive, and low technology products. This holds back export-led growth and greater diversification in developing countries and the poverty reduction that is associated with increased demand for unskilled labor. A formula-based approach seems likely to be the best way to ensure a compression of tariff schedules across tariff lines.26 Experience has shown that formulas are less vulnerable to the influence of vested interests than the tariff line-item (“request-offer”) negotiations. At the same time, developing countries should be far more ambitious in binding tariffs at levels close to applied rates, in order to reduce uncertainty and reap the full benefits of liberalization.
27. Disciplines on the application of contingent protection should be strengthened. This would require the full participation of all the main users. One approach would be for procedural rules to give greater weight to consumer concerns in considering trade remedy action. Short of that, the rules could be reviewed with a focus on methodological weaknesses, the potential for abuse, possibilities for raising the triggers or making them more rigorous (e.g., higher de minimis margins, sunset clauses, etc.), and the administrative costs associated with antidumping and countervailing duty actions. Current rules allow national authorities a wide margin of discretion. A related risk is the possibly protectionist application of health and technical standards, which calls for careful monitoring and greater assistance to
be reciprocal free trade agreements, among sub-groups of beneficiary countries and between such regions and the EU. Given the overlap between ACP countries and EBA beneficiaries, the administration of the schemes would be extremely complex unless either ACP countries are granted EBA conditions, or EBA countries renounce certain market access privileges on the EU market.
26 Different formulas have been proposed by negotiating parties, generally entailing more than proportional reductions in higher tariffs or a capping of maximum tariffs.

- 21 -
developing countries, both to enable their full participation in negotiations and in meeting standards.
28. Adoption by all industrial countries of schemes that provide unrestricted market access for LDCs could have significant benefits without imposing undue costs on other suppliers, given the very small share of LDCs in world trade (around 0.5 percent). However, trade preferences can also have drawbacks. Apart from the economic inefficiencies, they risk creating vested interests in the status quo, and should therefore be set firmly within a context of rapid multilateral liberalization.
29. Improved market access for LDC exports will not be sufficient to engender a sustained growth performance, but should form part of a broader strategy to promote a vigorous supply response. Inefficiencies in key infrastructure sectors like telecommunications, transport, and financial services often add more to export costs than foreign trade barriers (World Bank, 2002). Protection in developing countries makes production for the home market more attractive. Further reform of developing countries’ trade and investment environments and progress on transparency and governance in the administration of foreign trade will often be necessary complements to better market access. This includes reducing the average level and dispersion of protection, maintaining an appropriate exchange rate regime, and liberalizing the policies towards foreign direct investment and key services sectors. The sequencing of policies often matters greatly; for instance, in a number of countries reductions in trade tariffs will need to be combined with a rebalancing of fiscal revenue sources.
III. MARKET ACCESS ISSUES IN AGRICULTURE 30. Increased market access for agricultural products would work to directly address poverty reduction in developing countries. While the rapid expansion of demand for unskilled labor in manufacturing and urban services in many developing countries has sharply reduced rural poverty, about three-quarters of the world’s poor still live in rural areas, where agriculture is often the dominant economic activity (IFAD, 2001). Agriculture accounts for about 27 percent of GDP in developing countries, a similar share of exports and 50 percent of employment. This dependency on agriculture is most pronounced in LDCs and in sub-Saharan Africa, where, in addition, production tends to be concentrated in only a small number of commodities.
A. Agriculture in the Multilateral Trading System 31. Agriculture has traditionally been heavily shielded from import competition. It was not until the conclusion of the Uruguay Round in 1994 that the sector was brought under effective GATT disciplines. The Uruguay Round sparked the beginning of a gradual liberalization process in agriculture—initially over six years for industrial countries and ten years for developing countries. WTO members also made a commitment to engage in negotiations to continue the reform process in the final year of the six-year implementation

- 22 -
period—part of the so-called “Built-In Agenda”. The key aspects of market opening entailed a move away from quantitative restrictions, a binding of maximum tariff rates, and the reduction of domestic support and export subsidies (Box 3).
Box 3. Uruguay Round: Principal Commitments on Agriculture
Market access
Tariffication and bindings: Nontariff measures to be converted to bound tariffs at the start of the implementation period with average tariff cuts by industrial countries of 36 percent over six years from a 1986-88 base, and a minimum cut of 15 percent on any tariff line. Minimum import access: Tariff rate quotas were introduced to guarantee minimum market access by the end of the implementation period.
Internal support
Domestic support, as measured by the total Aggregate Measurement of Support (AMS), to be reduced by 20 percent from a 1986-88 base over the implementation period. Exempt are domestic supports of less than 5 percent, “green box” subsidies allowed for purposes such as development and technical progress, and “blue box” subsidies linked to output reduction schemes.
Export subsidies
Export subsidies to be reduced by 36 percent in value and subsidized exports by 21 percent in volume for each product over the implementation period from a 1986-90 base.
Special safeguard
Special safeguard provisions, triggered by volume increases or price reductions, permit the imposition of additional duties up to specified limits.
Developing countries
Greater flexibility was given to developing countries in their commitments to market access, reductions in domestic and export subsidies (generally 2/3 of developed country commitments and a longer implementation period of 10 years).
Peace Clause
Among other provisions, for subsidies excluded from the reduction commitments, the measures will be considered non-actionable in terms of countervailing duties and legal challenges in the WTO until the end of 2003.
32. One of the greatest challenges for the new trade round is to meet development concerns in agricultural trade. Despite the achievements of the Uruguay Round, there has been only limited liberalization thus far, including for products of export interest to developing countries. Reasons include the choice of a reference period with exceptionally high levels of protection (1986–88) as the basis for the initial tariffication, the broadness of product categories for which levels of support were bound (allowing increases for some products), and “dirty tariffication.”27 By some estimates, this last practice may have raised the average levels of protection at the conclusion of the Uruguay Round in 1994 (Nogues, 2002). In recognizing the problem of distortions in agricultural markets, trade ministers committed in Doha, “without prejudicing the outcome of the negotiations,” to negotiations aimed at
27 “Dirty tariffication” refers to the practice of inflating the gap between domestic and international prices, thereby increasing the tariff-equivalent calculation. This practice was particularly common for politically sensitive commodities (Hathaway and Ingco, 1996).

- 23 -
“substantial improvements in market access; reductions of, with a view to phasing out, all forms of export subsidies; and substantial reductions in trade-distorting domestic support.”
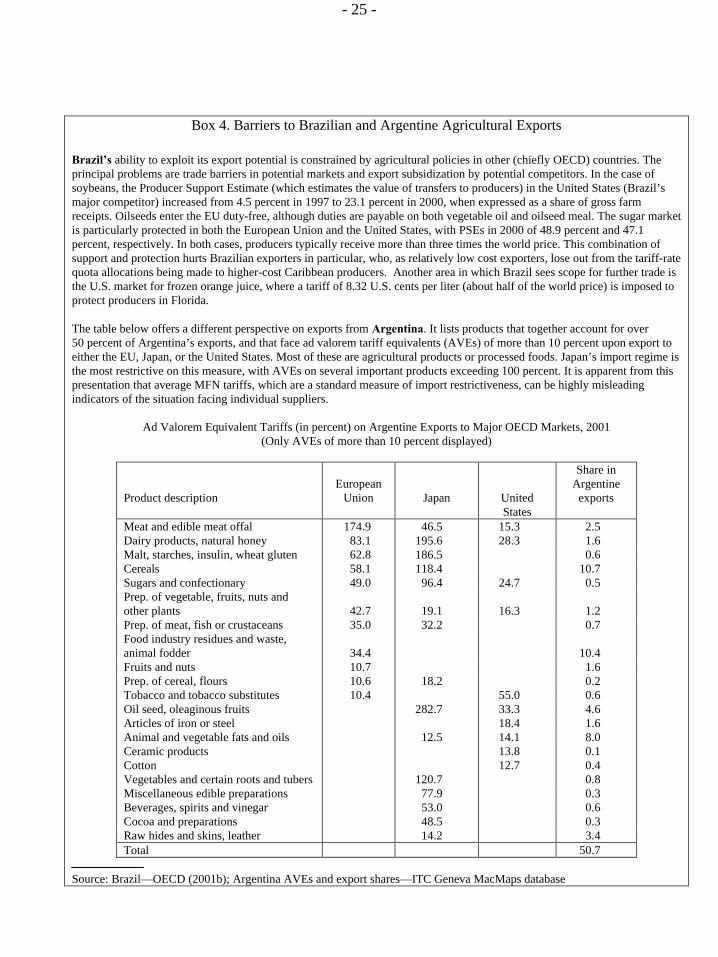
B. Market Access, Agricultural Support, and Policy Trends in OECD Countries 33. OECD agriculture remains heavily protected and receives substantial public sector support. Several indicators point to the extent of support in OECD countries (Table 3). Total OECD support for agriculture amounted to US$311 billion or 1.3 percent of GDP in 2001, with producer support estimated at almost one-third of total farm receipts.28 Prices received by OECD farmers were on average 31 percent above world prices (measured at border). The absolute level of producer support was largest by far in the EU, although, as a share of farm receipts, support levels in Iceland, Japan, Korea, Norway, and Switzerland were substantially higher. A large share of support is directed at temperate zone agriculture (grains, oilseeds, dairy), but support for products of interest to tropical suppliers is often particularly high as a share of producer receipts (sugar, rice, cotton, and tobacco). Box 4 describes the obstacles facing exports from Argentina and Brazil to the EU, Japanese, and U.S. markets for both temperate zone and tropical products. Other countries with agricultural potential, for instance in the Commonwealth of Independent States, face similar hurdles.
34. Border measures (import tariffs and export subsidies) are the main mechanism of market price support (MPS). In 2001, 68 percent of agricultural production in OECD countries received MPS. The total value of MPS amounted to US$145 billion, or 63 percent of aggregate producer support (OECD, 2002a). Direct export subsidies have, however, been reduced significantly over recent years, in line with Uruguay Round commitments.29 That said, other forms of export support may also distort trade, including export credit on favorable terms, certain forms of food aid, and state trading companies.30
28 OECD (2002a).
29 The main user in 1999—the last period for which notifications are available—was the EU, with US$6 billion, or around 95 percent of the total reported (OECD, 2002).
30 Anecdotal evidence of the negative impact of export subsidies abounds. For instance, the Tanzanian “Tanga Dairy Development Program” supported by Dutch Development Cooperation for over 20 years (€200,000 per year) was reported to be seriously affected by competition from low-priced powdered milk products from the EU (€600,000 in export subsidies).

- 24 -
Table 3. Summary Indicators of Agricultural Support, 2001
Country
PSE (in millions of
US$)
Percentage
PSE
NPC
NAC Australia 827 4 1.00 1.04 Canada 3,928 17 1.11 1.21 Czech Republic 585 17 1.06 1.20 European Union 93,083 35 1.33 1.54 Hungary 580 12 1.01 1.13 Iceland 108 59 2.11 2.45 Japan 47,242 59 2.36 2.46 Korea 16,838 64 2.64 2.76 Mexico 6,537 19 1.17 1.23 New Zealand 52 1 1.00 1.01 Norway 2,173 67 2.27 3.00 Poland 1,447 10 1.07 1.11 Slovak Republic 151 11 1.01 1.12 Switzerland 4,214 69 2.39 3.21 Turkey 3,978 15 1.15 1.18 United States 49,001 21 1.15 1.27 OECD 230,744 31 1.31 1.45
Source: OECD (2001). PSE: Producer Support Estimate: an indicator of the annual monetary value of gross transfers from consumers and taxpayers to support agricultural producers. The percentage PSE is the ratio of the PSE to the value of total gross farm receipts. NPC: Nominal Protection Coefficient: an indicator of the nominal rate of protection for producers measuring the ratio between the average price received by producers and the border price. NAC: Nominal Assistance Coefficient: An indicator of the nominal rate of assistance to producers measuring the ratio between the values of gross farm receipts including support and gross farm receipts valued at world market prices without support.
35. The direct costs of market price support fall disproportionately on low-income consumers who spend a larger share of household expenditure on food, while the benefits accrue primarily to larger farmers. These measures are also less efficient in transferring income to farmers or targeting the provision of environmental services, compared with other measures, such as direct income supports or area payments (OECD, 2001b). In general, the evidence indicates that all types of farm support have a low transfer margin, less than two-thirds and in some cases as little as one-quarter of payments on support programs result in additional farm income (OECD, 1995).
- 25 -
Box 4. Barriers to Brazilian and Argentine Agricultural Exports Brazil’s ability to exploit its export potential is constrained by agricultural policies in other (chiefly OECD) countries. The principal problems are trade barriers in potential markets and export subsidization by potential competitors. In the case of soybeans, the Producer Support Estimate (which estimates the value of transfers to producers) in the United States (Brazil’s major competitor) increased from 4.5 percent in 1997 to 23.1 percent in 2000, when expressed as a share of gross farm receipts. Oilseeds enter the EU duty-free, although duties are payable on both vegetable oil and oilseed meal. The sugar market is particularly protected in both the European Union and the United States, with PSEs in 2000 of 48.9 percent and 47.1 percent, respectively. In both cases, producers typically receive more than three times the world price. This combination of support and protection hurts Brazilian exporters in particular, who, as relatively low cost exporters, lose out from the tariff-rate quota allocations being made to higher-cost Caribbean producers. Another area in which Brazil sees scope for further trade is the U.S. market for frozen orange juice, where a tariff of 8.32 U.S. cents per liter (about half of the world price) is imposed to protect producers in Florida. The table below offers a different perspective on exports from Argentina. It lists products that together account for over 50 percent of Argentina’s exports, and that face ad valorem tariff equivalents (AVEs) of more than 10 percent upon export to either the EU, Japan, or the United States. Most of these are agricultural products or processed foods. Japan’s import regime is the most restrictive on this measure, with AVEs on several important products exceeding 100 percent. It is apparent from this presentation that average MFN tariffs, which are a standard measure of import restrictiveness, can be highly misleading indicators of the situation facing individual suppliers.
Ad Valorem Equivalent Tariffs (in percent) on Argentine Exports to Major OECD Markets, 2001 (Only AVEs of more than 10 percent displayed)
Product description
European
Union
Japan
United States
Share in Argentine
exports
Meat and edible meat offal 174.9 46.5 15.3 2.5 Dairy products, natural honey 83.1 195.6 28.3 1.6 Malt, starches, insulin, wheat gluten 62.8 186.5 0.6 Cereals 58.1 118.4 10.7 Sugars and confectionary 49.0 96.4 24.7 0.5 Prep. of vegetable, fruits, nuts and other plants
42.7
19.1
16.3
1.2
Prep. of meat, fish or crustaceans 35.0 32.2 0.7 Food industry residues and waste, animal fodder
34.4
10.4
Fruits and nuts 10.7 1.6 Prep. of cereal, flours 10.6 18.2 0.2 Tobacco and tobacco substitutes 10.4 55.0 0.6 Oil seed, oleaginous fruits 282.7 33.3 4.6 Articles of iron or steel 18.4 1.6 Animal and vegetable fats and oils 12.5 14.1 8.0 Ceramic products 13.8 0.1 Cotton 12.7 0.4 Vegetables and certain roots and tubers 120.7 0.8 Miscellaneous edible preparations 77.9 0.3 Beverages, spirits and vinegar 53.0 0.6 Cocoa and preparations 48.5 0.3 Raw hides and skins, leather 14.2 3.4 Total 50.7
Source: Brazil—OECD (2001b); Argentina AVEs and export shares—ITC Geneva MacMaps database

- 26 -
36. Despite reductions under the Uruguay Round, agricultural tariffs in OECD countries remain several times higher than those facing manufactured imports. Preferential market access schemes result in a lower level of tariffs for exports from low-income developing countries (Table 1), but other developing countries continue to face high tariffs. These average tariff levels also conceal significant variations among OECD countries. EU and Canadian tariffs, for example, favor LDCs but are comparatively high for middle-income countries. Japanese and U.S. tariffs, on the other hand, are particularly significant with respect to imports from LDCs.31 Agriculture and food industries are also major targets of tariff peaks and escalation. Table 4 shows the product pattern of protection and the prevalence of tariff peaks, most notably for dairy products, chocolate, tobacco, oilseeds and poultry.
Table 4. MFN Tariff Peaks in Developed Country Markets on
Agricultural Imports from Developing Countries, 1998–99 (In percent)
Weighted Tariff peaks Product
MFN average Tariff
Maximum MFN tariff
(percent of category)
Beef 12.9 41.5 29.6 Sheep meat 0.8 21.5 3.5 Poultry 8.2 134.3 2.5 Milk 22.7 140.0 17.8 Milk concentrates 19.6 308.5 22.2 Butter 250.0 336.3 19.5 Barley 22.1 101.5 11.4 Maize 4.0 50.0 4.0 Wheat 39.5 81.5 9.8 Banana 4.3 27.9 13.6 Citrus fruits 4.6 25.7 8.5 Other tropical fruits 10.7 33.3 8.1 Non-tropical fruits 0.8 17.8 2.9 Chocolate 22.7 276.5 14.3 Tobacco 44.9 350.0 6.3 Cigarettes 2.7 30.0 4.2 Other tobacco Products
168.6
350.0
17.7
Tea 3.8 17.8 11.1 Oil seeds 9.6 171.0 1.0 Vegetable oils 1.4 20.0 1.2 Source: UNCTAD elaborations on UNCTAD TRAINS data. Ad valorem tariffs only.
31 See footnote to Table 1 regarding U.S. tariffs on imports from LDCs.

- 27 -
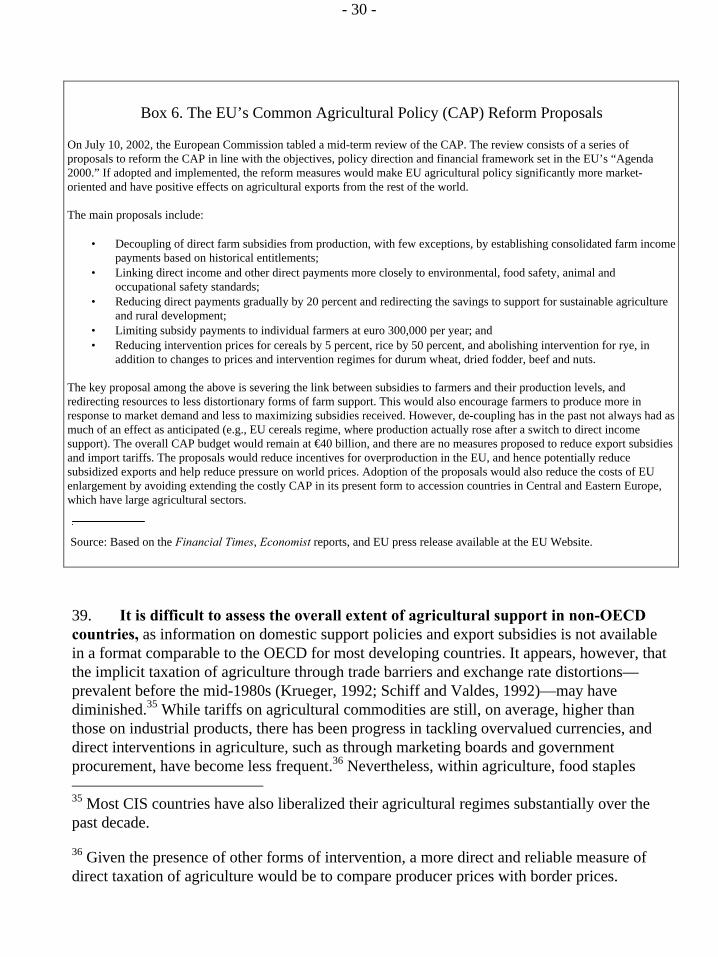
37. Policy signals with regard to reform of agricultural support have been mixed. After the mid-1980s, there was movement towards greater market orientation and lower support and protection for OECD agriculture. This is demonstrated in Figure 1, which displays total producer support on the horizontal axis and the share of the most distortionary forms of support, MPS, on the vertical; the closer a point is to the origin of the chart, the less the distortionary effect of producer support. Producer support as a share of agricultural revenue was at its lowest in 1997.32 Subsequently, support to agricultural producers increased as world prices of major commodities fell, while differences in the level of support among countries widened. In May 2002, the United States introduced a new farm bill, which will significantly boost agricultural subsidies compared with their declining levels under the 1996 Farm Bill—though not if additional emergency assistance of recent years is taken into account—and redirect them towards more distortionary forms of support (Box 5).33 However, negotiating proposals to the WTO put forward by the United States in July 2002 would sharply reduce support levels, including significant reductions in tariffs. In the EU, the newly unveiled mid-term review of the Common Agricultural Policy (CAP) proposes to delink farm subsidies from production, a move that would help to reduce overproduction and hence pressure on world prices (Box 6).34 However, the EU Commission’s reform proposals are silent on import tariffs and export subsidies, and do not envisage a reduction in the overall level of budgetary support. Certain other OECD countries have established multi-year plans for the agricultural sector, but none of these plans propose long-term reductions in support measures. The recent Japanese program sets the goal of a higher food self-sufficiency target of 45 percent by 2010, well above its current level of 30 percent. In a few OECD countries, new price support policies were introduced or existing ones extended to new products in 2000-01.
32 OECD (1999).
33 U.S. support was at its lowest in the mid-1990s, at about 14 percent of farm income. It subsequently rose to 21 percent in 2001 under emergency legislation. It should be noted, however, that producer support as a share of farm income in the United States is still lower than in many other OECD countries (see OECD, 1996).
34 The mid-term review must still be adopted by the European Council, where aspects of the proposals face considerable opposition.

- 28 -
65
70
75
80
85
90
95
100
10 20 30 40 50 60 70
Percentage Producer Support Estimate (PSE)
Shar
e of
MPS
and
pay
men
ts b
ased
on
outp
ut a
nd in
put u
se in
the
PSE
United States
Canada
Japan
European Union
Source: OECD.
1986-1988
1999-2001
Figure 1. Quad Countries: Trends in Trade-Distorting Agricultural Supports, 1986-1988 to 1999-2001
C. Agricultural Trade Policy in Non-OECD Countries 38. Agricultural subsidies in non-OECD countries are generally limited compared with those in the OECD, while applied tariff levels are similar on average. However, with non-OECD tariff bindings tending to be well above applied rates, applied rates in agriculture have occasionally been subject to ad hoc adjustments. In India, Pakistan and Tunisia, for example, bound rates for all agricultural products are over 100 percent, while applied rates range between 30 percent and 43 percent (Gibson and others, 2001). Most recently, tariffs on sugar have been increased in Indonesia, and on a range of products in Jamaica (in several cases to levels of well over 100 percent). As a result, there can be significant uncertainty over market access. High tariffs and other forms of support in non-OECD countries impede South-South trade, and, like OECD protection, can depress world prices for agricultural commodities, and introduce a greater degree of price instability than might otherwise have been the case.

- 29 -
Box 5. Main Features of the U.S. Farm Security and Rural Investment Act of 2002 In May 2002 President Bush signed the Farm Security and Rural Investment Act of 2002. The six-year Act will lock in historically high levels of agricultural support provided in recent years as a result of “emergency assistance,” and is estimated to increase support spending by a projected US$45 billion or 21 percent during FY2002–07, compared with previous forecasts based on the 1996 Farm Act (although not if previous supplemental budgets are included in the baseline). Much of the new spending aims to raise farm incomes in ways that, while not always tied to current production, may create incentives to increase production or acreage levels. As a result, it undermines the objectives of the 1996 reforms that sought to gradually reduce production-distorting supports in favor of income supplements. The Act’s spending estimates could be overshot if the underlying price forecasts do not materialize and if minimum prices are not lowered as scheduled. The subsidy estimates are subject to upside risks, especially as they are likely to raise production levels, in part through assuring greater predictability of assistance to farmers, and contribute to further price declines in world markets. The main beneficiaries are producers of corn, sorghum, barley, wheat, soybeans, oilseeds, cotton, and rice. The Act also extends supports to a broad range of products, some of which had not previously benefited from assistance (e.g., vegetables, honey, and wool) and includes subsidies for the food stamp program aimed at the urban poor. The Act requires that the Secretary of Agriculture adjust spending if U.S. subsidies exceed WTO commitments. Under the Uruguay Round Agreement, the United States agreed to limit certain trade distorting agricultural supports to US$19 billion per year. For comparison, the EU limit is US$60 billion, though actual support has recently been well below this ceiling. However, countries typically notify their support several years after the fact. The last U.S. notification to the WTO, made in 2001, covered spending in 1998. Results from Fund staff simulation of the projected impact of increases in U.S. farm assistance after 1996 on export volumes in the period 2003-07 suggest that U.S. exports of grains and cotton will be significantly larger than in the absence of such support, while sub-Saharan African exports of cotton will be far lower. A recent joint Bank/Fund study of the cotton sector (Badiane and others, 2002) concludes that the complete elimination of U.S. cotton subsidies, would, in the short run, raise world prices by 25–30 percent and export revenues in West and Central Africa by US$250 million, although simulations reported in the forthcoming September issue of the World Economic Outlook suggest that the impact could be far less marked depending on the types of subsidies covered and the choice of base year.
- 30 -
Box 6. The EU’s Common Agricultural Policy (CAP) Reform Proposals
On July 10, 2002, the European Commission tabled a mid-term review of the CAP. The review consists of a series of proposals to reform the CAP in line with the objectives, policy direction and financial framework set in the EU’s “Agenda 2000.” If adopted and implemented, the reform measures would make EU agricultural policy significantly more market-oriented and have positive effects on agricultural exports from the rest of the world. The main proposals include:
• Decoupling of direct farm subsidies from production, with few exceptions, by establishing consolidated farm income payments based on historical entitlements;
• Linking direct income and other direct payments more closely to environmental, food safety, animal and occupational safety standards;
• Reducing direct payments gradually by 20 percent and redirecting the savings to support for sustainable agriculture and rural development;
• Limiting subsidy payments to individual farmers at euro 300,000 per year; and • Reducing intervention prices for cereals by 5 percent, rice by 50 percent, and abolishing intervention for rye, in
addition to changes to prices and intervention regimes for durum wheat, dried fodder, beef and nuts. The key proposal among the above is severing the link between subsidies to farmers and their production levels, and redirecting resources to less distortionary forms of farm support. This would also encourage farmers to produce more in response to market demand and less to maximizing subsidies received. However, de-coupling has in the past not always had as much of an effect as anticipated (e.g., EU cereals regime, where production actually rose after a switch to direct income support). The overall CAP budget would remain at €40 billion, and there are no measures proposed to reduce export subsidies and import tariffs. The proposals would reduce incentives for overproduction in the EU, and hence potentially reduce subsidized exports and help reduce pressure on world prices. Adoption of the proposals would also reduce the costs of EU enlargement by avoiding extending the costly CAP in its present form to accession countries in Central and Eastern Europe, which have large agricultural sectors. Source: Based on the Financial Times, Economist reports, and EU press release available at the EU Website.
39. It is difficult to assess the overall extent of agricultural support in non-OECD countries, as information on domestic support policies and export subsidies is not available in a format comparable to the OECD for most developing countries. It appears, however, that the implicit taxation of agriculture through trade barriers and exchange rate distortions—prevalent before the mid-1980s (Krueger, 1992; Schiff and Valdes, 1992)—may have diminished.35 While tariffs on agricultural commodities are still, on average, higher than those on industrial products, there has been progress in tackling overvalued currencies, and direct interventions in agriculture, such as through marketing boards and government procurement, have become less frequent.36 Nevertheless, within agriculture, food staples 35 Most CIS countries have also liberalized their agricultural regimes substantially over the past decade.
36 Given the presence of other forms of intervention, a more direct and reliable measure of direct taxation of agriculture would be to compare producer prices with border prices.

- 31 -
continue to be more protected than cash crops, which in some markets can work against the expansion of agricultural exports.
40. While it is difficult to generalize developments in non-OECD countries’ agricultural policy, it may be helpful to review policy trends in China and India, two of the world’s largest agricultural markets. As in many other developing countries, both China and India’s agricultural policies have centered on food self-sufficiency. Government interventions in agriculture are extensive, especially with respect to food crops, mainly in the form of border restrictions, minimum support prices and input subsidies. Both countries, however, have also embarked on wide-ranging economic reforms. In recent years India has reduced governmental control over agricultural trade, abolished many quantitative import restrictions, relaxed licensing arrangements, and reduced tariffs.37 China’s accession to the WTO has imposed significant discipline on government policies, including limiting trade-distorting forms of support at 8.5 percent of gross output value for every product, eliminating export subsidies, and introducing a TRQ regime for several sensitive commodities. In-quota tariffs are minimal (1–3 percent), but out-of-quota rates are high (up to 65 percent) (WTO, 2001c).
D. Costs of Protection and Benefits of Liberalization 41. Agricultural distortions inflict large costs on the global economy, by some estimates exceeding those of protection in the industrial sector (Anderson and others, 2001). Estimates tend to be derived from simulations with computable general equilibrium models; a footnote and an Annex describe these models and the important limitations they have.38 Based on static effects alone, the global income loss from agricultural distortions worldwide may be well over US$120 billion (Table 5). 39 Most of the cost results from
37 See USDA website at http://www.ers.usda.gov/briefing/india/policy.htm.
38 Most of the results presented in this section are based on simulations with the GTAP model. While computable general equilibrium models have the advantage of capturing economy-wide effects of policy changes, they also have important limitations. To allow results to be tracked, these models reduce complex economic behavior and policies to simple specifications. They are also limited by the availability of up-to-date economic data and estimates of key parameters governing economic behavior. The model is static and hence unable to capture dynamic effects of trade policies, such as capital accumulation or technological change. The integration of preferential agreements in the GTAP database is still incomplete. For these reasons, results in this section should be taken to represent orders of magnitude only. See the Annex for a brief description of the GTAP model.
39 The forthcoming September issue of the World Economic Outlook contains a detailed discussion of the results for individual countries and regions, as well as a breakdown of the effects of subsidies versus tariffs (see Chapter II, Section 2, “How Do Industrial Country

- 32 -
market price support measures, of which tariffs are the dominant form. The losses of export revenues are much larger, by a factor of three to four in the case of developing countries.
Table 5. Costs of Agricultural Distortions, 1997 (In billions of U.S. dollars)
Cost to region: World OECD Non-OECD Agricultural policy of: Income loss
World 128.2 97.8 30.4
OECD 101.4 92.7 8.7
Non-OECD 26.8 5.1 21.7
Foregone export revenue
World 378.0 255.8 122.2
OECD 257.7 234.9 22.8
Non-OECD 120.3 20.9 99.4 Source: Fund staff simulations of the GTAP model.
42. Both groups of countries suffer the most from their own restrictive policies. For developing countries, these policies are responsible for about 71 percent of the total income loss, while for developed countries, the share is as high as 95 percent. Partly due to more limited subsidies and a smaller absolute level of agricultural trade, developing countries bear about one-fifth of the (static) total global income loss while developed countries account for the remaining four-fifths. Adding dynamic assumptions and projecting to 2015, the effects of this pattern of distortion are magnified because of the differential growth rates of protected sectors; the World Bank (2002a) found that agricultural protection in developing countries accounts for about half of global losses.
43. The analysis also highlights the need to reduce protection across all commodities in order to maximize the benefits of global liberalization. But benefits of liberalization would not be equal across all commodities, given varying rates of existing protection. For example, simulation results suggest that developing countries would accrue the greatest benefits from the liberalization of processed food products, followed by sugar, paddy rice, dairy products, and meats.40 These are sectors where tariff peaks (and TRQs, especially in Agricultural Policies Affect Poor Countries”).The World Bank's Global Economic Prospects 2002 (Chapter 6) provides estimates of dynamic effects of trade liberalization, both in value terms and in percentage of income.
40 The liberalization of TRQs in sugar trade may have complex distributional implications, since it would erode the rents associated with the existing quota allocations. Distributional issues are discussed in the following section.
- 33 -
sugar trade) remain prominent in developed country markets, but also in developing countries themselves.
44. An important benefit of agricultural liberalization would be less instability and downward pressure on world prices for key commodities. Border protection and domestic support (much of which is countercyclical) enhance price stability in protected markets at the expense of price stability in world markets, by limiting the share of world production and demand that remains price-sensitive. Developing countries suffer the most from price instability as they have fewer resources available to smooth consumption and income flows. According to one estimate, the elimination of policies that insulate producers from world prices would reduce instability in food market prices (measured by the coefficient of variation of world prices) by as much as two-thirds (Tyers and Anderson, 1992).
45. Agricultural liberalization is likely to have long-term, dynamic effects on world production and trade. These dynamic effects, which could include increased farm investment and enhanced technologies and productivity in response to better market opportunities, would likely magnify the potential benefits of liberalization as it has in other economic sectors. For developing countries to reap the full benefits of liberalization, however, requires a framework of supportive policies—including the elimination of anti-agriculture biases in pricing policies so that (higher) world prices are passed through to the farm-gate—and essential infrastructure (transport, logistics, credit, extension services).
E. Distributional Implications of Reform and Adjustment Needs 46. While global liberalization of both tariffs and subsidies would benefit every region, the static effect of removing subsidies alone is likely to be negative for developing countries as a group and many individual countries.41 Major exceptions include Argentina, Brazil, and India. Two factors explain this result: (1) changes in food terms of trade, as prices of liberalized products rise while other prices fall as industrial country producers shift into different crops;42 and (2) substitution in developing countries, behind high tariff walls, of relatively inefficient domestic production for imports of products whose prices have risen. Well over half of the income loss for developing countries is attributable to this second effect, which could be mitigated by lowering tariffs. The effects of industrial country tariff and subsidy reform differ in that the most subsidized products are
41 Staff estimates and also Burfisher, 2001; World Bank, 2002; Cernat and others, 2002; Beghin and others, 2002; Brown and others, 2001.
42 There is uncertainty as to how easily land use in developed countries can be shifted from one agricultural industry to another due to climate and soil constraints. The model used assumes a moderate degree of transformation between land uses by different agricultural industries. It also assumes that total land use remains at the pre-liberalization level.
- 34 -
those of which developing countries as a group are net importers, so that there is a net transfer to developing country consumers offsetting the income losses of farmers from lower world prices.
47. This analysis draws attention to the need for a comprehensive approach to liberalization. Developing countries can benefit significantly from reforms if:
• these simultaneously cover both agricultural subsidies and market access restrictions, and
• their own agricultural regimes, as well as those of the industrial countries, become less restrictive.
48. Even under a comprehensive approach, however, reforms carry distributional implications both among and within countries. Certain net food importers might suffer terms of trade and related net income losses initially as prices adjust. They are more likely to experience such losses if subsidy removal is phased in ahead of tariff reductions. Within individual countries, the global liberalization of agriculture would generally benefit developing country farmers, but developing country consumers may face higher prices.43 The potential distributional impact of agricultural liberalization has motivated calls at the WTO for special consideration of the circumstances of net food importing countries.
49. Agricultural liberalization will also entail adjustment costs in some developing countries, particularly those that currently have preferential access to industrial country markets. Since the GTAP database used in the simulations does not yet incorporate many preferential schemes, the simulated benefits of trade liberalization for preference-receiving regions are probably overstated, even though incorporating such schemes may not alter the broad pattern of results. For example, Mauritius benefits substantially from preferential access for its sugar exports to the EU, as do the Caribbean nations from banana exports. The U.S. sugar regime similarly subsidizes quota recipients under TRQs by providing the chance to sell into the high-priced U.S. market. Multilateral liberalization on an MFN basis would erode the preference margins for these countries and result in loss of market share and income. The resulting adjustment needs would be especially large for countries with a narrow export base. More research is required to assess the impact of liberalization in greater detail.
F. Policy Implications 50. A comprehensive approach to liberalization in agriculture, covering border protection and subsidies in industrial as well as developing countries, is most likely to
43 However, note that many consumers in developing countries are at the same time producers.

- 35 -
produce the greatest benefit to developing countries. However, the distributional implications of such a broad based approach to trade policy reform—both in terms of intra-country shares in world trade and domestic income—are likely to be complex and involve considerable adjustment. Consequently, such changes should be considered within the broader context of development and poverty reduction strategies, with special attention to food security issues and the concerns of consumers, particularly the urban poor.
51. The focus in tariff negotiations should be on the MFN reduction of tariffs (both in- and out-of-quota, where relevant) and the phasing out of TRQs. As in nonagricultural trade, tariff peaks are an area of particular concern. Experience suggests that the prospects for a substantial reduction or elimination of peaks are best where negotiations are based on some type of formula approach. A formula approach might also simplify the granting of “credit” for past unilateral trade liberalization—an issue still under negotiation—and can ensure that countries with relatively uniform structures of protection maintain such regimes.
52. At the same time, there should be ambitious efforts in the OECD countries to de-couple agricultural support from production. Market price support measures should be phased out in favor of more transparent and direct forms of support for farm income and environmental objectives. Production-linked subsidies are not sustainable from a financial, ecological, or development perspective. But it is clear that substantial political commitment will be necessary to implement such reforms. The debate within the EU about the future of the CAP is welcome and an important test case of this commitment.
IV. BARRIERS TO TRADE IN TEXTILES AND CLOTHING 53. Historically, textiles and clothing (T&C) have played a unique role in economic development and poverty reduction. Their contribution to the Industrial Revolution in Western Europe and North America in the 18th and 19th centuries is well-known, and they continued to spearhead industrialization in many developing countries in the 20th century. However, the sector has also long been a prime target for protectionism. Despite the rapid expansion of developing country exports of T&C products, the removal of trade barriers would bring significant additional benefits.
A. Developing Country Exports of Textiles and Clothing 54. Since textile and clothing production often requires only simple technology and is intensive in unskilled labor, many developing countries have a strong comparative advantage in these sectors.44 As shown in Figure 2, developing countries as a whole have succeeded in exploiting this comparative advantage. In the mid-1960s, developing countries
44 For the wage and labor cost differentials between T&C and among various countries, see ILO (2000).

- 36 -
accounted for 15 percent of world textile exports and less than 25 percent of world clothing exports. By 1998, these shares had reached 50 percent and 70 percent, respectively. Total exports of T&C by developing countries reached US$213 billion in 1998. However, sub-Saharan Africa contributed less than 2 percent of this figure, with total T&C exports in 1998 of only US$3.6 billion.
55. The rapid growth of developing country T&C exports has created a high dependency on these products for export earnings (Table 6). Textiles alone accounted for 51 percent of Pakistan’s merchandise exports in 1999, clothing for 50 percent of Sri Lanka’s. Among least developed countries, T&C represented 83 percent of Bangladesh’s merchandise exports (1999), and 87 percent of Cambodia’s (2000). As discussed below, the high export dependency on T&C may lead to vulnerability in these countries’ balance of payments, as scheduled liberalization of the sector will result in a considerable redistribution of market shares among developing country exporters.
B. Textiles and Clothing in the Multilateral Trading System 56. The remarkable growth in T&C exports from developing countries has been achieved despite extensive quantitative restrictions discriminating against developing countries and high tariffs in developed countries—the main export markets for most developing countries.45 For nearly half a century, world trade in T&C has been subject to quantitative restrictions under derogation from GATT rules, beginning with Japan’s 1955
aints” on its exports of cotton fabrics and clothing to the United States, which evolved into the multilateral Short-Term Arrangement regarding International Trade in Cotton Textiles in 1961, the Long-Term Arrangement in 1962, and eventually the Multifiber Arrangement (MFA) in 1974.46 The MFA expanded quantitative restrictions beyond cotton products to wool and man-made fiber products and was extended several times until the Uruguay Round Agreement on Textiles and Clothing (ATC) took effect at the beginning of
45 This points to the importance of supply-side conditions, in addition to market barriers, in understanding export success.
46 The Short-Term Arrangement, involving the United States and other cotton importing and exporting countries, prohibited voluntary restraints.

- 37 -
Source: GTAP database (ver. 5).
Figure 2. Exports of Textiles and Clothing by Region, 1965-98
Textiles
0
10
20
30
40
50
60
70
80
90
100
1965 1967 1969 1971 1973 1975 1977 1979 1981 1983 1985 1987 1989 1991 1993 1995 1997
perc
ent
Other developing countriesSub-Saharan AfricaLatin AmericaAsiaDeveloped countries
Clothing
0
10
20
30
40
50
60
70
80
90
100
1965 1967 1969 1971 1973 1975 1977 1979 1981 1983 1985 1987 1989 1991 1993 1995 1997
perc
ent
Other developing countriesSub-Saharan AfricaLatin AmericaAsiaDeveloped countries

- 38 -
Table 6. Exports of Textiles and Clothing, 20011/ (In millions of U.S. dollars and percentage)
Value Percent of total (in millions of U.S. dollars) merchandise exports World 356,400 5.8 Cambodia 1,149 88.7 Macao SAR 2,121 83.9 Bangladesh 4,219 83.4 Pakistan 6,676 72.8 Mauritius 949 63.6 Sri Lanka 2,493 54.4 Tunisia2 2,504 42.6 Turkey 10,205 38.4
Morocco2 2,364 33.7 India 10,239 28.2 Romania 2,524 24.4
China2 52,206 20.9
Hong Kong SAR2 37,657 18.6 Portugal 4,247 18.2 Egypt 633 17.8 Bulgaria 800 16.9 Jamaica 287 16.5 Greece 1,260 16.4 Indonesia 8,239 13.3 Vietnam 1,975 13.1 Croatia 556 12.7 Italy 25,175 10.6 Korea 15,990 10.6 Taiwan Province of China 14,654 9.9 Peru 635 9.1 Thailand 6,063 8.8 Slovenia 747 8.7 Poland 2,653 8.4 Slovak Republic 913 7.7 Uruguay 165 7.4
Philippines2 2,696 6.8
Mexico2 11,247 6.8 Belgium-Luxembourg 11,514 6.4
Czech Republic2 1,852 6.4 Colombia 788 6.0 Source: WTO, and IMF staff estimates. 1Or nearest year. 2Includes significant re-exports or exports from processing zones.

- 39 -
1995. In the MFA’s last year of operation, six participants (Austria, Canada, EU, Finland, Norway, and the United States) applied quotas under the Arrangement. 57. The salient feature of the MFA was bilateral quotas, negotiated between individual importing (typically developed) and exporting (typically developing) countries. The MFA called on importing countries to endeavor to grow quota volumes by at least 6 percent per year. In practice quota growth was often significantly lower for established suppliers, while small and new exporting countries were generally granted more generous quota growth. As compensation for foregone exports, exporting countries were given the right to manage the allocation of quotas, thus enabling them to capture at least part of the quota rents.47 For this reason, MFA quotas act like bilateral export restrictions. As shown in Table 7, the export tax equivalents of these quotas vary substantially across countries. The most competitive exporting countries, such as China and India, face more stringent restrictions than the less competitive countries.48 The estimates in Table 7 are very aggregated. For example, World Bank staff calculations found export tax equivalents of almost 300 percent on exports of basic goods such as T-shirts from China.
Table 7. Export Tax Equivalents of MFA Quotas and Tariffs
on Textile and Clothing Imports in Quad Countries, 1997
Source: GTAP database version 5.
47 Some research suggests that quota rents are shared by developing and developed countries. It is argued that large corporate buyers from developed countries often capture at least part of the quota rents (Krishna and others, 1994).
48 In fact, the upper bounds in Table 7 represent restrictions faced by Chinese and Indian exporters.
United States EU Japan Canada Export tax equivalents of quotas (percent of f.o.b. prices) Textiles
Average 6.7 4.5 0.0 7.8Range 0-20 0-12 0-0 0-20
Clothing Average 11.0 5.3 0.0 16.8Range 0-34 0-15 0.0 0-34 Import-weighted tariffs (percent)
Textiles 11.2 9.1 8.5 15.7Clothing 13.3 11.9 12.5 21.2Other manufactures 2.8 3.6 1.4 3.9
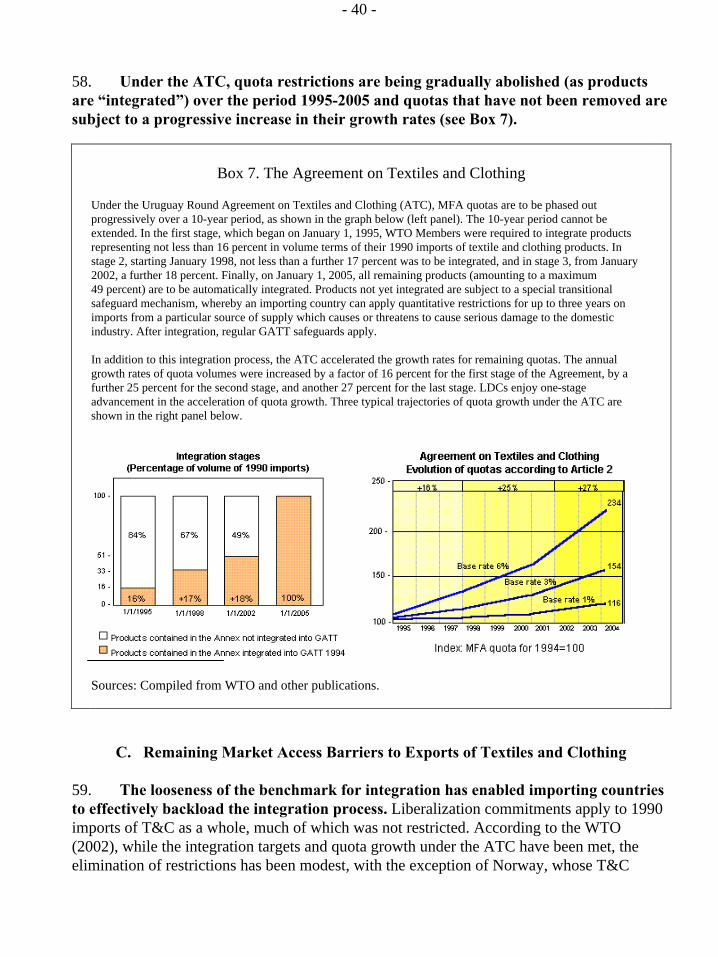
- 40 -
58. Under the ATC, quota restrictions are being gradually abolished (as products are “integrated”) over the period 1995-2005 and quotas that have not been removed are subject to a progressive increase in their growth rates (see Box 7).
Box 7. The Agreement on Textiles and Clothing
Under the Uruguay Round Agreement on Textiles and Clothing (ATC), MFA quotas are to be phased out progressively over a 10-year period, as shown in the graph below (left panel). The 10-year period cannot be extended. In the first stage, which began on January 1, 1995, WTO Members were required to integrate products representing not less than 16 percent in volume terms of their 1990 imports of textile and clothing products. In stage 2, starting January 1998, not less than a further 17 percent was to be integrated, and in stage 3, from January 2002, a further 18 percent. Finally, on January 1, 2005, all remaining products (amounting to a maximum 49 percent) are to be automatically integrated. Products not yet integrated are subject to a special transitional safeguard mechanism, whereby an importing country can apply quantitative restrictions for up to three years on imports from a particular source of supply which causes or threatens to cause serious damage to the domestic industry. After integration, regular GATT safeguards apply. In addition to this integration process, the ATC accelerated the growth rates for remaining quotas. The annual growth rates of quota volumes were increased by a factor of 16 percent for the first stage of the Agreement, by a further 25 percent for the second stage, and another 27 percent for the last stage. LDCs enjoy one-stage advancement in the acceleration of quota growth. Three typical trajectories of quota growth under the ATC are shown in the right panel below.
Sources: Compiled from WTO and other publications.
C. Remaining Market Access Barriers to Exports of Textiles and Clothing 59. The looseness of the benchmark for integration has enabled importing countries to effectively backload the integration process. Liberalization commitments apply to 1990 imports of T&C as a whole, much of which was not restricted. According to the WTO (2002), while the integration targets and quota growth under the ATC have been met, the elimination of restrictions has been modest, with the exception of Norway, whose T&C

- 41 -
imports have been all but freed from quotas.49 As shown in Table 8, only a small percentage of quotas originally in place were eliminated by the EU and the United States during the first two stages of integration, corresponding to approximately 20 percent of their imports under restrictions (WTO, 2002a). While there has been a slight acceleration of this process during stage 3 of the ATC, which began in January 2002, the vast majority of restrictions has been left to be abolished at the end of the implementation period.50
Table 8. Number of Quotas Eliminated by Integration in ATC Stages 1 and 2
Total number Number of quotas eliminated WTO member of quotas By integration By early elimination Total United States 750 2 111 13 EU 219 14 0 14 Canada 295 29 0 29 Norway 54 0 51 51
1Quotas eliminated only in respect to Romania. Source: Kheir-El-Din (2002), based on notifications to the WTO Textile Monitoring Body.
60. In addition to the MFA quotas, T&C imports are subject to exceptionally high tariffs (Table 7).51 Despite historically high levels, during the Uruguay Round tariffs on T&C were generally cut less than those on other manufactures, and tariff peaks and escalation remain common in this sector.52 In OECD import regimes, tariff peaks affect 27 percent of total tariff lines on T&C, nearly twice as many as tariffs under 5 percent (WTO, 2001a). Tariff escalation is evident from Table 7, with tariffs on clothing higher than those on textiles.
61. Tariffs on T&C in developing countries are also high. Trade-weighted average (applied) tariffs for non-OECD countries, as reported in the GTAP database (which refers to 1997), are 16 percent. This average conceals large variations among individual countries. The largest developing country exporters tend to have higher tariffs. ASEAN, China, and South
49 Two of the countries that applied quotas under the MFA, Austria and Finland, subsequently joined the EU regime.
50 Quotas integrated by the EU in January 2002 represented 15 percent of restricted imports in 1990, thus raising the total to 20 percent (WTO, 2002b).
51 High tariffs in industrial countries on quota-restricted imports can be interpreted as an attempt to capture the quota rents and do not represent additional protection. However, if quota access is priced correctly, the measured tariffs and quota premia must be added to infer the total burden facing exporters.
52 Note however that tariffs in this sector have been capped at 12 percent in the EU, below the threshold for “peaks”.

- 42 -
Asia all have average tariffs in the range of 20–33 percent on textiles, and of 30–35 percent on clothing, with individual tariff lines far exceeding these levels. Mexico and the Southern African Customs Union (SACU) also have high tariffs on clothing.53 These tariffs represent significant barriers to South-South trade. Furthermore, tariff bindings tend to significantly exceed applied rates, creating uncertainty over trade policies (Bacchetta and Bora, 2002; UNCTAD, 2002).
D. The Cost of Barriers and Benefits of Liberalization 62. Remaining barriers to trade in T&C impose a substantial burden on both developing and industrial countries. Simulations with the GTAP model (see the Annex) suggest that the combined income effect for developing countries of quotas and tariffs on industrial country imports amounts to US$24 billion per year, and the export revenue loss to US$40 billion (Table 9).54 Industrial countries suffer around half the income loss but almost the same export shortfall as developing countries.55, 56 Some of the effects derive from backward linkages. Thus, MFA quotas and tariffs reduce the demand for fiber crops. According to the same simulations, the full liberalization of world trade in T&C would boost cotton exports by 9 percent in sub-Saharan Africa, or about US$132 million in 1997.
63. The high tariffs in developing countries have equally large costs, for both exporters and importers. Intra-developing country trade accounts for about half of their total exports of textiles and 20 percent of clothing exports. Extending the above simulation to cover full global liberalization of T&C imports, in both industrial and developing countries, suggests that removing developing country tariffs would contribute a large share of their own
53 These rates do not reflect the effects of extensive duty exemptions. Revenue collections on T&C imports into developing countries are often significantly lower than the tariff rates would suggest, especially on textiles.
54 Like the simulation results reported in Table 5, these numbers represent the static effects of trade liberalization. Some preliminary estimates of the dynamic effects of trade liberalization are reported in the World Bank’s Global Economic Prospects 2002.
55 Note that, since these are general equilibrium simulations, exports lost or gained are not necessarily in the T&C sector, and income losses in the T&C sector may be partially mitigated by gains in other sectors as factors of production migrate. The U.S. International Trade Commission (USITC), using a single-country general equilibrium model, recently estimated losses to the U.S. economy from U.S. T&C restrictions at US$13.5 billion per year (USITC, 2002); this figure appears large relative to those in Table 9 because the estimated terms of trade losses are smaller. Partial equilibrium analyses of T&C restrictions often suggest larger income losses.
56 In Table 9, the income loss in industrial countries due to the liberalization of tariffs is explained by terms of trade effects.

- 43 -
gains in income and exports, though it would have a comparatively lower impact on industrial countries (Table 9).57
Table 9. Income and Export Revenue Losses Due to MFA Quotas and T&C Tariffs (In billions of U.S. dollars)
Developed countries Developing
Quotas and tariffs MFA quotas Tariffs country tariffs1 World Income loss Developing 23.8 1.7 22.2 28.0 51.8 Developed 10.9 13.9 -3.0 3.2 14.0 World 34.7 15.5 19.1 31.1 65.8 Export revenue loss Developing 39.8 22.3 17.5 41.5 81.2 Developed 46.3 10.3 35.9 9.0 55.4 World 86.0 32.6 53.4 50.5 136.6 Source: IMF staff simulations with the GTAP model. 1Half of applied tariffs assumed for textiles in order to account for exemptions (full tariff for clothing). Sensitivity analysis shows that developing country income loss due to developing country tariffs would be 27 percent higher if textiles tariffs were applied in full. On the other hand, if existing exemptions are in fact deeper, at 75 percent, developing country income loss would be lower by 13 percent. Similar changes to the loss of export revenue also hold.
64. The effect of T&C restrictions on employment in developing countries is considerable. According to staff simulations, as many as 27 million jobs are foregone in developing countries due to the combined effect of quotas and tariffs.58 On average, each job saved in developed countries by tariffs and quotas is therefore, estimated to cost 35 jobs in developing countries, many of which are in China and India. MFA quotas and tariffs tend to be most hurtful to the poor. In developing countries, T&C industries employ overwhelmingly low-skilled workers, often migrants from rural areas.
65. Similarly, low-income households in industrial countries bear the brunt of the cost of MFA quota and tariff restrictions. The poor spend a larger share of their income on necessities such as T&C. The products they buy are typically subject to higher tariffs and restrictions than those bought by the better-off—for instance, imports of silk blend baby
57 These estimates assume that effective rates of tariffs on textiles are half the applied rate, as a result of exemptions. Also see the footnote to Table 9.
58 In the simulation, it is assumed that real wages in developing countries remain constant after the removal of protection in developed countries. Given widespread un- and under-employment, this may be a reasonable assumption. Jobs lost cover both direct and indirect employment in all industries. In developed countries, economy-wide employment is assumed to be constant after the removal of protection, but workers can move across industries. So even though jobs are lost in the textile and clothing industries as a result of liberalization, the same number of jobs is created in other industries.

- 44 -
trousers face a tariff of 2.8 percent in the U.S. market, those of cotton a rate of 15.5 percent, and synthetic fiber trousers a rate of 29.0 percent (Gresser, 2002). This pattern, repeated across a wide range of product categories, is reinforced by the effect of quotas, which lead to higher percentage mark-ups on lower quality products than on higher quality ones (Falvey, 1979). Volume quotas also provide a continuous incentive for exporters to upgrade their products over time within each quota category towards higher unit value products.59
E. Adjustment Needs Following Liberalization 66. Quotas and tariffs on T&C trade differ in their impact on developing countries. For developing countries, the income effect of the current tariff regimes is far more significant than that of the quotas, largely because they share in the quota rents. In turn, quotas dominate the impact on exports and employment. Because the extent to which quotas are binding differs between exporters, their elimination could give rise to significant shifts in the competitive position of suppliers.
67. Among developing countries, quotas are most constraining for China and India. Other suppliers benefit from this state of affairs as restrictions on more competitive producers enable them to sell at higher prices into the protected markets.60 In fact, the quotas of many countries have been underfilled (USITC, 2002). Upon the elimination of quotas, the more competitive suppliers are expected to gain market share from others, including low-income countries (Francois and Spinanger, 2002; UNCTAD, 2002; and Adhikari and Yang, 2002). A reallocation of production could undermine external balances and impose high adjustment costs, in view of the large share of T&C in the exports of a number of countries. There is a need for the early identification of problems and action to diversify exports and strengthen competitiveness.
68. The backloading of effective liberalization under the ATC is particularly unhelpful, as it turns what could have been a gradual adjustment process into a shock at the end of the transition period—for both importing and exporting countries.61 This raises concerns that political pressures might spark greater recourse to other forms of protection once quotas are phased out, with trade remedy action and perhaps non-transparent “voluntary” export restraints (prohibited in principle under the WTO) becoming a "new line
59 In the United States, the quotas are typically specified in number of square yard equivalents, while in the EU they are often specified in number of kilograms.
60 However, since quotas are often administratively allocated, rather than competitively auctioned, developing countries often suffer the costs of inefficient allocation (Trela and Whalley, 1995).
61 Even though countries would have an interest in smoothing the adjustment path in anticipation of quota removal, the same is not true for individual producers whose incentive, given sunk investments, is to take advantage of quota rents as long as they are available.

- 45 -
of defense.” In addition, the sudden withdrawal of quota protection at the end of the transition period is likely to increase resistance to further reductions in tariffs. So far, use of the transitional safeguards under the ATC has been erratic, and while WTO statistics show no clear trend in annual antidumping initiations in the textile industry, the total number of measures in place has increased over time (Lindsey and Ikenson, 2001). 62
69. One way to mitigate the adjustment shock in developing countries is to accompany quota removal with tariff reductions (in industrial countries and other large markets for developing country T&C exports). Combined action on quotas and tariffs would improve income and increase export earnings for a broader range of developing countries compared with quota removal alone, while developed countries also reap substantial benefits. However, for countries benefiting from preferential access under present conditions, tariff reduction would impose additional adjustment burdens as the value of these preferences is eroded. 63 Scheduling a gradual path for the multilateral liberalization of tariffs that starts early—in parallel with quota removal—but provides time for adjustment, may allow to strike the right balance among the interests of individual countries. Trade liberalization across a broad range of industries would help compensate some developing countries for the losses they suffer in the textile and clothing industries.
70. Preferences for LDCs are not a long-term solution to problems of competitiveness, but schemes that provide LDCs with duty- and quota-free market access may ease problems of transition, especially if combined with liberal rules of origin. Simulation results suggest that duty-free entry into Quad markets, in a scenario in which tariffs on T&C are reduced multilaterally to the average for other manufactures, might lead sub-Saharan Africa to enjoy an income gain and an increase in export earnings rather than a loss. However, the benefits of preferential market access can be substantially reduced and even negated by restrictive rules of origin, either because of the need to switch to higher-cost sourcing of intermediate goods, or because value added thresholds for preferential access are hard to meet.64 In addition to the rules of origin, there is often a fine balance to strike on 62 The WTO does not report antidumping activity on clothing separately. Also see the WTO website: http://www.wto.org/english/tratop_e/adp_e/adp_e.htm
63 Simulations suggest that Central America, Mexico and the SACU countries would be particularly heavily affected by the combined impact of quota removals and preference erosion. The results do not take account of AGOA and EBA; preferences under the former have been effective at raising T&C exports of certain African countries to the U.S. market (see Section II).
64 Mattoo and others (2002) estimate that benefits under the AGOA could, under certain assumptions, be reduced by as much as 75-80 percent because of onerous rules of origin. There are similar problems with EU preferential schemes. In the case of Bangladesh, for example, the high import content of its garment exports means that a large share of the country’s garment exports fails to qualify for duty-free entry into the EU market (Oxfam, 2002).

- 46 -
social and environmental conditions. As illustrated in Box 8, minimum wage and other conditions for preferential access of Cambodian-made garments may have limited the benefits the country has drawn from these schemes.
Box 8. Labor Standards and Cambodia’s Exports of Textiles and Clothing
Cambodia’s garment manufacturing has grown spectacularly since 1995. The industry grew from virtually zero activity in 1996 to some 200 factories and 150,000 jobs in 2001. Exports expanded from virtually nothing in 1995 to US$965 million in 2000, accounting for 87 percent of the country’s total exports in that year. This success has been at least partly due to preferential access to the EU and U.S. markets, in the case of the United States subject to compliance with a number of labor standards and minimum wage conditions.
Protected access to high priced markets has led to a segmentation of the Cambodian labor market, engendering various private payments to secure a place in the privileged sector. The growth of the garments sector since 1997 has led to a massive inflow of about 120,000 young people—mostly women—from rural Cambodia to Phnom Penh. Working conditions are considered good, and following regulations regarding minimum wages and a bonus system, monthly take home pay has risen to about US$70. However, to secure jobs in the sector workers typically pay an up-front bribe to shop stewards, and pay transport and living expenses for a month without salary. Fees to secure jobs in the sector have risen four-fold to about US$120, which is beyond the means of most families in rural Cambodia. Moreover, there is a stark contrast between inspections of labor conditions in some parts of the sector, and neglect in others.
There are also concerns about the long-term viability of this sector’s growth. Due to the minimum wage and overtime provisions, costs are considered too high for a number of markets where Cambodia has non-preferred access. Investment and employment creation are therefore thought to be constrained. There is also considerable uncertainty regarding the continuation of market access privileges. Given the “footloose” nature of the sector, changes in market access conditions could prove highly disruptive for the country’s development. Source: Cambodia Integrated Framework, Diagnostic Trade Integration Study, 2002.
71. Industrial countries also face a continuing adjustment problem. While employment is shrinking, T&C industries have demonstrated an ability to adapt in the past. In the textile industry, the primary response has been investment in new technology. As a result, the industry has become more capital-intensive and labor productivity has improved continuously over time (Levinsohn and Petropoulos, 2001; Stengg, 2001). In the clothing industry, the primary response to import competition has been organizational change in the production process. Local manufacturers have taken advantage of their geographic proximity to markets and developed quick-response supply systems.65 Outsourcing overseas of the labor-intensive (assembly) part of the production process has also increased substantially in recent years. Nevertheless, employment in the T&C sector has fallen drastically over the past decades, and is likely to decline further. As discussed, import restrictions are a very costly way to prevent job loss and increase wages, but some forms of targeted adjustment assistance have shown positive results (Martin, 1998).
65 For instance, there has been a substantial shift from the traditional progressive bundle assembly system to module production which shortens delivery time as well as reducing inventory costs.

- 47 -
F. Policy Implications 72. It is an urgent priority to accelerate the removal of quotas on textiles and clothing imports. Given the risks associated with the backloading of quota removal under the ATC, the objective should be to limit the adjustment shock at the end of the transition period, for both importers and exporters. At the same time, T&C exporting developing countries should assess the competitive position of their industries and determine the need for and scope of adjustment policies in anticipation of quota liberalization and preference erosion.
73. It should be the aim under the Doha round negotiations to substantially lower tariffs on T&C trade, in both industrial and developing countries. Tariffs in this sector are exceptionally high and liberalization can be expected to carry large benefits for developing countries in terms of exports, employment, and income. Possible approaches to the elimination of tariff peaks and escalation were discussed in Section II. Tariff reductions would, in a number of developing countries, help to mitigate the adjustment shock from quota removal. In industrial countries, tariff reductions combined with the removal of quotas are likely to benefit lower-income households on the whole, and improve income and efficiency.
74. In order to prevent antidumping action from taking the place of quotas and tariffs once these are liberalized, trade remedy rules should be reviewed with the aim to limit the scope for discretion and incorporating consumer interests (see Section II. E).
V. CONCLUSIONS 75. Market access barriers in world trade remain significant for products of export interest to developing countries. This paper suggests that the liberalization of imports, especially for agricultural products and textiles and clothing, can generate large benefits for developing countries in terms of incomes, exports and employment. These benefits would derive in part from the elimination of access barriers to industrial country markets, but also in good part from reform of the trade regimes of developing countries themselves. In the aggregate, the determined opening of markets is a win-win proposition—both industrial and developing countries gain. The static income gain alone for developing countries, suggested by model simulations, compares favorably with levels of development assistance. Overseas development assistance levels have been on the order of US$50–60 billion over recent years, roughly equivalent to the estimated income effect on developing countries of removing barriers to trade in textiles and clothing. In addition, there are likely dynamic effects. Many developing countries have been able to develop vigorous and diversified export sectors despite the existing market access hurdles, but better access would no doubt ease the task.
76. The paper identifies a number of priorities for making progress towards a multilateral trading system that takes special account of the interests of developing countries. These include eliminating tariffs peaks and escalation, essentially in agriculture, textiles and clothing; tightening disciplines on trade remedy action; increasing capacity-building assistance to help developing countries navigate technical and health-related

- 48 -
barriers;66 extending full duty- and quota-free access for LDC exports; pursuing a comprehensive approach to liberalization in agriculture, including the de-coupling of domestic support to agriculture; accelerating the phase-out of MFA quotas in textiles and clothing trade combined with tariff reductions; and strengthening preference schemes, for example, by simplifying and liberalizing rules of origin and other conditions.
77. This report has not dealt with services. Developing countries, however, are likely to benefit significantly from further domestic liberalization and the elimination of barriers to their exports (World Bank, 2002a). The income gains from services liberalization are estimated to be multiples of those from liberalization of trade in goods. This is not surprising given the key infrastructural role of services like transport, finance and telecommunications and the high barriers to foreign provision, despite substantial liberalization in recent years. Despite the growing scope for cross-border delivery, the movement of service-supplying personnel remains a crucial means of delivery for most developing countries. The current round of services negotiations at the WTO provides developing countries an opportunity to push both for accelerated reform at home and improved access to markets abroad.
78. Together with the benefits of liberalization come a number of risks and adjustment needs. It is important to identify these early and take appropriate action. Liberalization in agricultural trade can have complex distributional effects. While this is true for most economic reforms the food sector will tend to be particularly sensitive. Where the affected groups are economically vulnerable, supportive policies might be called for; these should, however, be embedded in broader poverty reduction or development strategies, and it must be recognized that trade policy instruments are rarely efficient tools of social policy. While associated with continuing large income losses for the world economy as a whole, the gradual pace of any likely path of agricultural liberalization should help to ease adjustment.
79. Another risk is related to quota liberalization in textiles and clothing trade, which will expose the lack of competitiveness of some developing country exporters. Liberalization has already been agreed, and the extension of the implementation period under the ATC is explicitly excluded under the agreement. It is crucial that it should take place in a way that minimizes the adjustment pressures and balance of payments impact, given the high dependency of some countries on textiles and clothing exports. Accelerating quota removal
66 Significant efforts have been made, especially since the Doha Ministerial of the WTO, to raise the level of multilateral and bilateral technical assistance in these areas (see the WTO website which reports trade-related technical assistance by donor).

- 49 -
must be part of such an approach, as must the lowering of tariff barriers, in order to mitigate the shock at the end of the implementation period. Improving preference schemes might provide some support, but it will also be necessary for developing countries to assess their competitive position in a post-MFA world and prepare early for adjustment.

- 50 - ANNEX I
Modeling the Effect of Trade Liberalization
This annex provides a brief introduction to the Global Trade Analysis Project (GTAP) model, which was used to generate some of the results presented in the main text, and guidance for the interpretation of these results. The GTAP model is a comparative static, global general equilibrium model based on neo-classical trade theory. Firms maximize their profits while consumers maximize their utility. All markets are assumed to be perfectly competitive, and constant returns to scale prevail in all production and trading activities. On the supply side, firms use both a composite of primary factors and a composite of intermediates to produce their output according to Leontief production technology. The primary factor composite is a constant elasticity of substitution (CES) function of labor, capital, land and natural resources, while the intermediate composite is a Leontief function of material inputs, which are in turn CES blends of domestically produced goods and imports. Imports are sourced from all regions, with their share depending on trading prices (the Armington approach).
On the demand side, each country or region is assumed to have a “supedisposing of regional income in fixed proportions in the form of private consumption, government expenditure and savings. Household consumption is assumed to be a constant difference in elasticities (CDE) function of various consumer goods while government expenditure is based on a CES function of various commodities. Both household and government consumption are CES blends of domestically produced goods and imports, which are in turn sourced from all trading regions based on the Armington approach.
Regional savings are assumed to be homogenous and contribute to a global pool of
savings, which is then allocated among regions for investment according to regional expected rates of return. Regional investment can either change proportionally so that regional returns may vary or such changes in returns can be equalized across regions, thus giving capital (i.e., savings) greater mobility across regions. However, capital stocks are immobile across regions, although they are perfectly mobile within a region, as is labor. Land and natural resources are industry-specific, and only limited transformation of their uses among industries is possible.
The simplicity of the GTAP model makes its simulation results easier to interpret, but
limits its capacity to deal with more complex economic issues, such as the adjustment path over time and long-term effects of trade policies associated with investment cumulation, technology and productivity change. Also absent in the model are adjustment costs associated with trade liberalization. These limitations must be kept in mind when interpreting the results presented in this paper. Attention should also be paid to the considerable uncertainty over elasticity values, which have strong influence over the terms of trade effects of policy changes.

- 51 - ANNEX I
The GTAP database provides data on key trade policies, as well as on a large number of countries and commodities. The base year for the data is 1997, and for this reason, many recent preferential arrangements are not incorporated in the database. Some efforts were made by staff to incorporate the 2002 U.S. Farm Bill, but the update is very preliminary.
The modeling results should be primarily used to gain an understanding of the
mechanism behind the economic impact of various policy options, and to provide broad indications of the direction and the magnitude of change in economic variables. Such an approach is particularly warranted when interpreting results for individual countries.

- 52 -
References
Adhikari, Ramesh, and Yongzheng Yang, 2002, “China’s Increasing Openness: Threat or Opportunity?” paper presented at the Asian Development Bank Institute Trade Policy Workshop, Singapore, February 25–28.
Anderson, Kym, Betina Dimaranan, Joseph Francois, Thomas Hertel, Bernard Hoekman, and Will Martin, 2000, “Potential Gains from Trade Reform in the New Millenium,” paper presented at the Third Annual Conference on Global Economic Analysis, Monash University, Melbourne, June.
——, 2001, “The Cost of Rich (and Poor) Country Protection to Developing Countries,” Center for International Economics Studies, Discussion Paper No. 0136, (Adelaide: University of Adelaide).
Bacchetta, Marc, and Bijit Bora, 2002, “Market Access for Industrial Products and the Doha Development Agenda,” paper prepared for the World Bank Conference on “Informing the Doha Process: New Trade Research for Developing Countries,” Cairo, May 20-21.
Badiane, Ousmane, Dhaneshwar Ghura, Louis Goreux, and Paul Masson, 2002, “Cotton Sector Strategies in West and Central Africa,” World Bank Policy Research Working Paper 2867, July (Washington).
Beghin, John C., David Roland-Holst, and Dominique van der Mensbrugghe, 2002, “How Will Agricultural Trade Reforms in High-income Countries Affect the Trading Relationships of Developing Countries?” paper presented at the “OECD-World Bank Forum on Agricultural Trade Reform, Adjustment, and Poverty,” Paris, May 23-24.
Bjornskov, Christian, and Ekaterina Krivonos, “From Lomé to Cotonou: The new EU-ACP Agreement,” Working Paper No. 14/2001, (Copenhagen: Danish Institute of Agricultural and Fisheries Economics).
Borrell, Brent, and Lionel Hubbard, 2000, “Global Economic Effects of the EU Common Economic Affairs, June, pp.18-26.
Bouët, Antoine, Lionel Fontagné, Mondher Mimouni and Xavier Pichot, 2001, “Market Access Maps: A Bilateral and Disaggregated Measure of Market Access,” CEPII Working Paper No. 18 (Paris: Centre d’Etudes Prospectives et d’Informations Internationales).
Brenton, P., and M. Manchin, 2002, “Making the EU Trade Agreements Work: The Role of Rules of Origin,” CEPS Working Document No. 183, (Brussels: Center for European Policy Studies).
Brown, Drusilla K., Alan V. Deardorff, and Robert M. Stern, “CGE Modeling and Analysis of Multilateral and Regional Negotiating Options,” RSIE Discussion Paper No. 468 (Ann Arbor: University of Michigan).

- 53 -
Burfisher, May E., ed., Agricultural Policy Reform in the WTO: The Road Ahead, Economic Research Service, Agricultural Economic Report No. 797 (Washington: United States Department of Agriculture).
Cernat, Lucian, Sam Laird, and Alessandro Turrini, 2002, Back to Basics: Market Access Issues in the Doha Agenda, (New York and Geneva: United Nations Conference on Trade and Development).
Gresser, Edward, 2002, “America’s Hidden Tax on the Poor: The Case for Reforming U.S. Tariff Policy,” Progressive Policy Institute Policy Report, March (Washington: Progressive Policy Institute).
Falvey, R.E., 1979, “The Composition of Trade Within Import-restricted Product Categories,” Journal of Political Economy, Vol. 87(5), pp. 1105-14.
Finger, J.M., 1993, “Antidumping: How It Works and Who Gets Hurt,” (Ann Arbor: Michigan University Press).
Finger, M. and P. Schuler, 2000, “Implementation of Uruguay Round Commitments: The The World Economy, Vol. 23(4), pp. 511-25.
Fontagne, L., F. von Kirchbach, and M. Mimouni, 2001, “A First Assessment of Environment-Related Trade Barriers,” International Trade Center, Geneva, mimeo.
Francois, Joseph, Hans H. Glismann, and Dean Spinanger, 2000, “The Cost of EU Trade Protection in Textiles and Clothing” (Kiel: Kiel Institute of World Economics), mimeo.
Francois, Joseph F., and Dean Spinanger, 2002a, “Market Access in Textiles and Clothing,” paper prepared for the World Bank conference on “Informing the Doha Process: New Trade Research for Developing Countries,” Cairo, May 20-21.
——, 2002b, “With Rags to Riches but Then What? Hong Kong’s T & C Industry vs. the ATC and China’s WTO Accession,” paper presented at the “Fourth Annual Conference on Global Economic Analysis,” Purdue University, West Lafayette, June 27-29.
Gibson, Paul, John Wainio, Daniel Whitley, and Mary Bohman, 2001, “Profiles of Tariffs in Global Agricultural Markets,” Economic Research Service, Agricultural Economic Report No. 796 (Washington: United States Department of Agriculture).
Hart, Chad E., and Bruce Babcock, 2002, “U.S. Farm Policy and the World Trade Organization: How Do They Match Up?” Working Paper 02-WP 294, February, Center for Agricultural and Rural Development (Iowa: Iowa State University).
Hathaway, Dale E. and Merlinda D. Ingco, 1996, “Agricultural Liberalization and the The Uruguay Round and the Developing Countries, ed. by Will
Martin and L. Alan Winters (Cambridge; New York and Melbourne: Cambridge University Press).


- 55 -
Lindsey, Brink, and Dan Ikenson, 2001, “Coming Home to Roost: Proliferating Antidumping Laws and the Growing Threat to U.S. Exports,” July (Washington: Cato Institute).
Martin, John P., 1998, “Can Labour Market Policies Spur Worker Adjustment and Help Reduce Unemployment?” (Paris: OECD), mimeo.
Mattoo, Aaditya, Devesh Roy, and Arvind Subramanian, 2002, “The Africa Growth and Opportunity Act: Rules of Origin and the Impact on Market Access,” IMF Working Paper WP/02, May (Washington: International Monetary Fund).
Nogues, Julio, 2002, “Comments to the papers by Andrew Berg and Anne O. Krueger on: ‘Trade, Growth and Poverty’, and L. Alan Winters on: ‘Doha and the World Poverty Targets’,” presented at the fourteenth session of the Annual Bank Conference on Development Economics, The World Bank, Washington, April 29-30,
Organization for Economic Cooperation and Development, 1995, “Transfer Efficiency of Adjustment in OECD Agriculture: Issues and Policy
Responses, (Paris).
—————, 1996, Agricultural Policies, Markets, and Trade in OECD Countries (Paris).
—————, 1999, Agricultural Policies in OECD Countries: Monitoring and Evaluation (Paris).
—————, 2001a, Agricultural Policies in Emerging and Transition Economies: Special Focus on Non-Tariff Measures (Paris).
—————, 2001b, Market Effects of Crop Support Measures (Paris).
—————, 2001c, State Trading Enterprises in Agriculture (Paris).
—————, 2001d, The Development Dimensions of Trade (Paris).
—————, 2002a, Agricultural Policies in OECD Countries: Monitoring and Evaluation (Paris).
—————, 2002b, Agriculture and Trade Liberalization: Extending the Uruguay Round Agreement, (Paris).
Otsuki, Tsunehiro, John S. Wilson, and Mirvat Sewadeh, 2001, “A Case Study of Food Safety Standards and African Exports,” World Bank Working Paper No. 2563.
Otsuki, Tsunehiro, John S. Wilson, and Mirvat Sewadeh, 2001, “Saving Two in a Billion: A Case Study to Quantify the Trade Effect of European Food Safety Standards on African Exports,” Development Research Group (Washington: World Bank), mimeo.
Oxfam, 2002, Rigged Rules and Double Standards: Trade, Globalisation, and the Fight Against Poverty, Oxfam International.
Ozden, C., and E. Reinhardt, 2002, “The Perversity of Preferences: GSP and Developing Country Trade Policies, 1976-2000” (Atlanta: Emory University), mimeo.
- 56 -
Schiff, Maurice, and Alberto Valdes, 1992, The Political Economy of Agricultural Pricing Policy: A Synthesis of the Economics in Developing Countries, Volume 4 (Baltimore and London: Johns Hopkins University Press).
Spinanger, Dean, 1999, “Faking Liberalization and Finagling Protectionism: The ATC at its Best” (Kiel: Kiel Institute of World Economics).
Strengg, Werner, 2001, “Textile and Clothing Industry in the EU: A Survey,” Enterprise Papers, No. 2 (Brussels).
Trela, Irene, and John Whalley, 1995, “Internal Quota-allocation Schemes and the Costs of the MFA,” Review of International Economics, Vol. 3:284-306, October.
Tyers, Rod, and Kym Anderson, 1992, Disarray in World Food Markets: A Quantitative Assessment (Hong Kong: Cambridge University Press).
United Nations Conference on Trade and Development and the Commonwealth Secretariat, 2001, Duty and Quota Free Market Access for LDCs: An Analysis of Quad Initiatives, UNCTAD/DITC/TAB/Misc.7 (Geneva).
——, 2002, Trade and Development Report, 2002: Developing Countries in World Trade (New York and Geneva).
United States International Trade Commission, 1999, Industry and Trade Summary: Apparel, USITC Publication 3169 (Washington).
——, 2002, Economic Effects of Significant U.S. Import Restraints, 3rd Update 2002, Investigation No. 332-325, Publication 3519, June (Washington: USITC).
Winters, L. Alan, 2002, “Doha and the World Poverty Targets,” paper prepared for the Annual Bank Conference on Development Economics, The World Bank, Washington, April.
World Bank, 2002a, Global Economic Prospects 2002: Making Trade Work for the World’s Poor (Washington)
——, 2002b, “Leveraging Trade for Development: The World Bank Group’s Agenda,” SCM2002-0221 (Washington).
——, 2002c, Development, Trade and the WTO: A Handbook (Washington).
World Trade Organization, 2001a, Market Access: Unfinished Business: Post-Uruguay Round Inventory and Issues (Geneva).
——, 2001b, Comprehensive Report of the Textiles Monitoring Body to the Council for Trade in Goods on the Implementation of the Agreement on Textiles and Clothing During the Second Stage of the Integration Process, G/L/459 (Geneva).
——, 2001c, Protocol on the Accession of the People’s Republic of China, WT/ACC/CHN/49, October (Geneva).
——, 2002a, Annual Report (Geneva).

- 57 -
——, 2002b, Trade Policy Review of the European Union (Geneva).
Yang, Yongzheng and Weiming Tian, eds., 2000, China’s Agriculture at the Crossroads (Houndmills: Macmillan Press Limited).