Embed Size (px)
Citation preview

1
Marked seasonal variation in the wild mouse gut microbiota 1
Corinne F. Maurice1+, Sarah Knowles2,3+, Joshua Ladau4, Katherine S. Pollard4,5, Andy 2
Fenton6, Amy B. Pedersen2, and Peter J. Turnbaugh1,7* 3
4
1FAS Center for Systems Biology, Harvard University, 52 Oxford St, Cambridge, MA 5
02138, USA 6
2Centre for Immunity, Infection and Evolution (CIIE), School of Biological Sciences, 7
University of Edinburgh, West Mains Road, Edinburgh, EH9 3JT, UK 8
3Department of Infectious Disease Epidemiology, Imperial College London, St. Mary’s 9
Campus, Norfolk Place, London W2 1PG 10
4Gladstone Institutes, 1650 Owens St, San Francisco, CA 94158, USA 11
5Institute for Human Genetics and Division of Biostatistics, University of California San 12
Francisco, 1650 Owens St, San Francisco, CA 94158, USA 13
6Institute of Integrative Biology, University of Liverpool, Biosciences Building, Crown 14
Street, Liverpool, L69 7ZB, UK 15
7Department of Microbiology and Immunology, Hooper Foundation, University of 16
California San Francisco, 513 Parnassus Ave, San Francisco, CA 94143, USA 17
18
*Correspondence: [email protected] 19
+Authors contributed equally. 20
21
Running title: The wild mouse gut microbiota changes seasonally. 22
Subject Category: Microbe-microbe and microbe-host interactions. 23
24

2
Abstract 25
Recent studies have provided an unprecedented view of the microbial communities 26
colonizing captive mice; yet the host and environmental factors that shape the rodent 27
gut microbiota in their natural habitat remain largely unexplored. Here, we present 28
results from a two-year 16S rRNA gene sequencing-based survey of wild wood mice 29
(Apodemus sylvaticus) in two nearby woodlands. Similar to other mammals, wild mice 30
were colonized by 10 bacterial phyla and dominated by the Firmicutes, Bacteroidetes, 31
and Proteobacteria. Within the Firmicutes, the Lactobacillus genus was most abundant. 32
Putative bacterial pathogens were widespread and often abundant members of the wild 33
mouse gut microbiota. Among a suite of extrinsic (environmental) and intrinsic (host) 34
related factors examined, seasonal changes dominated in driving qualitative and 35
quantitative differences in the gut microbiota. In both years examined, we observed a 36
strong seasonal shift in gut microbial community structure, potentially due to the 37
transition from an insect- to a seed-based diet. This involved decreased levels of 38
Lactobacillus, and increased levels of Alistipes (Bacteroidetes phylum) and 39
Helicobacter. We also detected more subtle but statistically significant associations 40
between the gut microbiota and biogeography, sex, reproductive status, and co-41
colonization with enteric nematodes. These results suggest that environmental factors 42
play a major role in shaping temporal variations in microbial community structure within 43
natural populations. 44
45
Key words: biogeography / gut microbiota / intestinal nematode / nutrition / wild mice 46
47
48

3
Introduction 49
Mammals are home to trillions of microbes in their gastrointestinal tract (the gut 50
microbiota), which impact multiple aspects of host health and disease (Sommer and 51
Backhed 2013). Elucidating the ecological and evolutionary processes that shape host-52
associated microbial communities remains a major outstanding goal (Costello et al 53
2012). Laboratory rodents are a valuable tool to dissect the relative contributions of 54
intrinsic and extrinsic factors (Carmody et al 2015); however, it remains unclear if these 55
interactions can be generalized to mammals in their natural habitat. Recent studies 56
have provided an initial view into the ecological factors linked to inter-individual 57
variations in the gut microbiotas of wild animals. Comparative analyses suggest that diet 58
is a major environmental factor contributing to gut microbial variation between 59
mammalian species (Muegge et al 2011). Diet also shapes the gut microbiota within a 60
species, as evidenced by longitudinal analyses of the black howler monkey gut 61
microbiota (Amato et al 2013, Amato et al 2015) and dietary perturbation experiments in 62
wild-caught mice and fish (Bolnick et al 2014, Wang et al 2014). Biogeographic variation 63
in the gut microbiota at large spatial scales has also been reported in house mice 64
(Linnenbrink et al 2013). Finally, host-specific factors like co-colonization with enteric 65
parasites (Hayes et al 2010, Keeney and Finlay 2011) and host genetics (Benson et al 66
2010, Goodrich et al 2014, McKnite et al 2012, Ochman et al 2010) may also contribute 67
to inter-individual and temporal variations in gut microbial community structure. 68
Yet the relative strengths of these various factors, and their interactions, remains 69
unclear due to the lack of systematic analyses that monitor both intrinsic and extrinsic 70
factors in natural populations. Such an analysis would require tractable systems 71

4
wherein host factors, environmental parameters, and temporal variations in the gut 72
microbiota can be monitored in situ. Here, we report findings from such a study in well-73
characterized populations of wood mice (Apodemus sylvaticus) in the UK, which we 74
monitored for two years. We simultaneously measured multiple environmental (season, 75
location, population density) and host (age, sex, reproductive status, parasite infection 76
status) parameters, and repeatedly sampled multiple individuals over time. Using this 77
data, we examine the relative importance of environmental and intrinsic host factors in 78
shaping gut microbial community variation between and within individuals over time. We 79
discovered a notable seasonal variation in gut microbial community structure, which we 80
propose is due to changes in host dietary intake. We also found evidence for an impact 81
of spatial structure over a smaller scale than previously reported, reproductive status, 82
and nematode colonization. Together, our results provide an initial view of the wild wood 83
mouse gut microbiota and support the hypothesis that environmental factors such as 84
changes in food availability and subsequent dietary intake play a dominant role in 85
shaping wild mammal gut microbial communities. 86
87
Materials and Methods 88
Sample collection 89
In 2010 and 2011, A. sylvaticus were trapped on six grids in two mixed woodlands 90
(Manor and Haddon Wood; Figure S1) on the Wirral peninsula, UK. On each grid, two 91
live traps baited with grain and bedding material were placed every 10 meters in a 70m 92
x 70m square, and trapped monthly from May to November for three consecutive nights 93
in both years. In 2011, trapping was also performed for two consecutive nights during 94

5
one additional week in each of the months August, September, October, and 95
November, though no treatments were given. Trapped animals were tagged using 96
subcutaneous passive integrated transponder tags, so they could be individually 97
identified upon recapture. Fecal samples were collected from all traps containing a 98
single animal and stored in 10% buffered formalin for identification of gut parasites 99
(Knowles et al 2013). A sub-sample was also collected for characterization of the gut 100
microbiota, which was frozen at -80oC within 8 hours of collection. In order to assess the 101
potential effect of overnight temperature on gut microbial communities, we retrieved 102
temperature data for each sampling night from the Hawarden Chester airport weather 103
station near our field sites between the hours of 6pm and 12pm, the time from which 104
mice could enter traps, to when we collected fecal samples. 105
106
Host phenotyping 107
Animals were aged as either juvenile, sub-adult, or adult according to pelage in the first 108
instance, with body mass used as a secondary trait where pelage was inconclusive 109
(Juvenile<12g, Sub-Adult: 12-16g, Adult>16g). Body length, weight, sex, and 110
reproductive status were recorded. Animals were characterized as being either 111
reproductively active (descended or protruding testes for males, pregnant or with a 112
perforate vagina for females) or inactive. A subset of the mice were given anti-parasitic 113
treatments, including Ivermectin and Toltrazuril (2010), and Ivermectin, Fipronil, 114
Pyrantel pamoate, or two-drug combinations (2011). We did not detect any significant 115
impact of treatment on the gut microbiota (Table 1). Blood samples were tested for 116
Bartonella using a nested PCR assay (Knowles et al 2013). 117

6
118
119
16S rRNA gene sequencing and analysis 120
16S rRNA gene sequencing was performed on fecal samples collected from each trap 121
to characterize the distal gut microbiota (n=481 samples, 196,555±24,236 sequences 122
per sample; Table S1). DNA was extracted using the PowerSoil bacterial DNA 123
extraction kit (MoBio, Carlsbad CA), and the V4 region of the 16S rRNA gene was PCR-124
amplified in triplicate using custom barcoded universal bacterial primers with the 125
following protocol: 94°C for 3 min, 35 cycles of 94ºC for 45 sec, 50°C for 30 sec, and 126
72°C for 90 sec, with a final extension at 72°C for 10 min (Maurice et al 2013). 127
Triplicates were pooled, confirmed by gel electrophoresis, cleaned with the Ampure XP 128
kit (Agencourt, Danvers, MA), quantified using the Quant-iT Picogreen dsDNA Assay Kit 129
(Invitrogen, Carlsbad, CA), and sequenced on the Illumina HiSeq platform. 16S rRNA 130
gene sequences were analyzed using the QIIME software package (Caporaso et al 131
2010). All sequences were used for the comparison of the relative abundance of 132
bacterial taxa. Operational taxonomic units (OTUs) were assigned at 97% similarity 133
against the Greengenes database (DeSantis et al 2006), which we trimmed to span only 134
the 16S rRNA region flanked by our sequencing primers (positions 521-773). LefSe 135
(Segata et al 2012a) was run on sub-sampled datasets, after filtering out species-level 136
phylotypes with <100 sequences or found in only 1 sample. Statistical analysis of Bray-137
Curtis dissimilarities calculated using the relative abundance of bacterial genera was 138
conducted using RStudio (ver. 0.98.1091) and the adonis function in the R package 139
"vegan" (Oksanen et al 2015). Only the first sample was included for each mouse to 140

7
avoid artifacts caused by within animal comparisons. Significance values were 141
computed using 10,000 permutations. 142
143
Parasite diagnosis 144
Gastrointestinal parasites (nematodes, cestodes and Eimeria protozoa) were detected 145
using the salt flotation technique (Pritchard and Kruse 1982). Saturated salt solution 146
was added to formalin-preserved fecal samples, such that eggs and oocysts in each 147
sample could be concentrated on a coverslip, and scanned for parasite detection at 10x 148
magnification. 40x magnification was used for parasite identification and making 149
parasite species-specific egg/oocyst counts. Coccidia (species belonging to the genus 150
Eimeria) were identified using unsporulated oocyst morphology (Nowell and Higgs 151
1989), and helminths using egg morphology. For each parasite species, the number of 152
eggs or oocysts per gram of feces was calculated for each sample. When multiple 153
samples were present for an individual within a 3-day trapping period, the arithmetic 154
mean egg/oocyst count was taken across these days. The dominant parasites detected 155
were nematodes (largely Heligmosomoides polygyrus) and coccidia, and thus our 156
analyses focus on these two parasite groups. 157
158
Linear mixed models 159
We performed linear mixed models (LMMs) using the lme4 package in R v.3.0.1 (Bates 160
et al 2013). We controlled for repeated sampling of individual mice by including 161
individual ID as a random intercept term. Model assumptions were checked by 162
examining the distribution of residuals and plotting fitted values against residuals; 163

8
response variables were square root or log-transformed where necessary to ensure 164
model assumptions were met. For models of individual genera, only samples with non-165
zero abundance were included. In all starting models, the same set of predictors was 166
included: temperature, grid, month, year, age, sex, nematode infection status, Eimeria 167
infection status, drug treatment, and reproductive status. Several interaction terms were 168
included: year by month; reproductive status by sex; and parasite infection variables by 169
treatment. Only samples for which full metadata on all the above metrics were available 170
were included (Table S2). All models were initially simplified by backwards-stepwise 171
elimination of terms with p-value>0.10, beginning with interactions, and the final minimal 172
model included only terms with p-value <0.05. Adjusted p-values (q-values) were 173
calculated based on the 'Graphically Sharpened' False Discovery Rate (FDR) method 174
(Pike 2011). 175
176
Spatial structuring of microbial communities 177
Since wood mice are territorial and have home ranges smaller than our trapping grids 178
(Godsall et al 2014), fine-scale spatial variation in microhabitat and food availability 179
could influence gut microbial ecology, both within and across our trapping grids. To test 180
for biogeographic effects at this scale, we examined spatial autocorrelation in the gut 181
microbiota according to mouse capture location. Spatial autocorrelations were 182
measured using the Moran's I statistic (Moran 1950). Only the first sample was included 183
for each mouse to avoid artifacts caused by within animal comparisons. Genera found 184
in ≥10 samples (or mice) were analyzed, along with the first principal coordinates from 185
our Bray-Curtis, unweighted UniFrac, and weighted UniFrac analyses. We used a 186

9
binary spatial weights matrix, with spatial neighborhoods defined as being 0-50m apart. 187
Data from Manor and Haddon woods were analyzed both together and separately. To 188
control for temporal trends, we restricted our analysis to samples collected between 189
August and November and analyzed the two years separately. Spatial weight matrices 190
were row-standardized. The significance of Moran's I values was assessed with 191
permutation tests, coded using a Markov chain Monte Carlo algorithm. For each p-192
value, ten chains of length 1,000,000 were run, each starting from a random initial 193
permutation. These settings were judged to give good chain convergence based on 194
examination of running mean plots. We used the software packages GeoDa and PySAL 195
(https://geodacenter.asu.edu). Batch scripts/code are available upon request. 196
197
Results 198
The wild mouse gut harbours abundant Lactobacilli and putative enteric pathogens 199
Consistent with results in captive and wild mammals (Ley et al 2008a), wild wood mice 200
were colonized by 10 bacterial phyla: Firmicutes (52.1±1.0% 16S rRNA gene 201
sequences; mean±stdev), Bacteroidetes (37.0±0.9%), Proteobacteria (8.2±0.5%), 202
Actinobacteria (1.1±0.2%), Tenericutes (0.9±0.1%), Defferibacteres (0.4±0.1%), 203
Cyanobacteria (0.3±0.03%), Verrucomicrobia (0.03±0.03%), Fusobacteria 204
(0.01±0.01%), and TM7 (0.004±0.0004%) (Figure 1a). Within the Firmicutes, the 205
dominant bacterial order was the Lactobacillales (genus: Lactobacillus) (Figures 1b,S2). 206
We also observed multiple α-, ε-, and γ-Proteobacterial genera that include potential 207
bacterial pathogens: e.g., Bartonella, Helicobacter, Pseudomonas, Rickettsiella, and 208
Yersinia (Figures 1b,S2, Table S3). All nine of the mice with detectable fecal Bartonella 209

10
also tested positive in time-matched blood samples, leading to a significant association 210
between blood and fecal detection of this genus (p-value<0.05, 2 test). Many of these 211
genera were widespread, most notably Helicobacter (97.9% of samples), Pseudomonas 212
(73.2%), and Yersinia (44.5%). The same was true for intestinal parasites (Table S4), 213
including Heligmosomoides polygyrus (40%) and Eimeria hungaryensis (29.3%). 214
215
Marked seasonal variation in microbial community structure 216
Analysis of Bray-Curtis dissimilarity among samples revealed a clear seasonal pattern 217
differentiating samples collected in the spring/early summer (May through July) and 218
those collected in late summer/fall (August through November) [Figures 2a,S3; p-219
value<0.001, PERMANOVA of Bray-Curtis distances]. The observed seasonal shift in 220
the microbiota coincides with the expected timing of an annual transition to a seed-221
based diet from a more insect-based diet (Watts 1968), and may therefore be driven by 222
a seasonal shift in food availability and diet. Consistent with this hypothesis, the mean 223
microbial community structure for each month was significantly correlated between the 224
two years (Figure 2b; R2=79%, p-value<0.01). The association between season and 225
microbial community structure was significant in both years when considered 226
independently, although the difference was more dramatic in 2010 [pseudo-F 227
value=31.2 (2010) versus 9.9 (2011), p-value<0.001 for both years; PERMANOVA test]. 228
Statistical analysis with the LefSe software package revealed taxonomic groups ranging 229
from the phylum- to genus-level that were consistently associated with season in both 230
years (Table S5). Lactobacillus was found at a significantly higher abundance in the 231

11
spring of both years, whereas Alistipes and Helicobacter were consistently enriched in 232
the fall (Figure 2c). 233
Analysis of mice captured multiple times within a year confirmed that these 234
microbial changes occurred within individuals and were not simply due to mouse 235
population turnover (i.e. seasonal changes in the types of individual captured). We 236
observed within-individual shifts in microbiota structure in both years of the study that 237
followed the overall population trend (Figure S4). This was reflected by a strong positive 238
correlation between month-to-month differences in the mean population-wide value for 239
Bray-Curtis principal coordinates 1 and 2 (excluding repeat captured individuals) and 240
the mean within-individual change in these metrics (PC1 R2=65%; PC2 R2=56%; both p-241
value<0.05, linear regression; Figures 3a,b). Analysis of 25 mice captured in both 242
seasons confirmed that in nearly all cases there was a consistent direction of change 243
(Figure 3c; p-value<0.0001, Wilcoxon rank-sum test). 244
245
Limited spatial heterogeneity in community structure 246
While microbial community structure differed significantly between the two woodlands 247
(p-value<0.001, PERMANOVA of Bray-Curtis dissimilarities), this effect was noticeably 248
weaker than that of season: pseudo-F value=35.3 (season) versus 4.6 (wood) when 249
considering both years. Consistent with this weak effect, LefSe analysis only identified 250
two nested taxa that were significantly enriched in Manor Wood: the Clostridia class and 251
the Clostridiales order (LDA>2, p-value<0.05). We did not detect any taxa that were 252
significantly enriched in Haddon Wood. 253

12
In order to quantify the spatial structure of the wild mouse gut microbiota in more 254
detail, we evaluated spatial autocorrelation at the genus level and using community 255
dissimilarity metrics (see Methods). In 2010, we detected significant spatial 256
autocorrelation for the Bray-Curtis and unweighted UniFrac metrics (Figure 4; q-257
value<0.01). However, these patterns were weaker and only present for unweighted 258
UniFrac in 2011, and were absent in all cases when we only considered samples from 259
Haddon or Manor wood. Similarly, analyses of bacterial genera failed to detect 260
significant spatial autocorrelation for 117 of the 117 tested groups during either year (q-261
value<0.01). Moreover, the maximum Moran's I value for this distance class was 0.138, 262
further indicating nonexistent or weak spatial associations. Together, these analyses 263
suggest that although the overall pattern of microbial community structure was distinct 264
between Haddon and Manor Wood, there was no evidence for finer spatial structure 265
within woods or between individual bacterial genera. 266
267
Multivariate modelling reveals associations with both host and environmental factors 268
We next used linear mixed models (LMMs; see Methods) to tease apart the relative 269
influence of multiple environmental and host factors, and to determine their effects in 270
isolation of confounding factors. We constructed 6 models for community dissimilarity 271
metrics (principal coordinates 1 and 2 for Bray-Curtis, unweighted UniFrac, and 272
weighted UniFrac) as well as separate models for the 10 most abundant bacterial 273
genera (Table 1). Overall, these analyses suggest that the wood mouse gut microbiota 274
is primarily shaped by environmental factors, with significant evidence for both temporal 275
(see “Year” and “Month” columns) and spatial structuring (see “Grid” column). These 276

13
temporal trends could not simply be explained by seasonal variation in temperature 277
(Figure S5), since they were unaltered by inclusion of overnight temperature as a 278
covariate (Table 1). For all community dissimilarity metrics examined and most 279
individual genera, our minimal models included a significant year by month interaction 280
term, indicating seasonal differences that varied somewhat across the two years 281
investigated. If these interaction terms were dissolved into their component terms, 282
strong main effects of month were observed in nearly all models, with effects of year 283
also common though generally weaker. Consistent with our prior analysis of spatial 284
autocorrelation, there was a strong association between the community dissimilarity 285
metrics and trapping grid with weaker associations at the genus level. We also detected 286
association between some metrics and local population density at the time of capture 287
(Table 1). 288
To a lesser extent than extrinsic factors like season and year, host factors such 289
as reproductive status and sex were associated with microbial community structure, 290
sometimes in the form of an interaction between these two terms (Table 1). For 291
example, the abundance of Lactobacillus was higher in reproductively active than non-292
active females, but did not depend on reproductive status for males (Figure 5a). We 293
also detected associations between the gut microbiota and intestinal parasites. In 294
particular, nematode infections were inversely associated with the abundance of the 295
most abundant Lachnospiraceae genus and positively associated with the genus 296
Escherichia (Figure 5b). However, no significant associations between coccidia infection 297
or anti-parasite treatment and the gut microbiota were found, possibly due to the 298
transient nature of the intervention (monthly treatment intervals; see Methods). Age-299

14
related differences were rare, with Alistipes the only one of the ten most abundant 300
bacterial genera associated with host age, showing an increase across the age groups 301
from juvenile to adult (Table 1). 302
To illustrate how much variation in Bray-Curtis principal coordinates 1 and 2 was 303
explained by environmental factors like month and year, compared to host-related 304
factors, we calculated marginal R2 statistics from our linear mixed models, using the 305
methods described by (Nakagawa and Schielzeth 2013). These are equivalent to 306
classic R2 statistics for linear models, indicating the percentage of variation explained by 307
a given set of predictor variables (fixed effects). For both Bray-Curtis PC1 and PC2, 308
month (i.e. seasonal differences) explained a much larger proportion of variance than 309
year (Table S6). Inclusion of year when month was already present in the model 310
provided little additional explanatory power (PC1: R2GLMM(m) =43.9% with month only vs. 311
48.7% with month and year; PC2: R2GLMM(m) = 10.1% with month only vs. 10.5% with 312
month and year). Furthermore, allowing the seasonal effect to vary among years (by 313
inclusion of a month*year interaction term) yielded limited additional explanatory power 314
for PC1 (R2GLMM(m) =52% vs 49% variance explained), with a 2-fold increase in variance 315
explained for PC2 (R2GLMM(m) =19.5% vs 10% variance explained). 316
Thus, seasonal differences in the gut microbiota appear to dominate the 317
differences between years and are largely consistent across years, in agreement with 318
our earlier analyses (Figure 2). Host-related factors (age, sex, reproductive state), 319
enteric parasite infections, and host density explained some additional variance (12% 320
more for PC1 and 8% more for PC2 than models with only month and year terms), 321
though their contribution was again smaller than the strong seasonal effects, particularly 322

15
for PC1 (Table S6). Individual identity explained 18% of the variation in Bray-Curtis PC1 323
even after including all other factors. We confirmed these trends by analyzing the entire 324
Bray-Curtis dissimilarity matrix according to season, host sex, and wood (see Methods). 325
Although all three factors showed a significant effect, seasonal effects explained more 326
variation (R2=13.3%, p-value<10-4) than either host sex (R2=0.8%, p-value<0.05) or 327
spatial structure (R2=0.8%, p-value<0.05). 328
329
Discussion 330
At the phylum level, the wild mouse gut microbiota is comparable to that of other 331
mammals (including humans) with two major groups, the Firmicutes and Bacteroidetes, 332
accounting for ~90% of the 16S rRNA gene sequencing reads (Ley et al 2008a, Muegge 333
et al 2011). We also detected high levels of the Lactobacillus genus (phylum: 334
Firmicutes; order: Lactobacillales) constituting up to one-third of the community, similar 335
to other omnivorous mammals, such as bears, squirrels, and lemurs (Figure S6). These 336
results confirm that to a large degree the mammalian gut microbiota assembles in a 337
reproducible fashion regardless of the host species (Ley et al 2008a, Muegge et al 338
2011), reflective of the restricted set of microorganisms that have adapted to life in the 339
gastrointestinal tract (Ley et al 2008b). 340
In contrast to “specific pathogen free” laboratory mice, we detected widespread 341
colonization by bacterial taxa that contain enteric pathogens, including Helicobacter and 342
other Proteobacteria. However, given the resolution of our sequencing methods and the 343
limited studies of wild mouse pathogens we cannot exclude the fact that these are 344
commensal strains. Despite this important caveat, our results are consistent with 345

16
previous reports indicating that wild house mice can be reservoirs of diverse 346
Helicobacter strains capable of infecting humans and other vertebrates (O'Rourke et al 347
2001, Parker et al 2009, Wasimuddin et al 2012). We observed that Helicobacter 348
abundance increased in late summer/fall, when Lactobacillus levels are low. This might 349
suggest that Lactobacillus confers protection against infection as has been 350
demonstrated in laboratory mice (Eaton et al 2011, Kabir et al 1997, Medellin-Pena and 351
Griffiths 2009, Pena et al 2005). Alternatively, immune status (i.e., IL-22 deficiency) has 352
been linked to the abundance of Lactobacillus (Zenewicz et al 2013), potentially 353
suggesting that these seasonal changes might be in part driven by the host response to 354
bacterial infection. Additional studies will be necessary to determine how the immune 355
system of these mice tolerates long-term enteric pathogen colonization and to 356
characterize the reciprocal interactions between these enteric pathogens and the 357
commensal gut microbiota. 358
The wild mouse gut microbiota underwent a consistent seasonal shift in both 359
years, with a decrease in Lactobacillus and concomitant increases in Alistipes, 360
Helicobacter, and the Lachnospiraceae family (phylum: Firmicutes). A possible 361
explanation is that mid-summer represents a transition from a diet rich in insects to a 362
diet primarily composed of seeds (Watts 1968), coincident with the annual seed fall, 363
which usually starts in late July in UK woodlands (Gurnell 1993). Thus, we propose that 364
seasonal patterns in dietary intake drive variations in the gut microbial community 365
structure of wild wood mice. Differences in the timing, extent, and tree species 366
composition of seed fall, which can vary markedly between years (Gurnell 1993), may 367
explain the observed variation between years in the magnitude of the seasonal 368

17
microbiota transition observed. Notably, a recent study of rural human subjects from 369
South Dakota revealed differences in the gut microbiota in summer relative to winter 370
(Davenport et al 2014), suggesting that seasonal reconfigurations may be a conserved 371
feature of host-associated microbial communities. 372
If diet is indeed the dominant factor it still remains unclear what specific 373
components of the diet might drive the observed changes to gut microbial community 374
structure. The elevated levels of Alistipes in the fall may be reflective of increased bile 375
acid levels triggered by an increased consumption of fat, as seen in a recent human 376
dietary intervention study (David et al 2014). Members of the Lachnospiraceae family, 377
including Eubacterium rectale and Roseburia, have been linked to the fermentation of 378
dietary plant polysaccharides in human studies (David et al 2014, Duncan et al 2007), 379
and were also enriched in the fall coinciding with the increased access to plant seeds. 380
Similarly, the source and/or dietary trigger of Lactobacillus (often a minor member of the 381
mammalian distal gut microbiota) also remains unclear. Lactobacillus is often found in 382
fermented foods (Wolfe et al 2014), raising the possibility that their elevated abundance 383
early in the year may be driven by its cultivation in wood mouse food stores over winter. 384
Alternatively, seasonal changes in mouse physiology, including torpor and 385
reduced food consumption during winter, could also play a role in the observed 386
seasonal trends. Indeed, seasonal restructuring of the gut microbiota has recently been 387
observed in ground squirrels under controlled laboratory conditions (Carey et al 2013). 388
These shifts coincided with hibernation, suggesting they are driven by a shift from 389
dietary to host-derived substrates. We detected similar patterns in wild rodents, 390
including a decrease in the relative abundance of Lactobacillus and an increase in 391

18
Alistipes from spring/early summer to late summer/fall. Although wood mice do not 392
hibernate they are subject to daily torpor in conditions of low temperature and food 393
restriction. Thus, it is possible that the seasonal microbial shifts seen here may be 394
driven by the transition to a state of intermittent torpor. 395
What are the potential consequences of the observed seasonal shifts in gut 396
microbial community structure? Recent human intervention studies have shown rapid 397
and reproducible changes in microbial community structure and function upon 398
consumption of an animal- versus plant-based diet (David et al 2014). These results, 399
considered together with the current findings from wild wood mice, make it tempting to 400
speculate that the mammalian gut microbiota may provide a rapid way to optimize 401
caloric intake given volatile shifts in the availability of different foods. Microbial 402
communities that could rapidly shift their metabolic activity in response to changes in 403
host dietary intake could have enhanced dietary flexibility, likely increasing the fitness of 404
the host and its microbial consortia. 405
We also found significant but weak evidence for spatial structure, unlike the more 406
robust associations with geographic region found in recent studies of house mice 407
(Linnenbrink et al 2013), wild primates (Degnan et al 2012), and humans (Yatsunenko 408
et al 2012). The significant spatial structure that we did find was evident only in 409
community-wide metrics when comparing between woods. Individual bacterial genera 410
showed no spatial structure, and no spatial structuring was evident within woods at 411
either the community or individual genus levels. These results emphasize that the gut 412
microbiota of these wild mouse populations is primarily shaped by factors that are not 413
spatially structured at the scales that we considered. These results suggest that either 414

19
(i) microbial dispersal occurs efficiently over distances far greater than the host range 415
evaluated here and/or (ii) the observed bacterial taxa are long-term and stable residents 416
of the wild wood mouse gut microbiota. Strain-level analyses of the gut microbiota (Faith 417
et al 2013, Segata et al 2012b) could help determine if there are finer differences 418
between woods, or among areas within each wood. Furthermore, surveying wild mice 419
across more distant sites could provide additional insight into broader biogeographical 420
patterns. 421
Our linear mixed models revealed significant associations with reproductive 422
status and intestinal parasites. Consistent with these findings, recent studies indicate 423
that the human gut microbiota is altered during pregnancy (Koren et al 2012), and 424
studies in laboratory mice have shown that infection by the nematodes Trichuris muris 425
depends on the gut microbiota (Hayes et al 2010). The associations between intestinal 426
nematodes and the bacterial genera Escherichia (positive) and Lachnospiraceae 427
(negative) support recent studies in humans and animal models (Rausch et al 2013, 428
Walk et al 2010), though we did not find the specific association between H. polygyrus 429
and relative Lactobacillus abundance, as recently reported in laboratory mice (Reynolds 430
et al 2014). Whether the associations found result from an altered immune response of 431
the host or from direct interactions between the intestinal parasites and the gut 432
microbiota remains to be elucidated. Determining the causal direction and underlying 433
mechanisms of these interactions will require more extensive longitudinal analyses of 434
wild mice before and after helminthic infection, as well as controlled studies using 435
captured and/or captive mice. 436

20
In conclusion, despite the common use of laboratory mice to study the 437
environmental and host factors that shape host-associated microbial communities, we 438
still know very little about their natural state. Our results provide an initial view of the 439
wild wood mouse gut microbiota, emphasizing commonalities between mammals, but 440
also the importance of considering temporal variations in nutritional status, enteric 441
pathogens, reproductive status, and parasite burden in setting the stage for host-442
microbial interactions. Follow-up observational and interventional studies of wild mice, 443
paired with an in-depth analysis of dietary intake, are necessary to test the hypothesis 444
that the observed seasonal trends are due to changes in diet, and could provide a 445
complementary and tractable approach towards better understanding the causes and 446
consequences of inter-individual variations in the mammalian gut microbiota. 447
448
Acknowledgements 449
Claire Reardon and Christian Daly for sequencing support; Rachel Carmody, Lawrence 450
David, and Clint Cario for helpful discussions. This work was supported by grants from 451
the Natural Environmental Research Council (NE/G006830/1, NE/G007349/1; ABP,AF), 452
the National Institutes of Health (P50 GM068763; PJT), the Harvard Bauer Fellows 453
program, the National Science Foundation (DMS-1069303; KSP), the Gordon and Betty 454
Moore Foundation (grant #3300; KSP), the Wellcome Trust (AP fellowship from a 455
Strategic Grant to CIIE, 095831), and a gift from the San Simeon Fund (KSP). 456
Sequencing reads are in MG-RAST (Meyer et al 2008) under the accession number 457
12064. 458
459

21
Conflict of Interest 460
The authors declare no conflict of interest. 461
462
Supplementary information is available at The ISME Journal's website. 463
464
References 465
Amato KR, Yeoman CJ, Kent A, Righini N, Carbonero F, Estrada A et al (2013). Habitat 466
degradation impacts black howler monkey (Alouatta pigra) gastrointestinal 467
microbiomes. ISME J 7: 1344-1353. 468
Amato KR, Leigh SR, Kent A, Mackie RI, Yeoman CJ, Stumpf RM et al (2015). The Gut 469
Microbiota Appears to Compensate for Seasonal Diet Variation in the Wild Black 470
Howler Monkey (Alouatta pigra). Microb Ecol 69: 434-443. 471
Bates D, Maechler M, Bolker B (2013). lme4: Linear mixed-effects models using S4 472
classes R package version 0.999999-2. edn. 473
Benson AK, Kelly SA, Legge R, Ma F, Low SJ, Kim J et al (2010). Individuality in gut 474
microbiota composition is a complex polygenic trait shaped by multiple 475
environmental and host genetic factors. Proc Natl Acad Sci USA 107: 18933-18938. 476
Bolnick DI, Snowberg LK, Hirsch PE, Lauber CL, Knight R, Caporaso JG et al (2014). 477
Individuals' diet diversity influences gut microbial diversity in two freshwater fish 478
(threespine stickleback and Eurasian perch). Ecol Lett 17: 979-987. 479
Caporaso JG, Kuczynski J, Stombaugh J, Bittinger K, Bushman FD, Costello EK et al 480
(2010). QIIME allows analysis of high-throughput community sequencing data. Nat 481
Methods 7: 335-336. 482

22
Carey HV, Walters WA, Knight R (2013). Seasonal restructuring of the ground squirrel 483
gut microbiota over the annual hibernation cycle. Am J Physiol Regul Integr Comp 484
Physiol 304: R33-42. 485
Carmody RN, Gerber GK, Luevano JM, Jr., Gatti DM, Somes L, Svenson KL et al 486
(2015). Diet dominates host genotype in shaping the murine gut microbiota. Cell 487
Host Microbe 17: 72-84. 488
Costello EK, Stagaman K, Dethlefsen L, Bohannan BJ, Relman DA (2012). The 489
application of ecological theory toward an understanding of the human microbiome. 490
Science 336: 1255-1262. 491
Davenport ER, Mizrahi-Man O, Michelini K, Barreiro LB, Ober C, Gilad Y (2014). 492
Seasonal variation in human gut microbiome composition. PLoS One 9: e90731. 493
David LA, Maurice CF, Carmody RN, Gootenberg DB, Button JE, Wolfe BE et al (2014). 494
Diet rapidly and reproducibly alters the human gut microbiome. Nature 505: 559-495
563. 496
Degnan PH, Pusey AE, Lonsdorf EV, Goodall J, Wroblewski EE, Wilson ML et al 497
(2012). Factors associated with the diversification of the gut microbial communities 498
within chimpanzees from Gombe National Park. Proc Natl Acad Sci USA 109: 499
13034-13039. 500
DeSantis TZ, Hugenholtz P, Larsen N, Rojas M, Brodie EL, Keller K et al (2006). 501
Greengenes, a chimera-checked 16S rRNA gene database and workbench 502
compatible with ARB. Appl Environ Microbiol 72: 5069-5072. 503

23
Di Rienzi SC, Sharon I, Wrighton KC, Koren O, Hug LA, Thomas BC et al (2013). The 504
human gut and groundwater harbor non-photosynthetic bacteria belonging to a new 505
candidate phylum sibling to Cyanobacteria. Elife 2: e01102. 506
Duncan SH, Belenguer A, Holtrop G, Johnstone AM, Flint HJ, Lobley GE (2007). 507
Reduced dietary intake of carbohydrates by obese subjects results in decreased 508
concentrations of butyrate and butyrate-producing bacteria in feces. Appl Environ 509
Microbiol 73: 1073-1078. 510
Eaton KA, Honkala A, Auchtung TA, Britton RA (2011). Probiotic Lactobacillus reuteri 511
ameliorates disease due to enterohemorrhagic Escherichia coli in germfree mice. 512
Infect Immun 79: 185-191. 513
Faith JJ, Guruge JL, Charbonneau M, Subramanian S, Seedorf H, Goodman AL et al 514
(2013). The long-term stability of the human gut microbiota. Science 341: 1237439. 515
Godsall B, Coulson T, Malo AF (2014). From physiology to space use: energy reserves 516
and androgenization explain home-range size variation in a woodland rodent. J Anim 517
Ecol 83: 126-135. 518
Goodrich JK, Waters JL, Poole AC, Sutter JL, Koren O, Blekhman R et al (2014). 519
Human genetics shape the gut microbiome. Cell 159: 789-799. 520
Gurnell J (1993). Tree seed production and food conditions for rodents in an Oak Wood 521
in southern England. Forestry 66: 291-315. 522
Hayes KS, Bancroft AJ, Goldrick M, Portsmouth C, Roberts IS, Grencis RK (2010). 523
Exploitation of the intestinal microflora by the parasitic nematode Trichuris muris. 524
Science 328: 1391-1394. 525
24
Kabir AM, Aiba Y, Takagi A, Kamiya S, Miwa T, Koga Y (1997). Prevention of 526
Helicobacter pylori infection by lactobacilli in a gnotobiotic murine model. Gut 41: 49-527
55. 528
Keeney KM, Finlay BB (2011). Enteric pathogen exploitation of the microbiota-529
generated nutrient environment of the gut. Curr Opin Microbiol 14: 92-98. 530
Knowles SC, Fenton A, Petchey OL, Jones TR, Barber R, Pedersen AB (2013). Stability 531
of within-host-parasite communities in a wild mammal system. Proc Biol Sci 280: 532
20130598. 533
Koren O, Goodrich JK, Cullender TC, Spor A, Laitinen K, Backhed HK et al (2012). Host 534
remodeling of the gut microbiome and metabolic changes during pregnancy. Cell 535
150: 470-480. 536
Ley RE, Hamady M, Lozupone C, Turnbaugh PJ, Ramey RR, Bircher JS et al (2008a). 537
Evolution of mammals and their gut microbes. Science 320: 1647-1651. 538
Ley RE, Lozupone CA, Hamady M, Knight R, Gordon JI (2008b). Worlds within worlds: 539
evolution of the vertebrate gut microbiota. Nat Rev Microbiol 6: 776-788. 540
Linnenbrink M, Wang J, Hardouin EA, Kunzel S, Metzler D, Baines JF (2013). The role 541
of biogeography in shaping diversity of the intestinal microbiota in house mice. Mol 542
Ecol 22: 1904-1916. 543
Maurice CF, Haiser HJ, Turnbaugh PJ (2013). Xenobiotics shape the physiology and 544
gene expression of the active human gut microbiome. Cell 152: 39-50. 545
McKnite AM, Perez-Munoz ME, Lu L, Williams EG, Brewer S, Andreux PA et al (2012). 546
Murine gut microbiota is defined by host genetics and modulates variation of 547
metabolic traits. PLoS One 7: e39191. 548

25
Medellin-Pena MJ, Griffiths MW (2009). Effect of molecules secreted by Lactobacillus 549
acidophilus strain La-5 on Escherichia coli O157:H7 colonization. Appl Environ 550
Microbiol 75: 1165-1172. 551
Meyer F, Paarmann D, D'Souza M, Olson R, Glass EM, Kubal M et al (2008). The 552
metagenomics RAST server - a public resource for the automatic phylogenetic and 553
functional analysis of metagenomes. BMC Bioinformatics 9: 386. 554
Moran PA (1950). Notes on continuous stochastic phenomena. Biometrika 37: 17-23. 555
Muegge BD, Kuczynski J, Knights D, Clemente JC, Gonzalez A, Fontana L et al (2011). 556
Diet drives convergence in gut microbiome functions across mammalian phylogeny 557
and within humans. Science 332: 970-974. 558
Nakagawa S, Schielzeth H (2013). A general and simple method for obtaining R2 from 559
generalized linear mixed-effects models. Methods Ecol Evol 4: 133-142. 560
Nowell F, Higgs S (1989). Eimeria species infecting wood mice (genus Apodemus) and 561
the transfer of two species to Mus musculus. Parasitology 98 Pt 3: 329-336. 562
O'Rourke JL, Grehan M, Lee A (2001). Non-pylori Helicobacter species in humans. Gut 563
49: 601-606. 564
Ochman H, Worobey M, Kuo CH, Ndjango JB, Peeters M, Hahn BH et al (2010). 565
Evolutionary relationships of wild hominids recapitulated by gut microbial 566
communities. PLoS Biol 8: e1000546. 567
Oksanen J, Blanchet FG, Kindt R, Legendre P, Minchin PR, O'Hara RB et al (2015). 568
vegan: Community Ecology Package. R package version 2.2-1. http://CRANR-569
projectorg/package=vegan. 570

26
Parker SE, Malone S, Bunte RM, Smith AL (2009). Infectious diseases in wild mice 571
(Mus musculus) collected on and around the University of Pennsylvania 572
(Philadelphia) Campus. Comparative medicine 59: 424-430. 573
Pena JA, Rogers AB, Ge Z, Ng V, Li SY, Fox JG et al (2005). Probiotic Lactobacillus 574
spp. diminish Helicobacter hepaticus-induced inflammatory bowel disease in 575
interleukin-10-deficient mice. Infect Immun 73: 912-920. 576
Pike N (2011). Using false discovery rates for multiple comparisons in ecology and 577
evolution. Methods Ecol Evol 2: 278-282. 578
Pritchard MH, Kruse GOW (1982). The collection and preservation of animal parasites, 579
vol. 1. University of Nebraska Press: Lincoln, NE. 580
Rausch S, Held J, Fischer A, Heimesaat MM, Kuhl AA, Bereswill S et al (2013). Small 581
intestinal nematode infection of mice is associated with increased enterobacterial 582
loads alongside the intestinal tract. PLoS One 8: e74026. 583
Reynolds LA, Smith KA, Filbey KJ, Harcus Y, Hewitson JP, Redpath SA et al (2014). 584
Commensal-pathogen interactions in the intestinal tract: lactobacilli promote 585
infection with, and are promoted by, helminth parasites. Gut Microbes 5: 522-532. 586
Segata N, Izard J, Waldron L, Gevers D, Miropolsky L, Garrett WS et al (2012a). 587
Metagenomic biomarker discovery and explanation. Genome Biol 12: R60. 588
Segata N, Waldron L, Ballarini A, Narasimhan V, Jousson O, Huttenhower C (2012b). 589
Metagenomic microbial community profiling using unique clade-specific marker 590
genes. Nat Methods 9: 811-814. 591
Sommer F, Backhed F (2013). The gut microbiota--masters of host development and 592
physiology. Nat Rev Microbiol 11: 227-238. 593

27
Walk ST, Blum AM, Ewing SA, Weinstock JV, Young VB (2010). Alteration of the 594
murine gut microbiota during infection with the parasitic helminth Heligmosomoides 595
polygyrus. Inflamm Bowel Dis 16: 1841-1849. 596
Wang J, Linnenbrink M, Kunzel S, Fernandes R, Nadeau MJ, Rosenstiel P et al (2014). 597
Dietary history contributes to enterotype-like clustering and functional metagenomic 598
content in the intestinal microbiome of wild mice. Proc Natl Acad Sci U S A 111: 599
E2703-2710. 600
Wasimuddin, Cizkova D, Bryja J, Albrechtova J, Hauffe HC, Pialek J (2012). High 601
prevalence and species diversity of Helicobacter spp. detected in wild house mice. 602
Appl Environ Microbiol 78: 8158-8160. 603
Watts CHB (1968). Foods eaten by wood mice (Apodemus sylvaticus) and bank voles 604
(Clethrionomys glareolus) in Wytham Woods, Berkshire. J Anim Ecol 37: 25-41. 605
Wolfe BE, Button JE, Santarelli M, Dutton RJ (2014). Cheese rind communities provide 606
tractable systems for in situ and in vitro studies of microbial diversity. Cell 158: 422-607
433. 608
Yatsunenko T, Rey FE, Manary MJ, Trehan I, Dominguez-Bello MG, Contreras M et al 609
(2012). Human gut microbiome viewed across age and geography. Nature 486: 222-610
227. 611
Zenewicz LA, Yin X, Wang G, Elinav E, Hao L, Zhao L et al (2013). IL-22 deficiency 612
alters colonic microbiota to be transmissible and colitogenic. J Immunol 190: 5306-613
5312. 614
615
616

28
Figure legends 617
618
Figure 1. Taxonomic analysis of the wild mouse gut microbiota. Pie charts 619
represent the relative abundance of bacterial (a) phyla and (b) orders (n=481 samples). 620
The 10 most abundant phyla and orders are shown (phyla with a mean abundance 621
<0.001% are not included; the remaining orders are represented by the “other” slice). 622
Taxa are colored based on phylum. Sequences within the Cyanobacteria phylum could 623
be attributed to chloroplasts (order Streptophyta), non-photosynthetic bacteria related to 624
Cyanobacteria that are common in the mammalian gut (order YS2) (Di Rienzi et al 625
2013), and algae (order Chlorophyta, family Trebouxiophyceae). We did not detect any 626
consistent seasonal changes in the abundance or prevalence of these three groups. 627
628
Figure 2. Seasonal variations in the wild mouse gut microbiota. (a) The first 629
principle coordinate from a Bray-Curtis-based analysis of microbial community structure 630
over time. Trend lines were generated by fitting a polynomial function to values from 631
each year (GraphPad Prism version 6.0). Values are mean±sem (n=14-80 samples per 632
group). Values from June and July were combined in 2011 due to limited available 633
samples in July (n=2). (b) Association between average monthly microbial community 634
structures between years. Values are mean (thick black line) and 95% CI (thin grey 635
lines) from a linear regression. (c) The relative abundance of bacterial genera in spring 636
and fall of both years. Values are mean±sem (n=24-123 samples per group; the first 637
sample from each mouse was included). Asterisks represent significant differences (p-638
value<0.05, Wilcoxon rank-sum test). 639

29
640
Figure 3. Seasonal patterns are detectable within individuals captured multiple 641
times. Correlations between the mean month-to-month change in Bray-Curtis principle 642
coordinates 1 (panel a) and 2 (panel b) within-individuals, relative to the monthly 643
change observed at the population level (including only one pair of observations per 644
mouse; n=2-11 paired samples per datapoint). Dots represent monthly changes seen in 645
2010 (black) and 2011 (white). See Figure S4 for plots of individual animals over time. 646
(c) We calculated the mean value of Bray-Curtis principal coordinate 1 value for each 647
mouse in Season 1 (spring/early summer) and 2 (late summer/fall) (n=25 mice; ≤1 648
sample per mouse per month included). Nearly all mice exhibited a consistent direction 649
of change (black lines), with the exception of 3 animals (grey lines). 650
651
Figure 4. Spatial distribution of microbial community structure. Each circle 652
represents the physical location of a given mouse at the time of sampling in Manor or 653
Haddon Wood, which are subdivided into 2 and 4 fields, respectively. Shading is 654
proportional to the percentile along unweighted UniFrac principal coordinate 1 (an 655
indicated of overall microbial community membership). Between August and November 656
in 2010 there was a slight, but significant difference in community composition between 657
Haddon and Manor woods. However, this difference was absent in August-November 658
2011. Within woods, no significant spatial structuring of communities was observed in 659
either year. 660
661

30
Figure 5. The gut microbiota is associated with intestinal helminth infection and 662
reproductive state. (a) Values represent the relative abundance of Lactobacillus 663
according to host sex and reproductive status. (b) Nematode infection status is 664
positively associated with Escherichia and negatively associated with an unclassified 665
genus within the Lachnospiraceae family. All samples with non-zero abundance were 666
included. Values are mean±sem (n=92-205 samples per group). 667
668
669

31
Table legend 670
671
Table 1. Environmental and host factors associated with microbial community 672
structure and membership in linear mixed models. Each model (response variable) 673
is shown in a single row, with predictor variables in columns. Numbers indicate FDR-674
adjusted p-values (i.e. q-values; see Methods), and shading indicates significance level 675
for each term in the minimal model following FDR-adjustment (red: q<0.001; orange: 676
0.001<q<0.01; yellow: 0.01<q<0.05; blank cells q>0.05. Grey cells indicate significant q-677
values for effects tested after removing interactions involving the component terms from 678
the minimal model. 679

Firmicutes,
52.1%
Bacteroidetes,
37.0%
Proteobacteria,
8.2%
Actinobacteria, 1.1%
Tenericutes,
0.9% Deferribacteres, 0.4%
Cyanobacteria,
0.3%
Verrucomicrobia, 0.03%
Fusobacteria, 0.01%
TM7, 0.004%
Bacteroidales,
37.0%
Lactobacillales,
30.9%
Clostridiales,
21.0%
Campylobacterales, 4.0%
Enterobacteriales, 3.2%
Other, 1.2%
Bifidobacteriales, 0.9%
Pseudomonadales, 0.7%
Mycoplasmatales, 0.6%
Deferribacterales, 0.4%
RF39, 0.3%
a
Phylum
b
Order
Figure 1

2010
Bra
y-C
urt
is P
C1
(2
01
1)
Bray-Curtis PC1 (2010)
a b
R = 0.79,
p<0.01
2
Spring/early Summer Late Summer/Fall
May
June
July
Aug
ust
Septe
mbe
r
Oct
ober
Nov
embe
rM
ay
June
/July
Aug
ust
Septe
mbe
r
Oct
ober
Nov
embe
r
Bra
y-C
urt
is P
C1
(1
2%
va
ria
nce
)
2011
c
-0.4
-0.2
0.0
0.2
0.4
-0.2 0 0.2 0.4-0.4
-0.2
0
0.2
0.4
Spr
ing
2010
Fall 2
010
Spr
ing
2011
Fall 2
011
0
20
40
60
80
% L
acto
ba
cillu
s
*
*
0
2
4
6
8
% A
listip
es
Spr
ing
2010
Fall 2
010
Spr
ing
2011
Fall 2
011
*
*
0
2
4
6
8%
He
lico
ba
cte
r
Spr
ing
2010
Fall 2
010
Spr
ing
2011
Fall 2
011
**
Figure 2

R = 0.652
p-value = 0.005
−0.2
−0.1
0
0.1
0.2
0.3
−0.1 0 0.1
Within−individual change
Po
pu
latio
n−
leve
l ch
an
ge
−0.2
−0.1
0
0.1
−0.10 −0.05 0 0.05 0.10 0.15
a
b
Spring Fall
-0.4
-0.2
0.0
0.2
0.4
0.6
Me
an B
ray-C
urt
is P
C1
va
lue
Bray-Curtis PC1
0.2
2010 2011
Within−individual change
Po
pu
latio
n−
leve
l ch
an
ge
R = 0.562
p-value = 0.013
Bray-Curtis PC22010 2011
cDecrease
Increase
Figure 3

Ma
no
r W
oo
dH
ad
do
n W
oo
d
2010 2011
Unweighted UniFrac
PC1 percentile
90-100
80-90
70-80
60-70
50-60
40-50
30-40
20-30
10-20
0-10
Figure 4

Inactive Active
10
15
20
25
30
35
40
% Lactobacillus
Reproductive status
Female
Male
Uninfected Light Heavy
% 1
6S
rR
NA
ge
ne
se
qu
en
ce
s
Nematode infection status
Lachnospiraceae.g
Escherichia
a b
0
7
2
3
4
5
6
1
Figure 5
94
102
98 137
124
102
205
171 9892
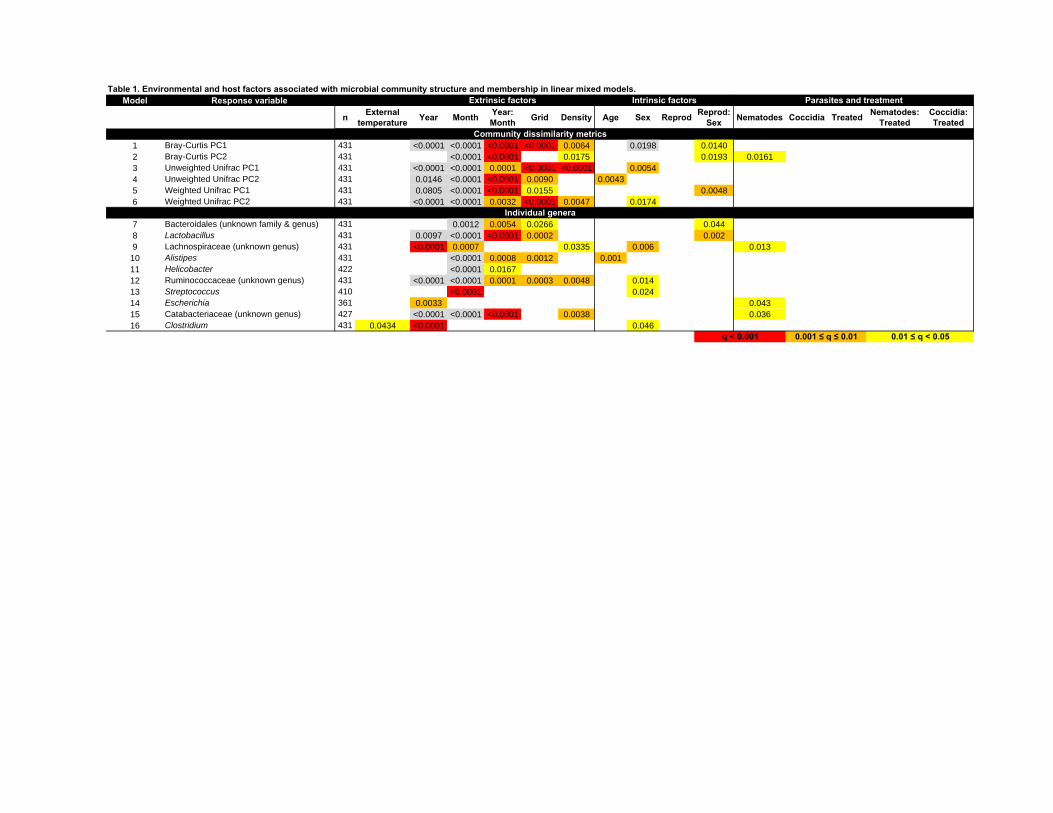
Table 1. Environmental and host factors associated with microbial community structure and membership in linear mixed models. Model Response variable
n External temperature Year Month Year:
Month Grid Density Age Sex Reprod Reprod: Sex Nematodes Coccidia Treated Nematodes:
TreatedCoccidia: Treated
1 Bray-Curtis PC1 431 <0.0001 <0.0001 <0.0001 <0.0001 0.0064 0.0198 0.01402 Bray-Curtis PC2 431 <0.0001 <0.0001 0.0175 0.0193 0.01613 Unweighted Unifrac PC1 431 <0.0001 <0.0001 0.0001 <0.0001 <0.0001 0.00544 Unweighted Unifrac PC2 431 0.0146 <0.0001 <0.0001 0.0090 0.00435 Weighted Unifrac PC1 431 0.0805 <0.0001 <0.0001 0.0155 0.00486 Weighted Unifrac PC2 431 <0.0001 <0.0001 0.0032 <0.0001 0.0047 0.0174
7 Bacteroidales (unknown family & genus) 431 0.0012 0.0054 0.0266 0.0448 Lactobacillus 431 0.0097 <0.0001 <0.0001 0.0002 0.0029 Lachnospiraceae (unknown genus) 431 <0.0001 0.0007 0.0335 0.006 0.01310 Alistipes 431 <0.0001 0.0008 0.0012 0.00111 Helicobacter 422 <0.0001 0.016712 Ruminococcaceae (unknown genus) 431 <0.0001 <0.0001 0.0001 0.0003 0.0048 0.01413 Streptococcus 410 <0.0001 0.02414 Escherichia 361 0.0033 0.04315 Catabacteriaceae (unknown genus) 427 <0.0001 <0.0001 <0.0001 0.0038 0.03616 Clostridium 431 0.0434 <0.0001 0.046
q < 0.001 0.001 ≤ q ≤ 0.01 0.01 ≤ q < 0.05
Extrinsic factors Intrinsic factors Parasites and treatment
Individual genera
Community dissimilarity metrics