Embed Size (px)
Citation preview

Mark Scheme (Results) Summer 2016 Pearson Edexcel GCE in Geography (6GE01) Unit 1: Global Challenges
PhysicsAndMathsTutor.com
Edexcel and BTEC Qualifications Edexcel and BTEC qualifications are awarded by Pearson, the UK’s largest awarding body. We provide a wide range of qualifications including academic, vocational, occupational and specific programmes for employers. For further information visit our qualifications websites at http://qualifications.pearson.com or www.btec.co.uk. Alternatively, you can get in touch with us using the details on our contact us page at http://qualifications.pearson.com/contactus Pearson: helping people progress, everywhere Our aim is to help everyone progress in their lives through education. We believe in every kind of learning, for all kinds of people, wherever they are in the world. We’ve been involved in education for over 150 years, and by working across 70 countries, in 100 languages, we have built an international reputation for our commitment to high standards and raising achievement through innovation in education. Find out more about how we can help you and your students at: www.pearson.com/uk Summer 2016 Publications Code 6GE01_01_1606_MS All the material in this publication is copyright © Pearson Education Ltd 2016
PhysicsAndMathsTutor.com
General Marking Guidance All candidates must receive the same treatment. Examiners must
mark the first candidate in exactly the same way as they mark the last.
Mark schemes should be applied positively. Candidates must be rewarded for what they have shown they can do rather than penalised for omissions.
Examiners should mark according to the mark scheme not according to their perception of where the grade boundaries may lie.
There is no ceiling on achievement. All marks on the mark scheme should be used appropriately.
All the marks on the mark scheme are designed to be awarded. Examiners should always award full marks if deserved, i.e. if the answer matches the mark scheme. Examiners should also be prepared to award zero marks if the candidate’s response is not worthy of credit according to the mark scheme.
Where some judgement is required, mark schemes will provide the principles by which marks will be awarded and exemplification may be limited.
When examiners are in doubt regarding the application of the mark scheme to a candidate’s response, the team leader must be consulted.
Crossed out work should be marked UNLESS the candidate has replaced it with an alternative response.
PhysicsAndMathsTutor.com

Spelling, Punctuation and Grammar Marking Guidance The spelling, punctuation and grammar assessment criteria are common to GCSE English
Literature, GCSE History, GCSE Geography and GCSE Religious Studies. All candidates, whichever subject they are being assessed on, must receive the same
treatment. Examiners must mark the first candidate in exactly the same way as they mark the last.
Spelling, punctuation and grammar marking criteria should be applied positively.
Candidates must be rewarded for what they have demonstrated rather than penalised for errors.
Examiners should mark according to the marking criteria. All marks on the marking
criteria should be used appropriately. All the marks on the marking criteria are designed to be awarded. Examiners should
always award full marks if deserved, i.e. if the answer matches the marking criteria. Examiners should be prepared to award zero marks if the candidate’s response is not
worthy of credit according to the marking criteria. When examiners are in doubt regarding the application of the marking criteria to a
candidate’s response, the team leader must be consulted. Crossed out work should be marked unless the candidate has replaced it with an
alternative response. Handwriting may make it difficult to see if spelling, punctuation and grammar are correct.
Examiners must make every effort to assess spelling, punctuation and grammar fairly and if they genuinely cannot make an assessment, the team leader must be consulted.
Specialist terms do not always require the use of complex terminology but the vocabulary
used should appropriate to the subject and the question. Work by candidates with an amanuensis, scribe or typed script should be assessed for
spelling, punctuation and grammar. Examiners are advised to consider the marking criteria in the following way:
o How well does the response communicate the meaning? o What range of specialist terms is used? o How accurate is the spelling, punctuation and grammar?
Quality of Written Communication Questions which involve the writing of continuous prose will expect candidates to:
show clarity of expression construct and present coherent arguments demonstrate an effective use of grammar, punctuation and spelling. Full marks will be awarded if the candidate has demonstrated the above abilities.
Questions where QWC is likely to be particularly important are indicated “QWC” in the mark scheme
PhysicsAndMathsTutor.com

Question Number
Answer Mark
1(a) (i) D: Western Mediterranean (1)
Question Number
Answer Mark
1(a) (ii) Drought/Wildfire/Heatwave (1)
Question Number
Answer Mark
1(b) Frequency increases risk of disaster by: Increases vulnerability as decreases recovery time (1)
because of limited financial resources of country / community /individual (1)
More likely that more people are affected (1) Less recovery/planning time (1) A hazard that occurs rarely may not be prepared for (e.g.
earthquake 2013 in Port-au-Prince, Haiti) (1) Where frequency is low, less investment in defences (1)
“Compassion fatigue” so reduced aid income (1).
Magnitude increases risk of disaster by: Greater damage to people / buildings / infrastructure (1) Areal extent of the hazard is likely to be wider (1) Capacity to cope is overwhelmed by scale of disaster (1)
e.g. sea walls overwhelmed by tsunami waves in Japan (1) Key people/installations damaged (1) (e.g. hospitals/
emergency services /electrical power remove capacity to cope (1)
Ports/airports damaged so aid slow to arrive (1) More likely to trigger secondary hazards (1).
Allow other valid suggestions (1) Allow developed exemplification (1) No transfer or repetition of ideas between frequency and magnitude No mark for simply stating parts of the risk equation (e.g. ‘vulnerability’ / ‘capacity to cope’ without explanation) No mark for “e.g. Bangladesh” or for defining frequency/ magnitude No mark for simple “more damage” unless linked to buildings etc.
1+1+1+1 2+2 2+1+1 (4)
PhysicsAndMathsTutor.com

Question Number
Answer Mark
1(c) Answer should take a “group” approach and suggest reasons E.g. developed / developing or elderly/ children/ migrants/people with disabilities or other groups have different levels of capacity to cope. Developed / rich:
Have financial resources (1) May have reinforced housing (1) defences against disasters (1) access to communication (1) training/ education (1).
Developing / poor: Lack resilience, finance or resources (1) for
healthcare/training/education (1) prevention / protection / preparation measures (1) e.g. flood walls/warning systems / emergency food supplies / receipt of aid (1)
Poorer countries may have invested in low cost warning systems e.g. tsunami sirens in Indonesia (1)
Role of debt/low tax revenue/exploitation by TNCs (1). Other groups:
Children may have less acquired knowledge (1) orphaned so lack support (1)
Migrants may lack language skills/ education about dangers (1) Elderly / those with disabilities may be slower to escape (1) or not
receive warnings (1) Corruption, war or government instability reduces planning/
investment (1) for some groups. Physical reasons might be explored:
Rise in sea level / increase in storms (1) particularly affects Pacific Islands / Bangladesh which are low-lying (1)
Recurring hazards may overwhelm attempts to prepare (1). May have other valid suggestions (1) May have examples of disasters with contrasts drawn (1) plus extension points (1) For full marks, needs at least two groups. No mark for naming a group. No mark for simple mirror points (e.g. richer are more prepared with defences but developing countries are less prepared as they are poorer (1) not 2 marks)
(5)
PhysicsAndMathsTutor.com
Question Number
Answer Mark
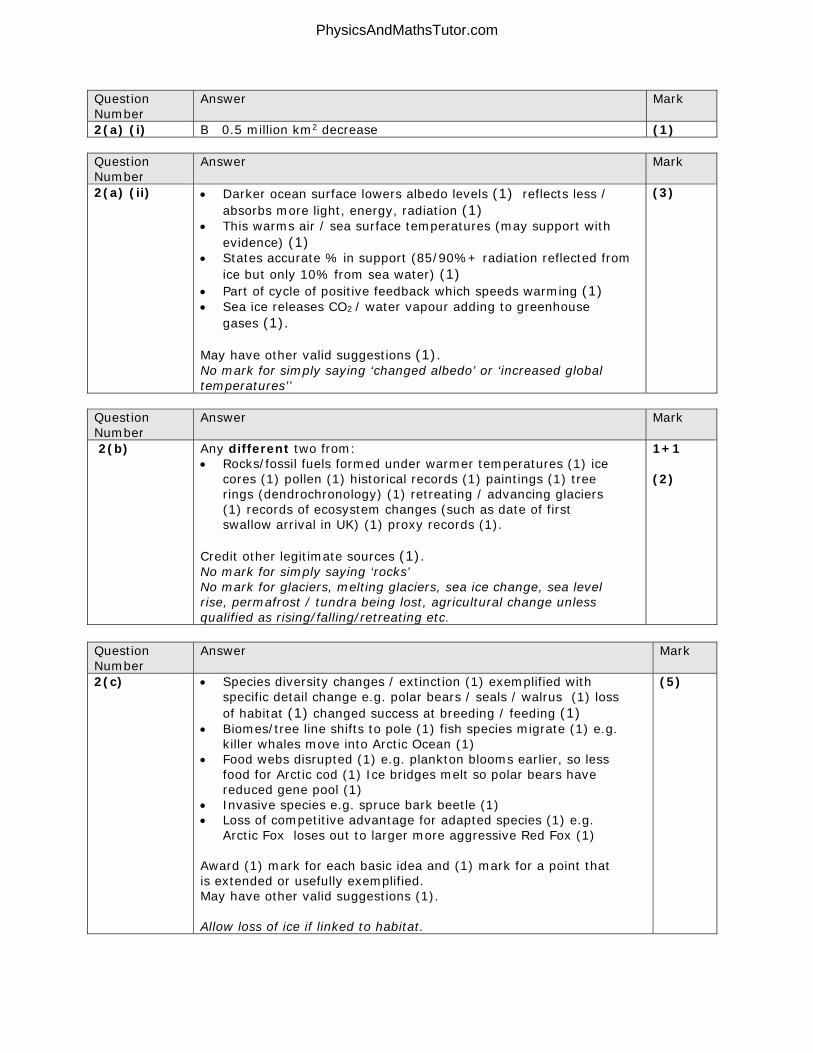
2(a) (i) B 0.5 million km2 decrease (1)
Question Number
Answer Mark
2(a) (ii) Darker ocean surface lowers albedo levels (1) reflects less / absorbs more light, energy, radiation (1)
This warms air / sea surface temperatures (may support with evidence) (1)
States accurate % in support (85/90%+ radiation reflected from ice but only 10% from sea water) (1)
Part of cycle of positive feedback which speeds warming (1) Sea ice releases CO2 / water vapour adding to greenhouse
gases (1). May have other valid suggestions (1). No mark for simply saying ‘changed albedo’ or ‘increased global temperatures’’
(3)
Question Number
Answer Mark
2(b) Any different two from: Rocks/fossil fuels formed under warmer temperatures (1) ice
cores (1) pollen (1) historical records (1) paintings (1) tree rings (dendrochronology) (1) retreating / advancing glaciers (1) records of ecosystem changes (such as date of first swallow arrival in UK) (1) proxy records (1).
Credit other legitimate sources (1). No mark for simply saying ‘rocks’ No mark for glaciers, melting glaciers, sea ice change, sea level rise, permafrost / tundra being lost, agricultural change unless qualified as rising/falling/retreating etc.
1+1 (2)
Question Number
Answer Mark
2(c) Species diversity changes / extinction (1) exemplified with specific detail change e.g. polar bears / seals / walrus (1) loss of habitat (1) changed success at breeding / feeding (1)
Biomes/tree line shifts to pole (1) fish species migrate (1) e.g. killer whales move into Arctic Ocean (1)
Food webs disrupted (1) e.g. plankton blooms earlier, so less food for Arctic cod (1) Ice bridges melt so polar bears have reduced gene pool (1)
Invasive species e.g. spruce bark beetle (1) Loss of competitive advantage for adapted species (1) e.g.
Arctic Fox loses out to larger more aggressive Red Fox (1) Award (1) mark for each basic idea and (1) mark for a point that is extended or usefully exemplified. May have other valid suggestions (1). Allow loss of ice if linked to habitat.
(5)
PhysicsAndMathsTutor.com
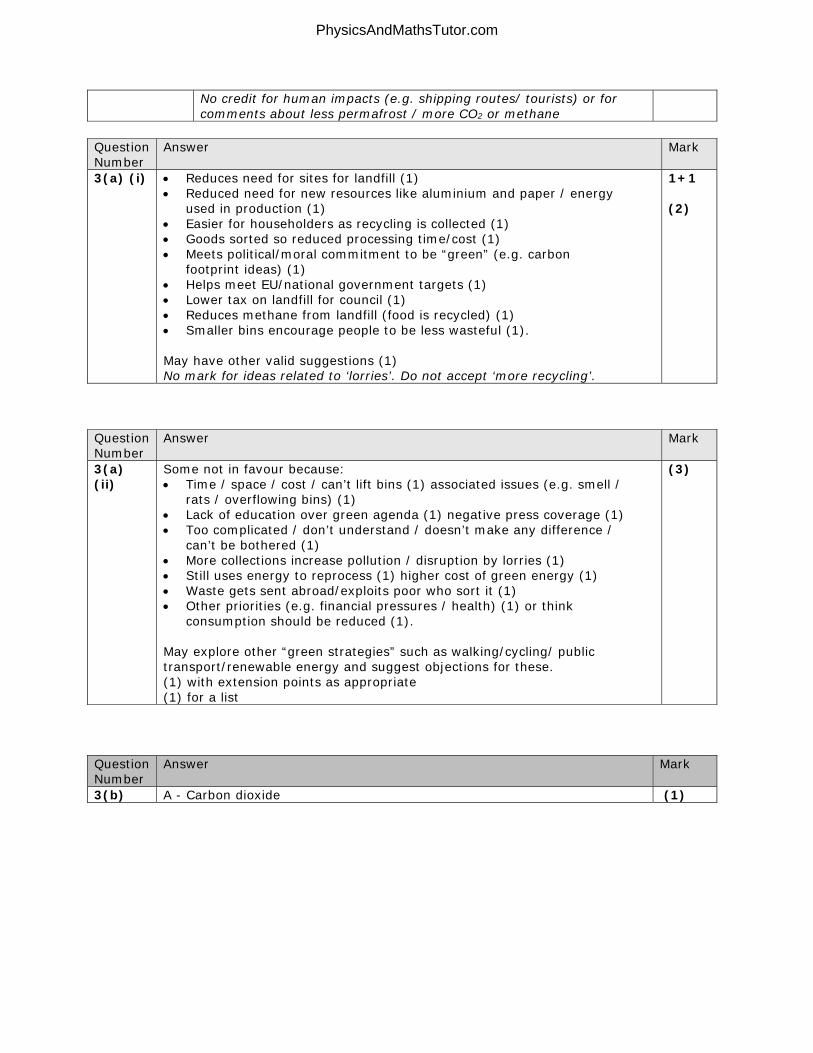
No credit for human impacts (e.g. shipping routes/ tourists) or for comments about less permafrost / more CO2 or methane
Question Number
Answer Mark
3(a) (i) Reduces need for sites for landfill (1) Reduced need for new resources like aluminium and paper / energy
used in production (1) Easier for householders as recycling is collected (1) Goods sorted so reduced processing time/cost (1) Meets political/moral commitment to be “green” (e.g. carbon
footprint ideas) (1) Helps meet EU/national government targets (1) Lower tax on landfill for council (1) Reduces methane from landfill (food is recycled) (1) Smaller bins encourage people to be less wasteful (1). May have other valid suggestions (1) No mark for ideas related to ‘lorries’. Do not accept ‘more recycling’.
1+1 (2)
Question Number
Answer Mark
3(a) (ii)
Some not in favour because: Time / space / cost / can’t lift bins (1) associated issues (e.g. smell /
rats / overflowing bins) (1) Lack of education over green agenda (1) negative press coverage (1) Too complicated / don’t understand / doesn’t make any difference /
can’t be bothered (1) More collections increase pollution / disruption by lorries (1) Still uses energy to reprocess (1) higher cost of green energy (1) Waste gets sent abroad/exploits poor who sort it (1) Other priorities (e.g. financial pressures / health) (1) or think
consumption should be reduced (1).
May explore other “green strategies” such as walking/cycling/ public transport/renewable energy and suggest objections for these. (1) with extension points as appropriate (1) for a list
(3)
Question Number
Answer Mark
3(b) A - Carbon dioxide (1)
PhysicsAndMathsTutor.com

Question Number
Answer Mark
3(c) Agreement on global scale difficult to achieve because: Countries may have other priorities (1) (e.g. health / education /
infrastructure / economic growth) (1) population growth (1) Many can’t afford investment (1) renewable alternatives to fossil
fuel are expensive/unreliable and not commercially viable (1) Ethical / NIMBY issues linked to nuclear / wind (1) inconvenience of schemes (1) They perceive it as unfair (1) Science is still controversial (1) TNC funding for global warming
sceptics (1) Countries have large reserves of fossil fuels (1) e.g. China-coal (1) Governments under pressure to reduce costs during economic
downturn (1) Developing countries may argue they make little contribution to
GHG emissions (1). May have other valid suggestions (1). Award (1) mark for each basic idea and (1) mark for a point that is extended or usefully exemplified (e.g. credit reference to little agreement at conferences in Kyoto 1997 or Paris 2015 if linked to a reason)
(5)
PhysicsAndMathsTutor.com
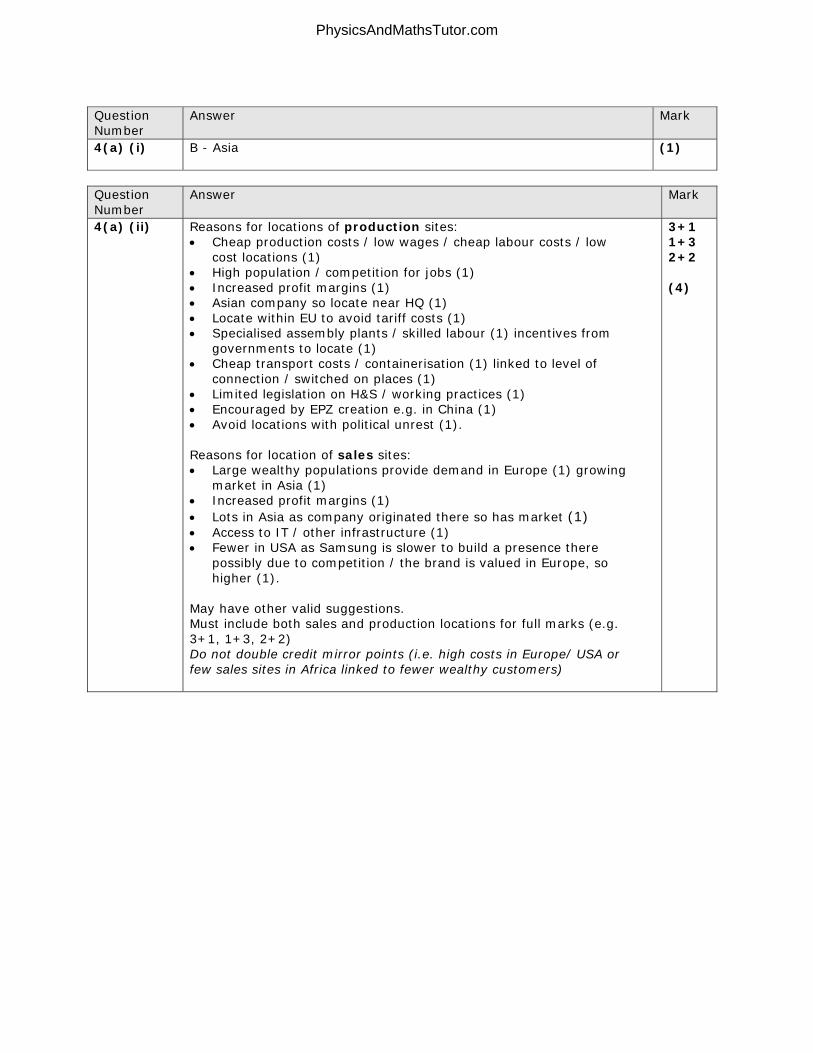
Question Number
Answer Mark
4(a) (i) B - Asia
(1)
Question Number
Answer Mark
4(a) (ii) Reasons for locations of production sites: Cheap production costs / low wages / cheap labour costs / low
cost locations (1) High population / competition for jobs (1) Increased profit margins (1) Asian company so locate near HQ (1) Locate within EU to avoid tariff costs (1) Specialised assembly plants / skilled labour (1) incentives from
governments to locate (1) Cheap transport costs / containerisation (1) linked to level of
connection / switched on places (1) Limited legislation on H&S / working practices (1) Encouraged by EPZ creation e.g. in China (1) Avoid locations with political unrest (1). Reasons for location of sales sites: Large wealthy populations provide demand in Europe (1) growing
market in Asia (1) Increased profit margins (1) Lots in Asia as company originated there so has market (1) Access to IT / other infrastructure (1) Fewer in USA as Samsung is slower to build a presence there
possibly due to competition / the brand is valued in Europe, so higher (1).
May have other valid suggestions. Must include both sales and production locations for full marks (e.g. 3+1, 1+3, 2+2) Do not double credit mirror points (i.e. high costs in Europe/ USA or few sales sites in Africa linked to fewer wealthy customers)
3+1 1+3 2+2 (4)
PhysicsAndMathsTutor.com

Question Number
Answer Mark
4(b) Social: Long working hours / short holidays (1) Workers exploits / have few rights / inhumane expectations /
conditions (1) Poor working conditions / lack of compensation / lack of health and
safety regulations / no unions allowed (1) Families divided as parents away (1) Child labour in some locations (1) Water shortages linked to over abstraction by TNC (1) Migration to urban areas encouraged, leaving rural areas
depopulated of young adults (1) Loss of local culture/ adoption of western lifestyle (1) Health issues linked to sugar / high fat foods (1).
Economic: Low wages (1) so overtime necessary to gain sufficient income to
support family (1) Jobs often low skill so minimal transfer to host country (1) Local businesses cannot compete with mass production methods (1) Profits leave the country / leakage (1) so minimal investment in
local area (1) Tax breaks/low rent negotiated with government so limited benefits
(1) Company may be “footloose” and move elsewhere (1) resulting in
unemployment/losses to suppliers (1) (e.g. Dyson Wiltshire). Award (1) mark for each basic idea and (1) mark for a point that is extended or usefully exemplified. May have other valid suggestions. Max 4 marks if no examples (may be of a named TNC or country). Likely examples are Coca Cola, Apple (outsourced to Foxconn), Primark amongst many others Question is about disadvantages so do not credit advantages. Social and economic must both be addressed for full marks (but note that there is considerable overlap, e.g. low wages so can’t afford healthcare) Do not allow environmental points unless these are clearly linked to social or economic impacts
(5)
PhysicsAndMathsTutor.com

Question Number
Answer Mark
5(a) (i) B - 1964 (1)
Question Number
Answer Mark
5(a) (ii) C - 1.3 children per woman (1)
Question Number
Answer Mark
5(a) (iii) Credit one mark for each identified trend / change / use of comparative language
Steep rise in 1940s (1) Fluctuates between 1945-1965 (1) Rises again in 1960s (1) Steep fall in births from about 1965 to until about 1976 (1) More stable levels from 1980 until 2002 (1) Currently rising again (1) Now just above 1942 level (1)
Credit correct use of data from figure 5 to support any point once about trends (1). (Highest = 1964 at 2.9, Lowest = 2002 at 1.6) No marks for reasons.
(3)
Question Number
Answer Mark
5(a) (iv) Trend from 2000 to 2012 is a rise in TFR: Migrants within fertile ages moved to UK (1) especially from E
Europe post-2004 A8 countries (1) high birth rates in second generation migrant families in some cultures (1)
Improved fertility treatment (1) Older women who have delayed child birth now having children
(1) “Echo” of higher numbers born in 1970s (1) Child Tax Credits (introduced in 2002) (1) and changes to
shared parental leave (1).
Note Q asks for 2000-2012 only so no credit for post-war baby boom etc. No mark for improved healthcare unless specifically linked to fertility. No credit for ongoing benefits prior to 2000 e.g. maternity leave / child benefit / child care costs / career breaks for women. No marks for description of trends
(3)
Question Number
Answer Mark
5(b) Family histories and other records include: Family trees (1) Oral history from older people / photographs / diaries (1) National census gives 10-yearly changes (1) Ancestry.com / other specified and relevant websites (1) Church / parish / local museum records (1) Newspapers / court records (1)
Changing population structure:
2+2 (4)
PhysicsAndMathsTutor.com

Age of marriage / child bearing (1) Size of family / birth rates / children born per woman (1) Age of death (1) Child mortality rates (1)
Maximum (1) for a list of sources, and (1) for list of changes. For full marks, need both population structure (max 2) AND sources of data (max 2). No marks for ‘family history’
PhysicsAndMathsTutor.com

Question Number
Answer Mark
6(a) (i) Italy (1)
Question Number
Answer Mark
6(a) (ii) Comments must state a country and suggest a valid reason for each section. Reasons for negative net migration:
Declining economy in 2013 (Spain/Greece/Ireland) (1) so low wages / higher wages elsewhere (1) more availability of jobs (1)
A8 plus Romania and Bulgaria free to move anywhere in EU (post 2004) (1)
Few choose to move to former eastern European countries (1) Migrants from northern Europe (UK and Germany) may be returning
from Spain as businesses struggle or for NHS or family reasons (1).
Reasons for positive net migration: UK allowed A8 economic migrants to fill job shortages (1) Higher wages (1) in strong / improving economies (UK, Germany,
Austria) (1) Welfare state (e.g. NHS in UK) (1) higher minimum wage (1) Attraction of global hub / world city (London) (1) Possible tax haven in Luxembourg (1) Jobs in finance in Luxembourg, also low paid maids / cleaners (1) Asylum seekers / economic migrants from north Africa in Italy
(nearest EU country for many) (1). Max 1 for each section if no countries are named. No double marks for duplicate content e.g. low paid jobs/higher paid jobs or for EU membership in both sections. No mark for simply naming a country or simply making vague points such as “few jobs” “better wages”, Also pull factors in top section and push factors in bottom section
2+2 (4)
Question Number
Answer Mark
6(b) Social-economic consequences for source countries (such as Poland, or UK source for Spain) include: Positive consequences:
Remittances received (1) invested in local businesses / house repairs / medical care (1)
Less unemployment as people have moved elsewhere (1) Wages rise as fewer workers available (1) New job opportunities, particularly for women as large numbers
of men migrate (1) Housing/hospitals/schools less overcrowded (1) house prices
may fall (1).
Negative consequences: Loss of skilled workers (‘brain drain’) (1) e.g. Doctors / teachers
(1) those with initiative / ideas (1) Loss of tax revenue so reduced government spending (1) Loss of population to sustain local services such as transport /
shops (1)
(5)
PhysicsAndMathsTutor.com

Loss of culture / community (1) Families divided so impacts on mental health/child care (1) Young migrants move leaving a falling / ageing population (1)
which increases dependency ratio (1).
Exemplification of any one point (1). Credit other ideas. Allow UK as source for migrants to Spain Must do positive and negative for 5 marks. No credit for host country comments But search for relevant points such as remittances sent back to Poland.
PhysicsAndMathsTutor.com

Question Number
Indicative content
7(a) Question may be tackled by continent or by hazard. Either is acceptable. Focus should be on economic losses (i.e. not deaths). Responses could address vulnerability. Scale of economic losses varies: Largest costs for Asia: High population/growing wealth/prone to range of disasters, including all “Big Six” High value of technology, e.g. Fukushima (2011) Lack of preventative measures in many locations such as Bangladesh Japan and Philippines affected by multiple hazards and vulnerable populations Americas: High levels of protection/prevention strategies such as earthquake proof buildings and sea walls, but high economic value so costs large Africa: Lower investment and low personal wealth so damages are lower. Many are subsistence farmers so their losses may be unrecorded by official data Europe: Less prone to disasters but high economic investment so costly damage Possible linking themes: global warming making events more extreme and
frequent, and overwhelming prevention schemes Deforestation and urbanisation and new infrastructure including roads alter
infiltration creating more impermeable surfaces Causes of economic losses vary: Parts of Asia (including Philippines) experience all of “Big 6” disasters. Earthquakes: Occur frequently on Destructive and collision boundaries
sometimes with high magnitudes Storms: Severe storms due to location to west of warm ocean (26⁰C) at latitude
between 5-23⁰N. Asia also prone to typhoons/cyclones owing to location in storm belt, resulting in extensive floods linked to low lying land and limited preparations
Floods: Heavy rainfall linked to storms, La Nina, mid-latitude depressions Drought: Relatively low level losses, effects on agriculture or forest fires Volcanoes: low contributor, rare and limited. E.g.Eyjafjallajokull >$2bn in 2010 May identify specific hazards, e.g. Boxing Day tsunami 2004, Hurricane Katrina 2005 or Japan Earthquake/tsunami 2011 and comment on role in resulting in massive economic damages that may have skewed the results
Level Mark
Descriptor
Level 1 1-4 Poorly structured Simple description of figure 7, e.g. higher damage in Asia. Makes simple comments about differences between continents (e.g.
Philippines vs. California Geographical terminology is rarely used / Frequent written language errors.
Level 2 5-7 Has structure. Makes descriptive comments about causes and/or scales of economic
losses, based on figure 7. Might begin to include own knowledge about specific disasters/locations
Comments about human (population/ economic settings) and/or physical (plate boundaries/storm locations) factors.
Some geographical terminology is used. There are some written language errors.
Level 3 8-10
Well-structured answer Use of figure 7 to identify both causes and scales of economic loss across a
range of continents. May comment on specific disasters. Suggests reasons why both human and physical factors might cause
economic loss. Appropriate geographical terms show understanding. Minor language
errors.
PhysicsAndMathsTutor.com
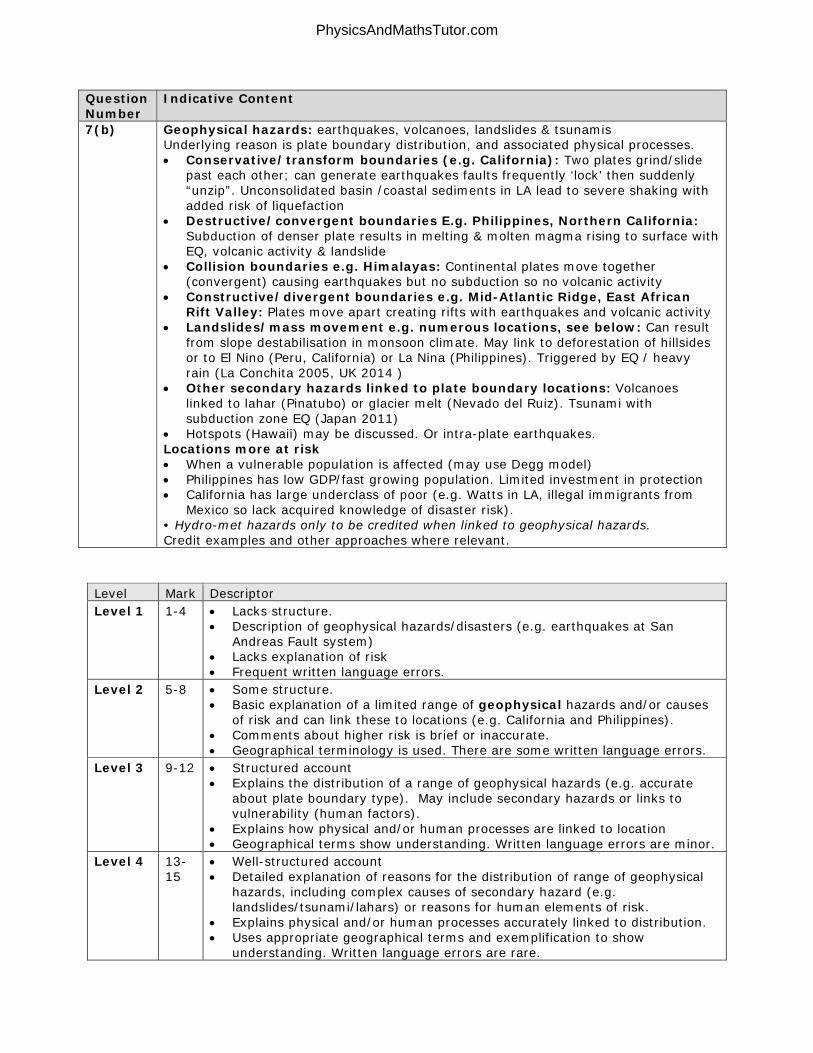
Question Number
Indicative Content
7(b) Geophysical hazards: earthquakes, volcanoes, landslides & tsunamis Underlying reason is plate boundary distribution, and associated physical processes. Conservative/transform boundaries (e.g. California): Two plates grind/slide
past each other; can generate earthquakes faults frequently ‘lock’ then suddenly “unzip”. Unconsolidated basin /coastal sediments in LA lead to severe shaking with added risk of liquefaction
Destructive/convergent boundaries E.g. Philippines, Northern California: Subduction of denser plate results in melting & molten magma rising to surface with EQ, volcanic activity & landslide
Collision boundaries e.g. Himalayas: Continental plates move together (convergent) causing earthquakes but no subduction so no volcanic activity
Constructive/divergent boundaries e.g. Mid-Atlantic Ridge, East African Rift Valley: Plates move apart creating rifts with earthquakes and volcanic activity
Landslides/mass movement e.g. numerous locations, see below: Can result from slope destabilisation in monsoon climate. May link to deforestation of hillsides or to El Nino (Peru, California) or La Nina (Philippines). Triggered by EQ / heavy rain (La Conchita 2005, UK 2014 )
Other secondary hazards linked to plate boundary locations: Volcanoes linked to lahar (Pinatubo) or glacier melt (Nevado del Ruiz). Tsunami with subduction zone EQ (Japan 2011)
Hotspots (Hawaii) may be discussed. Or intra-plate earthquakes. Locations more at risk When a vulnerable population is affected (may use Degg model) Philippines has low GDP/fast growing population. Limited investment in protection California has large underclass of poor (e.g. Watts in LA, illegal immigrants from
Mexico so lack acquired knowledge of disaster risk). • Hydro-met hazards only to be credited when linked to geophysical hazards. Credit examples and other approaches where relevant.
Level Mark Descriptor Level 1 1-4 Lacks structure.
Description of geophysical hazards/disasters (e.g. earthquakes at San Andreas Fault system)
Lacks explanation of risk Frequent written language errors.
Level 2 5-8 Some structure. Basic explanation of a limited range of geophysical hazards and/or causes
of risk and can link these to locations (e.g. California and Philippines). Comments about higher risk is brief or inaccurate. Geographical terminology is used. There are some written language errors.
Level 3 9-12 Structured account Explains the distribution of a range of geophysical hazards (e.g. accurate
about plate boundary type). May include secondary hazards or links to vulnerability (human factors).
Explains how physical and/or human processes are linked to location Geographical terms show understanding. Written language errors are minor.
Level 4 13-15
Well-structured account Detailed explanation of reasons for the distribution of range of geophysical
hazards, including complex causes of secondary hazard (e.g. landslides/tsunami/lahars) or reasons for human elements of risk.
Explains physical and/or human processes accurately linked to distribution. Uses appropriate geographical terms and exemplification to show
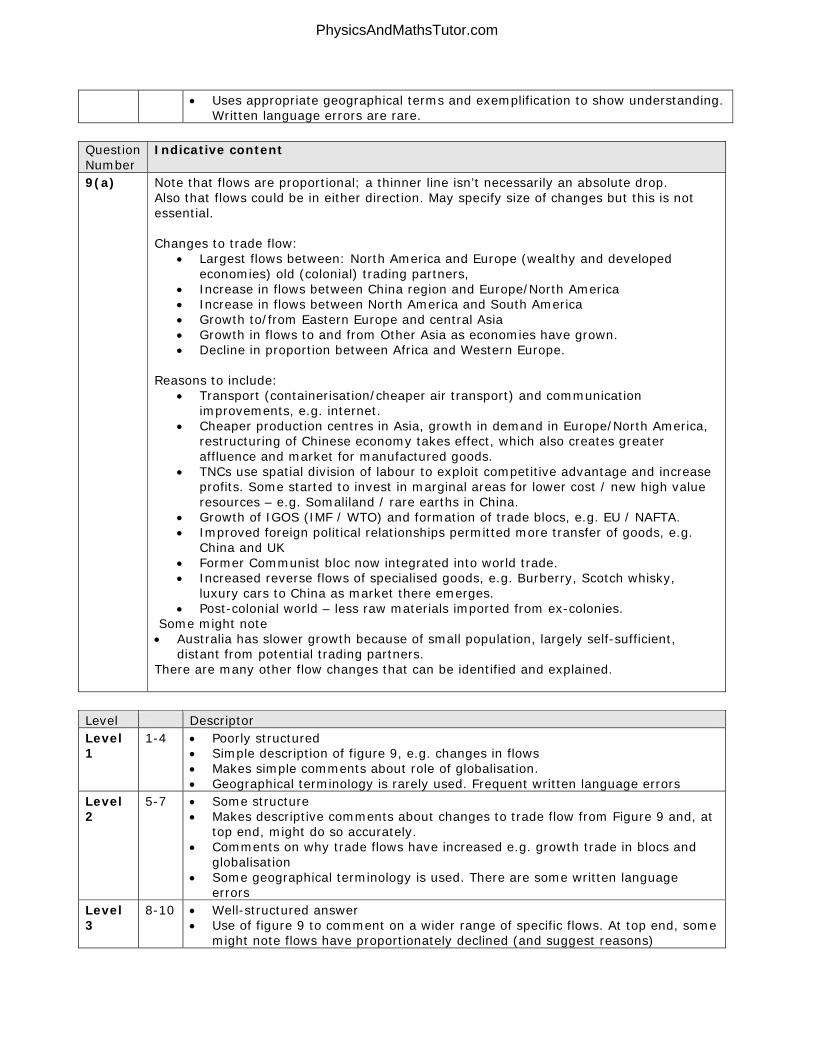
understanding. Written language errors are rare.
PhysicsAndMathsTutor.com

Question Number
Indicative Content
8a Data shows major differences between world average emissions (developed vs. developing) Images suggest poor communities in countries such as Bangladesh suffer from the results of global warming, whereas wealthy UK has Thames Barrier as can afford complex adaptation techniques. Impacts of global warming:
Unpredictable climate such as rising average temperatures, prolonged periods without rain, late or erratic rainfall / tropical storms
Resulting in water stress, reduced yields, effects on food security, loss of commercial crops (e.g. tea, coffee and roses in Kenya), subsistence farmers cannot grow enough for family
Sea level rise affects low lying areas Impacts on ecosystems may be mentioned in Africa or Arctic Diseases spread more widely, e.g. malarial mosquitoes in new areas
May be seen as unfair: High emissions, low impact – why? Growth of globalisation in wealthier countries
(low cost air travel), but equally can afford to adapt (e.g. Thames Barrier) High emission, high impact – why? Consumer demand and online shopping
increases consumption, resulting in more waste and methane (landfill), particularly cooler climates means higher emissions, but some suffering because of physical location, e.g. Netherlands being low-lying
Low emissions, high impact – why? Low levels of CO2 emissions from these countries due to low fossil fuel use, lack of technology can be seen as an issue of injustice. However insufficient income to adapt to repeated flooding and global sea-level rise, e.g. Bangladesh
Impacts might be felt unequally within countries, i.e. poor suffer more within Bangladesh.
Some may recognise situation is changing, with China’s levels rising due to reliance on polluting coal, being ‘workshop for the world’, but others e.g.UK/Netherlands starting to fall and economic growth in Asia results in increased energy demand particularly for electricity and for domestic products.
Some candidates might point to countries with low emissions, low impact which arguably might be seen as fair, e.g. New Zealand, Costa Rica
Level Mark Descriptor Level 1 1-4 Poorly structured
Simple description of figure 8, e.g. higher emission or use of photo Makes simple comments about impacts of GW being unfair. Geographical terminology is rarely used. There are frequent written language
errors Level 2 5-7 Some structure
Makes descriptive comments about emissions or impacts linked to figure 8 and might begin to make reference to examples beyond those on resource.
Comments on why impacts on a location might be seen as “unfair” Some geographical terminology is used. There are some written language
errors Level 3 8-10 Well-structured answer that gives a detailed range of reasons why global
warming may be considered to be unfair Use of figure 8 to contrast emissions and impacts. May include comment
about specific examples from own knowledge. Suggests reasons why impacts on the poor are unfair, and how richer/more
developed communities may be to blame / can afford to adapt. Appropriate geographical terms show understanding. Minor language errors.
PhysicsAndMathsTutor.com

Question Number
Indicative content
8(b) Natural causes of climate change- Explanation should be given of how /why natural changes have driven periods of warming /cooling. Milankovitch cycle: Earth’s orbit (elliptical to circular cycle over approx. 100,000
years) / tilt (angle alters over 41 000 cycle)/ and wobble (21 000 years) variations each have specific effects on radiation received at earth and consequently length of seasons. Credit detailed knowledge here if accurate.
Sunspots follow cycles of approx. 11 years plus longer term trends (more sun spots/storms, more radiation, hotter temperatures) linked in part to Medieval Warm Period 950-1250AD and Little Ice Age (1350-1850AD).
Material from meteorite impact or volcanic activity (ash and e.g. sulphur dioxide (SO2) cause cooling (e.g. Krakatoa > 1°C cooling).Time scale depends on the scale and type of eruption. Ash drops out of the atmosphere faster than gases.
ENSO changes over approx. 5-7year cycle: El Nino: Peru, warmer ocean leads to low pressure, evaporation and intense rainfall. Australia/ Philippines, colder water, sinking air, drought). La Nina: intense version of normal patterns
Albedo effect is a naturally occurring positive feedback that occurs as temperatures rise (less ice, more absorption of radiation, so temperatures rise further). Occurs immediately as reflectivity changes.
Methane hydrate melting as positive feedback linked to warmer seas Cloud cover may increase with temperature (more evaporation) so more solar
energy is reflected back to space and warming is reduced (negative feedback). Climate change includes both rise and fall in temperatures, with consequent effects on rainfall. Global variations, for example changes in season length and temperatures, will have a more dramatic effect at the poles. Timescales maybe addressed separately or alongside each cause. Do not allow methane increases from cattle, or deforestation as these are due to human activity. Only credit feedback mechanisms if linked to physical processes (not permafrost melt leading to methane release cycle). Do not allow consequences/impacts of climate change
Level Mark Descriptor Level 1
1-4 One or two generalised statements Description of causes (e.g. volcanoes / sunspots / changes in orbit) Lacks comment about timescale Frequent written language errors.
Level 2
5-8 Some structure. Basic explanation of a limited range of climate change causes Some comments on timescales, but brief or inaccurate. Some geographical terminology is used. There are some written language errors.
Level 3
9-12 Structured account Explains a range of natural causes of climate change OR or detailed explanation
of a narrower range (e.g. detailed explanations of Milankovitch variations) Accurate comments about different timescales. Geographical terms show understanding. Written language errors are minor.
Level 4
13-15
Well-structured account Detailed explanation of wide range of natural causes with precise details ( may
consider interactions of different causes / feedback). Accurate comments about different timescales
PhysicsAndMathsTutor.com
Uses appropriate geographical terms and exemplification to show understanding. Written language errors are rare.
Question Number
Indicative content
9(a) Note that flows are proportional; a thinner line isn’t necessarily an absolute drop. Also that flows could be in either direction. May specify size of changes but this is not essential. Changes to trade flow:
Largest flows between: North America and Europe (wealthy and developed economies) old (colonial) trading partners,
Increase in flows between China region and Europe/North America Increase in flows between North America and South America Growth to/from Eastern Europe and central Asia Growth in flows to and from Other Asia as economies have grown. Decline in proportion between Africa and Western Europe.
Reasons to include:
Transport (containerisation/cheaper air transport) and communication improvements, e.g. internet.
Cheaper production centres in Asia, growth in demand in Europe/North America, restructuring of Chinese economy takes effect, which also creates greater affluence and market for manufactured goods.
TNCs use spatial division of labour to exploit competitive advantage and increase profits. Some started to invest in marginal areas for lower cost / new high value resources – e.g. Somaliland / rare earths in China.
Growth of IGOS (IMF / WTO) and formation of trade blocs, e.g. EU / NAFTA. Improved foreign political relationships permitted more transfer of goods, e.g.
China and UK Former Communist bloc now integrated into world trade. Increased reverse flows of specialised goods, e.g. Burberry, Scotch whisky,
luxury cars to China as market there emerges. Post-colonial world – less raw materials imported from ex-colonies.
Some might note Australia has slower growth because of small population, largely self-sufficient,
distant from potential trading partners. There are many other flow changes that can be identified and explained.
Level Descriptor Level 1
1-4 Poorly structured Simple description of figure 9, e.g. changes in flows Makes simple comments about role of globalisation. Geographical terminology is rarely used. Frequent written language errors
Level 2
5-7 Some structure Makes descriptive comments about changes to trade flow from Figure 9 and, at
top end, might do so accurately. Comments on why trade flows have increased e.g. growth trade in blocs and
globalisation Some geographical terminology is used. There are some written language
errors Level 3
8-10 Well-structured answer Use of figure 9 to comment on a wider range of specific flows. At top end, some
might note flows have proportionately declined (and suggest reasons)
PhysicsAndMathsTutor.com

Suggests a wide range of accurate and detailed reasons for changes to specific flows.
Appropriate geographical terms show understanding. Minor language errors.
Question Number
Indicative content
9(b) Global networks include transport (air, container ships, railway and road) and communication (IT including Skype, mobiles, internet) and the goods, money and people that flow along them. These may be discussed in the context of business and TNCs, tourism, migration, or other factors. Do not expect all factors to be covered. ‘Switched on’ / Switched off because of Political / Economic
o Political approach to communication, e.g. China’s approach to Google/Facebook and North Korea’s rejection of contact
o Government attitudes to investment, e.g. EPZ / infrastructure, however might not invest in periphery areas (e.g. W China)
o High population with wealth creates TNC market o May be located in trade blocs
Environment / Physical Geography o Physical resources: oil, iron ore, sun and beaches for tourism o Coastal location or strategic location (Pacific rim) o Vulnerable to ongoing natural hazards (e.g. Bangladesh) – but note
California is switched on Social / Technological
o Educated and skilled population, o Corruption / Civil conflict and associated poverty of individuals and
governments Examination might include Consideration of why some areas remain long-term switched off (e.g. Bottom
Billion/North Korea), or at centre of multiple global flows (e.g. global hubs) Compares different factors – e.g. physical vs. human geography barriers
Level Mark Descriptor Level 1
1-4 One or two generalised statements Descriptions about why places are switched on/off (e.g. landlocked / oil / coastal) No clear evidence used to illustrate. Frequent written language errors.
Level 2
5-8 Some structure. Basic explanation of why some areas become switched on and/or off Comments on places, but details are brief or inadequate Some geographical terminology is used. There are some written language errors.
Level 3
9-12 Structured account Explains why a range of reasons creates switched on and off but may be
unbalanced. Accurate use of examples to show why they’re connected to global networks. Geographical terms show understanding. Written language errors are minor.
Level 4
13-15
Well-structured account Explains a wider range of reasons for both switched/off and may include some
examination (e.g. relative importance / remaining switched off)
PhysicsAndMathsTutor.com

Exemplification shows real-world understanding of the degree of connection to global networks.
Uses appropriate geographical terms and exemplification to show understanding. Written language errors are rare.
Question Number
Indicative content
10 (a) Megacity definitions vary so accept 8m or 10m upwards. The focus of the question is about developing-world megacities (Karachi, Lagos etc), and demographic growth - the graph shows steady growth from 1920 to 1980, more rapid growth afterwards. Reasons for demographic growth could include: Push factors from rural areas
o Rural conditions e.g. limited education/ healthcare/ infrastructure / electricity/shortages of food/sanitation /clean water.
o Ageing populations/ lack of young people/activities leads to demultiplier effects /spiral of decline/restrictive customs or practices (especially for women or minority groups).
o Civil war and/or fear of militia groups. Pull factors, including TNC investment
o Greater range of opportunities: education, jobs, higher wages and more reliable income with potential for progression
o Formal opportunities, e.g. manufacturing jobs for TNCS / in EPZs and chance for promotion. Tertiary / quaternary centre work
o Informal opportunities, e.g. buying/selling/recycling/own business o May have specifics about attractions of megacities as hubs with
access to TNCs, healthcare, government, investment, sport, entertainment, universities etc.
o International migration, possibly refugees Fertility
o Fertile age groups migrate so birth-rates high, but contraception o Vaccination programmes/ improved sanitation reduce mortality
rates o Hospital/medical care is growing so life expectancy is increasing
Some candidates might explore other types of growth, e.g. natural growth – (slum areas expanding on the outskirts of the city) or economic growth – creation of jobs and other opportunities because of increased income.
Credit use of examples of cities with details. Specific knowledge of Karachi is not expected, but candidates should make reference to graph data (for example natural increase could be used to explain the increased population) or to the photograph (e.g.jobs/housing/birth-rate). Do not allow developed country examples.
Level Mark Descriptor Level 1
1-4 Poorly structured. Simple description of figure 10, e.g. about megacity growth Makes simple comments about movement from the countryside, or search for
jobs in city Geographical terminology is rarely used. Frequent written language errors
Level 2
5-7 Some structure Makes descriptive comments about megacity growth based on figure 10, and
might provide own example. Comments on a range of reasons for megacity growth in the developing world
PhysicsAndMathsTutor.com

Some geographical terminology (e.g. push and pull). Some written language errors
Level 3
8-10 Well-structured answer Use of figure 10 and at the top end is also likely to consider the changing rate
of demographic growth or use detailed examples in support. Suggests a wider range of causes of megacity growth Geographical terms show understanding. Minor language errors.
PhysicsAndMathsTutor.com

Question Number Indicative content
10(b) Any megacity (8m plus) may be considered here and good answers will make contrasts. There are different types of challenge in immature/consolidating/ maturing/established megacities. Challenges: Ongoing rapid growth: fuelled by rural-urban migration and/or international
migration so increasing demands for housing/water/sanitation/jobs/food Cost: many cities are seeing wealthy residents/businesses moving to the suburbs
taking tax revenue and spending with them. Strategies often require major investment and any “pay-back” may be long term or hidden (e.g. TNCs often require low cost labour so encourage new migrants. Are often “footloose” and will move elsewhere if profits are threatened)
Pollution: major issue in consolidating cities. Crime/corruption. Maintaining services whilst improving infrastructure, especially transport
Lack of greenspace / public amenities Space for expansion: Greenbelt can create planning challenges (e.g. Southall)
whilst brownfield is more expensive to clear (e.g. Greenwich) Historical planning can make redevelopment difficult, e.g. narrow Victorian streets Candidates may also comment on different strategies for making megacities more sustainable, and the challenges faced in meeting them. These might include a range of aspects including protecting the environment, affordable housing, minimising travel between work and home, reducing use of private transport, fair wages and prices.
Examination might include Compares challenges – e.g. social / economic / environmental recognise the difference between plans and implementation. They are likely to
discuss the challenges experienced in megacities all over the world in putting plans into practice alongside maintaining the economy
Note that candidates can get full marks writing about one city, if they’ve included a good range of challenges or solutions and some sort of examination.
Level Mark Descriptor Level 1 1-4 One or two generalised statements.
Descriptions of generic problems faced in megacities (overcrowding / slums / pollution)
Frequent written language errors. Level 2 5-8 Some structure.
Basic explanation of problems in megacity (e.g. water shortages / type of pollution / land prices)
Comments on examples or challenges, but the details are brief or inadequate.
Some geographical terminology is used. There are some written language errors
Level 3 9-12 Structured account Explains why a range of challenges makes sustainability difficult to achieve
in megacities. Accurate use of examples to show the challenges they face Geographical terms show understanding. Written language errors are
minor.
PhysicsAndMathsTutor.com

Level 4 13-15 Well-structured account Explains a wider range of challenges found in megacities and may include
some examination (e.g. relative level of challenge / type of challenge) Detailed explanation of the degree of challenge faced in specific megacities. Uses appropriate geographical terms and exemplification to show
understanding. Written language errors are rare.
PhysicsAndMathsTutor.com

Pearson Education Limited. Registered company number 872828 with its registered office at Edinburgh Gate, Harlow, Essex CM20 2JE
PhysicsAndMathsTutor.com


![]Mark Scheme (Results) January 2019 Pearson Edexcel](https://img.dokumen.tips/doc/110x75/6175a33a4d4dc05cbe4db1b2/mark-scheme-results-january-2019-pearson-edexcel-.jpg)