Embed Size (px)
Citation preview

To Our Shareholders,
For the quarter ended March 31, 2018, the net asset value (“NAV”) total return of The Gabelli Equity Trust (the“Fund”) was (0.8)%, compared with total returns of (0.8)% and (2.0)% for the S&P 500 Index and the Dow JonesIndustrial Average, respectively. The total return for the Fund’s publicly traded shares was 1.3%. The Fund’s NAVper share was $6.27, while the price of the publicly traded shares closed at $6.12 on the New York StockExchange (“NYSE”). See page 3 for additional performance information.
The Gabelli Equity Trust Inc.Shareholder Commentary – March 31, 2018
Robert D. Leininger, CFAPortfolio Manager
BA, Amherst CollegeMBA, Wharton School,
University of Pennsylvania
Mario J. Gabelli, CFAChief Investment Officer
Christopher J. MarangiCo-Chief Investment Officer
BA, Williams College MBA, ColumbiaBusiness School
Daniel M. MillerManaging Director,GAMCO Investors
BS, University of Miami
Kevin V. DreyerCo-Chief Investment Officer
BSE, University ofPennsylvania
MBA,ColumbiaBusiness School
(Y)our Portfolio Management Team
Jennie TsaiAnalyst
BS, University of VirginiaMBA,Columbia
Business School

2
-40%
’91 ’92 ’93 ’94 ’95 ’96’89’88’87’86 ’90 ’97 ’98 ’99 ’00 ’01
-10%
-20%
0
10%
20%
30%
-30%
40%
PREMIUM/DISCOUNT SINCE INCEPTION
’02 ’03 ’06
8/21/86
’07’05’04
Data points as of each month end.
’08 ’09 ’10
March 31, 2018
Net Asset Value $6.27
Market Price $6.12
Discount 2.39%
’13’12’11 ’14 ’15 ’16 ’17
3/31/17
Premium / Discount Discussion
As a refresher for our shareholders, the price of a closed-end fund is determined in the open market by
willing buyers and sellers. Shares of the Fund trade on the NYSE and may trade at a premium to (higher than)
net asset value (the market value of the Fund’s underlying portfolio and other assets less any liabilities) or a
discount to (lower than) net asset value.
Ideally, the Fund’s market price will generally track the NAV. However, the Fund’s premium or discount to
NAV may vary over time. Over the Fund’s thirty-one year history, the range fluctuated from a 27% discount in
December 1987 to a 38% premium in June 2002. On March 31, 2018, the market price of the Fund was at a
2.4% discount to its NAV.
The Fund’s long term investment goal is growth of capital, with income as a secondary objective. The
Fund seeks to generate a real rate of return of 10%. We believe that our stock selection process adds to the
investment equation. We have a successful history of investment, providing shareholders average annual
returns of 10.9% since inception.

3
First Quarter Commentary
January 2018 saw the stock market continue its near uninterrupted climb, but volatility finally returned
with a sharp decline in February and continued choppiness in March, leading to major averages posting their
first quarterly declines since 2015. Economic fundamentals continued to be largely positive - synchronous
global growth, low unemployment, corporate profits boosted by tax reform, and lower personal taxes for many
Americans – but a new set of worries came to the fore for investors already uneasy about stretched valuations:
trade wars, regulatory risks in the technology sector, and the U.S. Federal Reserve’s gradual liquidity reduction
and rising policy rate, plus the prospect for the same from the European Central Bank.
There are many moving pieces for the market to digest in real time, and thus many unanswered questions
– whether the $100 billion-plus trade tariffs are simply negotiating tactics, how aggressive Congress will be on
data privacy and business models, how quickly inflation will come back, and how aggressively the Fed will
raise rates to stay ahead of it. The most demanding question to be answered is — how much trouble the
markets can withstand at once? In isolation, current headwinds seem manageable as long as fundamentals
remain the priority. Rising uncertainties may keep the stock market on edge, but corporate profit growth,
aggressive corporate stock buybacks, and deals should provide a cushion for any selloffs.
As always, our job as analysts and portfolio managers is to sift through the noise and buy a portfolio of
strong businesses at attractive prices. Many excellent companies are now available at cheaper valuations than
Average Annual Returns through March 31, 2018 (a)Since
InceptionQuarter 1 Year 5 Year 10 Year 15 Year 20 Year 25 Year (08/21/86)———— ——— ——— —––—— —––—— —––—— ———–—— ———–——
Gabelli Equity TrustNAV Total Return (b) . . . . . . (0.84)% 15.87% 11.20% 9.37% 12.64% 8.69% 10.29% 10.93% Investment Total Return (c) 1.28 13.86 10.00 8.37 10.83 8.48 9.89 10.57
S&P 500 Index . . . . . . . . . . . . . . . (0.76) 13.99 13.31 9.49 10.10 6.46 9.47 10.18(d)Dow Jones Industrial Average . . . (1.97) 19.34 13.25 9.81 10.36 7.64 10.66 11.22(d)Nasdaq Composite Index . . . . . . . 2.59 20.90 18.13 13.31 12.96 7.95 9.74 10.00(e)
(a) Returns represent past performance and do not guarantee future results. Investment returns and the principal valueof an investment will fluctuate. When shares are sold, they may be worth more or less than their original cost. Currentperformance may be lower or higher than the performance data presented. Visit www.gabelli.com for performanceinformation as of the most recent month end. Performance returns for periods of less than one year are notannualized. Investors should carefully consider the investment objectives, risks, charges, and expenses of the Fundbefore investing. The Dow Jones Industrial Average is an unmanaged index of 30 large capitalization stocks. TheS&P 500 and the Nasdaq Composite Indices are unmanaged indicators of stock market performance. Dividends areconsidered reinvested except for the Nasdaq Composite Index. You cannot invest directly in an index.
(b) Total returns and average annual returns reflect changes in the NAV per share, reinvestment of distributions at NAVon the ex-dividend date, adjustments for rights offerings, spin-offs, and taxes paid on undistributed long term capitalgains and are net of expenses. Since inception return is based on an initial NAV of $9.34.
(c) Total returns and average annual returns reflect changes in closing market values on the NYSE, reinvestment ofdistributions, and adjustments for rights offerings, spin-offs, and taxes paid on undistributed long term capital gains.Since inception return is based on an initial offering price of $10.00.
(d) From August 31, 1986, the date closest to the Fund’s inception for which data is available.(e) From September 30, 1986, the date closest to the Fund’s inception for which data is available.
Comparative Results

4
three months ago, a situation we welcome as value investors. While deal activity slowed in 2017, largely due
to uncertainty over tax policy, we believe that the acceleration of mergers and acquisitions (M&A) in the first
quarter is a harbinger of things to come. With our Private Market Value with a CatalystTM methodology, we
believe (y)our Fund is uniquely positioned to benefit from increased deal activity.
Deals, Deals & More Deals
Global merger and acquisition activity accelerated to a record $1.2 trillion in the first quarter of this year,
up 60% compared to the first quarter of 2017, following the passage of U.S. tax reform and a boost from the
catalyst of shareholder activists. CEOs are initiating major transactions sparked by excess cash and the goal of
growing the top and bottom line. Overall, 11,136 worldwide deals were announced during the quarter, down 11%
from a year ago, indicating that mega deals are driving transaction value. We anticipate that deal volume will
accelerate as the year goes on and small and mid-cap companies will participate in the M&A upswing.
In January, Fund holding Dr. Pepper Snapple Group (+23%) announced it agreed to merge with privately
held Keurig Green Mountain. Dr Pepper Snapple shareholders will receive $103.75 per share in a special cash
dividend and retain 13% of the combined company, to be called Keurig Dr Pepper (KDP). KDP will have pro
forma combined 2017 annual revenues of approximately $11 billion and iconic beverage brands including Dr
Pepper, 7UP, Snapple, A&W, Mott’s and Sunkist, along with leading coffee brand Green Mountain Coffee
Roasters and the Keurig single serve coffee system, as well as more than 75 owned, licensed, and partner
brands in the Keurig system.
We believe the ingredients of a robust M&A environment – low cost of financing, synergy-driven industry
consolidation, and the availability of many new pure-play companies due to financial engineering – continue to
be in place, and visibility on tax policy removes a major impediment to deal activity.
Investment Scorecard
Top contributors to performance during the quarter included MasterCard (+16%), which beat expectations
with net revenue growth of 20% in the fourth quarter of 2017 and raised its medium term outlook; Rollins (+10%),
which reported strong organic growth in 2017 across segments, with the termite/ancillary segment up over 8%;
Swedish Match (+14%), which continues to grow its smokeless tobacco portfolio and saw sales boosted by its
tobacco-free Zyn brand; Madison Square Garden (+17%), which rose on strong fiscal second quarter results
from its Entertainment and Sports divisions, and 6% shareholder Silver Lake Partners filing a 13D stating that it
believes shares are undervalued and would like to support MSG and its efforts to create long term value; and
Curtiss-Wright (+11%), which continues to benefit from the commercial aerospace and defense growth cycle as
well as the outlook for nuclear energy development in China and India.
Detractors from performance included Rogers Communications (-12%), which declined along with the
pay-TV universe amid continued headlines regarding cord-cutting; Honeywell (-5%), which declined due to

5
concerns about potential American and Chinese trade tariffs impacting the commercial and corporate
aerospace industry; American Express (-6%), which declined after announcing the firm had suspended the first
half repurchase program to rebuild capital ahead of the annual stress test in June; Wells Fargo (-13%), whose
shares declined mainly to its ongoing legacy customer engagement practices and regulatory scrutiny from the
Federal Reserve, which took extraordinary action in February to improve operational compliance; and Edgewell
Personal Care (-18%), which reported continued disappointing fiscal first quarter performance amid the
ongoing price war initiated by its primary mens wet shaving competitor Gillette.
Conclusion
Market volatility, long overdue, is back. As active stock pickers, this is the kind of environment for us to
prove our mettle. Risks remain as always, but we also have an opportunity to buy many businesses at more
attractive prices than we could just a few months ago, and we plan to take advantage of any opportunity
“Mr. Market” provides us. We continue to seek high quality companies trading at a discount to Private Market
Value – the price an informed industrialist would pay to own an entire business – and look for catalysts to
surface value, such as industry consolidation, financial engineering, new management, regulatory changes, or
a change in cash flow allocation.
Let’s Talk Stocks
The following are stock specifics on selected holdings of our Fund. Favorable earnings prospects do not
necessarily translate into higher stock prices, but they do express a positive trend that we believe will develop
over time. Individual securities mentioned are not necessarily representative of the entire portfolio. For the
following holdings, the share prices are listed first in United States dollars (USD) and second in the local
currency, where applicable, and are presented as of March 31, 2018.
The Boeing Company (BA – $327.88 – NYSE), based in Chicago, Illinois, is one of the largest aerospace and
defense companies. It is organized into four segments: Commercial Airplanes; Defense, Space & Security;
Global Services; and Boeing Capital. Commercial Airplanes manufactures commercial jet aircraft and provides
fleet support services, principally to the commercial airline industry worldwide. BA is a leading producer of
commercial aircraft and offers a family of commercial jetliners designed to meet a broad spectrum of global
passenger and cargo requirements of airlines. This family of commercial jet aircraft in production includes the
737 narrow-body model and the 747, 767, 777, and 787 wide-body models. Development continues on the
787-10 and certain 737 MAX derivatives and the 777X program. Defense, Space & Security is engaged in the
research, development, production, and modification of manned and unmanned military aircraft and weapons
systems for global strike, including fighter aircraft and missile systems; vertical lift, including rotorcraft and tilt-
rotor aircraft; mobility, surveillance and engagement, including battle management, airborne, anti-submarine,
transport and tanker aircraft. In addition, this segment is engaged in the research, development, production and
modification of the following products and related services: strategic defense and intelligence systems,
6
including strategic missile and defense systems, command, control, communications, computers, intelligence,
surveillance and reconnaissance (C4ISR), cyber and information solutions, and intelligence systems; satellite
systems, including government and commercial satellites and space exploration. Global Services provides
services to commercial and defense customers. This segment offers aviation services support, aircraft
modifications, spare parts, training, maintenance documents, data analytics and information-based services,
and technical advice to commercial and government customers worldwide. Boeing Capital seeks to ensure that
Boeing customers have the financing they need to buy and take delivery of their Boeing product, and manages
overall financing exposure. BCC’s portfolio consists of equipment under operating leases, finance leases,
notes and other receivables, assets held for sale or re-lease, and investments.
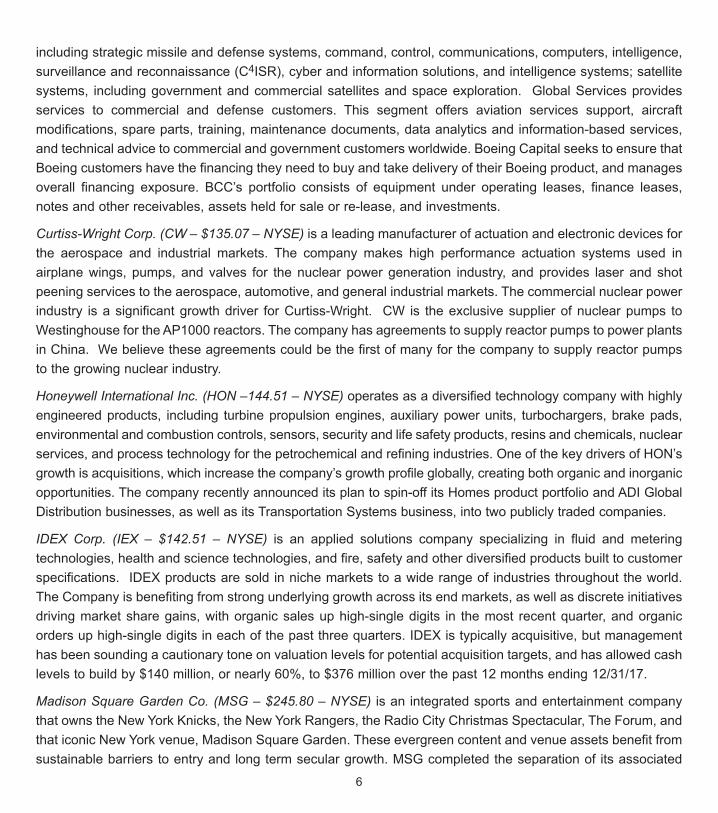
Curtiss-Wright Corp. (CW – $135.07 – NYSE) is a leading manufacturer of actuation and electronic devices for
the aerospace and industrial markets. The company makes high performance actuation systems used in
airplane wings, pumps, and valves for the nuclear power generation industry, and provides laser and shot
peening services to the aerospace, automotive, and general industrial markets. The commercial nuclear power
industry is a significant growth driver for Curtiss-Wright. CW is the exclusive supplier of nuclear pumps to
Westinghouse for the AP1000 reactors. The company has agreements to supply reactor pumps to power plants
in China. We believe these agreements could be the first of many for the company to supply reactor pumps
to the growing nuclear industry.
Honeywell International Inc. (HON –144.51 – NYSE) operates as a diversified technology company with highly
engineered products, including turbine propulsion engines, auxiliary power units, turbochargers, brake pads,
environmental and combustion controls, sensors, security and life safety products, resins and chemicals, nuclear
services, and process technology for the petrochemical and refining industries. One of the key drivers of HON’s
growth is acquisitions, which increase the company’s growth profile globally, creating both organic and inorganic
opportunities. The company recently announced its plan to spin-off its Homes product portfolio and ADI Global
Distribution businesses, as well as its Transportation Systems business, into two publicly traded companies.
IDEX Corp. (IEX – $142.51 – NYSE) is an applied solutions company specializing in fluid and metering
technologies, health and science technologies, and fire, safety and other diversified products built to customer
specifications. IDEX products are sold in niche markets to a wide range of industries throughout the world.
The Company is benefiting from strong underlying growth across its end markets, as well as discrete initiatives
driving market share gains, with organic sales up high-single digits in the most recent quarter, and organic
orders up high-single digits in each of the past three quarters. IDEX is typically acquisitive, but management
has been sounding a cautionary tone on valuation levels for potential acquisition targets, and has allowed cash
levels to build by $140 million, or nearly 60%, to $376 million over the past 12 months ending 12/31/17.
Madison Square Garden Co. (MSG – $245.80 – NYSE) is an integrated sports and entertainment company
that owns the New York Knicks, the New York Rangers, the Radio City Christmas Spectacular, The Forum, and
that iconic New York venue, Madison Square Garden. These evergreen content and venue assets benefit from
sustainable barriers to entry and long term secular growth. MSG completed the separation of its associated

7
regional sports networks in September 2015, leaving a reliable cash flow stream for MSG to reinvest and
repurchase shares.
MasterCard Inc. (MA – $175.16 – NYSE) is one of the largest electronic payments processing companies,
providing services in more than 210 countries and territories. It continues to capitalize on the strong secular
global trend of moving to electronic payments from traditional paper. For all of 2017, clients charged
approximately $5.2 trillion. At the end of December 2018, cards in force totaled over 1.8 billion. Longer term,
MasterCard is well positioned to increase revenue, due to global growth in personal incomes, rapid increase
in commerce, and movement to electronic payment.
Rogers Communications Inc. (RCI – $44.68 – NYSE), headquartered in Toronto, Ontario, is a diversified
communications and media company. It owns the largest national wireless service provider in Canada, serving
10.5 million customers, the largest Canadian cable MSO, serving 1.7 million video customers, 2.2 million
broadband connections, and 1.1 million phone subscribers, and a media business that includes TV and radio
broadcasting, publishing, and sports. The sports business represents over 50% of media revenues and
includes ownership of the Toronto Blue Jays Baseball club and a 37.5% investment in Maple Leaf Sports &
Entertainment, as owner of the Toronto Maple Leafs, the Toronto Raptors, and the Toronto FC. RCI continues
to follow Rogers 3.0 strategic plan, initiated in mid-2014 and focused on re-accelerating growth in a sustainable
way and continuing the company’s track record of translating revenue into strong margins and free cash flow,
a solid return on assets, and ultimately increasing returns to shareholders. In January 2018, Rogers reported
essentially in-line fourth quarter 2017 revenues and adjusted operating profit, as well as somewhat weaker
than expected postpaid net additions, largely due to elevated churn – a result of heightened competitive
intensity in the fourth quarter, particularly during the holiday season. On April 19, 2017, the company completed
the CEO transition process that was initially announced in October 2016, as Joe Natale officially joined Rogers
as President and CEO, after a confidential agreement was reached with TELUS Corporation to secure his early
arrival. Mr. Natale was most recently President & CEO of TELUS, leaving the company in August of 2015.
Rollins Inc. (ROL – $51.03 – NYSE) provides pest control services to nearly two million residential and
commercial customers throughout North America, primarily under the Orkin and Western Pest brand names.
Its services are critical to homeowners and commercial establishments alike, in both expansionary and
recessionary times. The company has benefited from growth in the commercial service area and mosquito and
bed bug treatments. At the same time, the company has controlled costs through more efficient scheduling and
routing. Rollins has been taking advantage of its strong balance sheet to make tuck-in acquisitions. It has also
begun franchising more operations outside the U.S. Founded in 1901, Rollins is majority owned by members
of the Rollins family.
Twenty-First Century Fox Inc. (FOXA – $36.69 – NASDAQ) is a diversified media company with operations in
cable network television, television broadcasting, and filmed entertainment. FOX is in the process of selling the
company’s cable, international, and entertainment assets to Disney for $65 billion or ~$28 per share. Following
the transaction, FOXA will consist of Fox News and The Fox Broadcasting Company. The company’s

8
concentration in live news and sports programming will be a significant advantage as it negotiates with both
traditional and entrant distributors. Pro forma for the Disney transaction, FOXA is trading at 8.1x EBITDA.
Xylem Inc. (XYL – $76.92 – NYSE) is a global leader in the design, manufacturing, and application of highly
engineered technologies for the transportation, treatment, measurement, and testing of water. The company is
expected to benefit from favorable long term fundamentals in the water industry, driven by scarcity, population
growth, aging of the infrastructure, and the need to improve water quality. Further, with a large installed base
of pumps and systems, the company is well positioned to increase aftermarket revenue, which currently
represents roughly 40% of total revenues. XYL expects to generate mid-teens earnings per share growth
through 2020 as it accelerates its capital deployment strategy globally. The company is currently building out
its infrastructure analytics capabilities as it integrates companies it has acquired in the past couple of years,
such as Sensus and Pure Technologies.
April 25, 2018
Note: The views expressed in this Shareholder Commentary reflect those of the Portfolio Managers only through
the end of the period stated in this Shareholder Commentary. The Portfolio Managers’ views are subject to
change at any time based on market and other conditions. The information in this Shareholder Commentary
represents the opinions of the individual Portfolio Managers and is not intended to be a forecast of future events,
a guarantee of future results, or investment advice. Views expressed are those of the Portfolio Managers and
may differ from those of other portfolio managers or of the Firm as a whole. This Shareholder Commentary does
not constitute an offer of any transaction in any securities. Any recommendation contained herein may not be
suitable for all investors. Information contained in this Shareholder Commentary has been obtained from
sources we believe to be reliable, but cannot be guaranteed. Beneficial ownership of shares held in the Fund by
Mr. Gabelli and various entities he is deemed to control are disclosed in the Fund’s annual proxy statement.
10% Distribution Policy for Common Stockholders
The Board of Directors of the Fund (the “Board”) has reaffirmed the continuation of the Fund’s 10%
distribution policy. Pursuant to its distribution policy, the Fund paid a $0.15 per share cash distribution on
March 22, 2018, to common stockholders of record on March 15, 2018.
Top Ten Holdings
March 31, 2018
Rollins Inc.
Honeywell International Inc.
MasterCard Inc.
Swedish Match AB
Berkshire Hathaway Inc.
American Express Co.
Twenty-First Century Fox Inc.
Curtiss-Wright Corp.
Ametek Inc.
Idex Corp.

9
The Fund intends to pay a quarterly distribution of an amount determined each quarter by the Board.
Under the Fund’s current distribution policy, the Fund intends to pay a minimum annual distribution of 10% of
the average net asset value of the Fund within a calendar year or an amount sufficient to satisfy the minimum
distribution requirements of the Internal Revenue Code, whichever is greater. The average net asset value of
the Fund is based on the average net asset values as of the last day of the four preceding calendar quarters.
Each quarter, the Board reviews the amount of any potential distribution from the income, capital gain, or
capital available. The Board will continue to monitor the Fund’s distribution level, taking into consideration the
Fund’s net asset value and the financial market environment. The Fund’s distribution policy is subject to
modification by the Board at any time. The distribution rate should not be considered the dividend yield or total
return on an investment in the Fund.
If the Fund does not generate sufficient earnings (dividends and interest income and realized net capital
gain) equal to or in excess of the aggregate distributions paid by the Fund in a given year, then the amount
distributed in excess of the Fund’s earnings would be deemed a return of capital. Since this would be
considered a return of a portion of a shareholder’s original investment, it is generally not taxable and is treated
as a reduction in the shareholder’s cost basis. Despite the challenges of the extra recordkeeping, a distribution
that incorporates a return of capital serves as a smoothing mechanism resulting in a more stable and consistent
cash flow available to shareholders.
Long term capital gains, qualified dividend income, ordinary income, and paid-in capital, if any, will be
allocated on a pro-rata basis to all distributions to common shareholders for the year. Based on the accounting
records of the Fund currently available, the current distribution paid to common shareholders in 2018 would
include approximately 4% from net investment income, 25% from net capital gains and 71% from paid-in capital
on a book basis. The estimated components of each distribution are updated and provided to shareholders of
record in a notice accompanying the distribution and are available on our website (www.gabelli.com). The final
determination of the sources of all distributions in 2018 will be made after year end and can vary from the
quarterly estimates. All shareholders with taxable accounts will receive written notification regarding the
components and tax treatment for all 2018 distributions in early 2019 via Form 1099-DIV.
Series C and Series E Auction Rate Cumulative Preferred Stock
During the first quarter of 2018, the dividend rates for the Series C and Series E Auction Rate Cumulative
Preferred Stock ranged from 2.451% to 2.958% and 2.381% to 3.011%, respectively. Dividend rates for the
Series C and Series E Preferred Shares may be reset every seven days based on the results of an auction.
Since February 2008, the number of Series C and Series E Preferred Shares subject to bid orders by potential
holders has been less than the number of sell orders. Therefore the weekly auctions have failed, and the holders
have not been able to sell any or all of the Series C and Series E Preferred Shares for which they submitted sell
orders. The dividend rate since then has been the maximum rate. At March 31, 2018, the maximum rate was
175% of the “AA” Financial Composite Commercial Paper Rate and the Series C and Series E Preferred Shares

10
are rated “A1” by Moody’s Investors Service and “AA” by Fitch Ratings. The Series C and Series E Preferred
Shares do not trade on an exchange. The Fund was authorized to issue 5,200 Series C Preferred Shares on
June 27, 2002, and 2,000 Series E Preferred Shares on October 7, 2003 at $25,000 per share. As of March 31,
2018, 2,880 and 1,120 Series C and Series E Preferred Shares, respectively, were outstanding.
5.875% Series D Cumulative Preferred Stock
The Fund’s 5.875% Series D Cumulative Preferred Stock paid a $0.3671875 per share cash distribution
on March 26, 2018, to preferred shareholders of record on March 19, 2018. The Series D Preferred Shares,
which trade on the NYSE under the symbol “GAB Pr D”, are rated “A1” by Moody’s Investors Service and have
an annual dividend rate of $1.46875 per share. The Series D Preferred Shares were issued on October 7,
2003, at $25.00 per share and pay distributions quarterly. After five years of call protection, the Series D
Preferred Shares became callable at any time at the liquidation value of $25.00 per share plus accrued
dividends. The next distribution is scheduled for June 2018.
The Fund is authorized to purchase its Series D Preferred Shares in the open market from time to
time when such shares are trading at a discount to the liquidation value of $25.00 per share. In total through
March 31, 2018, the Fund has repurchased and retired 156,140 Series D Preferred Shares in the open market
under this share repurchase authorization. The Fund did not repurchase any Series D Preferred Shares during
the first quarter of 2018.
Series G Cumulative Preferred Stock
The Fund’s Series G Cumulative Preferred Stock paid a $0.3125 per share cash distribution on
March 26, 2018, to preferred shareholders of record on March 19, 2018. The Series G Preferred Shares, which
trade on the NYSE under the symbol “GAB Pr G”, were issued on August 1, 2012 at $25.00 per share. The
Series G Preferred Shares pay distributions quarterly and, for the first twelve months beginning from the date
of issuance (August 1, 2012), had an annual dividend rate of 6.00%, and thereafter an annual dividend rate of
5.00% for all future dividend periods. After five years of call protection, the Series G Preferred Shares became
callable at any time at the liquidation value of $25.00 per share plus accrued dividends. The next distribution
is scheduled for June 2018.
The Fund is authorized to purchase its Series G Preferred Shares in the open market from time to time
when such shares are trading at a discount to the liquidation value of $25.00 per share. In total through March
31, 2018, the Fund has repurchased and retired 36,728 Series G Preferred Shares in the open market under
this share repurchase authorization. No shares were repurchased during the first quarter of 2018.

11
Series H Cumulative Preferred Stock
The Fund’s Series H Cumulative Preferred Stock paid a $0.3125 per share cash distribution on March 26,
2018, to preferred shareholders of record on March 19, 2018. The Series H Preferred Shares, which trade on
the NYSE under the symbol “GAB Pr H”, are rated “A1” by Moody’s Investors Service and have an annual
dividend rate of $1.25 per share. The Series H Preferred Shares were issued on September 28, 2012, at
$25.00 per share and pay distributions quarterly. After five years of call protection, the Series H Preferred
Shares became callable at any time at the liquidation value of $25.00 per share plus accrued dividends. The
next distribution is scheduled for June 2018.
The Fund is authorized to purchase its Series H Preferred Shares in the open market from time to time
when such shares are trading at a discount to the liquidation value of $25.00 per share. In total through March
31, 2018, the Fund has repurchased and retired 27,127 Series H Preferred Shares in the open market under
this share repurchase authorization. No shares were repurchased during the first quarter of 2018.
5.450% Series J Cumulative Preferred Stock
The Fund’s Series J Cumulative Preferred Stock paid a $0.340625 per share cash distribution on March
26, 2018, to preferred shareholders of record on March 19, 2018. The Series J Preferred Shares, which trade
on the NYSE under the symbol “GAB Pr J”, are rated “A1” by Moody’s Investors Service and have an annual
dividend rate of $1.3625 per share. The Series J Preferred Shares were issued on March 31, 2016, at $25.00
per share, and pay distributions quarterly. The Series J Preferred Shares will be callable at any time at the
liquidation value of $25.00 per share plus accrued dividends following the expiration of the five year call
protection on March 31, 2021. The next distribution is scheduled for June 2018.
The Fund is authorized to purchase its Series J Preferred Shares in the open market from time to time
when such shares are trading at a discount to the liquidation value of $25.00 per share. Through March 31,
2018, the Fund has not repurchased any Series J Preferred Shares in the open market under this share
repurchase authorization.
Long term capital gains, qualified dividend income, and ordinary income, if any, will be allocated on a pro-
rata basis to all distributions to preferred shareholders for the year. Based on the accounting records of the
Fund currently available, the current distribution paid to preferred shareholders represents approximately 14%
from net investment income and 86% from net capital gains on a book basis. The estimated components of
each distribution are updated and provided to shareholders of record in a notice accompanying the distribution
and are available on our website (www.gabelli.com). The final determination of the sources of all distributions
in 2018 will be made after year end and can vary from the quarterly estimates. All shareholders with taxable
accounts will receive written notification regarding the components and tax treatment for all 2018 distributions
in early 2019 via Form 1099-DIV.

12
Tax Treatment of Distributions to Common and Preferred Shareholders
All or part of the distributions may be treated as long term capital gain or qualified dividend income (or a
combination of both) for individuals, each subject to the maximum federal income tax rate, which is currently
20% in taxable accounts for individuals. In addition, certain U.S. shareholders who are individuals, estates, or
trusts and whose income exceeds certain thresholds will be required to pay a 3.8% Medicare surcharge on
their “net investment income,” which includes dividends received from the Fund and capital gains from the sale
or other disposition of shares of the Fund.
www.gabelli.com
Please visit us on the Internet. Our homepage at www.gabelli.com contains information about GAMCO
Investors, Inc., the Gabelli/GAMCO Closed-End Funds and Mutual Funds, IRAs, 401(k)s, current and
historical quarterly reports, closing prices, and other current news. We welcome your comments and
questions via e-mail at [email protected].
You may sign up for our e-mail alerts at www.gabelli.com and receive notice of quarterly report availability,
news events, media sightings, and mutual fund prices and performance.
e-delivery
We are pleased to offer electronic delivery of Gabelli fund documents. Shareholders of our closed-end
funds can now elect to receive e-mail announcements regarding available materials, including shareholder
commentaries and Fund reports. For more information or to register for e-delivery, please visit our website at
www.gabelli.com.Tax Treatment of Distributions to Common and Preferred Shareholders.

13
THE GABELLI EQUITY TRUST
AND YOUR PERSONAL PRIVACY
Who are we?
The Gabelli Equity Trust (the “Fund”) is a closed-end management investment companyregistered with the Securities and Exchange Commission under the Investment Company Actof 1940. We are managed by Gabelli Funds, LLC, which is affiliated with GAMCO Investors,Inc. GAMCO Investors, Inc. is a publicly held company that has subsidiaries and affiliates thatprovide investment advisory services for a variety of clients.
What kind of non-public information do we collect about you if you become a fund
shareholder?
When you purchase shares of the Fund on the New York Stock Exchange, you have theoption of registering directly with our transfer agent in order, for example, to participate in ourdividend reinvestment plan.
• Information you give us on your application form. This could include your name, address,telephone number, social security number, bank account number, and other information.
• Information about your transactions with us. This would include information about theshares that you buy or sell; it may also include information about whether you sell orexercise rights that we have issued from time to time. If we hire someone else to provideservices—like a transfer agent—we will also have information about the transactions thatyou conduct through them.
What information do we disclose and to whom do we disclose it?
We do not disclose any non-public personal information about our customers or formercustomers to anyone other than our affiliates, our service providers who need to know suchinformation, and as otherwise permitted by law. If you want to find out what the law permits,you can read the privacy rules adopted by the Securities and Exchange Commission. Theyare in volume 17 of the Code of Federal Regulations, Part 248. The Commission often postsinformation about its regulations on its website, www.sec.gov.
What do we do to protect your personal information?
We restrict access to non-public personal information about you to the people who need to knowthat information in order to provide services to you or the fund and to ensure that we arecomplying with the laws governing the securities business. We maintain physical, electronic,and procedural safeguards to keep your personal information confidential.

14
Notice is hereby given in accordance with Section 23(c) of the Investment Company Act of 1940, as amended, that theFund may from time to time purchase shares of its common stock in the open market when the Fund’s shares are tradingat a discount of 10% or more from the net asset value of the shares. The Fund may also from time to time purchase sharesof its preferred stock in the open market when the preferred stock are trading at a discount to the liquidation value.
The Net Asset Value per share appears in the Publicly Traded Funds column, under the heading “General Equity Funds,”in Monday’s The Wall Street Journal. It is also listed in Barron’s Mutual Funds/Closed End Funds section under the heading“General Equity Funds.”
The Net Asset Value per share may be obtained each day by calling (914) 921-5070 or visiting www.gabelli.com.
The Nasdaq symbol for the Net Asset Value per share is “XGABX.”
This report is printed on recycled paper.
We have separated the portfolio managers’ commentary from the financial statements and investment portfolio due tocorporate governance regulations stipulated by the Sarbanes-Oxley Act of 2002. We have done this to ensure that thecontent of the portfolio managers’ commentary is unrestricted. Both the commentary and the financial statements,including the portfolio of investments, will be available on our website at www.gabelli.com.

15
THE GABELLI EQUITY TRUST INC. One Corporate CenterRye, NY 10580-1422
Portfolio Management Team Biographies
Mario J. Gabelli, CFA, is Chairman, Chief Executive Officer, and Chief Investment Officer –Value Portfolios of
GAMCO Investors, Inc. that he founded in 1977, and Chief Investment Officer – Value Portfolios of Gabelli
Funds, LLC and GAMCO Asset Management Inc. He is also Executive Chairman of the Board of Directors of
Associated Capital Group, Inc. Mr. Gabelli is a summa cum laude graduate of Fordham University and holds
an MBA degree from Columbia Business School, and Honorary Doctorates from Fordham University and
Roger Williams University.
Christopher J. Marangi joined Gabelli in 2003 as a research analyst. Currently he is a Managing Director and
Co-Chief Investment Officer for GAMCO Investors, Inc.’s Value team. In addition, he currently serves as a
portfolio manager of Gabelli Funds, LLC and manages several funds within the Gabelli/GAMCO Funds
Complex. Mr. Marangi graduated magna cum laude and Phi Beta Kappa with a BA in Political Economy from
Williams College and holds an MBA with honors from Columbia Business School.
Kevin V. Dreyer joined Gabelli in 2005 as a research analyst covering companies within the consumer sector.
Currently he is a Managing Director and Co-Chief Investment Officer for GAMCO Investors, Inc.’s Value team.
In addition, he currently serves as a portfolio manager of Gabelli Funds, LLC and manages several funds within
the Gabelli/GAMCO Funds Complex. Mr. Dreyer received a BSE from the University of Pennsylvania and an
MBA from Columbia Business School.
Robert D. Leininger, CFA, joined GAMCO Investors, Inc. in 1993 as an equity analyst. Subsequently, he was
a partner and portfolio manager at Rorer Asset Management before rejoining GAMCO in 2010 where he
currently serves as a portfolio manager of Gabelli Funds, LLC. Mr. Leininger is a magna cum laude graduate
of Amherst College with a degree in Economics and holds an MBA from the Wharton School at the University
of Pennsylvania.
Daniel M. Miller currently serves as a portfolio manager of Gabelli Funds, LLC. He is also a Managing Director
of GAMCO Investors, Inc. Mr. Miller graduated magna cum laude with a degree in finance from the University
of Miami in Coral Gables, Florida.
Jennie Tsai joined Gabelli in 2001 as a research analyst responsible for the healthcare and medical products
industries. At Gabelli, Ms. Tsai is focused on medical sectors, including orthopedics, dental, ophthalmology,
general medical and others. She received her B.S. in Commerce at the University of Virginia and an MBA in
Finance from Columbia Business School.

16
THE GABELLI EQUITY TRUST INC.One Corporate CenterRye, NY 10580-1422
t 800-GABELLI (800-422-3554)f 914-921-5118e [email protected]
GABELL I .COM
DIRECTORS
Mario J. Gabelli, CFAChairman &Chief Executive Officer,GAMCO Investors Inc.Executive Chairman,Associated Capital Group Inc.
Anthony J. ColavitaPresident, Anthony J. Colavita, P.C.
James P. ConnFormer Managing Director &Chief Investment Officer,Financial Security AssuranceHoldings Ltd.
Frank J. Fahrenkopf, Jr.Former President & Chief Executive Officer,American Gaming Association
Michael J. FerrantinoChief Executive Officer,InterEx Inc.
Arthur V. FerraraFormer Chairman & Chief Executive Officer,Guardian Life Insurance Company of America
William F. HeitmannFormer Senior Vice President of Finance,Verizon Communications, Inc.
Salvatore J. ZizzaChairman, Zizza & Associates Corp.
OFFICERS
Bruce N. AlpertPresident
Agnes MulladyVice President
Andrea R. MangoSecretary & Vice President
John C. BallTreasurer
Richard J. WalzChief Compliance Officer
Carter W. AustinVice President
Molly A.F. MarionVice President & Ombudsman
David I. SchachterVice President
INVESTMENT ADVISER
Gabelli Funds, LLCOne Corporate CenterRye, New York 10580-1422
CUSTODIAN
The Bank of New York Mellon
COUNSEL
Willkie Farr & Gallagher LLP
TRANSFER AGENT ANDREGISTRAR
Computershare Trust Company, N.A.
THEGABELL IEQUITYTRUST INC.
Shareholder CommentaryMarch 31, 2018
GAB Mar/2018
GAB