Embed Size (px)
Citation preview

Do High Frequency Traders Provide or Drain Liquidity?A Study of the Market Pre-Opening Period on the
Tokyo Stock Exchange
Preliminary and incomplete
Mario Bellia, SAFE - Goethe University
⇤
Loriana Pelizzon, Goethe University and Ca’ Foscari University of Venice
†
Marti G. Subrahmanyam, Leonard N. Stern School of Business - New York University
‡
Jun Uno, Waseda University and Ca’ Foscari University of Venice
§
Darya Yuferova, Rotterdam School of Management - Erasmus University
¶
February 2015
Abstract
Liquidity provision and price discovery are two important functions of financial markets. Thefundamental changes witnessed by financial markets over the past decade have prompted a re-examination of how these two functions have been affected. Specifically, the key questions thatarise in this paper are (a) whether High Frequency Traders (HFTs) in equity markets provideor drain liquidity during the market pre-opening period, and (b) whether HFTs merely amplifynoise or lead to an improvement in the price discovery process. To answer these questions, westudy empirically the price discovery and HFT order submission strategies using a novel data-seton server IDs provided by the Tokyo Stock Exchange (TSE) that allows us to distinguish HFTfrom non-HFT orders. HFTs take advantage of TSE’s low-latency trading facility and place anumber of new orders and revisions up to two seconds, and cancel existing orders as little as 130milliseconds, before the opening time. We document that aggressive small orders entered earlierhave a higher likelihood of cancellation and less aggressive orders entered later have a higherlikelihood of revision. These results suggest that quote updates by HFTs in the last second havecharacteristics similar to those of high frequency liquidity providers. At the same time, strategicorder submission by HFTs causes a delay in price discovery in the pre-opening period. However,cancellations arriving in the last milliseconds prior to the opening do not increase the volatilityof the pre-opening quotes. Overall, we conclude that price discovery occurs more gradually eversince the entry of HFTs into the marketplace.
Key-words: High Frequency Traders (HTFs), Order Submission, Order Cancellation, Pre-Opening, PriceDiscovery, Liquidity Provision
⇤[email protected], Theodor W. Adorno Platz 3, 60323 Frankfurt am Main, Germany†[email protected], Theodor W. Adorno Platz 3, 60323 Frankfurt am Main, Germany‡[email protected], NY 10012-1126 New York, USA.§[email protected] 1-4-1 Nihombashi, Chuo-ku, Tokyo 103-0027, Japan¶[email protected], PO Box 1738, 3000 DR Rotterdam, The Netherlands

1. Introduction
During the past decade, global equity markets have been fundamentally altered due to
the vast improvements in the speed of trading and the consequent fragmentation of market
activity. Among other changes, traditional market makers have been replaced by high fre-
quency traders (HFTs), in most markets.1 This replacement has had a dramatic impact on
the behavior of liquidity providers in financial markets. However, we still know very little
about the determinants of high frequency liquidity provision. Key questions that we ask
in this research are whether HFTs provide or drain liquidity during the market pre-opening
period, and whether HFTs amplify noise or lead to an improvement in the price formation
process.
We contribute to the literature on high frequency trading with a clear focus on high
frequency liquidity providers. In an earlier study, Menkveld (2013) analyze transactions of a
large HFT firm that is active on the NYSE-Euronext and Chi-X markets, right after Chi-X
started as an alternative trading venue for European financial markets. He shows that, in 80%
of the cases, HFTs provided liquidity on both markets, during the continuous trading session.
In an event study framework, Brogaard, Hagströmer, Norden, and Riordan (2013) show that
liquidity providers are willing to pay for higher trading speed (using a premium co-location
service which allows traders to co-locate their servers near the exchange’s matching machine
with upgraded transmission speed), and that this is beneficial for overall market liquidity.
The pattern of market pre-opening trading has been studied in the earlier literature (e.g., by
Amihud and Mendelson (1991); Biais, Hillion, and Spatt (1999); Ciccotello and Hatheway
(2000); Madhavan and Panchapagesan (2000)). However, much of this literature is dated,
and is based on research conducted well before the rapid growth of HFTs, over the course of
the past decade or so.
It has been documented in this literature that the opening price is characterized by
1Hendershott and Riordan (2009), Brogaard (2010), Jovanovic and Menkveld (2011), Raman and Yadav(2014)
2

higher volatility relative to other times during the trading day, including the closing.2 This
conclusion has been attributed to many factors, including the accumulation of information,
the concentration of orders overnight, and market-maker intervention. We are able to shed
new light on this phenomenon by employing a rich, new database to study how high frequency
liquidity providers build their positions before the market opening, and how they increase
the efficiency of price formation at the market opening. To the best of our knowledge, these
are issues that have not been studied so far in the literature in any depth.
To test our hypotheses, we use novel data on server IDs provided by the Tokyo Stock
Exchange (TSE) to distinguish the origination of orders. We classify the servers into two
groups based on the trade-to-quote ratio and the cancellation rate. Since HFT liquidity
providers are sensitive to latency (Brogaard, Hendershott, and Riordan (2014); Hasbrouck
and Saar (2013)), they are likely to use servers with the lowest trade-to-quote ratio and
the highest cancellation rate. Thus, we can identify the types of order submitters based on
the server used, and determine whether HFTs are liquidity makers or liquidity takers, and
whether their activity leads to better price discovery in the pre-opening period.
We distinguish between three types of market participant who benefit from the increased
speed of trading. First, HFTs who engage in liquidity provision during the course of the
continuous trading session, who build their positions during the pre-opening period by sub-
mitting a set of limit orders to the book, as early as inception, because the time priority of
orders in the continuous session is important for them. They modify their orders accordingly,
in anticipation of the opening price. This characterization allows us to distinguish orders
submitted by HFTs for market-making purposes from orders submitted for liquidity-taking
purposes.
Second, institutional investors who are willing to execute large orders at the market
opening will not enter them into the order book until the very last moment (perhaps the
last millisecond prior to the opening), as these orders may have a significant impact on the
opening price. The early entry of large orders has clear disadvantages: large orders attract
2Boehmer and Wu (2014) find that algoritmic trading increase volatility for 42 markets around the world
3

other participants and induce other investors to react sooner, causing a deterioration in
the execution price of large orders. Additionally, in most markets, there is no time-priority
applied to orders submitted during the pre-opening period and executed at the opening single
price auction.
Third, aggressive investors may enter “noisy” orders and cancel them right before the
execution takes place. The term “noisy” connotes a type of order that uses an aggressive
limit price to send a signal to investors on the opposite side, to induce them to provide
liquidity. Indeed, some investors may have an incentive to enter false orders with aggressive
limit prices to elicit a favorable response from true orders from the opposite side. While this
strategy does not always work to the advantage of the aggressive investor, it may serve to
add noise to the pre-opening quotes.
All three types of merket participants benefit from a low latency of trading. The faster
execution of trades enables them to delay their final action until very close to the market
opening. Therefore, the noise effects may prevail up to the final seconds in the pre-opening
period. If so, it is useful to investigate the type of order submission that causes a deterioration
of the pre-opening quotes.
Empirical results for the TSE show a dramatic shift in order submission up to two seconds
before the opening time. This also affects the efficiency of pre-opening quotes as predictors of
opening prices. Submission of new orders rises to its highest frequency a bit earlier than does
the cancellation of orders. During the last minute before opening, 16% of orders submitted
have an impact on mid-quotes. However, reverses in the sign of the price change from the
previous day’s close make up only 0.6% of all events. This indicates that most orders that
have an impact on quotes generate minor changes. The unbiasedness of “pre-quotes” reaches
its highest level one second before the opening of our sample period (April and May 2013),
while it did so two seconds before opening in January 2010. The path by which it approaches
its highest level was much smoother in April and May 2013 than in January 2010. This is
evidence that high-frequency quote updates contribute to price discovery.
We find that aggressive small orders entered in the earlier part of the pre-opening period
4

have a higher likelihood of cancellation, and less aggressive orders entered in the later period
have a higher likelihood of revision. The concentration of order submissions towards the end
of the pre-opening time causes a delay in price discovery. However, cancellations occurring
in the last second do not increase the volatility of the pre-opening quotes.
The purpose of disseminating pre-opening quotes is to provide a good indication of the
current opening price. However, the results for the TSE indicate that it might mislead market
participants. Increasing competition among low-latency trading creates a complex price
formation process that all investors need to know about. Institutions utilizing algorithmic
trading tools need to make a careful assessment of the pre-opening order submission activities.
Our empirical design and hypotheses are presented in Section 2. The empirical results
of data description and pre-opening quote behavior, and revisions and cancellations, are
described in Section 3. Section 4 concludes.
2. Empirical design and Hypotheses
2.1. A new trading platform
On January 4, 2010, the TSE launched a new trading system named “Arrowhead.” The
main features of this system are (i) accelerated computer-processing speeds, and (ii) a co-
location service that reduces the physical distance between market participants (investors
as well as brokerage firms). The TSE starts receiving orders from brokers at 8am, and the
single price auction for the market opening begins at 9am. As soon as it receives orders, it
disseminates the pre-opening quotes to the market. The pre-opening quotes consist of ask
and bid prices and their associated quantities. In the case of the TSE, the best bid and ask
prices during the pre-opening period are determined in a fashion that is different from those
of the best bid and ask prices during the continuous session. In particular, the pre-opening
best bid and ask prices are the respective prices at which the demand and supply schedules
(two step-functions with cumulative volume on x -axis and price on y-axis) intersect. The
lowest (highest) price among the two is the reported best bid (ask) price.
Table 1 shows the relative frequencies of order types in the whole period and relevant sub-
periods. In the entire pre-opening period, new orders make up about 60%, and cancellations
5

and price revisions, roughly 20% each. The number of shares for new orders is, on average,
4,244, for cancellations, 3,955, and for price revisions, 1,913 respectively. In the last ten
minutes and the last one minute of the pre-opening period, the share of new orders drops to
less than 50%, and those of cancellations and price revisions increase accordingly.
2.2. Design of the empirical study
We select our universe of stocks from the constituents of the TOPIX100 index, which
comprises the stocks on the TSE’s first section with the highest liquidity. The literature on
HFTs, such as Uno and Shibata (2012), Menkveld (2013), and Brogaard, Hendershott, and
Riordan (2014) suggest that such traders generally prefer high-liquidity stocks in Europe, the
US, and Japan. Among the top 100 stocks, we exclude three stocks that have larger trading
volumes in exchanges other than the TSE, since the focus of our study is the trading system
on this exchange.3
The sample period we select for our analysis is between April 1 and May 31, 2013. In
this period, the volatility of the stock market rose after the new governor of the Bank of
Japan, Haruhiko Kuroda, announced a new aggressive quantitative easing policy. A number
of unexpected events occurred in this period, making the role of the pre-opening quotes even
more crucial than at any other time. We will refer to the month of January 2010 (we will
replace this with the month of December 2009 later, as a robustness check) as a comparative
period. The TSE introduced Arrowhead on January 4, 2010. This initial month gives us
the opportunity to examine the turning point of the TSE’s platform change and its effect on
order submission behavior.
We exclude stock-days when special quotes are disseminated before or during the single
price auction because orders submitted during the pre-opening period do not meet the open-
ing price rules. We keep track of the mid-quote between the best ask and bid second-by-second
during the pre-opening period. We use two data sources, Nikkei Tick Data and TSE order
submission data. The second dataset allows us to keep track of the order submission timing
3The three stocks are Murata, Nintendo, and Nihon Densan.
6
as well as updates of each order during the market pre-opening. It also includes unique iden-
tifiers for the server connections between brokers and the exchange. The order submission
characteristics of each server reflect whether a user is a HFT or not. Typically, HFTs request
their broker to provide access to an exclusive server; if so, we can identify the server IDs that
are most likely used by individual HFTs, as described in detail later.
2.3. Hypotheses
Among market participants, the majority seek execution of their early orders for the day
in the opening single price auction. There are some exceptions, however. First, HFT liquidity
providers will not aim to execute their orders at the opening price. Instead, they try to build
a set of limit orders to prepare for the market-making activity in the continuous session that
follows.4 Second, aggressive investors may attempt to manipulate the price and send a false
signal to the other market participants. They will eventually cancel these orders prior to the
start of the auction. Therefore, we distinguish between the following three types of market
participant.
Institutional investors are those with large orders that may cause a significant market
impact will not enter its orders until the very last moment, because there would be a clear
disadvantage to doing it so earlier: larger orders attract other participants and induce other
investors to react sooner and cause a deterioration in the execution price of large orders
for the investor. Additionally, in most markets, there is no time priority applied to orders
submitted during the pre-opening period. Thus, there is no benefit from early submission
by such large institutions, and there is a potential cost. The only significant disadvantage of
waiting and submitting the order at the very last second is that institutional investors, such
as pension funds and mutual funds, generally do not use a co-location service to place their
orders (as documented by Gomber, Arndt, Lutat, and Uhle, 2011), and thus, cannot take
too much risk by delaying their order submission beyond the opening auction.
Aggressive investors are those that may enter an order with an aggressive limit price to
4Brogaard (2010), Menkveld (2013) and Brogaard et al. (2014) provide detailed analyses of the tradingstrategies employed by high frequency traders in the continuous trading session.
7

send a signal to investors on the opposite side, and induce them to provide liquidity. This type
of order may include false orders with aggressive limit prices aimed at eliciting a favorable
response from true orders from the opposite side. While this does not always work to the
advantage of the aggressive investor, it may serve to add noise to the pre-opening quotes and
become a source of cancellations.
The current cutting-edge technology employed by the TSE permits investors to monitor
their order submission activities and adjust their trading strategies to the varying state
of the order book, during the pre-opening period. Since the trading platform of the TSE
permits latency of order submission of less than two milliseconds, HFTs, who are adaptive
investors, utilize algorithmic trading to submit many orders/revisions in response to the
observed interaction between aggressive and other adaptive investors during the pre-opening
period. Also, high frequency liquidity providers may build their positions during the pre-
opening period, in anticipation of their view of the opening price. The liquidity providers
maintain a set of limit orders in the book so that their revision or cancellation could affect
multiple orders. This type of HFT submits its limit orders as early as the inception of the pre-
opening period, because the time priority of orders in the post-opening period is important
for them. Although the time priority of orders does not have any effect on execution in
the opening auction, the original time priority in the pre-opening session is activated in the
following continuous session. It is crucial to ensure, for market-making purposes, therefore,
that a given trader’s orders have first (higher) priority at each limit price, as this will maximize
the turnover of his inventory and increase his trading profit.5 These characteristics are unique
to HFTs who are adaptive investors and distinguish them from those of other types of HFTs.
Indeed, the manner in which HFTs modify or cancel their limit orders moment-by-moment
is the key behavior on which we focus in this study.6
All three types of participant benefit from the speed of trading. A lower latency of order
5This nature of HFT market makers is similarly pointed out by Easley, Lopez de Prado, and O’Hara(2011). Raman and Yadav (2014) also discuss traders’ inventory and order revision, in the context of HFTs.
6Hasbrouck and Saar (2009),Menkveld (2013) and Kirilenko, Kyle, Samadi, and Tuzun (2014).
8

turnaround permits all of them to delay their final actions until the very last moment of the
pre-opening period. Therefore, the noise effects of trading may prevail up to the final seconds
of the pre-opening period. Among the three types of market participant, large institutions
are the least likely to be the very last player in the game, because, as mentioned earlier, most
of them do not have a co-location service, and high-frequency liquidity providers may act up
to the last milliseconds to optimize their limit order positioning. Thus, we investigate the
timing of order submission as well as the type of order submission, such as the size of the
order and single or multiple orders, so as to distinguish between orders from various players.
3.1. Empirical Analysis: Data Description and Pre-Opening Quote Behavior
3.1.1. Server IDs
As mentioned earlier, the novel data provided by TSE are the unique IDs of the virtual
servers. A virtual server is a logical device that needs to be set up between the computer
systems of the market participant and the exchange, in order to send/receive data to/from
each other. There is a limitation of message submission per second for each server, so that
heavy users such as HFTs use multiple servers to execute their orders. However, the ID
assigned to a particular virtual server is fixed during the period of our analysis. In our
analysis, we use data from the pre-opening as well as continuous session to compute important
measures such as the trade-to-quote ratio (number of trades to quotes) and the cancellation
rate (number of cancellations divided by the total number of messages), both of which are
widely recognized as proxies for HFT trading patterns, as argued by Hendershott and Moulton
(2011); Brogaard (2010); Menkveld (2013); Brogaard, Hendershott, and Riordan (2014). We
choose a threshold of (less than) 25% for the trade-to-quote ratio, and (higher than) 20%
for the cancellation rate, as in Ferber (2012) and Hosaka (2014), to construct our sample of
proxy servers.7
We identify 3,663 servers that were used for trading our universe of stocks, of which
875 servers pass our threshold criteria. In our sample, the median trade-to-quote ratios of
7Hosaka (2014) uses the same information to examine characteristics of order flow from HFTs. He findsthat orders from HFTs participate at “best quotes” with a higher probability than those from non HFTs.
9

HFT and non-HFT servers are 15.3% and 28.9%, respectively, and the median cancellation
rates are 28.3% vs. 5.8%. The median numbers of messages (new orders, revisions and
cancellations) for HFT and non-HFT servers are 530 and 133 per day per stock, respectively.
3.1.2. Pre-opening order flow
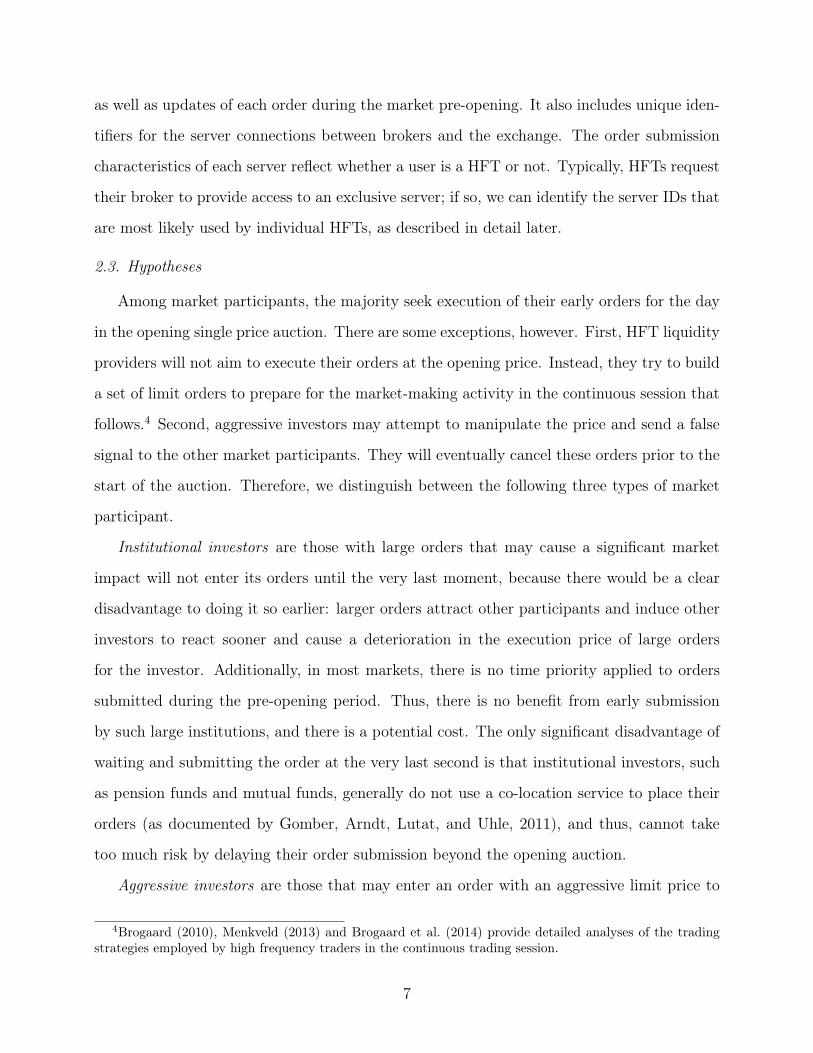
Figure 1, Panel A, shows new orders entered every second as a percentage of the total
new orders during the pre-opening period. Grey bars are orders from HFT and black bars
are those from non-HFT servers. In the first five minutes of the pre-market opening period,
which starts at 8am and end at 9am, 70% of the orders submitted during the entire period are
entered. The order submission slows down after the first five minutes, and is again reactivated
ten minutes before the official opening time. The high level of order submissions in the first
five minutes indicates the accumulation of orders overnight as well as the advantages of being
among the first priority orders at each limit price for liquidity providers. Figure 1,Panel B,
shows the order submission activities by HFTs during the pre-opening period. It clearly shows
a peak in the very beginning of the period and picks up again very close to the opening time,
vastly exceeding the number of orders submitted by non-HFTs.
Figures 2, Panels A and B, show new order submissions and cancellations as a percentage
of total orders by non-HFTs and HFTs in the last ten minutes of the pre-market opening
period. In Figure 2A, new orders from non-HFTs start to increase to an average of 0.2% from
0.05% per second during the last ten minutes before 9am. Those from HFTs (Figure 2B) rise
just before the opening time. A rise in order cancellations (black line) happens suddenly, one
second before 9am for both HFTs and non-HFTs. The percentage of cancellation messages
increases from less than 0.1% to 0.48% and 0.45% respectively. It is interesting to note
that cancellations from both HFTs and non-HFTs reach their peak at the very last second.
This indicates that our classification of non-HFTs might include some traders who also use
the co-location service, albeit in a less intensive manner. We investigate this in detail at
the millisecond scale and present the results in Figure 3. We confirm that the cancellations
indeed occur less than one second before 9am. The cancellation phenomenon starts at 500
milliseconds before 9am and peaks out at 130 milliseconds before 9am. This action would not
10

be possible without a low latency trading environment, and hence, leads to our conclusion
that some of the non-HFTs in our classification could also be using the co-location service.
3.1.3. Deviation of mid-quotes from the opening price
We find in the previous section that the number of order submissions rises right before
the opening time. We look into the movements of pre-opening quotes between 8am and 9am
to see how quickly a pre-opening quote approaches the opening price for the day. For this
purpose, we compute the relative deviation of mid-quotes from the opening price for each
stock on each day using equation (1):
Deviation =
✓Md,s
Od
� 1
◆⇥ 100 (1)
where Md,s is mid-quote at time s on day d, Od is opening price on day d. First, we
compute equation (1) second-by-second per stock per day. Then we calculate the second-by-
second medians.
Figure 4 shows the second-by-second movements of the pre-opening quotes. During the
first five minutes, the deviation of the pre-opening quote declines rapidly from above 2% to
between 0.6% and 0.7%. This means that significant amounts of order submissions during
this period contribute to price discovery. However, after 8:05 am, the deviation becomes
almost flat with some spikes and then it resumes its adjustment toward the opening price
after 8:50 am. It gets down to 0.22% before the opening time, which is still a little bit wider
than a half-spread, on average, for the sample stocks during the trading session. According
to Figure 4, the observed pattern of the price deviation is consistent with our hypotheses
regarding order submission strategies employed by the three main players. It shows that
lower latency does not attenuate the reduction of the deviation between the pre-opening
quotes and the opening price. Hence, the orders submitted after 8:50 am play an important
role in price discovery.
3.1.4. Aggressiveness of limit orders
The aggressiveness of limit orders can be characterized by a comparison between the limit
price and the prevailing mid-quotes (Biais, Hillion, and Spatt (1995)). Since TSE’s mid-
11

quotes are an expected opening price, a negative (positive) deviation of sell (buy) limit price
indicates a high aggressiveness of the order submission strategy. Table 2 shows aggressiveness
of limit sell (buy) price of orders submitted or revised/cancelled from HFTs and non-HFTs
during the last 60 seconds of the pre-opening period. The limit prices of new sell(buy)
orders submitted by HFTs show an average 5.53% (6.78%) absolute deviation from the mid-
quote, but those by non-HFTs shows a much higher absolute deviation of 32.07% (35.06%).
Cancelled sell(buy) orders by HFTs exhibit a 3.51% (4.53%) absolute deviation from the mid-
quote, while cancelled sell(buy) orders by non-HFTs show 26.50% (29.85%). These results are
consistent with the notion that HFTs liquidity providers adjust their orders to the expected
opening price. Orders from non-HFTs do not have similar characteristics.
Figures 5, Panels A and B, show the relative limit prices of the cancelled orders in the
last second of our sample period. We separate those observations in the period between
8:59:59 and 9:00:00 into two equal segments: those occurring more than or less than 500
milliseconds before 9am. More than 80% of cancelled buy and sell limit orders have limit
prices within a plus or minus 10% deviation from the mid-quote. It should be noted that
limit sell (buy) orders that have limit prices lower (higher) than the mid-quote exhibit more
cancellations less than 500 milliseconds before 9am. Also, limit orders that must be included
in the opening transaction are cancelled more often. Figures 5, Panels C and D show the
sub-sample from Figures 5 in which the relative limit price is within plus/minus 5% of the
mid-quote. Less than 500 milliseconds before 9am, sell limit orders with limit prices 1% lower
than the mid-quote comprise 40% of the sub-sample of cancellations. During this period, buy
limit orders with limit prices 1% higher than the mid-quote comprise 60% of the sub-sample
of cancellations. This supports our conjecture that the surge in cancellations comes from
high-frequency liquidity traders who wish to avoid executing their orders at the opening
price.
Figure 6 shows how often submitted orders have an impact on the prevailing quotes. Out
of 91,139 orders entered at 8:59 am during April and May 2013, about 16% have an impact
on the mid-quotes. However, reverses in the sign of the price change from the previous day’s
12

close make up only 0.6% of all events. This indicates that most orders that have an impact
on quotes generate only minor changes. Figures 7, Panels A and B, depict the numbers of
orders that have an impact on the ask or bid quotes double in the last two seconds of the
pre-opening period. Figures 8, Panels A and B, shows that the average impact on the ask
and bid quotes do not change in the last two seconds.
In sum, although we observe sudden increases in cancellations less than 500 milliseconds
before 9am, they do not have a significant price impact on the prevailing quotes. This suggests
that the surge in cancellations occurs for position building and position risk management
purposes. We confirm this interpretation in the following sub-section.
3.1.4. Tests of unbiasedness of the pre-opening quotes
We repeat the test of price efficiency with the pre-opening quotes using an unbiasedness
regression that has been used widely in the literature, as a test of average predictability.
Specifically, this test is used by Biais et al. (1999) to characterize the extent to which there
is learning and price discovery in the pre-opening period. They use the closing price of the
day as a proxy for the equilibrium price v. We modify their framework for our purpose and
estimate equation (2) as follows:
⌫ � E (⌫|I0) = ↵t + �t [Pt � E (⌫|I0)] + Zt (2)
where ⌫ is the opening price (instead of the closing price used in Biais, Hillion, and Spatt
(1999)), Pt is the pre-opening mid-quote, and E (⌫|I0) is the previous day’s closing price. The
distribution of the change in price, from the previous day’s close to the mid-quote, varies
with time as the opening time approaches. The variance of the noise in the mid-quote is also
likely to vary with time. In this spirit, we estimate the unbiasedness regression using the
specification in (2), for each second for each stock over our sample period. Thus, we analyze
for each point in the time, the distribution across days of the mid-quote. If the pre-opening
mid-quote is an unbiased estimator of the opening price, the coefficient �t in the specification
should be insignificantly different from 1. We hypothesize that the earlier in the pre-opening
period the coefficient �t equals 1, the greater is the price efficiency of the pre-opening quote.
13

We also analyze the pattern of the root mean square error (RMSE) over the pre-opening
period. This analysis allows us to quantify the information content of the pre-opening prices:
the lower the RMSE, the greater the information content.
Figure 9, Panel A, shows the average of the coefficient, �t, and the bands of plus or minus
two sigma of cross-sectional standard errors, over time. The mean coefficient is significantly
different from one until two seconds before 9am, and becomes insignificantly different from
one only one second before 9am in the sample from April and May 2013. We run the same
regression with data from January 2010, in which date the TSE replaced its trading platform
with the new “Arrowhead” system, and also implement several other institutional changes,
including a co-location service, at the same time (see Uno and Shibata, 2012). Thus, January
2010 can be viewed as the time of arrival of a new trading paradigm in Japan. We investigate
whether the observation that the coefficient becomes one, one second before 9am was equally
valid at that point in time in the earlier regime to check if there has been a structural change
after the introduction of the “Arrowhead” system.
Figure 9, Panels B, shows that the coefficient becomes one, two seconds before 9am. If
we estimate the coefficient in the period of April and May 2013 at a finer interval, such as
a millisecond, the time at which the cross-sectional average of the coefficient becomes one is
shown to be even less than one second.8 After the introduction of the new trading platform
by the TSE, the price discovery of the pre-opening quotes was delayed, moving one second
closer to 9am, when measured at the millisecond level.
Although the time at which the average of the coefficient becomes one is delayed by one
second, the path by which it approached one was much smoother in April and May 2013
than it was in January 2010. This is also confirmed by the movement of the RMSE, which
decreases more steadily in April and May 2013 than in January 2010. In the first month
since the inception of the new trading system on January 2010, the orders from co-location
servers were about 15%, whereas they exceeded 50%, as of May 2013 (as documented by
8The tick-by-tick data provided by Nikkei Tick Data that we use in this study have second-by-secondtime stamps. This limits us to computing the coefficient of equation (2) at the millisecond level. The ordersubmission data provided by the TSE is also time-stamped at the millisecond level.
14

Hosaka (2014)). This is consistent with the hypothesis that high-frequency quote updates
contribute to price discovery.
3.2. Revisions and Cancellations
3.2.1. Determinants of revisions/cancellations
One of the characteristics of trading in the pre-opening period documented in Section 3.1
is the flurry of new orders, cancellations, and revisions as time approaches the 9am opening
time. The TSE order file data allow us to investigate the determinants of revisions and
cancellations from a history of order status during the pre-opening period. We estimate a
probit model in order to investigate the motivations behind the revisions and cancellations.
One possible motivation behind revisions and cancellations is for the investor to adjust
the limit price as a reaction to changes in the expected opening price. The intent of the
revision in this case is to increase the probability of execution in the opening auction. This is
a valid strategy for investors who wish to execute their orders in the opening auction. This
motivation would suggest that these investors would increase the number of order revisions
closer to 9am.
In contrast to the above behavior, HFT liquidity providers do not aim to execute their
orders at the opening price. They adjust the limit prices of their orders to be surrounding the
expected opening price. This means that they want their stance regarding liquidity provision
to be neutral with respect to the opening price. They then submit their orders as soon as the
TSE starts receiving orders. However, it is crucial for them to have a higher time priority
for their orders at each limit price in the book in order to enable them to have a quicker
turnover of their position. Therefore, HFT orders are made up of a set of both buy and sell
limit orders. Adjustments are triggered by changes in the prevailing quotes, which happen
on a continuous basis during the pre-opening period. Since revisions of orders are free of
charge, HFTs can keep their high time priority until the very last second.
There are at least two reasons for cancellations by HFTs. One arises when limit prices are
deep in the money, i.e., the buy orders are well above the current mid-quote, and sell orders
are well below the current mid-quote. Cancelling deep-in-the-money orders may have an
15

impact on the prevailing best quotes. This type of order may be entered earlier to influence
other order submitters. Another possibility is the initiation of a set of cancellations and
placement of new orders by HFTs. This is a faster procedure for changing their limit prices,
since revising orders submitted earlier takes more time than entering a set of cancellations
and new orders. However, we cannot separate these two motivations due to data limitations
regarding customer IDs.9
We now test the following hypothesis by estimating a probit model of cancellations and
revisions. For limit sell (buy) orders from HFT liquidity providers with a limit sell (buy)
price which is lower (higher) than an expected opening price, the lower (higher) the relative
limit price is, the more likely it will be canceled. To test this hypothesis, we estimate a probit
model for cancellations and revisions. Based upon the order flow analysis in the previous
sections, the estimation period is the 2 second window between 8:59:58 and 8:59:59. We
estimate the specification:
⇢j = ↵ + �+1
Limit pricej�MidquotejMidquotej
⇥ 1{Limit pricej�MidquotejMidquotej
> 0}+
+��1
Limit pricej�MidquotejMidquotej
⇥ 1{Limit pricej�MidquotejMidquotej
< 0}+
+�21
RevFreqj+ �3 ln(ElapsedT imej + 1) + �4Sizej + �5Depthj + ✏j
(3)
The dependent variable of equation (3), ⇢j, takes the value one when an order is cancelled,
and zero otherwise. There are six explanatory variables: the coefficients ��1 (�+
1 ) capture the
sensitivity of the cancellation action to the aggressiveness of the limit price, measured by the
relative deviation of the limit price from the mid-quote. We analyze two separate cases when
the limit price is above and below the mid-quote, respectively. The third variable, with the
coefficient �2, is the inverse of the revision frequency, the fourth one, with the coefficient �3,
is the logarithm of the elapsed time from the original submission time, and the fifth one,
with the coefficient �4 is the size of the order and the last one, with the coefficient �5, is the
depth, which is the average ask (bid) size just before the sell (buy) order submission. Market
9The TSE does not provide customer IDs for individual orders.
16

orders are excluded from the sample.
The orders submitted through HFT and non-HFT servers are separated when we estimate
the probit model of equation (3). We expect that the coefficient of ��1 (�
+1 ) for orders from
HFT liquidity providers should be larger (in absolute terms) than for other orders because
these traders are more sensitive to the expected opening price. In the case of sell orders,
we expect ��1 > �+
1 because HFT liquidity providers do not aim to obtain execution at the
opening price. In the case of buy orders, we expect ��1 < �+
1 for the same reason.
Table 3, Panel A (sell orders), shows the results of the estimation for cancelled sell orders.
About one third of sell orders submitted by HFTs in this period are cancelled. The coefficient
��1 of limit sell orders from HFT liquidity providers is positive, and statistically significant
at the 1% significance level. This means that the lower is the sell limit price (which means
that it is most likely to be executed at the opening), the more likely the order is to be
cancelled. This is consistent with the behavior of HFT liquidity providers. The coefficient
in the sample of orders from HFT liquidity providers is almost 67% larger than those from
non-HFT traders. HFT liquidity providers are more likely to cancel their orders when the
limit sell price is below the prevailing mid-quotes. Other controlling variables such as the
coefficient of revision frequency ( 1RevFreq
) and elapsed time are also positive and significant
at the 1% level of significance. The cancelled orders are less frequently revised and tend to
sit for a longer time in the order book. This indicates that the orders are submitted early.
The sizes of the orders are smaller. These characteristics are common to the order strategy
of both the HFT and non-HFT players.
Table 3, Panel A (buy orders), shows the results for cancelled buy orders. Nearly one
third of buy orders submitted by HFT liquidity providers in this period are cancelled. The
coefficient �+1 of limit buy orders from HFT liquidity providers is statistically significant
at the 1% level and positive. This means that the higher is the buy limit price (which
means that it is most likely to be executed at the opening), the more likely the order is
to be cancelled. This is also consistent with the behavior of HFT liquidity providers. The
coefficient �+1 in the sample of orders from HFT liquidity providers is about 50% larger than
17

those from of non-HFT traders. HFT liquidity providers are more likely to cancel orders when
the limit buy price is above the prevailing mid-quotes. The coefficient of revision frequency
( 1RevFreq
) is positive and significant at the 1% level, and that of elapsed time is also positive
and significant at the 1% level of significance. These results are the same as those for the
cancelled sell orders. Like cancelled sell orders, cancelled buy orders have the property of
being less frequently updated, with a longer elapsed time and a smaller size of orders for
both HFT and non-HFT orders.
Table 3, Panel B (sell orders), shows the estimation results of equation (3) for revised sell
orders. Only 20% of sell orders submitted by HFT liquidity providers in this period consist
of revisions. In the case of HFT orders, the coefficients ��1 is insignificant, and �+
1 is positive
and significant at the 1% level. In case of non-HFT orders, however, both coefficients ��1
and �+1 and are positive and significant at the 1% level. Non-HFT traders are more likely
to revise the limit price of their orders when the limit sell price is above the mid-quote, but
HFTs is less likely to revise them. Similar results hold for revised buy orders in Table 3,
Panel B (for buy orders). The buy orders revised by non-HFT players have limit prices that
are lower than the prevailing mid-quote. But this is not the case for HFTs: they leave their
buy limit orders that have limit price lower than the current mid-quote, without making any
changes. This suggests that HFTs do not aim to execute their orders at the opening price.
3.2.2. The relation between mid-quote change and HFT order flow
Lastly, we examine the relationship between changes in the mid-quote and submitted
order types by HFTs and non-HFT players. Table 4 shows that, in most cases, we do not
find significant price changes except new sell and new buy orders from non-HFT traders,
and constant revision of buy orders from HFTs. The average price change caused by new
sell orders from non-HFT traders is -1.79%, a large, statistically significant negative price
impact, but that by HFT is only 0.10%, which is also not significantly different from zero.
The average price change caused by new buy orders from non-HFT traders is 1.87%, a
statistically significant positive price impact, but that by HFTs is -0.48% which is, again, not
significantly different from zero. The revisions for buy orders made by HFTs causes a 2.0%
18

price change in the case of quantity revision, and a 2.6% price change, in the case of a limit
price revision. These cases require more careful examination in future research. Overall,
however, our results indicate that the last second cancelation and revision do not cause a
significant impact on the prevailing quotes.
4. Conclusion
The institution of a market pre-opening period is an important feature of many stock
markets today. A key question we ask in this research is whether high-frequency quote
revisions that occur during the pre-opening period amplify noise or lead to an improvement
in the price formation. A flurry of order flows come in just a blink before the market opening
at 9am. New orders come in the last second, but order cancellations start to increase less
than 500 milliseconds before 9am and continue up until 130 milliseconds before 9am.
The number of orders that have an impact on the prevailing quotes increases in the last
two milliseconds prior to the opening time. However, this does not increase the volatility of
the pre-opening quotes. This means that the size of the impact on the mid-quotes is relatively
small. Return reversal from the previous day’s close happens with a probability of 0.6%. We
interpret this as a harmless adjustment made by high-frequency liquidity providers.
This interpretation is confirmed by the fact that the coefficients estimated using the
unbiasedness regression reach the point at which they are statistically indifferent from one
at the very last second before 9am. After the advent of the low-latency trading facility, the
improvement in the pre-opening price efficiency (unbiasedness) is delayed until half a second
before the opening.
A probit analysis of the order submission shows that limit price aggressiveness and the
history of limit price revisions are related to the likelihood of cancellation at the last minute.
Smaller sizes, earlier submission times, and more aggressive limit prices are all related to a
higher probability of cancellation. Overall, the results do not support the notion that the
order submission strategies employed by HFT cause a deterioration in price formation in the
market.
In order to investigate the reasons for the flurry of cancellations that occurs at the very
19

last moment, we perform a similar analysis for the pre-opening period of the afternoon session
in the TSE which is not included in this version of the paper. We find that revisions of orders
occur more often than cancellations in the pre-opening of the afternoon session. The closing
price from the morning session provides a less noisy estimation of the opening price of the
afternoon session. This suggests that the flurry of cancellations occurs due to uncertainty
about the opening price at the beginning of the trading day.
Our findings in the paper can be confirmed in cases where the same stock is traded in
different venues within the same time-zone. In Japan, off-exchange venues such as proprietary
trading systems (PTS) do not attract order flows in the time prior to the official trading
time of the TSE. The US and Europe, where multiple venues compete against each other,
may provide researchers with additional opportunities to seek further insights on the factors
driving our results. We plan to work on this in our next project, involving data from Europe
(Eurofidai) and the U.S. (NASDAQ).
20

References
Amihud, Y. and H. Mendelson (1991). Volatility, efficiency, and trading: Evidence from the
japanese stock market. The Journal of Finance 46 (5), 1765–1789.
Biais, B., P. Hillion, and C. Spatt (1995). An empirical analysis of the limit order book and
the order flow in the paris bourse. The Journal of Finance 50 (5), 1655–1689.
Biais, B., P. Hillion, and C. Spatt (1999). Price discovery and learning during the preopening
period in the paris bourse. Journal of Political Economy 107 (6), 1218–1248.
Boehmer, Ekkehart, K. Y. F. and J. J. Wu (2014). International evidence on algorithmic
trading. AFA 2013 San Diego Meetings Paper .
Brogaard, J. (2010). High frequency trading and its impact on market quality. Working
Paper 66.
Brogaard, J., B. Hagströmer, L. L. Norden, and R. Riordan (2013). Trading fast and slow:
Colocation and market quality. Working paper .
Brogaard, J., T. Hendershott, and R. Riordan (2014). High-frequency trading and price
discovery. Review of Financial Studies 27 (8), 2267–2306.
Ciccotello, C. S. and F. M. Hatheway (2000). Indicating ahead: Best execution and the
nasdaq preopening. Journal of Financial Intermediation 9 (2), 184–212.
Easley, D., M. Lopez de Prado, and M. O’Hara (2011). The microstructure of the flash crash:
Flow toxicity, liquidity crashes and the probability of informed trading. The Journal of
Portfolio Management 37 (2), 118–128.
Ferber, M. (2012). Draft report on the proposal for a directive of the european parliament
and of the council on markets in financial instruments repealing directive 2004/39/ec of
the european parliament and of the council.
Gomber, P., B. Arndt, M. Lutat, and T. Uhle (2011). High-frequency trading. Working
paper .
21

Hasbrouck, J. and G. Saar (2009). Technology and liquidity provision: The blurring of
traditional definitions. Journal of Financial Markets 12 (2), 143–172.
Hasbrouck, J. and G. Saar (2013). Low-latency trading. Journal of Financial Markets 16 (4),
646–=679.
Hendershott, T. and P. C. Moulton (2011). Automation, speed, and stock market quality:
The nyse’s hybrid. Journal of Financial Markets 14 (4), 568–604.
Hendershott, T. and R. Riordan (2009). Algorithmic trading and information. Manuscript,
University of California, Berkeley .
Hosaka, G. (2014). Analysis of high-frequency trading at tokyo stock exchange. JPX working
paper .
Jovanovic, B. and A. J. Menkveld (2011). Middlemen in limit-order markets. Manuscript
University of Amsterdam.
Kirilenko, A. A., A. S. Kyle, M. Samadi, and T. Tuzun (2014). The flash crash: The impact
of high frequency trading on an electronic market. Working paper .
Madhavan, A. and V. Panchapagesan (2000). Price discovery in auction markets: A look
inside the black box. Review of Financial Studies 13 (3), 627–658.
Menkveld, A. J. (2013). High frequency trading and the new market makers. Journal of
Financial Markets 16 (4), 712–740.
Raman, V. and P. K. Yadav (2014). Liquidity provision, information, and inventory man-
agement in limit order markets: An analysis of order revisions. Working Paper .
Uno, J. and M. Shibata (2012). Speed of trade and liquidity. Working paper .
22

Table 1: Distribution of order flow
This table shows the distribution of the order flow for 97 stocks from TOPIX100 during the sampleperiod from April to May 2013. We report the average number of orders, relative frequency oforders, and the average size of the orders in shares submitted during the whole pre-opening period(8:00:00.000 - 8:59:59.999), during the last ten minutes of the pre-opening period (8:50:00.000 -8:59:59.999), and during the last one minute of the pre-opening period (8:59:00.000 - 8:59:59.999).All orders are grouped according to their types: new orders, quantity revisions (reduction in theorder size), limit price revisions, and cancellations (withdrawals of orders). The data on the orderflow are provided by Tokyo Stock Exchange.
New orders QuantityRevisions
PriceRevisions Cancellations Total
8:00:00.000 -8:59:59.999
Average # of orders 117.20 1.70 38.30 39.00 196.20
Relative frequency oforders 59.70% 0.90% 19.50% 19.90% 100.00%
Average size of orders inshares 4,244.70 1,913.20 3,955.60
8:50:00.000 - 8:59:59.999
Average # of orders 97.60 2.90 67.20 71.20 238.90
Relative frequency oforders 40.90% 1.70% 28.10% 29.80% 100.00%
Average size of orders inshares 5,744.80 2,548.90 4,328.20
8:59:00.000 - 8:59:59.999
Average # of orders 173.00 5.90 110.20 110.60 399.70
Relative frequency oforders 43.30% 1.50% 27.60% 27.70% 100.00%
Average size of orders inshares 4,782.80 1,946.60 3,992.60
23

Table 2: Comparison of the relative limit price of the orders submitted by HFT and non-HFT
This table shows the comparison of the limit order strategies employed by HFT and non-HFT for97 stocks from TOPIX100 during the sample period (April and May 2013) for the last minute ofthe pre-opening period (8:59:00.000 - 8:59:59.999). We show the mean and standard deviation forthe relative limit price of the four types of orders: new orders, quantity revisions (reduction in theorder size), limit price revisions, and cancellations (withdrawals of orders), where the relative limitprice is determined as follows:
Relative limit price =|Limit price�Midquote|
Midquote
.
We analyze the relative limit order prices separately for the sell limit orders (Panel A) and buy limitorders (Panel B). The data on the order flow and server IDs used to classify traders into HFT andnon-HFT are provided by Tokyo Stock Exchange.
Panel A. Absolute difference between limit price and the mid-quote for sell orders
New orders QuantityRevisions
PriceRevisions Cancellations Total
HFTMean 5.53% 3.17% 2.18% 3.51% 4.12%
St. Dev. 18.18% 10.96% 5.87% 11.03% 14.24%
# ofobservations 60,250 28,936 23,008 20,751 132,945
Non-HFTMean 32.07% 7.31% 7.88% 26.50% 22.28%
St. Dev. 44.47% 19.08% 19.91% 39.02% 38.26%
# ofobservations 106,551 39,700 36,821 19,340 202,412
Panel B. Absolute difference between limit price and the mid-quote for buy orders
New orders QuantityRevisions
PriceRevisions Cancellations Total
HFTMean 6.78% 3.73% 2.44% 4.53% 5.00%
St. Dev. 21.39% 13.17% 7.40% 15.64% 17.15%
# ofobservations 71,790 36,087 27,801 24,037 159,715
Non-HFTMean 35.06% 6.89% 6.73% 29.85% 24.10%
St. Dev. 45.94% 19.82% 19.43% 40.99% 40.07%
# ofobservations 109,983 40,284 37,098 22,787 210,152
24

Table 3: Probit model for canceled and revised sell and buy orders
This table shows the estimation results (coefficients and z-statistics) of the probit model estimatedseparately for canceled (Panel A) and revised (Panel B) buy and sell orders from HFT and non-HFT for 97 stocks from TOPIX100 during the sample period (April and May 2013) for the last oneminute of the pre-opening period (8:59:00.000 - 8:59:59.999). The probit model specification is givenby equation (4):
⇢j = ↵+ �
+1Limit pricej �Midquotej
Midquotej⇥ 1{Limit pricej �Midquotej
Midquotej> 0}+
+��1
Limit pricej �MidquotejMidquotej
⇥ 1{Limit pricej �MidquotejMidquotej
< 0}+
+�21
RevFreqj+ �3 ln(ElapsedT imej + 1) + �4Sizej + �5Depthj + ✏j (3)
The dependent variable ⇢j takes the value 1 when an order j is canceled (Panel A) or revised (PanelB), and zero otherwise. There are six independent variables: the aggressiveness of the limit pricewhich is measured as the relative deviation of the limit order price from the mid-quote at the time oforder submission (we analyze separately two cases when the limit price is above and below the mid-quote), the inverse of revision frequency ( 1
RevFreqj), the elapsed time from the original submission
time (ElapsedT imej), the size of the order in Japanese yen (Sizej), and the depth (Depthj), whichis the best ask (bid) size just before the sell (buy) order submission (averaged over a second in caseof multiple orders submitted during that second). Market orders are excluded from the sample. Thedata on the order flow and server IDs used to classify traders into HFT and non-HFT are providedby Tokyo Stock Exchange.
Panel A. Probit model: Canceled sell and buy orders
Canceled sell orders Canceled buy orders
HFT Non-HFT HFT Non-HFT
Coef z-stat Coef z-stat Coef z-stat Coef z-stat
Limit pricej�Midquotej
Midquotej(>0) -60.015 -28.103 -32.825 -17.961 16.969 7.122 11.401 13.192
Limit pricej�Midquotej
Midquotej(<0) 19.303 -7.008 11.508 -18.252 -43.769 22.690 -21.569 14.275
1/RevFreq 4.231 63.084 3.963 41.236 4.261 70.141 4.061 45.333
ElapsedT ime 0.185 39.149 0.330 47.620 0.188 43.605 0.307 47.282
Size -0.167 -49.658 -0.024 -21.308 -0.183 -53.881 -0.053 -24.390
Depth -0.013 -5.172 -0.006 -2.873 -0.009 -3.589 0.000 -0.200
Intercept -2.802 -77.582 -3.775 -60.053 -2.869 -87.737 -3.691 -65.534
McFadden R2 0.466 0.612 0.458 0.613
# Obs with ⇢j
= 0 15,033 9,213 17,239 10,372
# Obs with ⇢j
= 1 5,861 4,437 6,659 4,970
25

Table 3: Probit model for cancelled and revised sell and buy orders (continued)
Panel B. Probit model: Revised sell and buy orders
Revised sell orders Revised buy orders
HFT Non-HFT HFT Non-HFT
Coef z-stat Coef z-stat Coef z-stat Coef z-stat
Limit pricej�Midquotej
Midquotej(>0) -30.382 -12.641 7.200 6.374 -2.171 -0.899 -5.314 -4.405
Limit pricej�Midquotej
Midquotej(<0) -5.055 1.468 -9.158 3.398 -23.955 9.673 4.206 -4.064
1/RevFreq -6.186 -52.188 -5.313 -39.043 -5.824 -55.174 -5.581 -44.464
ElapsedT ime -0.034 -5.600 0.042 5.427 -0.040 -7.033 0.012 1.665
Size 0.070 42.638 0.003 8.576 0.067 39.971 0.002 5.982
Depth -0.031 -11.132 -0.016 -5.950 -0.046 -14.476 -0.010 -3.516
Intercept 0.935 24.664 0.333 5.978 0.817 24.373 0.531 10.794
McFadden R2 0.347 0.376 0.320 0.366
# Obs with ⇢j
= 0 16,599 11,875 18,973 13,211
# Obs with ⇢j
= 1 4,295 1,775 4,925 2,131
26

Table 4: Average mid-quote changes from the orders submitted by HFT and non-HFT
This table shows the comparison of the limit order strategies employed by HFT and non-HFT for97 stocks from TOPIX100 during the sample period (April and May 2013) for the last one minuteof the pre-opening period (8:59:00.000 - 8:59:59.999). We show the mean, standard deviation, andt-statistics for the average change in the mid-quote as a result of the order submission for the fourtype of orders: new orders, quantity revisions (reduction in the order size), limit price revisions, andcancellations (withdrawals of orders).We analyze the average mid-quote changes separately for thesell limit orders (Panel A) and buy limit orders (Panel B). We include only those seconds in thesample when we observe the mid-quote change. The data on the order flow and server IDs used toclassify traders into HFT and non-HFT are provided by Tokyo Stock Exchange.
Panel A. Average mid-quote changes as a result of sell orders
New orders QuantityRevisions
PriceRevisions Cancellations Total
HFT
Mean 0.105 -0.496 -0.612 -0.803 -0.284
St. Dev. 93.295 59.134 64.717 144.593 93.034
t�statistics 0.234 -1.189 -1.187 -0.658 -0.929
# of observations 42,998 20,057 15,752 14,019 92,826
Non-HFT
Mean -1.795 0.900 0.699 -1.260 -0.858
St. Dev. 229.073 265.797 278.203 90.480 234.950
t�statistics -2.041 0.498 0.352 -1.553 -1.273
# of observations 67,876 21,674 19„598 12,436 121,584
Panel B. Average mid-quote changes as a result of buy orders
New orders QuantityRevisions
PriceRevisions Cancellations Total
HFT
Mean -0.476 2.016 2.559 -0.908 0.526
St. Dev. 105.879 37.069 41.012 177.166 102.049
t�statistics -1.029 8.653 8.631 -0.666 1.737
# of observations 52,321 25,315 19,135 16,882 113,653
Non-HFT
Mean 1.869 0.266 0.067 -2.364 0.796
St. Dev. 174.286 90.172 90.384 197.944 153.650
t�statistics 2.818 0.453 0.109 -1.442 1.857
# of observations 69,061 23,566 21,361 14,575 128,563
27
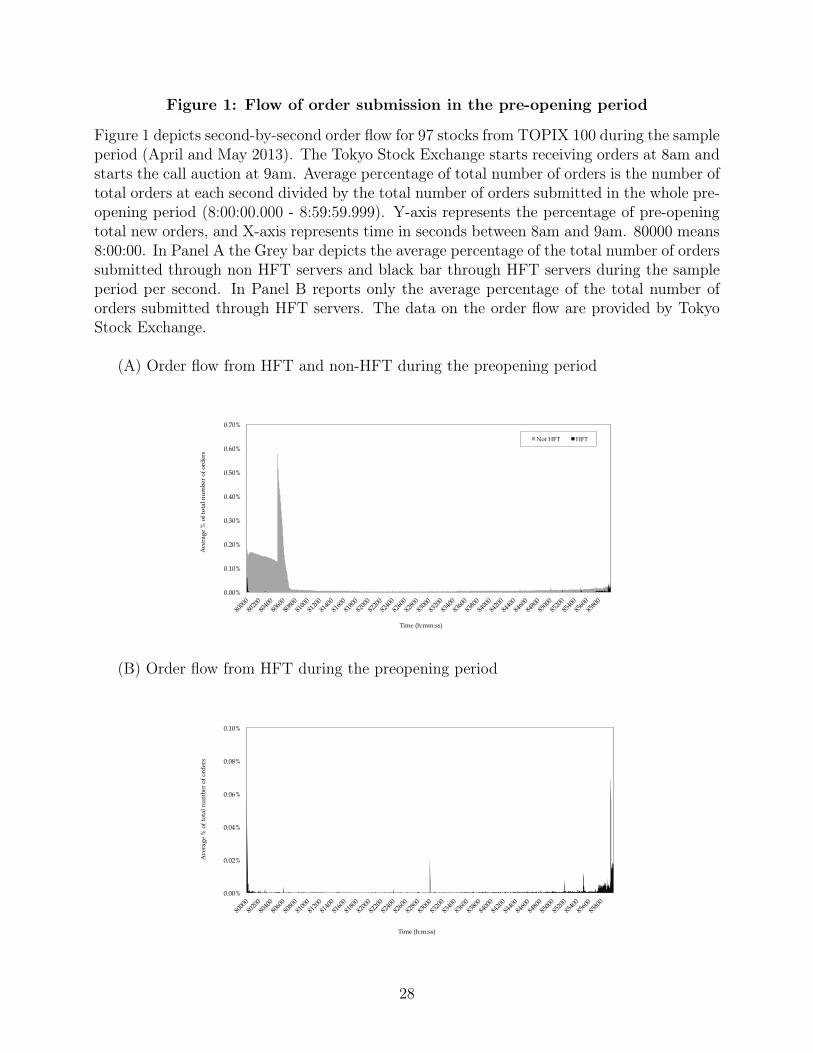
Figure 1: Flow of order submission in the pre-opening period
Figure 1 depicts second-by-second order flow for 97 stocks from TOPIX 100 during the sampleperiod (April and May 2013). The Tokyo Stock Exchange starts receiving orders at 8am andstarts the call auction at 9am. Average percentage of total number of orders is the number oftotal orders at each second divided by the total number of orders submitted in the whole pre-opening period (8:00:00.000 - 8:59:59.999). Y-axis represents the percentage of pre-openingtotal new orders, and X-axis represents time in seconds between 8am and 9am. 80000 means8:00:00. In Panel A the Grey bar depicts the average percentage of the total number of orderssubmitted through non HFT servers and black bar through HFT servers during the sampleperiod per second. In Panel B reports only the average percentage of the total number oforders submitted through HFT servers. The data on the order flow are provided by TokyoStock Exchange.
(A) Order flow from HFT and non-HFT during the preopening period
0.00%
0.10%
0.20%
0.30%
0.40%
0.50%
0.60%
0.70%
8000
0
8020
0
8040
0
8060
0
8080
0
8100
0
8120
0
8140
0
8160
0
8180
0
8200
0
8220
0
8240
0
8260
0
8280
0
8300
0
8320
0
8340
0
8360
0
8380
0
8400
0
8420
0
8440
0
8460
0
8480
0
8500
0
8520
0
8540
0
8560
0
8580
0
Ave
rage
% o
f tot
al n
umbe
r of
ord
ers
Time (h:mm:ss)
Not HFT HFT
(B) Order flow from HFT during the preopening period
0.00%
0.02%
0.04%
0.06%
0.08%
0.10%
8000
0
8020
0
8040
0
8060
0
8080
0
8100
0
8120
0
8140
0
8160
0
8180
0
8200
0
8220
0
8240
0
8260
0
8280
0
8300
0
8320
0
8340
0
8360
0
8380
0
8400
0
8420
0
8440
0
8460
0
8480
0
8500
0
8520
0
8540
0
8560
0
8580
0
Ave
rage
% o
f tot
al n
umbe
r of
ord
ers
Time (h:m:ss)
28

Figure 2: Flow of order submission (new orders and cancellation) in the last tenminutes of the pre-opening session
Figure 2, Panel A and B, show the second-by-second average number of new orders andcancellations for non-HFT and HFT respectively for 97 stocks from TOPIX 100 during thesample period (April and May 2013). Average percentage is the number of total orders ateach second divided by the total number of orders submitted for the last 10 minutes ofthe pre-opening period (8:50:00.000 - 8:59:59.999) Y-axis represents the percentage of pre-opening total new orders, and X-axis represents time in seconds between 8:50am and 9am.85000 means 8:50:00. The data on the order flow are provided by Tokyo Stock Exchange.
(A) Non HFT order submission (new orders and cancellation)
0.00%
0.05%
0.10%
0.15%
0.20%
0.25%
0.30%
0.35%
0.40%
0.45%
0.50%
85000 85100 85200 85300 85400 85500 85600 85700 85800 85900
Ave
rage
% o
f tot
al n
umbe
r of
ord
ers
Time (h:mm:ss)
New Orders
Cancellations
(B) HFT order submission (new orders and cancellation)
0.00%
0.10%
0.20%
0.30%
0.40%
0.50%
0.60%
85000 85100 85200 85300 85400 85500 85600 85700 85800 85900
Ave
rage
% o
f tot
al n
umbe
r of
ord
ers
Time (h:mm:ss)
New Orders
Cancellations
29

Figure 3: Order flow during the last one second
Figure 3 shows four types of order submission activities: new orders (black line), price revi-sion (dotted line), cancellation (dark grey line) and quantity revision (light grey line) in thelast second of the pre-opening period (8:59:59.000 - 8:59:59.999) at the millisecond scale for97 stocks from TOPIX 100 during the sample period (April and May 2013). The data onthe order flow are provided by Tokyo Stock Exchange.
0
10
20
30
40
50
60
70
80
90
100
1000
97
9 95
8 93
7 91
6 89
5 87
4 85
3 83
2 81
1 79
0 76
9 74
8 72
7 70
6 68
5 66
4 64
3 62
2 60
1 58
0 55
9 53
8 51
7 49
6 47
5 45
4 43
3 41
2 39
1 37
0 34
9 32
8 30
7 28
6 26
5 24
4 22
3 20
2 18
1 16
0 13
9 11
8 97
76
55
34
13
Num
berr
of o
rder
s
Time (milliseconds)
New Price Revision Cancel Quantity Revision
30

Figure 4: Deviation from the opening price
Figure 4 shows the deviation of the pre-opening quote from the opening price computed ateach second in the whole pre-opening period (8:00:00.000 - 8:59:59.999) for 97 stocks fromTOPIX 100 during the sample period (April and May 2013). Deviation is defined as follow,as reported in equation (1):
Deviation =⇣
Md,s
Od� 1
⌘⇥ 100
Deviation is computed per second per day per stock and then averaged at each second. Thedata on the order flow are provided by Tokyo Stock Exchange.
0
0.5
1
1.5
2
2.5
800
801
802
803
804
805
807
808
809
810
811
813
814
815
816
817
818
820
821
822
823
824
826
827
828
829
830
831
833
834
835
836
837
839
840
841
842
843
844
846
847
848
849
850
852
853
854
855
856
857
Dev
iati
on f
rom
op
enin
g p
rice
Time (h:mm)
31

Figure 5: Relative limit price of cancelled sell and buy orders
Figure 5, Panel A and B, shows the relative limit price of the cancelled sell (buy) orders inthe last second of the pre-opening period (8:59:59.000 - 8:59:59.999) with the X-axis in theunit of 10% for 97 stocks from TOPIX 100 during the sample period (April and May 2013).Relative limit price is defined as follow:
Relative limit price = |Limit price�Midquote|Midquote
Negative number value of the relative limit price means that the limit sell price is lowerthan the prevailing mid-quote, thus it is immediately executable. The dotted line showsobservations in the first half of 8:59:59 (8:59:59.000 - 8:59:59.499) and the black line showsthe last half of 8:59:59 (8:59:59.500 - 8:59:59.499). The data on the order flow are providedby Tokyo Stock Exchange.
0
10
20
30
40
50
60
[-0.5, -0.4) [-0.4, -0.3) [-0.3, -0.2) [-0.2, -0.1) [-0.1, 0) [0, 0.1) [0.1, 0.2) [0.2, 0.3) [0.3, 0.4)
% o
f ord
ers
Relative limit price (10% intevals)
(A) Cancelled sell limit orders
Before&8:59:59:500&A-er&&&&8:59:59.500&
0
10
20
30
40
50
60
[-0.4, -0.3) [-0.3, -0.2) [-0.2, -0.1) [-0.1, 0) [0, 0.1) [0.1, 0.2) [0.2, 0.3) [0.3, 0.4) [0.4, 0.5)
% o
f ord
ers
Relative limit price (10% intevals)
(B) Cancelled buy limit orders
Before&8:59:59:500&A-er&&&&8:59:59.500&
32

Figure 5: Relative limit price of cancelled sell and buy orders
Figure 5, Panel C and D, is an enlarged version of Figure 5 (A and B) with finer X-axis witha 1% unit. This shows the distribution of the sample in Figure 5 in which the relative limitprice is between plus and minus 5% of the mid-quote in the last second of the pre-openingperiod (8:59:59.000 - 8:59:59.999) for 97 stocks from TOPIX 100 during the sample period(April and May 2013). Relative limit price is defined as follow:
Relative limit price = |Limit price�Midquote|Midquote
Negative number value of the relative limit price means that the limit sell price is lowerthan the prevailing mid-quote, thus it is immediately executable. The dotted line showsobservations in the first half of 8:59:59 (8:59:59.000 - 8:59:59.499) and the black line showsthe last half of 8:59:59 (8:59:59.500 - 8:59:59.499). The data on the order flow are providedby Tokyo Stock Exchange.
0
5
10
15
20
25
30
35
40
45
[-0.05, -0.04) [-0.04, -0.03) [-0.03, -0.02) [-0.02, -0.01) [-0.01, 0) [0, 0.01) [0.01, 0.02) [0.02, 0.03) [0.03, 0.04) [0.04, 0.05)
% o
f ord
ers
Relative limit price (10% intevals)
(C) Cancelled sell limit orders
Before&8:59:59:500&
A-er&&&&8:59:59:500&
0
10
20
30
40
50
60
70
[-0.05, -0.04) [-0.04, -0.03) [-0.03, -0.02) [-0.02, -0.01) [-0.01, 0) [0, 0.01) [0.01, 0.02) [0.02, 0.03) [0.03, 0.04) [0.04, 0.05)
% o
f ord
ers
Relative limit price (10% intevals)
(D) Cancelled buy limit orders
Before&8:59:59:500&
A-er&&&&8:59:59:500&
33

Figure 6: Mid-quote changes in the pre-opening period
Figure 6 shows the percentage of price changes caused by submission of orders for the lastminute of the pre-opening period (8:59:59.000 - 8:59:59.999) for 97 stocks from TOPIX 100during the sample period (April and May 2013). The events: ’up’ means that the submittedorder generates a positive impact on the mid-quote; ’down’ means that the submitted ordergenerates a negative impact on the mid-quote. The data on the order flow are provided byTokyo Stock Exchange.
8% 8%
84% Quote change at 8:59 AM up# down# no#change#
34

Figure 7: Number of events (stock-second) that have an impact on the ask andbid price
Figure 7, Panel A and B, shows that the number of stock-second that experienced a negativeor positive average impact on the ask (bid) price for the last minute of the pre-opening period(8:59:59.000 - 8:59:59.999). We count stock-days per each second in which market impactis observed for 97 stocks from TOPIX 100 during the sample period (April and May 2013).The data on the order flow are provided by Tokyo Stock Exchange.
0
200
400
600
800
1000
1200
1 2 3 4 5 6 7 8 9 10 11 12 13 14 15 16 17 18 19 20 21 22 23 24 25 26 27 28 29 30 31 32 33 34 35 36 37 38 39 40 41 42 43 44 45 46 47 48 49 50 51 52 53 54 55 56 57 58 59
Nu
mb
er o
f ev
ents
(sto
cks
/ sec
ond
)
Time
(A) Impact on ask price
Ask - Negative impact
Ask - Positive impact
0
200
400
600
800
1000
1200
1 2 3 4 5 6 7 8 9 10 11 12 13 14 15 16 17 18 19 20 21 22 23 24 25 26 27 28 29 30 31 32 33 34 35 36 37 38 39 40 41 42 43 44 45 46 47 48 49 50 51 52 53 54 55 56 57 58 59
Nu
mb
er o
f ev
ents
(sto
cks
/ sec
ond
)
Time
(B) Impact on bid price
Bid - Negative impact
Bid - Positive impact
35
Figure 8: Average impact on ask and bid price during the last minute of thepre-opening period
Figure 8 (A and B) shows that the median market impact on the ask (bid) price in eachsecond where we observe changes in mid-quotes for the last minute of the pre-opening period(8:59:59.000 - 8:59:59.999) for 97 stocks from TOPIX 100 during the sample period (Apriland May 2013). We separate events which have positive or negative changes on the ask pricefrom the previous second. The data on the order flow are provided by Tokyo Stock Exchange.
-0.002
-0.0015
-0.001
-0.0005
0
0.0005
0.001
0.0015
0.002
1 2 3 4 5 6 7 8 9 10 11 12 13 14 15 16 17 18 19 20 21 22 23 24 25 26 27 28 29 30 31 32 33 34 35 36 37 38 39 40 41 42 43 44 45 46 47 48 49 50 51 52 53 54 55 56 57 58 59
Ave
rage
Mar
ket I
mpa
ct
Time
(A) Average impact on ask price
Negative Positive
-0.002
-0.0015
-0.001
-0.0005
0
0.0005
0.001
0.0015
0.002
1 2 3 4 5 6 7 8 9 10 11 12 13 14 15 16 17 18 19 20 21 22 23 24 25 26 27 28 29 30 31 32 33 34 35 36 37 38 39 40 41 42 43 44 45 46 47 48 49 50 51 52 53 54 55 56 57 58 59
Ave
rage
Mar
ket I
mpa
ct
Time
(B) Average impact on bid price
Negative Positive
36

Figure 9: Results of unbiasedness regression
Using mid-quotes at each second, we estimate equation (2):
⌫ � E (⌫|I0) = ↵t + �t [Pt � E (⌫|I0)] + Zt
where v is the opening price (instead of the closing price used in Biais et al., 1999), Pt
is the pre-opening mid-quote, and E(⌫|I0) is the previous day’s closing price. We estimateequation (2) for every second in the last ten minutes of the pre-opening period (8:50:00.000 -8:59:59.999) and for each of the 97 stocks from TOPIX 100 in April and May 2013 for panelA and in January 2011 for panel B. The averages of the � coefficient and RMSE across stocksare shown in figure 9 panel A and B. If the pre-opening mid-quote is an unbiased estimatorof an opening price, the � coefficient equals 1. RMSE (root mean square error) quantifiesthe informational content of the preopening prices. The data on the order flow are providedby Tokyo Stock Exchange.
37