Embed Size (px)
Citation preview

LEGEND
0 10 20 30 Kilometers
State Boundary
Sanctuary Boundary
State Marine Reserve
State Marine Conservation Area
State Marine Protected Areas
Marine Reserves

What is a marine reserve?
Places in the ocean that are completely & permanently protected from uses that remove plants & animals or alter their habitats
LEGEND
0 10 20 30 Kilometers
State Boundary
Sanctuary Boundary
State Marine Reserve
State Marine Conservation Area
State Marine Protected Areas

Reserves Around the World
- > 100 marine reserves established worldwide
- Encompass < 1 % of world’s oceans
- < 0.01 % of U.S. waters
- Usually quite small, median reserve size is < 1.5 sq. mi.

What good are reserves?

Bigger, more abundant animals in reserves produce more young than smaller neighbors in unprotected waters
What good are reserves?

Case Study: Anacapa Is., CA

Case Study: Anacapa Is., CA
Inside reserve:
Lobster = 6 times more abundant
Red Urchins = grow 1.7 times larger
Sheephead = 3 times more plentiful
Kelp = 5 times more dense & persist longer

Case Study: Anacapa Is., CA

Can reserves produce benefits outside their boundaries?
Animals from reserves may move outside to supplement surrounding populations = Spillover Effect

Can reserves produce benefits outside their boundaries?
Larvae & plant propagules that disperse out of reserves may seed & boost populations in surrounding waters
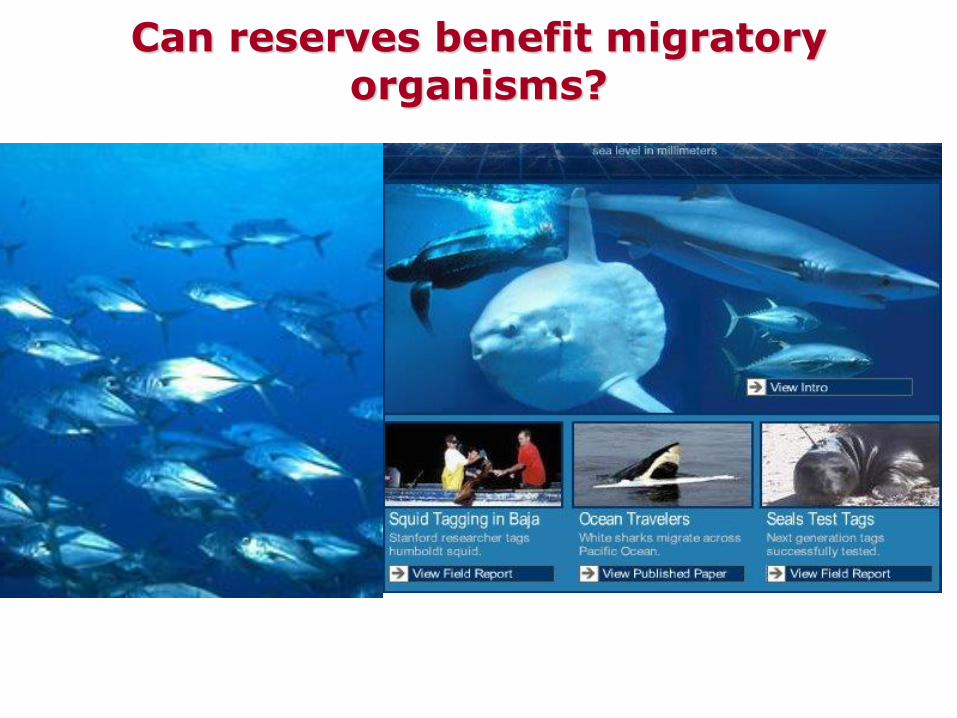
Can reserves benefit migratory organisms?

Things to consider when designing reserves
How long does it take to see a response?

Do all habitats need protection?

Can reserves protect species that are affected by climate change and pollution?

Santa Rosa
Island
Santa Cruz
Island Anacapa
Island
Santa Barbara Island
San Miguel
Island
Santa Barbara Point Conception
Connectivity: Spring Upwelling Period
Representation of sea surface currents measured at Scripps Institute of Oceanography, La Jolla, CA.
Ocean processes, natural catastrophes

Does size and number matter? %
po
pu
lati
on
s p
rote
cte
d
0
20
40
60
80
100
0 20 40 60 80 100
Data from Mace, P.M., and M.P. Sissenwine. 1993. How much spawning per recruit is enough? Canadian Special
Publication of Fisheries and Aquatic Sciences 120:110-118.
RESERVE SIZE (%)

Does size and number matter?
RESERVE SIZE (%)
N p
ub
lis
he
d r
ec
om
me
nd
ati
on
s
0 20 40 60 80 100
0
5
10
15
20
25
Composite of all published recommendations for reserve size to achieve goals for fisheries.

CO
NS
ER
VA
TIO
N B
EN
EF
ITS
(% p
op
ula
tio
ns p
rote
cte
d)
FIS
HE
RIE
S B
EN
EF
ITS
(N p
ub
lis
he
d r
ec
om
me
nd
ati
on
s)
0
20
40
60
80
100
0 20 40 60 80 100
0
5
10
15
20
25
Effective Reserve Sizes
RESERVE SIZE (%)
Recommended by the Science Advisory Panel to the Marine Reserves Working Group. 2001.

Networks of reserves
(Connectivity)

Social & Economic Issues

Relative Number of Fishing Operations Channel Islands National Marine Sanctuary
Sea Urchins
Squid
Rockfish
Sheephead
Flatfishes
Crab
Sea Cucumbers
Lobster
Sculpin and Bass
Sharks
Wetfish
Prawn
Tuna
Leeworthy, V. R., and P. C. Wiley. 2002. Socioeconomic Impact Analysis of Marine Reserve Alternatives for the Channel
Islands National Marine Sanctuary. U.S. DOC/NOAA/NOS. Special Projects. Silver Springs.

Sum of 1999
Commercial
Fishing Value: Channel Islands NMS
Urchins
Lobster
Rockfish
Prawn
Crab
Sheephead
Wetfish
Flatfish
Sculpin
Tuna
Sharks
Cucumbers
Squid
Leeworthy, V. R., and P. C. Wiley. 2002. Socioeconomic Impact Analysis of Marine Reserve Alternatives for the Channel
Islands National Marine Sanctuary. U.S. DOC/NOAA/NOS. Special Projects. Silver Springs.

0
50
100
150
200
250
88 89 90 91 92 93 94 95 96 97 98 99
Year
Po
un
ds
(m
illio
ns
)
$26,950,000
Leeworthy, V. R., and P. C. Wiley. 2002. Socioeconomic Impact Analysis of Marine Reserve Alternatives for the Channel
Islands National Marine Sanctuary. U.S. DOC/NOAA/NOS. Special Projects. Silver Springs.
Market Squid Catch in California: 1988-1999

0
10
20
30
40
50
60
88 89 90 91 92 93 94 95 96 97 98 99
Year
Po
un
ds
(m
illio
ns
)
$5,950,000
Leeworthy, V. R., and P. C. Wiley. 2002. Socioeconomic Impact Analysis of Marine Reserve Alternatives for the Channel
Islands National Marine Sanctuary. U.S. DOC/NOAA/NOS. Special Projects. Silver Springs.
Red Sea Urchin Catch in California: 1988-1999
0
5
10
15
20
25
30
35
40
45
50
88 89 90 91 92 93 94 95 96 97 98 99
Year
Po
un
ds
(m
illio
ns
)
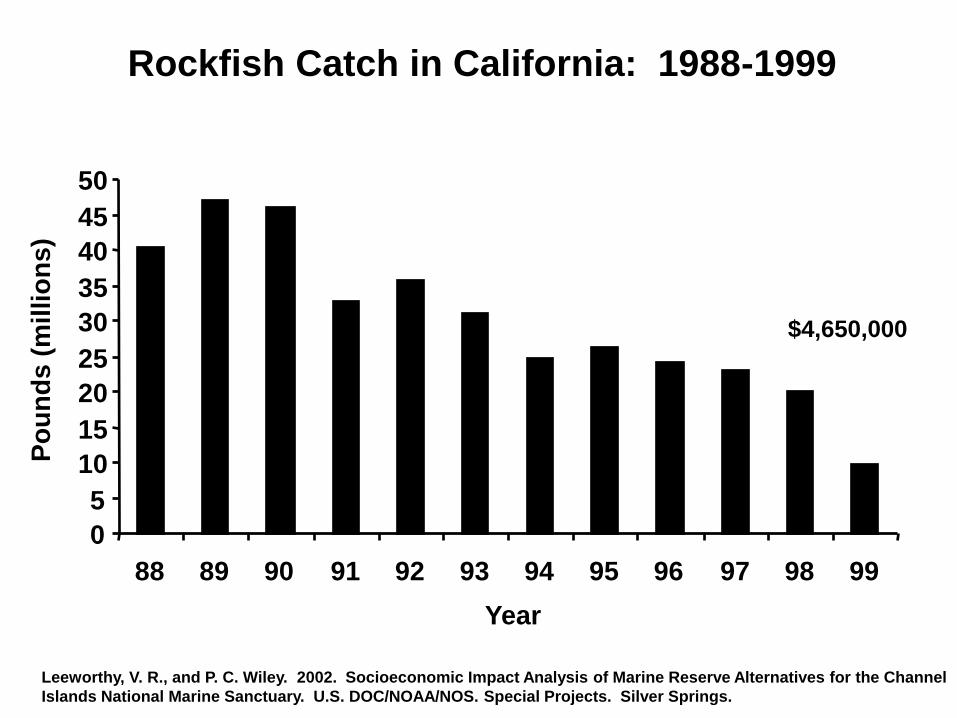
$4,650,000
Leeworthy, V. R., and P. C. Wiley. 2002. Socioeconomic Impact Analysis of Marine Reserve Alternatives for the Channel
Islands National Marine Sanctuary. U.S. DOC/NOAA/NOS. Special Projects. Silver Springs.
Rockfish Catch in California: 1988-1999

Spiny Lobster Catch in California: 1988-1999
0
100
200
300
400
500
600
700
800
900
1000
88 89 90 91 92 93 94 95 96 97 98 99
Year
Po
un
ds
(th
ou
sa
nd
s)
$950,000
Leeworthy, V. R., and P. C. Wiley. 2002. Socioeconomic Impact Analysis of Marine Reserve Alternatives for the Channel
Islands National Marine Sanctuary. U.S. DOC/NOAA/NOS. Special Projects. Silver Springs.

Abalone Catch in California: 1988-1999
0
50
100
150
200
250
300
350
88 89 90 91 92 93 94 95 96 97 98 99
Year
Po
un
ds
(th
ou
sa
nd
s)
Leeworthy, V. R., and P. C. Wiley. 2002. Socioeconomic Impact Analysis of Marine Reserve Alternatives for the Channel
Islands National Marine Sanctuary. U.S. DOC/NOAA/NOS. Special Projects. Silver Springs.

Channel Islands Marine Reserves
- 10 years ago, fishermen developed initial map where they thought reserves should be
- Committee of scientist to come up with best areas for reserves, scientifically (other studies said 40%, panel suggested 30 – 50 %).
- Other stakeholders consulted and more maps produced
- 5 years (1998) of intensive work to get proposal on table to Fish and Game Commission
- April 9, 2003 regulations implemented
http://channelislands.noaa.gov/welcome.html

LEGEND
0 10 20 30 Kilometers
State Boundary
Sanctuary Boundary
State Marine Reserve
State Marine Conservation Area
State Marine Protected Areas
Miguel
Santa Rosa
Island
Santa Cruz
Island Anacapa
Island
State Boundary
Sanctuary Boundary
Oregonian Bioregion
Transition Bioregion
Californian Bioregion
Richardson Rock Harris
Point
Judith Rock
Carrington
Point
South Point
Skunk Point
Gull Island
Painted Cave Scorpion
Rock
Santa Barbara Island
Prince I. San
Point
Conception Santa Barbara
Area of Detail
Effective April 9, 2003
Size: 132 nmi2

In effect July 2007

California Reserves: Past & Present
13,600 nautical square miles = total state waters
Past: 8 nautical sq. mi = no take
Present: 480 nm2 = no take (19 no take areas total)
10 (132 nm2) of the 19 are in Channel Is.


