Embed Size (px)
Citation preview

Marine Organic Geochemistry
Analytical Methods – II.
Methods For Characterization of Macromolecular Organic Matter.
Mass Spectrometry

Reading list
Biopolymer/macromolecular organic matter analysis• Hedges J.I. (1991) Lignin, Cutin, Amino Acid and Carbohydrate Analyses of Marine Particulate
Organic Matter. In Marine Particles: Analysis and Characterization (Eds. D.C. Hurd and D.W. Spencer) Geophysical Monograph 63, pp. 129-137
• Mopper K. and Furton K.G. (1991) Extraction and Analysis of Polysaccharides, Chiral Amino Acids and SFE Extractable Lipids from Marine POM. In Marine Particles: Analysis and Characterization (Eds. D.C. Hurd and D.W. Spencer) Geophysical Monograph 63, pp. 151-161.
• Chappe B., Michaelis W. and Albrecht P. (1980) Molecular fossils of Archaebacteria as selective degradation products of kerogen. In Advances in Organic Geochemistry, 1979 (Eds. A.G. Douglas and J.R. Maxwell). pp. 265-274. Pergamon Press
• Mycke B. an Michaelis W. (1986) Molecular fossils from chemical degradation of macromolecular organic matter. Org. Geochem. 10, 847-858.
• Meuzelaar H.L.C, Haverkamp J. and Hileman F.D. (1982) Pyrolysis-Mass Spectrometry of Recent and Fossil Biomaterials. Compendium and Atlas. Elsevier
• Hedges J.I. and Ertel J.R. (1982) Characterization of lignin by capillary gas chromatography of cupric oxide oxidation products. Anal. Chem. 54, 174-178.
• Stock L.M. and Wang S.H. (1986) Ruthenium tetroxide catalyzed oxidation of coals. Fuel 65, 1552.
Mass Spectrometry
General reference• McLafferty F.W. (1980) Interpretation of Mass Spectra, 3rd Edition, University Science.• Meuzelaar H.L.C, Haverkamp J. and Hileman F.D. (1982) Pyrolysis-Mass Spectrometry of Recent
and Fossil Biomaterials. Compendium and Atlas. Elsevier.• Peters K.E. and Moldowan J.M (1993) The Biomarker guide. Prentice-Hall. 363 pp.
Specific topics• Kujawinski E.B., Freitas M. A., Zang X., Hatcher P.G., Green-Church K.B., and Jones R.B. (2002)
The application of electrospray ionization mass spectrometry (ESI-MS) to the structural characterization of natural organic matter. Org. Geochem. 33, 171-180.
• Sturt H.F., Summons R.E., Smith K., Elvert M. and Hinrichs K.-U. (2004) Intact polar membrane lipids in prokaryotes and sediments deciphered by high-performance liquid chromatography/electrospray ionization multistage mass spectrometry – new biomarkers for biogeochemistry and microbial ecology. Rapid Comm. Mass Spectrom. 18, 617-628.
Reading list

Characterization of Macromolecular Organic Matter:Analytical Approaches
1. Direct Spectroscopy (e.g. FTIR, NMR)
Advantages:• quantitative• non-destructive (IR & NMR)• rapid
Disadvantages• Lower resolution information

Characterization of Macromolecular Organic Matter:Analytical Approaches
2. Chemical degradation ("Chemolysis")
Advantages• Very selective• Carbon skeletons can be preserved - more biochemical information (molecular-level)
Disadvantages• Time-consuming - low sample throughput• Solubility limitations of many reagents• Non-quantitative or semi-quantitative
Characterization of Macromolecular Organic Matter:Analytical Approaches
3. Thermal degradation ("pyrolysis")
Advantages• relatively rapid• semi-quantitative• can analyze samples irrespective of solubilityDisadvantages• Complex distributions of products• Secondary reactions ?
Best approach: A combination of these techniques

Organic matter concentration (demineralization) procedures
• Removal of carbonates (HCl)• Removal of silicates (HF) 40-50% HF, <40°C overnight• Removal of pyrite (LiAlH4, density separation, CrCl2)*
• *Prone to sample fractionation/alteration

Chemical degradation (chemolysis) methods
• Reagent(s) Deg. Type Site(s) of attack Biochemical(s)• H2SO4 acid hydrolysis glycoside link polysaccharides• HCl acid hydrolysis peptide link proteins• CuO basic oxidative ether link lignin
hydrolysis ester link cutin• BBr3 ether cleavage ether link ether lipids• Ru/C hydrogenolysis ether link lignin• ether lipids• KOH basic hydrolysis ester link cutin
(saponification) ester-bound lipids• Raney Ni desulfurization sulfur link S-macromol.• MeLi/MeI di/polysulfides S-macromol• RuO4 oxidation double bonds aromatic systems
functional groups

Molecular-level Characterization of Polysaccharides
Method:• Acid hydrolysis of polymer to monomers
Hydrolysis• If crystalline cellulose (vascular plants) present - must pre-treat sample with 72 wt% H2SO4 to
soften fibers prior to hydrolysis.• Hydrolysis usually performed by reflux in 1M H2SO4 for 3hr
Limitations• Simple sugars are unstable under hydrolysis conditions so must balance competing reactions of
production vs destruction of monosaccharides.• Efficiency of hydrolysis dependent upon polysaccharide composition.• Not all polysaccharides in environmental samples are hydrolyzable.

Molecular-level Characterization of Polysaccharides
Analysis
1. GC of equilibrated anomeric mixtures as volatile trimethylsilyl derivatives without pre-treatment to remove troublesome carbonyl. (Cowie and Hedges)
2. GC of alditol acetate derivatives (formed via reduction followed by ester formation, (Klok)• Advantages:• only one peak per sugar and high resolution via capillary GC columns• can use GC-MS for identification• suitable for isotopic analysis by GC-irMS?• Disadvantages:• Procedurally complex• loss of information (one alditol can be formed from more than one aldose or ketose)
3. Direct analysis by HPLC using fluorescent derivatives (Mopper)• Advantages:• Can perform in aqueous system• High sensitivity• Disadvantages• low resolution of HPLC vs GC• some derivatives are unstable.

Molecular-level Characterization of Protein Amino Acids
Method• Acid hydrolysis (basic hydrolysis causes extensive racemization and loss of some amino acids).• Typical reaction conditions: 6N HCl at 100°C for 24 hr• Chromatographic separation: 3 different approaches
– 1. Ion exchange chromatography– 2. HPLC– 3. GC

Molecular-level Characterization of Lignin
Method:• CuO alkaline oxidative hydrolysis• CuO procedure breaks apart lignin polymers (β-O-4 linked phenolic macromolecule) into simple
phenols that can be separated and quantified by HPLC or by GC (after derivatization).
General Procedure:• 0.5 g sediment + CuO + NaOH• Bomb 170°C, 3 hr• filter products• extract with diethylether• dry (anhydrous Na2SO4)• derivatize (in pyridine) with BSTFA• GC(/MS) or HPLC-UV/Vis
Efficiency of phenol yield from CuO oxidation• Vanillyl 30%• Syringyl 90%• Others ?

Thermal degradation (pyrolysis) methods
Mechanism of pyrolytic cleavage:• Primarily free radical process involving chain scission followed by propagation and termination steps.• Functional groups and heteroatomic linkages particularly susceptible to cleavage
Mode of Use• On-line • Pyrolysis-Gas Chromatography (Py-GC)• Pyrolysis-Gas Chromatography-Mass Spectrometry (Py-GC-MS)• Pyrolysis-Mass Spectrometry (Py-MS)• Off-line• Py-trap
Flash Pyrolysis• Rapid heating (< 5s) to high temperatures (>500°C) to promote dissociation of macromolecule with minimal
opportunity for secondary reactions.• Used for structural characerization.
Static pyrolysis• Slow or isothermal heating in a closed system in the presence of absence of water.• Designed to mimic geological heating (hydrothermal systems, petroleum generation in the subsurface).

Mass Spectrometry
What is Mass Spectrometry?• The separation of matter according to atomic and molecular mass.• Used in analysis of organic compounds of molecular mass up to 200,000 Daltons.• Most versatile, sensitive and widely used analytical method available today.
Principle:• Mass spectrometers use the difference in the mass-to-charge ratio (m/e or m/z) of ionized atoms
or molecules to separate them from each other.• MS is useful for the quantification of atoms or molecules, and also for determining chemical,
structural and isotopic information about molecules.• Molecules have distinct fragmentation patterns that provide chemical information (structural
elucidation).

Basic Components of a Mass Spectrometer
General operation:1. Create gas-phase ions2. Separate the ions in space or
time based on their mass-charge ratio.
3. Measure the quantity of ions of each mass/charge ratio.
Since MS systems create and manipulate gas-phase ions, they operate under high vacuum.
Magnetic-sector, quadrupole and time-of-flight mass analyzers also require extraction and acceleration ion optics to transfer ions from the source region to the mass analyzer.
Inlet
Source MassAnalyzer
IonDetector
DataSystem
Mass spectrum
m/z
Inte
nsity
VacuumPumps

Ionization Methods
• Electron Impact (EI) ionization• An EI source uses an electron beam, usually
generated from a tungsten filament, to ionize gas-phase atoms or molecules.
• An electron from the beam knocks an electron off the analyte to create ions.
• EI is the most common ionization method for routine GC/MS analysis
• EI is a relatively harsh ionization technique and can lead to extensive fragmentation of the molecule (good and bad).
• Typical ionization conditions 35-70 eV• 12-20 eV = low eV (less fragmentation).
Tungsten filament
Electron beam

Ionization Methods
Chemical Ionization (CI)• CI uses a reagent ion to react with the analyte molecules to form ions by either proton or hydride
transfer:• MH + C2H5
+ MH2+ + C2H4
• MH + C2H5+ M+ + C2H6
• The reagent ions are produced by introducing a large excess of methane or another gas (e.g. ammonia) relative to the analyte into an EI source. Electron collisions produce CH4
+ and CH3+
which react further with methane to form C2H5+.
CI is a softer ionization technique.

Fast-atom Bombardment (FAB)• In FAB a high-energy beam of neutral atoms, typically Xe or Ar, strikes a solid sample causing
both desorption and ionization. • The atomic beam is produced by accelerating ions from an ion source through a charge-exchange
cell. The ions pick up an electron in collisions with neutral atoms to form a beam of high energy atoms.
FAB causes little fragmentation and usually gives a large peak corresponding to the molecular weight (molecular ion).
Electrospray ionization (ESI)• The ESI source consists of a very fine needle and a series of skimmers.• A sample solution is sprayed into the source chamber to form droplets. The droplets carry charge
when they exit the capillary and, as the solvent evaporates (desolvation), the droplets disappear leaving highly (multiply) charged analyte molecules.
ESI is particularly useful for large biological molecules (e.g. proteins, peptides) that are difficult to vaporize or ionize, or beyond the mass range of the analyzer.
Ionization Methods
Ionization Methods
Field ionization (FI) and Field Desorption (FD)• Molecules can lose an electron when placed in a very high electric field.• High fields can be created in an ion source by applying a high voltage between a cathode and an
anode - called a “field emitter”. A field emitter consists of a wire covered with microscopic carbon dendrites, which greatly amplify the effective field.
FI causes little fragmentation. Used extensively in characterization of humic and fulvic acids (soil science).
Laser Ionization (LIMS)• A laser pulse ablates the material from the surface of the sample, and creates a microplasma that
ionizes some of the sample constituents.• The laser pulse accomplishes both vaporization and ionization of the sample.
Matrix-assisted laser desorption ionization (MALDI)• Macromolecules are dispersed in a solid matrix such as nicotinic acid or glycerol.• A UV laser pulse ablates the matrix which carries some of the large molecules into the gas phase
in an ionized form.
MALDI is a LIMS method for vaporizing and ionizing large biological molecules (e.g., proteins, DNA fragments). See MALDI-TOF-MS
Ionization Methods
Resonance Ionization (RIMS)• One or more laser beams are tuned in resonance to transitions of a gas phase atom or molecule
to promote it above its ionization potential and create an ion.• Solid samples must be vaporized by heating, sputtering or laser ablation.
Secondary Ionization (SIMS)• A primary ion beam - such as 3He+, 16O+, or 40Ar+ - is accelerated and focused onto the surface of
a sample and sputters material into the gas phase. Approximately 1% of the sputtered material comes off as ions, which can then be analyzed by the MS.
SIMS has the advantage that material can be continually sputtered from a surface to determine analyte concentrations as a function of distance (spatial and depth profiling).
SIMS basis of Accelerator Mass Spectrometry and Ion Microprobe MS
Thermal Ionization (TIMS)• A sample is deposited on a metal ribbon, such as Pt or Re, and an electric current heats the metal
to a high temperature.• The ribbon is often coated with graphite to provide a reducing effect.
TIMS is used for elemental or refractory materials.
Mass Analyzers
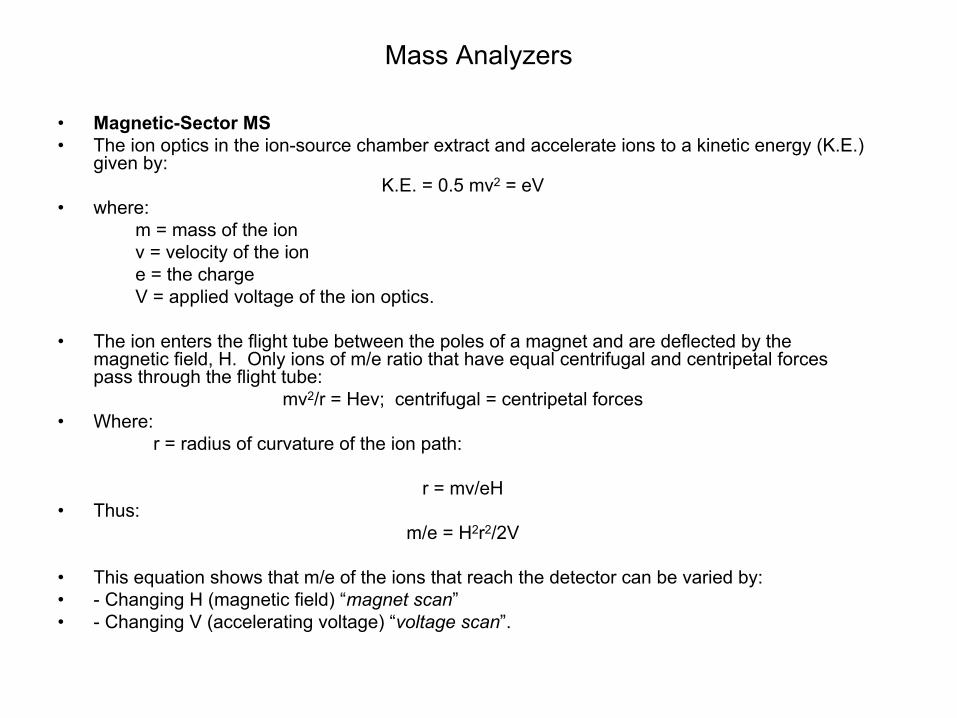
• Magnetic-Sector MS• The ion optics in the ion-source chamber extract and accelerate ions to a kinetic energy (K.E.)
given by:K.E. = 0.5 mv2 = eV
• where:m = mass of the ionv = velocity of the ione = the chargeV = applied voltage of the ion optics.
• The ion enters the flight tube between the poles of a magnet and are deflected by the magnetic field, H. Only ions of m/e ratio that have equal centrifugal and centripetal forces pass through the flight tube:
mv2/r = Hev; centrifugal = centripetal forces• Where:
r = radius of curvature of the ion path:
r = mv/eH• Thus:
m/e = H2r2/2V
• This equation shows that m/e of the ions that reach the detector can be varied by:• - Changing H (magnetic field) “magnet scan”• - Changing V (accelerating voltage) “voltage scan”.

Mass Analyzers
Magnetic-Sector MS
• Instrumentation:• Single focus analyzers: A circular
beam path of 180, 90 or 60 degrees can be used. The various forces influencing the particle separate ions with different m/e ratios.
• Double focussing analyzers: An electrostatic field is added to separate particles with different kinetic energies.
• Magnetic sector MS provides nominal to high mass resolution.
• Most common mass analyzer for determination of isotope ratios.
Magnetic-Sector MS

Mass Analyzers
Quadrupole MS• A quadrupole mass filter consists of four
parallel metal rods.• Two opposite rods have an applied potential
of (U+Vcos(wt)), and the other two rods have a potential of –(U+Vcos(wt)) where:
- U is a dc voltage- Vcos(wt) is an ac voltage.
• The applied voltage affects the trajectory of ions travelling down the flight path centered between the four rods. For given ac and dc voltages only ions of certain m/e ratio pass through the quadrupole filter, others are thrown out.
• A mass spectrum is obtained by monitoring the ions passing through the quadrupolefilter as voltages on the rods are varied.
Quadrupole MS provides nominal mass resolution.
Most common mass analyzer for routine GC/MS applications (“Bench-top” GC/MS).
Quadrupole MS

Mass Analyzers
Ion-Trap MS• The ion trap MS uses three electrodes to
trap ions in a small volume. The mass analyzer consists of a large ring electrode separating two hemispherical electrodes.
• A mass spectrum is obtained by changing the electrode voltages to eject the ions from the trap.
• The advantages of Ion Trap MS include compact size, the ability to trap and accumulate ions to increase signal-to-noise, and the ability to perform MS-MS, or MSnexperiments.
• Common benchtop MS for GC or LC.• Ion Trap MS provides nominal mass
resolution
Ion-Trap MS

Mass Analyzers
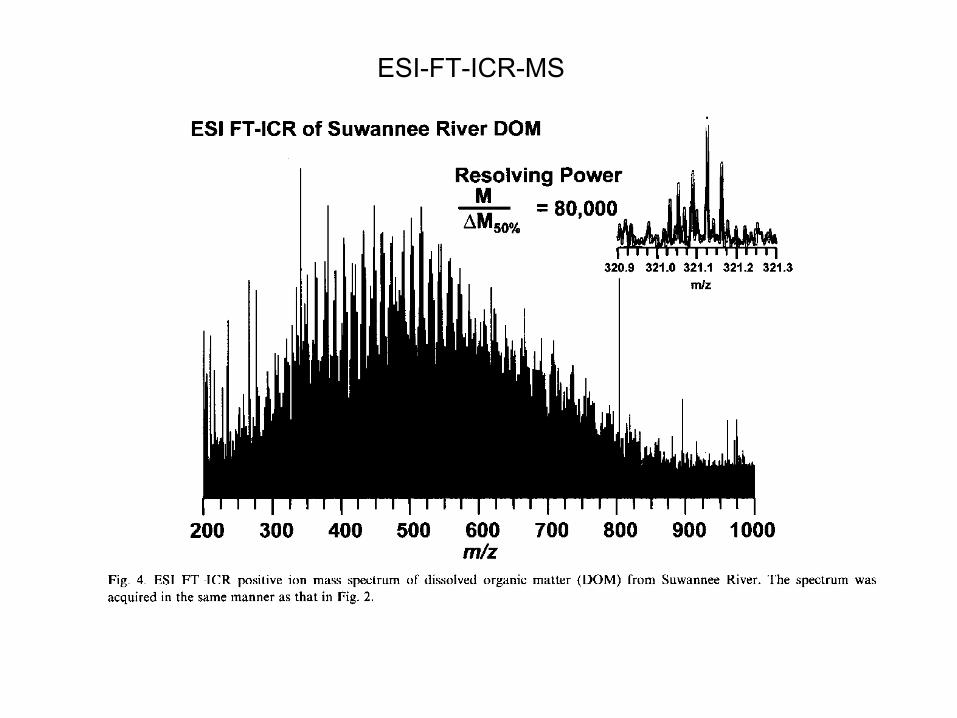
Fourier-Transform Ion Cyclotron Resonance MS (FT-ICR)
• FT-ICR MS takes advantage of ion cyclotron resonance to select and detect ions.
• Ions are trapped within a cubic cell under the influence of small trapping potentials and a constant magnetic field. The frequency of the signal measured at the receiver plate is proportional to ion mass.
FT-ICR MS provides extremely high-resolution (accurate) mass measurement.
Time-domain signal
Mass spectrum
FT

Mass AnalyzersTime-of-Flight (TOF) MS• A TOF MS system uses the differences in
transit time through a drift region to separate ions of different masses.
• It operates in pulsed mode so ions must be produced or extracted in pulses.
• An electric field accelerates all ions into a field-free drift region with a kinetic energy of qV, where q is the ion charge and V is the applied voltage.
• Since the ion kinetic energy = 0.5 mv2 lighter (smaller) ions have a higher velocity than heavier ions, and reach the detector at the end of the drift region sooner.
The advantages of TOF-MS are the ability to measure very large masses, and fast MS acquisition rate.
TOF-MS provides nominal to medium resolution.
Drift region
Reflectron TOF-MS

Ion Detectors
• Channeltron• Daly detector• Electron multiplier tube (EMT)• Faraday cup (used in isotope ratio mass MS)• Microchannel plate (used in TOF-MS)

Interpretation of Mass Spectra
Important Features of Mass SpectraMolecular Ion (M+.)• Intensity will depend on stability of molecular
structure and ease of fragmentation
Base Peak (B+)• May be molecular ion or favored fragment
ion, depending on structure
Fragment Ions• May be formed by cleavage, loss of neutral
fragments or by structural rearrangement• May be many or few The mass spectrum (EI) of acetone, CH2COCH3,
contains many fragment ions as well as the molecular ion at m/z 58

Interpretation of Mass Spectra
Major Influences on Mass Spectral Fragmentations of Organic Compounds
• 1. Ring Structures• 2. Branching points• 3. Double bonds• 4. Aromaticity• 5. Stereochemistry• 6. Functionality
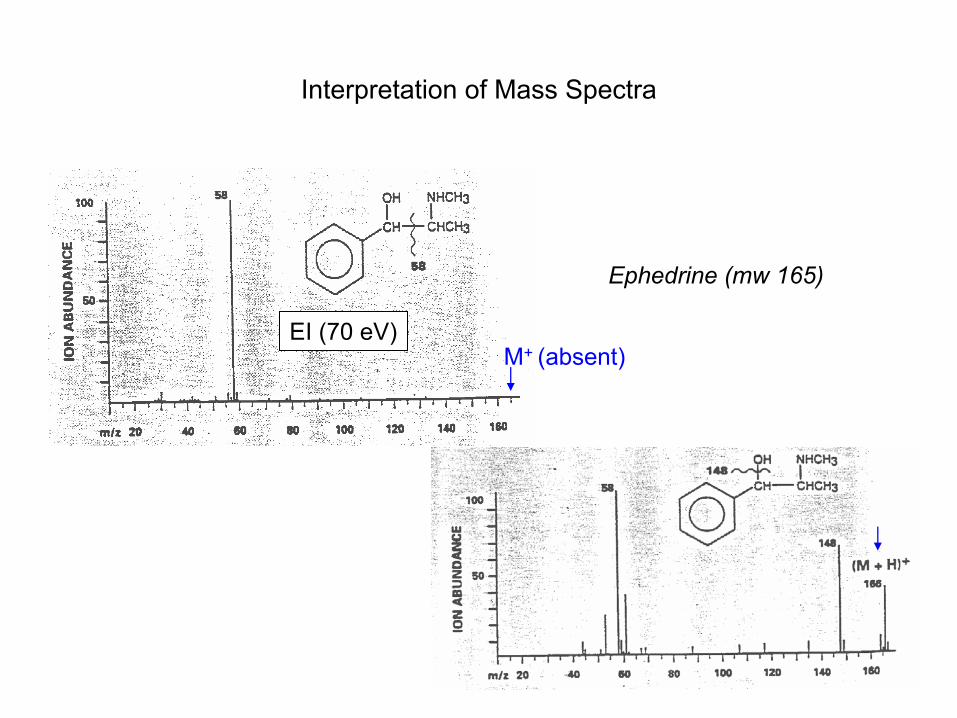
Interpretation of Mass Spectra
CI (CH4)
Ephedrine (mw 165)
EI (70 eV)M+ (absent)

Interpretation of mass spectra
Mass Resolution• R = resolution required to baseline separate a pair of ions having the same nominal mass:
R = M/∆m• Where:
M = nominal mass of ions to be separated∆m = difference in mass
• e.g. CO+ (27.995) and N2+ (28.006), nominal mass = 28
∆m = 0.011, R = 2,500

Interpretation of mass spectra
Isotopic abundances and precise masses of selected elements
Mass Defect: the difference between the nominal and exact mass. The mass defect can assume both positive and negative values.

Highest base-line resolved mass for selected doublets at a resolution of 1 part in 25000
Interpretation of mass spectra

High resolution mass spectrum (FT-ICR-MS) of carbon monoxide and nitrogen
Interpretation of mass spectra

Gas Chromatography-Mass Spectrometry (GC/MS)and Liquid Chromatography-Mass Spectrometry (LC/MS)
Objective:• Identification and Quantification of components in complex mixtures.• GC/LC: Separates components of complex mixture according to molecular size, shape, polarity.• MS: Permits recognition of individual components as they sequentially elute from GC.
ApproachCompound Identification• Mass Spectra• Mass ChromatographyCompound Quantification• Total (Reconstructed) Ion Current (TIC/RIC)• Mass Chromatography
• MS scans across a given mass range (e.g. 50 - 500 amu) at a set rate (e.g. 1 scan/sec).• Spectra are collected ("acquired") for each scan over a time (usually corresponding to the length
of the GC run).

Mass Chromatography/Mass Fragmentography
• Use: single ion monitoring• multiple ion monitoring• Can select ions characteristic of• compound type• carbon number• stereochemistry
Example 1• Mass Spectra are collected for unrelated
compounds A, B and C separated from a mixture by GC
• Mass x,y and z are found to be uniquely characteristic for compounds A,B and C respectively.
• Can perform mass chromatography using diagnostic ions

Example 2.• For related compounds A and A' can select a common ion to study their distributions in complex
mixtures• This is a very good method for recognition, characterization and "fingerprinting" of homologous
series.
Mass Chromatography/Mass Fragmentography

Mass Chromatography/Mass Fragmentography
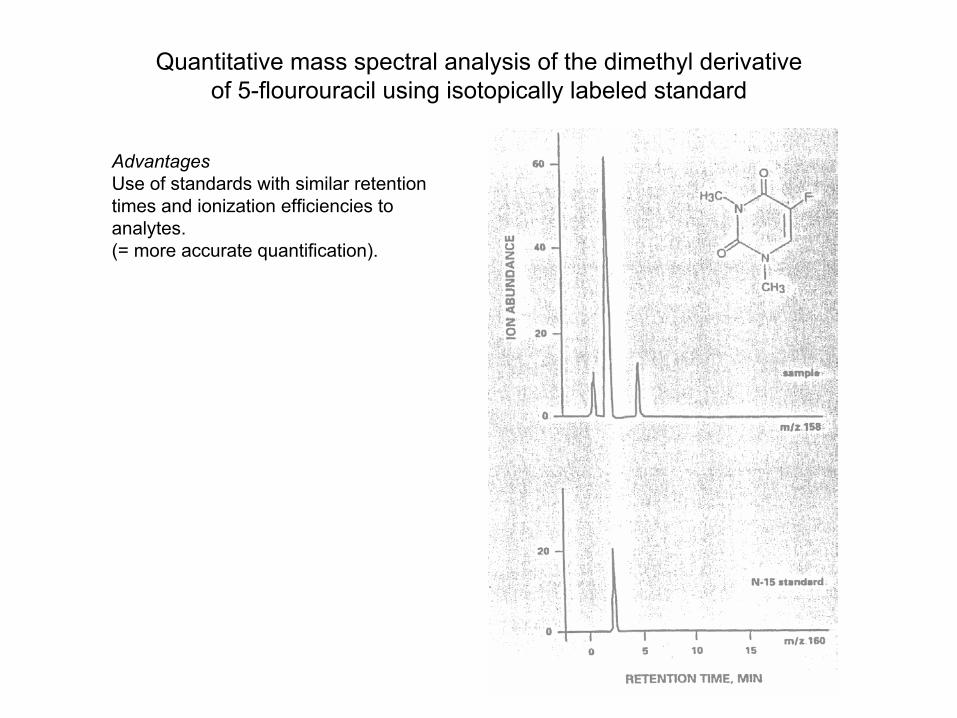
Quantitative mass spectral analysis of the dimethyl derivative of 5-flourouracil using isotopically labeled standard
AdvantagesUse of standards with similar retention times and ionization efficiencies to analytes.(= more accurate quantification).

Mass Chromatography/Mass Fragmentography


Tandem Mass Spectrometry (MS/MS)
In MS/MS, the first mass analyzer selects one m/z value for fragmentation; the second mass analyzer produces the mass spectrum of the fragments.
In ion trap and FT-ICR systems, this process can be repeated multiple times (MSn)

MALDI-TOF/MS
Mass Spectrometry of high mass organic compounds

Mass Spectrometry of high mass organic compounds
MALDI-TOF/MS of bovine serum albumin (protein)
m/z

Mass Spectrometry of high mass organic compounds
ESI/MS of bovine carbonic anhydrase (enzyme protein, mw 28,000 Da, 12.5 pmol)
Electrospray ESI/MS of large biomolecules results in an array of multichargeions with moderate m/zvalues.
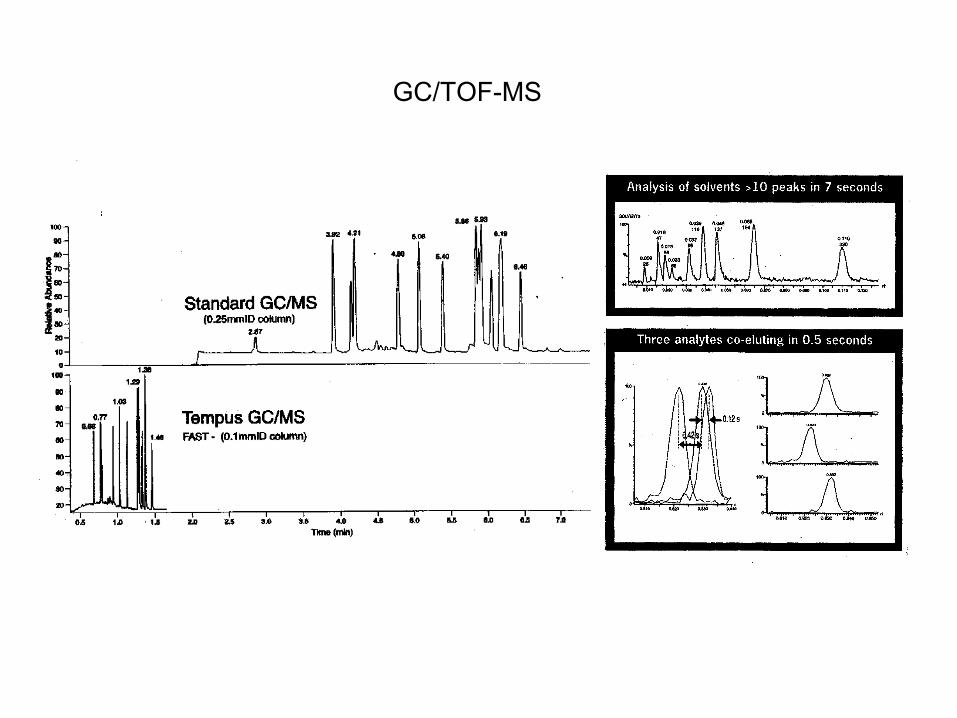
GC/TOF-MS


ESI-FT-ICR-MS

ESI-MS
ESI-FT-ICR-MS

High performance liquid chromatography/atmospheric pressurechemical ionization-mass spectrometry (HPLC/APCI-MS) of intact tetraether lipids
Hopmans et al 2000

High performance liquid chromatography/electrospray ionization-mass spectrometry (HPLC/ESI-MS) of intact polar lipids
Sturt et al. 2004

HPLC-ESI-MS/MS of glyceroldialkylglyceroltetraethers (GDGTs)
Sturt et al. 2004
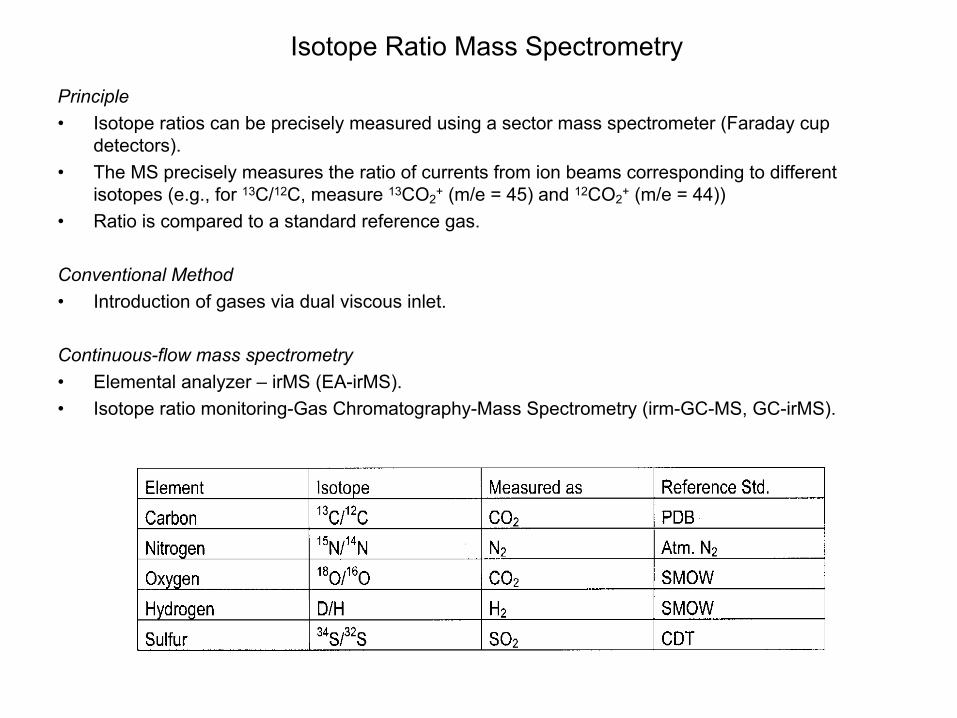
Isotope Ratio Mass Spectrometry
Principle• Isotope ratios can be precisely measured using a sector mass spectrometer (Faraday cup
detectors).• The MS precisely measures the ratio of currents from ion beams corresponding to different
isotopes (e.g., for 13C/12C, measure 13CO2+ (m/e = 45) and 12CO2
+ (m/e = 44))• Ratio is compared to a standard reference gas.
Conventional Method• Introduction of gases via dual viscous inlet.
Continuous-flow mass spectrometry• Elemental analyzer – irMS (EA-irMS).• Isotope ratio monitoring-Gas Chromatography-Mass Spectrometry (irm-GC-MS, GC-irMS).

Isotope ratio Mass Spectrometry

GC-irMS or irmGC/MS

m/z
(45/
44)*
100
m/z
44
GC-irMS or irmGC/MS

GC-irMS or irmGC/MS
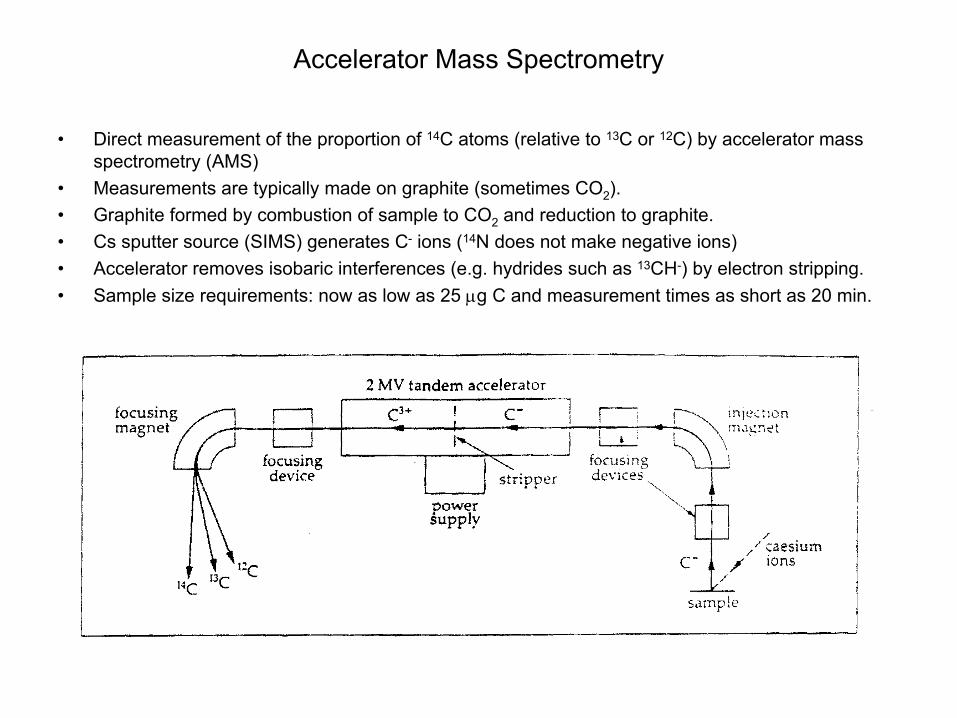
Accelerator Mass Spectrometry
• Direct measurement of the proportion of 14C atoms (relative to 13C or 12C) by accelerator mass spectrometry (AMS)
• Measurements are typically made on graphite (sometimes CO2).• Graphite formed by combustion of sample to CO2 and reduction to graphite.• Cs sputter source (SIMS) generates C- ions (14N does not make negative ions)• Accelerator removes isobaric interferences (e.g. hydrides such as 13CH-) by electron stripping.• Sample size requirements: now as low as 25 µg C and measurement times as short as 20 min.