Embed Size (px)
Citation preview
1 23
����������� ��������������� ���������������� �������������������������������������������������
����������� ������������������������������������� �����������
��������� ��������������� ����� ����������������������!� ��

1 23
Your article is protected by copyright andall rights are held exclusively by SpringerScience+Business Media B.V.. This e-offprintis for personal use only and shall not be self-archived in electronic repositories. If youwish to self-archive your work, please use theaccepted author’s version for posting to yourown website or your institution’s repository.You may further deposit the accepted author’sversion on a funder’s repository at a funder’srequest, provided it is not made publiclyavailable until 12 months after publication.

REVIEWS
Life in 3-D: life history strategies in tunas, mackerelsand bonitos
Maria Jose Juan-Jorda • Iago Mosqueira •
Juan Freire • Nicholas K. Dulvy
Received: 10 January 2012 / Accepted: 4 August 2012! Springer Science+Business Media B.V. 2012
Abstract The scombrids (tunas, bonitos, Spanish
mackerels and mackerels) sustain some of the mostimportant fisheries in the world and their sustainable
management depends on better understanding of their
life history strategies. Here, we first assemble lifehistory information on maximum size, growth, longev-
ity, maturity, fecundity and spawning duration andinterval for all scombrid species. Second we
characterize their life history patterns and trait
co-variation and evaluate how many principal axes oftrait variation underlie scombrid life history strategies.
Most of their life history variation can be explained
along three axes or dimensions: size, speed, andreproductive schedule. Body size governs the first axis
ranking species along a small-large continuum. Thesecond axis was mostly influenced by time-related
traits, such as longevity, growth rates, spawning
duration, time between spawning events, rankingspecies along a slow-fast continuum of life histories.
Scombrid species with the slowest life histories such as
Atlantic bluefin tuna Thunnus thynnus and Atlanticmackerel Scomber scombrus tend to inhabit more
temperate waters while species with faster life histories
such as yellowfin tuna Thunnus albacares and shortmackerel Rastrelliger brachysoma are typically found
in more tropical waters. The third axis comprises the
negative relationship between number of eggs producedat length of maturity and rate in gain of fecundity with
size describing the schedule of reproductive allocation
which reflects a fundamental trade-off between repro-duction and growth. Finally, in addition we show that
the life history strategies of scombrids conform more
closely to the Periodic and Opportunistic strategistswithin the triangular model of fish life histories.
Keywords Sexual dimorphism ! Life historytrade-offs ! Mortality ! Data-poor species !Data-poor methods ! Conservation ! Mammals !Life history data set
Electronic supplementary material The online version ofthis article (doi:10.1007/s11160-012-9284-4) containssupplementary material, which is available to authorized users.
M. J. Juan-Jorda (&)Grupo de Recursos Marinos y Pesquerıas, Facultad deCiencias, Universidad de A Coruna, Rua da Fraga 10,15009 A Coruna, Spaine-mail: [email protected]
M. J. Juan-Jorda ! N. K. DulvyEarth to Ocean Research Group, Department of BiologicalSciences, Simon Fraser University, Burnaby, BC V5A1S6, Canada
M. J. Juan-JordaAZTI-Tecnalia, Herrera Kaia, Portualde z/g., 20110Pasaia, Spain
I. MosqueiraEuropean Commission, Joint Research Center, IPSC/Maritime Affairs Unit, FISHREG, Via E. Fermi 2749,21027 Ispra, VA, Italy
J. FreireBarrabes Next, C. Serrano 16-1, 28001 Madrid, Spain
123
Rev Fish Biol Fisheries
DOI 10.1007/s11160-012-9284-4
Author's personal copy

Introduction
Information on the life history traits of species, such aspatterns of growth and reproduction, has many uses in
biology, theoretical ecology and applied resource
management (Beverton 1992; Molles 2000). The lifehistory attributes of species and their life history
strategies are fundamental to our understanding of
how species respond to human exploitation (Bevertonand Holt 1959; Jennings et al. 1998), habitat degra-
dation (Ockinger et al. 2010), invasions (Olden et al.
2008), and climate change (Dalgleish et al. 2010). Inaddition, the life history attributes are major determi-
nants of the population dynamics of fishes and
underpin the sustainable exploitation and managementof species through selectivity, effort and allowable
catch controls (Beverton and Holt 1959; Dulvy et al.
2004), or spatial management (Claudet et al. 2010).Here, we compile life history information for the 51
species in the family Scombridae (Table 1) with the
aim of characterizing their life history strategies andpromote the use of life history information to enhance
the management of exploited species of scombrids,
particularly species for which biological knowledge islimited. In an era where one of the major impediments
for ecosystem assessments and management is the
lack of information on the status for the majority of thespecies exploited, the knowledge of life history
parameters can provide a starting framework in
support of management (King and McFarlane 2003).The scombrid species (tunas, bonitos, Spanish
mackerels and mackerels) are major components of
the pelagic ecosystems being epipelagic and epi-mesopelagic predators with their life cycles confined
to marine open waters although some species are
associated to coral reefs and use estuarine and riverinehabitats (Collette and Nauen 1983). They are widely
distributed either in coastal or oceanic waters through-
out the tropical, subtropical and temperate waters ofthe world oceans. Most species are migratory, partic-
ularly the three species of bluefin tuna (Thunnusthynnus, T. orientalis and T. maccoyii) which cantolerate a wide thermal range from feeding grounds in
cold temperate waters to spawning grounds in warmer
waters (Boyce et al. 2008). Scombrids are also amongthe most advanced groups of pelagic fishes. The tunas
are endothermic having evolved a countercurrent heat
exchanger system with the function of retainingmetabolic heat that increases their body temperature
above the surrounding water (Block and Finnerty1994). Tunas have also evolved the highest swimming
speeds among fish and a high efficient oxygen uptake
system to fuel their high metabolic rates (Graham andDickson 2004). In addition to their biological and
ecological importance, scombrid species support
important fisheries worldwide from large-scale indus-trial to small-scale fisheries (Majkowski 2007; Juan-
Jorda et al. 2011). Their commercial importance and
economic value have also led to numerous life historystudies in the last 50 years, although the degree of life
history research varies across species (Collette et al.
2011). This family of fish represents an opportunity tostudy life history variation and life history strategies
given their wide ranging geographic extent in their
distributions and migrations, and their fascinatingadaptations to the pelagic environment, including
species with a wide breath of life history attributes
differing greatly in ecology.There have been several theories developed to
predict the evolution of specific sets of life history
traits and life history strategies of species in responseto environmental conditions (MacArthur and Wilson
1967; Murphy 1968; Pianka 1972; Stearns 1976;
Grime and Pierce 2012). The r–k selection theory wasone of the first, predicting a one-dimensional contin-
uum of life histories with extreme r- and K-selected
species at each end. This theory now is seen asincomplete and has been challenged by theoretical and
empirical work (Stearns 1977; Reznick et al. 2002).
Alternatively, there is now evidence that three-wayadaptive trade-off exists in all organisms including
bacteria, plants and animals, recognizing that multiple
trade-offs occur and not simple single dimensions(r–k) are involved in the evolution of primary adaptive
life history strategies in organisms (Grime 1977;
Southwood 1977; Winemiller and Rose 1992; Golov-lev 2001; Grime and Pierce 2012). One of the first
theories predicting three-way trade-offs, and now the
most mature and empirically-supported theory, is theCSR plant theory of primary adaptive strategies
(Grime 1974, 1977, 2001). The CSR theory predictsthat the strategies of plant species are an adaptive
response to a three-way trade-offs in the investment of
resources between the control of resource acquisitionin productive habitats (Competition or C strategy), the
persistence of individuals in unproductive habitats
(Stress tolerant or S strategy), or regeneration ofspecies in response to disturbance or lethal events
Rev Fish Biol Fisheries
123
Author's personal copy

Tab
le1
Lis
to
fsp
ecie
sin
the
fam
ily
Sco
mb
rid
aew
ith
thei
rta
xo
no
mic
info
rmat
ion
,oce
anic
env
iro
nm
ents
and
geo
gra
ph
icd
istr
ibu
tio
ns.
Th
ecu
rren
tac
cep
ted
clas
sifi
cati
on
of
the
fam
ily
Sco
mb
rid
aeis
bas
edo
nm
orp
ho
log
ical
stu
die
s(C
oll
ette
etal
.2
00
1)
Su
bfa
mil
yan
dtr
ibe
Co
de
Lat
inn
ame
Co
mm
on
nam
eO
cean
icen
vir
on
men
tsG
eog
rap
hic
ald
istr
ibu
tio
n
Su
bfa
mil
yS
com
bri
nae
Tri
be
Th
un
nin
i(t
un
as)
AL
BT
hunn
usal
alun
gaa
Alb
aco
retu
na
Su
btr
op
ical
Co
smo
po
lita
n
YF
TT
hunn
usal
baca
resa
Yel
low
fin
tun
aT
rop
ical
Co
smo
po
lita
n
SB
FT
hunn
usm
acco
yiia
So
uth
ern
blu
efin
tun
aT
emp
erat
eS
ou
ther
nO
cean
s
BE
TT
hunn
usob
esus
aB
igey
etu
na
Su
btr
op
ical
Co
smo
po
lita
n
BF
TT
hunn
usth
ynnu
saA
tlan
tic
blu
efin
tun
aT
emp
erat
eA
tlan
tic
Oce
an
PB
FT
hunn
usor
ient
alis
aP
acifi
cb
luefi
ntu
na
Tem
per
ate
Pac
ific
Oce
an
SK
JK
atsu
won
uspe
lam
isa
Sk
ipja
cktu
na
Tro
pic
alC
osm
op
oli
tan
BL
FT
hunn
usat
lant
icus
Bla
ckfi
ntu
na
Tro
pic
alW
este
rnA
tlan
tic
Oce
an
LO
TT
hunn
usto
nggo
lL
on
gta
iltu
na
Tro
pic
alIn
dia
nO
cean
,In
do
-Pac
ific
reg
ion
,W
este
rnP
acifi
cO
cean
KA
WE
uthy
nnus
affin
isK
awak
awa
Tro
pic
alIn
dia
nO
cean
,In
do
-Pac
ific
reg
ion
LT
AE
uthy
nnus
alle
tter
atus
Lit
tle
tun
ny
Tro
pic
alA
tlan
tic
Oce
an,
incl
ud
ing
the
Med
iter
ran
ean
and
Bla
ckse
a
BK
JE
uthy
nnus
line
atus
Bla
cksk
ipja
ckT
rop
ical
Eas
tern
Pac
ific
Oce
an
BL
TA
uxis
roch
eiB
ull
ettu
na
Tro
pic
alC
osm
op
oli
tan
FR
IA
uxis
thaz
ard
Fri
gat
etu
na
Tro
pic
alC
osm
op
oli
tan
SL
TA
llot
hunn
usfa
llai
Sle
nd
ertu
na
Su
btr
op
ical
So
uth
ern
Oce
ans
Su
bfa
mil
yS
com
bri
nae
Tri
be
Sar
din
i(b
on
ito
s)
LE
BC
ybio
sard
ael
egan
sL
eap
ing
bo
nit
oT
rop
ical
Ind
o-P
acifi
cre
gio
n
DO
TG
ymno
sard
aun
icol
orD
og
too
thtu
na
Tro
pic
alIn
dia
nO
cean
,In
do
-Pac
ific
reg
ion
.D
isjo
int
dis
trib
uti
on
,fo
un
dp
rim
aril
yar
ou
nd
reef
s
BO
PO
rcyn
opsi
sun
icol
orP
lain
bo
nit
oS
ub
tro
pic
alE
aste
rnA
tlan
tic
Oce
anin
clu
din
gth
eM
edit
erra
nea
nS
ea
BA
USa
rda
aust
rali
sA
ust
rali
anb
on
ito
Su
btr
op
ical
Ind
ian
and
Pac
ific
Oce
ans
BE
PSa
rda
chil
iens
isE
aste
rnP
acifi
cb
on
ito
Su
btr
op
ical
Eas
tern
Pac
ific
Oce
an
BIP
Sard
aor
ient
alis
Ind
o-P
acifi
cb
on
ito
Su
btr
op
ical
Ind
ian
and
Pac
ific
Oce
ans
BO
NSa
rda
sard
aA
tlan
tic
bo
nit
oS
ub
tro
pic
alA
tlan
tic
Oce
anin
clu
din
gth
eM
edit
erra
nea
nS
ea
Rev Fish Biol Fisheries
123
Author's personal copy

Tab
le1
con
tin
ued
Su
bfa
mil
yan
dtr
ibe
Co
de
Lat
inn
ame
Co
mm
on
nam
eO
cean
icen
vir
on
men
tsG
eog
rap
hic
ald
istr
ibu
tio
n
Su
bfa
mil
yS
com
bri
nae
Tri
be
Sco
mb
ero
mo
rin
i(S
pan
ish
mac
ker
els)
WA
HA
cant
hocy
bium
sola
ndri
Wah
oo
Tro
pic
alC
osm
op
oli
tan
BR
SSc
ombe
rom
orus
bras
ilie
nsis
Ser
raS
pan
ish
mac
ker
elT
rop
ical
Wes
tern
Atl
anti
cO
cean
KG
MSc
ombe
rom
orus
cava
lla
Kin
gm
ack
erel
Tro
pic
alW
este
rnA
tlan
tic
Oce
an
CO
MSc
ombe
rom
orus
com
mer
son
Nar
row
-bar
red
kin
gm
ack
erel
Tro
pic
alIn
dia
nO
cean
and
Wes
tern
Pac
ific
Oce
an.
Rec
entl
yfo
un
din
the
Med
iter
ran
ean
Sea
alo
ng
the
no
rth
ern
Afr
ican
cou
ntr
ies
MO
SSc
ombe
rom
orus
conc
olor
Mo
nte
rey
Sp
anis
hm
ack
erel
Su
btr
op
ical
Eas
tern
cen
tral
Pac
ific
Oce
an.
Th
ecu
rren
td
istr
ibu
tio
nis
rest
rict
edto
the
up
per
two
-th
ird
so
fth
eG
ulf
of
Cal
ifo
rnia
GU
TSc
ombe
rom
orus
gutt
atus
Ind
o-P
acifi
ck
ing
mac
ker
elT
rop
ical
Ind
ian
Oce
anan
dW
este
rnP
acifi
cO
cean
KO
SSc
ombe
rom
orus
kore
anus
Ko
rean
seer
fish
Tro
pic
alIn
dia
nO
cean
and
Wes
tern
Pac
ific
Oce
an
ST
SSc
ombe
rom
orus
line
olat
usS
trea
ked
seer
fish
Tro
pic
alIn
dia
nO
cean
and
Ind
o-P
acifi
cre
gio
n
SS
MSc
ombe
rom
orus
mac
ulat
usA
tlan
tic
Sp
anis
hm
ack
erel
Su
btr
op
ical
Wes
tern
Atl
anti
cO
cean
PA
PSc
ombe
rom
orus
mul
tira
diat
usP
apu
anse
erfi
shT
rop
ical
Res
tric
ted
toth
eG
ulf
of
Pap
ua
and
the
Tim
or
Sea
inth
eIn
do
-Pac
ific
AS
MSc
ombe
rom
orus
mun
roi
Au
stra
lian
spo
tted
mac
ker
elT
rop
ical
Ind
o-P
acifi
cre
gio
nre
stri
cted
ton
ort
her
nA
ust
rali
aan
dP
apu
aN
ewG
uin
ea
NP
HSc
ombe
rom
orus
niph
oniu
sJa
pan
ese
Sp
anis
hm
ack
erel
Tem
per
ate
No
rth
wes
tP
acifi
c
KA
KSc
ombe
rom
orus
plur
ilin
eatu
sK
anad
ik
ing
fish
Su
btr
op
ical
Wes
tern
Ind
ian
Oce
anal
on
gth
eea
ster
nA
fric
anC
oas
t
QU
MSc
ombe
rom
orus
quee
nsla
ndic
usQ
uee
nsl
and
sch
oo
lm
ack
erel
Tro
pic
alIn
do
-Pac
ific
reg
ion
rest
rict
edto
no
rth
ern
Au
stra
lia
and
Pap
ua
New
Gu
inea
SC
ESc
ombe
rom
orus
rega
lis
Cer
oT
rop
ical
Wes
tern
Atl
anti
cO
cean
BB
MSc
ombe
rom
orus
sem
ifas
ciat
usB
road
-bar
red
kin
gm
ack
erel
Tro
pic
alIn
do
-Pac
ific
reg
ion
rest
rict
edto
no
rth
ern
Au
stra
lia
and
Pap
ua
New
Gu
inea
SIE
Scom
bero
mor
ussi
erra
Pac
ific
sier
raT
rop
ical
Eas
tern
Pac
ific
Oce
an
CH
YSc
ombe
rom
orus
sine
nsis
Ch
ines
ese
erfi
shS
ub
tro
pic
alW
este
rnP
acifi
cO
cean
Rev Fish Biol Fisheries
123
Author's personal copy

Tab
le1
con
tin
ued
Su
bfa
mil
yan
dtr
ibe
Co
de
Lat
inn
ame
Co
mm
on
nam
eO
cean
icen
vir
on
men
tsG
eog
rap
hic
ald
istr
ibu
tio
n
ST
RSc
ombe
rom
orus
trit
orW
est
Afr
ican
Sp
anis
hm
ack
erel
Tro
pic
alE
aste
rnA
tlan
tic
Oce
anin
clu
din
gth
eM
edit
erra
nea
nS
ea
SH
MG
ram
mat
orcy
nus
bica
rina
tus
Sh
ark
mac
ker
elS
ub
tro
pic
alIn
do
-Pac
ific
reg
ion
DB
MG
ram
mat
orcy
nus
bili
neat
usD
ou
ble
-lin
edm
ack
erel
Su
btr
op
ical
Ind
ian
Oce
anan
dIn
do
-Pac
ific
reg
ion
.It
isn
ot
clea
rif
the
dis
trib
uti
on
isco
nti
nu
ou
s,at
leas
tar
ou
nd
the
Ind
ian
Oce
an
Su
bfa
mil
yS
com
bri
nae
Tri
be
Sco
mb
rin
i(m
ack
erel
s)
RA
BR
astr
elli
ger
brac
hyso
ma
Sh
ort
mac
ker
elT
rop
ical
Ind
o-P
acifi
cre
gio
n
RA
FR
astr
elli
ger
faug
hni
Isla
nd
mac
ker
elT
rop
ical
Ind
o-P
acifi
cre
gio
n
RA
GR
astr
elli
ger
kana
gurt
aIn
dia
nm
ack
erel
Tro
pic
alIn
dia
nO
cean
and
Wes
tern
Pac
ific
Oce
an
MA
ASc
ombe
rau
stra
lasi
cus
Sp
ott
edch
ub
mac
ker
elS
ub
tro
pic
alIn
do
-Wes
tP
acifi
cre
gio
n
MA
SSc
ombe
rja
poni
cus
Ch
ub
mac
ker
elS
ub
tro
pic
alIn
dia
nan
dP
acifi
cO
cean
s
MA
CSc
ombe
rsc
ombr
usA
tlan
tic
mac
ker
elT
emp
erat
eN
ort
hA
tlan
tic
Oce
an
MA
SA
Scom
ber
coli
asA
tlan
tic
chu
bm
ack
erel
Su
btr
op
ical
Atl
anti
cO
cean
incl
ud
ing
the
Med
iter
ran
ean
Sea
Su
bfa
mil
yG
aste
roch
ism
atin
aeB
UK
Gas
tero
chis
ma
mel
ampu
sB
utt
erfl
yk
ing
fish
Su
btr
op
ical
So
uth
ern
Oce
ans
aC
om
mo
nly
kn
ow
nas
pri
nci
pal
mar
ket
tun
asp
ecie
s
Rev Fish Biol Fisheries
123
Author's personal copy

(Ruderal or R strategy). Although originally proposedfor plants, there is growing evidence that identical
three way trade-offs between resource acquisition,
maintenance and regeneration constraints adaptivestrategies exists in a wide phylogenetic range of
organisms as diverse as bacteria, fungi and animals
(Grime and Pierce 2012).One of the key lines of evidence for three primary
adaptive strategies in fishes comes from comparative
life history studies (Winemiller 1989; Winemiller andRose 1992; Vila-Gispert et al. 2002; King and
McFarlane 2003; Grime and Pierce 2012). Using life
history information from 216 North American marineand freshwater fishes Winemiller and Rose 1992
identified three primary life history strategies in fishes
arising from trade-offs between survival, fecundityand generation length. At one end, the Opportunistic
strategists, such as sardines, are small, short-lived
species with early maturation, intermediate fecundity,but high annual reproductive effort, which produce
small offspring. They argued that this combination of
traits maximizes the colonization ability of speciesacross environments with frequent and intense distur-
bances (similar to R-selected strategists in plants). The
Periodic strategists, such as rockfishes, are intermedi-ate to large sized, long-lived species with a late
maturation; short reproductive seasons and large
clutches of small eggs. This strategy is advantageousin variable but predictable environments because
producing a large number of offspring over long
period of time allows bet-hedging and success duringthe infrequent periods of conditions favoring success-
ful reproduction (similar to C-selected strategists in
plants). The Equilibrium strategists, such as spinydogfish, vary in body size (from small to large) and
have moderate to late age at maturation, small clutches
of large eggs, high juvenile survivorship and welldeveloped parental care, which are associated in
habitats with low environmental variation (similar to
S-selected strategists in plants). The scombrids appearto be intermediate strategists within the Opportunistic-
Periodic-Equilibrium life history triangle, but this wasbased on two species of scombrids, albacore tuna
Thunnus alalunga and chub mackerel Scomber japo-nicus (Winemiller and Rose 1992; King and McFar-lane 2003). While, three-way trade-offs explains
universal patterns of adaptive life history strategies
of fishes and all organisms across the tree of life, itmay not capture all of the detail. It is not expected that
all the life history traits of organisms to be associatedwith the axes of the CSR model of plants life histories
or Opportunistic-Periodic-Equilibrium model of fish
life histories. Many of the life history traits can varyindependently and influence the finer dimensions of
life history variation in species and populations
(Grime and Pierce 2012). In addition, not all taxo-nomic groups of fishes will have traits occupying the
full space of the Opportunistic-Periodic-Equilibrium
life history triangle since phylogenetic constrainsrestrict the range of adaptive strategies possible. For
example, chondrichthyan species with life histories
characterized by slow growth and high investment inthe survival of adults and young conform more closely
to the Equilibrium strategists (King and McFarlane
2003; Dulvy and Forrest 2009).A comparative life history study of ten Atlantic
scombrid and billfish species revealed one major
dominant life history axis shaped by the environment(Fromentin and Fonteneau 2001). Tropical species
such as yellowfin tuna Thunnus albacares and skip-
jack tuna Katsuwonus pelamis have short-mediumbody sizes, early age at maturity, fast growth and
extended spawning seasons whereas temperate spe-
cies, such as Atlantic bluefin tuna, had the opposite setof traits. Although in such study the life histories
of tropical tuna species were closely associated with
r-selected species and temperate tuna species wereclosely associated with K-selected species of the
r–k selection model, it was also acknowledged that the
r–k selection model was insufficient to explain the fullspectrum of life histories and population dynamics of
tunas and billfishes. The r–k theory predicts r-selected
species in variable environments while tropical tunasspend their whole life cycle in tropical warm waters
which are commonly perceived as more stable envi-
ronments than temperate waters (Fromentin andFonteneau 2001). In addition, the high fecundities
in bet-hedging strategies observed in tunas and
billfishes do not correspond to the expectations ofthe r–k selection theory either (Rochet et al. 2000;
Longhurst 2002). It is evident that the one-dimen-sional r–k theory is unable to explain the richness of
scombrid life history strategies. In addition, the small
number scombrid species included in previous com-parative analysis of life histories leaves unanswered
whether there is a single dominant life history strategy
within the Scombridae family or if instead there is awide range of variation in adaptive strategies.
Rev Fish Biol Fisheries
123
Author's personal copy

The main objective of this study is to characterizethe scombrid life history strategies. First, we compile
life history information (maximum size, growth,
longevity, maturity, fecundity and spawning durationand interval) for all scombrid species on a global scale.
Second, we examine the main patterns in the life
history traits across scombrid species and use multi-variate analyses to examine the co-variation among
traits and evaluate how many principal axes of trait
variation underlie scombrid life history strategies.Finally, we tested for sexual dimorphism in the
following life history traits: maximum size, longevity,
length of maturity and growth rates.
Methodology
Data collection, data sources and data
standardization
We assembled life-history data for the 51 species of
scombrids on a global scale from a wide range ofpublished literature including: scientific journals, grey
literature and theses published in English, Spanish,
French, Portuguese, Italian and any other languagethat provided an English summary. We reviewed and
included only the original studies; excluding review
articles. By reviewing only original information, weavoided propagating widely-used but poorly-sup-
ported or erroneous parameter estimates. From each
life history study, we extracted the trait estimatesreported for females, males, and both sexes combined
along with the sample sizes and the method used to
estimate each of the life history parameters. In our lifehistory analysis we preferentially used the female
estimates whenever the traits were reported separately
for sexes. We report length-based estimates as forklengths throughout. We transformed standard lengths
or total lengths into fork lengths using published
length conversion equations.
Life history traits
For each species we collected the following life
history parameters:Maximum length: We extracted the maximum
length (Lmax, cm) of the fish observed from each life
history study.
Growth: We extracted the three parameters (L?,k and to) of the von Bertalanffy growth function,
Lt = L? (1 - e-k(t-to)), from each growth study. Lt is
the length at age t in years. L? is asymptotic length incm—the mean size the individuals in the population
would reach if they were to grow indefinitely. The
growth coefficient k (year-1) expresses the rate atwhich the asymptotic length is approached and to is
defined as the hypothetical age in years that fish would
have at zero length. We compared the maximumobserved length (Lmax) and the theoretical maximum
length or asymptotic length estimates (L?) of species
to evaluate their interchangeability.Longevity or maximum age: We extracted the
maximum observed age (Tmax, years), here referred as
empirical longevity, from all growth studies where agewas estimated. Many growth studies did not report
longevity. Consequently, theoretical longevities (T?,
years) are commonly estimated using Taylor’s rela-tionship based on the von Bertalanffy growth rate
parameter k as T? = 3/k (Taylor 1958). The Taylor’s
longevity estimate is the age that a fish populationwould reach at L?. Therefore, we also extracted
theoretical longevities from the studies or we esti-
mated them using Taylor’s relationship. We comparedthe empirical (Tmax) and theoretical (T?) longevity
estimates to evaluate their interchangeability.
Length and age at maturity: We extracted both thelength (Lm, cm) and age (Tm, years) at first maturity
(the length and age at which maturity is first reached
by an individual in a sample) and length (Lm50, cm) andage (Tm50, years) at 50 % maturity (length and age at
which 50 % of the sampled individuals have matured)
from maturity studies. However, some studies onlyestimated length and age at first maturity. In the
majority of the studies, age at maturity was estimated
by converting length at maturity to age using a VonBertalanffy growth equation.
Batch fecundity, spawning season and spawning
interval: Scombrids batch spawn repeatedly over thespawning season. We collected information on absolute
batch fecundity (average number of oocytes in a batch),fecundity–length relationships (Fecundity = a 9
Lengthb) and relative batch fecundities (Frel, number
of oocytes per gram).We used the fecundity-lengthequation to estimate the absolute batch fecundity at the
length of 50 % maturity (FLm50) interpreted as the
number of oocytes of mature females at the length of50 % maturity in a single spawning. We also extracted
Rev Fish Biol Fisheries
123
Author's personal copy

the exponent of the fecundity–length relationship (orslope of the log–log fecundity-length regression), which
describes the increase of fecundity with size (Fslope).
Finally, we also collected information on the spawningintervals (Spwint, the average number of days between
spawning events in the population) and duration of the
spawning season (Spwseason, months).
Data screening and aggregation of data
at the species level
We screened our data set using established criteria to
remove poor estimates, errors, and outliers. We focusedmostly on the von Bertalanffy growth parameters since
they showed the largest variation among all the life
history parameters. We evaluated the reliability of thevon Bertalanffy growth curves of each of the species
using two criteria. First, we estimated the variability in
the ratio between the maximum observed length (Lmax)and asymptotic length (L?) for each study and across all
the studies and species pooled. We eliminated those
studies with ratios more than three standard deviationsaway from the mean ratio across all studies within each
species. Second, we examined the variability of the phi-
prime parameter (U0
= log10k ? 2 * log10L?) calcu-lated from each study across all studies and species
pooled, where k and L? are parameters of the von
Bertalanffy growth function. The U0values for a given
species or taxonomically related group of species should
be normally distributed around the mean U0
of the
taxonomic unit, and values further away from the meanof the distribution must be interpreted with increasing
caution (Pauly and Munro 1984). We standardized the
U0values of each study by dividing each by the mean of
U0
within each species. Second, we removed the
outlying growth equations in which the standardized
U0value was bigger than three standard deviations away
from the mean standardized U0
values across all the
studies and species. We arbitrarily choose a value of
three standard deviations away from the mean based onthe histograms of the ratios (all data pooled) which
highlighted those studies away from the pooled mean.The life history data set contains 662 articles (Appendix
1 in Electronic Supplementary Material) and is available
upon request from the corresponding author.In order to aggregate the life history parameters
from multiple studies at the species level we selected
data for analysis based on the following rules. (1) Wechose the maximum value for those traits at the
extreme of the life cycle (maximum length andempirical longevity). (2) We calculated a sample-size
weighted average for those reproductive traits within
the lifecycle (maturity, fecundity and spawning inter-val). (3) For the growth traits derived from model
estimates (growth coefficient, asymptotic length coef-
ficient and theoretical longevity), we calculated asimple arithmetic mean (giving equal weight to all the
studies), because these parameters are more difficult to
combine across studies due to the differing methodol-ogies used to estimate age and growth among studies.
For example, the precision and sample size of otoliths
measurements and length interval analyses are notcomparable. In our analysis we used the maximum
length ever observed across all the studies for each
species instead of their theoretical maximum lengths.While at the study level the theoretical maximum
lengths were significantly larger than the maximum
observed lengths of each study (Fig. S1a in ElectronicSupplementary Material), after aggregating the data
for each species, the species maximum observed
lengths were significantly larger than their averagedtheoretical maximum lengths (Fig. S1b). This is
expected given that the theoretical maximum length
is the mean size the individuals in a population wouldreach if they were to grow indefinitely. In addition, the
maximum observed lengths were available for the 51
species of scombrids while theoretical maximumlengths were available for 41 species. Moreover, the
relationship between empirical longevities (maximum
estimated age) and theoretical longevities (estimatedwith Taylor’s relationship) was more variable and
noisy. We found a high scatter between the empirical
longevities and theoretical longevities across all thestudies (Fig. S1c) and across all species (Fig. S1d) and
the relationships were increasingly noisier for species
with the lager longevities. This suggests that theoret-ical longevities are not a good proxy for empirical
longevities in scombrids particularly for longer-lived
species. Therefore, for our analysis, we used themaximum value of all empirical longevities across all
the studies for each species over the theoreticallongevities estimated with Taylor’s relationship. How-
ever, for those species with no empirical longevity
estimates, we used an average of the theoreticallongevities available. We recommend caution in the
use of these longevity estimates and on the interpre-
tations of longevities in our analysis. Empiricallongevities are dependent on the sample size of the
Rev Fish Biol Fisheries
123
Author's personal copy

studies and aging methods and theoretical longevitiesare weakly correlated with empirical longevities across
scombrid species (Fig. S1).
We used analysis of variance (ANOVA) to quantifythe relative magnitude of the variability between
species compared to the variability between studies
within species in each life history trait in order to assessthe implications of trait averaging across multiple
studies at the biological unit of species. We also
calculated the Relative Intraspecific Variation (RIC)ratio for each trait as the variance among studies within
species (intraspecific variation) divided by the total
variance (sum of the intraspecific and interspecificvariation) (Blanck and Lamouroux 2007). A small ratio
indicates that traits vary more among species and a big
ratio indicates that traits vary more among studies. Alllife history traits differed significantly among scombrid
species (Table S1 in Electronic Supplementary Mate-
rial). The relatively high interspecific variation (com-pared with intraspecific variation) in traits allows us to
estimate and use average species traits for our analysis
(Table S2 in Electronic Supplementary Material).
Analysis of life history patterns and sexual
dimorphism
We used Pearson’s correlations to examine the bivar-
iate relationships among all the life history traits acrossall 51 species of scombrids. We also performed a
principal component analysis (PCA) on the life history
data to explore patterns of linear relationships amongthe life history traits and identify the number of major
axes of life history variation. We interpreted the
principal components as major axes of life historyvariation. The PCA included ten life history traits
resulting in an ordination of seven scombrid species,
which had complete life history information, spanning awide range of values in their life history attributes. We
log-transformed (natural logarithm) all the life history
traits prior to the analysis, except the slope from thefecundity–length relationship which was already esti-
mated from log-transformed data. We performed all the
PCAs on the correlation matrix to standardize for theinfluence of unequal variances among life history traits.
We also tested for sexual dimorphism in the
following life history traits (maximum size, longevity,length of maturity and growth rate) within each
taxonomic group. We regressed the female life history
traits on the male life history traits using reducedmajor axis regression (Warton et al. 2006). The
regression slopes significantly different from one
indicates sexual dimorphisms in the traits.All data management, analysis and figures were
done using the R statistical software v.2.14.2 (R
Development Core Team 2010), including the Rpackages ‘‘ggplot2’’ (Wickham 2009), ‘‘smatr’’ (War-
ton et al. 2006) and ‘‘vegan’’ (Philip 2003).
Results
Bivariate and multivariate life history patterns
across scombrid species
The life history traits across the 51 species of
scombrids display a wide range of variation (Table 2
Table 2 Summary statistics for ten life history traits, with mean values, standard deviations (SD), sample sizes (n), minimum andmaximum values and coefficient of variation (CV)
Life history traits Mean SD n Min Max CV
Maximum length Lmax (cm) 125.7 73.9 51 30.9 372.0 58.8
Growth coefficient k (1/years) 0.5 0.4 41 0.1 2.3 85.1
Empirical longevity Tmax (years) 10.9 8.6 42 1.0 41.0 78.9
Length at 50 % maturity Lm50 (cm) 55.1 32.9 37 16.8 158.9 59.7
Age at 50 % maturity Tm50 (years) 2.4 1.6 31 0.7 9.9 65.4
Fecundity at maturity FLm50 (number of oocytesin thousands)
510.1 607.3 24 13.1 2250.6 119
Slope of fecundity–length relationship Fslope 4.3 1.5 17 2.4 7.8 34
Relative fecundity Frel (number of oocytes per gram) 182.7 203.0 18 41.5 825.2 111.1
Spawning interval Spwint (days) 5.3 7.1 16 1.1 30.0 132.8
Spawning duration Spwseason (months) 5.5 2.3 42 1.0 12.0 42.5
Rev Fish Biol Fisheries
123
Author's personal copy

and S2). Maximum observed length (Lmax) varies overone order of magnitude of length from 31 cm in the
island mackerel (Rastrelliger faughni) to 372 cm in
the Atlantic bluefin tuna. Body size strongly influencesmany demographic rates and biological processes
(Peters 1983), hence we also observe large variation in
all the growth and reproductive life history traitsacross the scombrid species (Table 2). Age and
growth related traits are highly correlated with max-imum body size, such that large scombrid species tend
to live longer and complete their growth at a lower rate
than species with smaller maximum sizes. Maximumbody size is positively correlated with longevity
(r = 0.68, Fig. 1a) and negatively correlated with
growth rate (r = -0.62, Fig. 1b). In addition, longer-lived species also tend to reach their maximum body
1
11
21
31
41
WAH
BLT
FRI
LTA
BOP
RAB
RAG
BONMAA
MASAMAS
MAC
BRS
KGM
COM
MOS
GUT
QUM
BBMSIE
ALB
YFT
SBF
BET
PBF
BFT
LOT
RAF
KOS
STS
SLT SKJ
ASMNPH KAK
BLFBIP
KAW
SSM
STRBKJ
BEP
30 80 130 180 230 280 330
Maximum length (cm)
Long
evity
(ye
ars)
0.1
0.4
0.7
1.0
1.3
1.6
1.9
2.2
WAH
BLT
FRI
LTA
SKJ
BOP
RAB
RAG
BEPMAA
MASA
MAS
BRS
KGM
COM
MOS
GUT
SSM
NPH
KAK
QUM
SIE ALB
YFT
BLF
SBF
BET
PBF
BFT
LOT
BKJ
RAF
BIP
KOS
STS
STR
KAW
ASM
BON
BBM
MAC
30 80 130 180 230 280 330
Maximum length (cm)
Gro
wth
coe
ffici
ent K
(1/
y)
0.1
0.4
0.7
1.0
1.3
1.6
1.9
2.2
WAH
BLT
FRI
KAW
LTA
SKJ
BOP
RAB
RAG
MASMAC
BRS
KGM
COM
MOS
GUT
ASM NPH
KAK
QUM
BBM
SIE ALB
YFT
BLF
SBF
BET
PBF
BFT
LOT
BKJ
RAF
BIP
KOS
STS
MAA
BEP
BONSTR
MASA
SSM
1 11 21 31 41
Longevity (years)
Gro
wth
coe
ffici
ent K
(1/
y)
20
40
60
80
100
120
140
WAH
BLT
FRI
LTA
SKJBOP
RAB
RAG
BON
MAA
MASA
MAS
MAC
BRS
KGM
COM
SSM
KAK
BBM
YFT
BLF
SBF
BET
PBF
BFT
LOT
BKJ
STS
SCE
STR
MOS
GUT
SIEQUM
KAW
ASM
BEP
30 70 110 150 190 230 270 310 350
Maximum length (cm)
Leng
th a
t mat
urity
(cm
)
a
c
b
d
Fig. 1 Bivariate relationships between various pairs of life history traits (a–k) and duration of spawning season by oceanicenvironment (l) for scombrid species. See Table 1 for the name of the species and Table 3 for the correlations among life history traits
Rev Fish Biol Fisheries
123
Author's personal copy
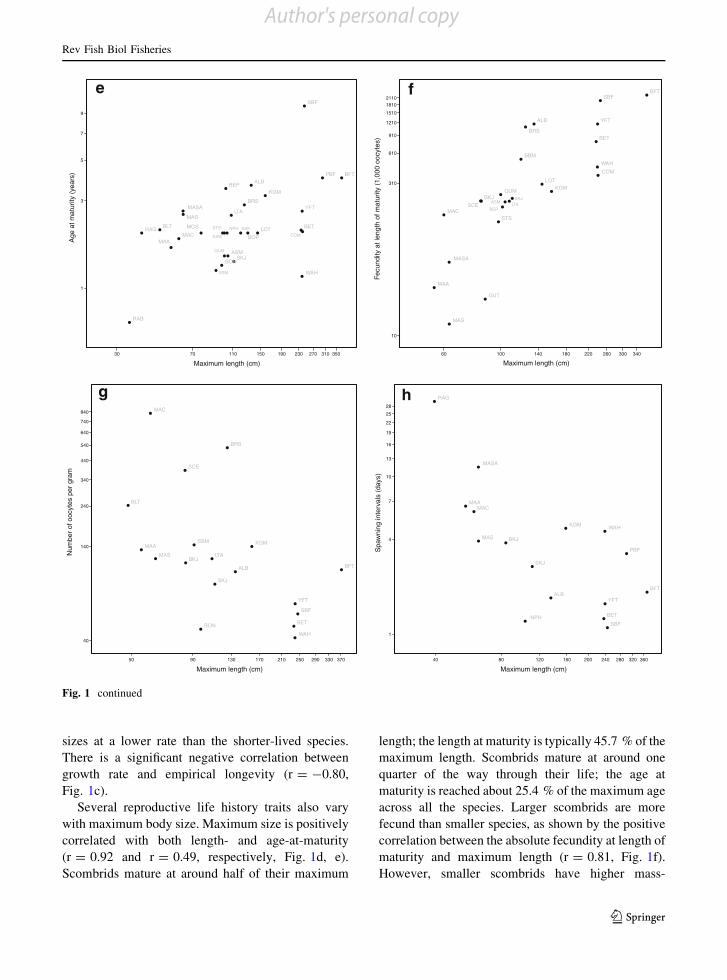
sizes at a lower rate than the shorter-lived species.There is a significant negative correlation between
growth rate and empirical longevity (r = -0.80,
Fig. 1c).Several reproductive life history traits also vary
with maximum body size. Maximum size is positively
correlated with both length- and age-at-maturity(r = 0.92 and r = 0.49, respectively, Fig. 1d, e).
Scombrids mature at around half of their maximum
length; the length at maturity is typically 45.7 % of themaximum length. Scombrids mature at around one
quarter of the way through their life; the age at
maturity is reached about 25.4 % of the maximum ageacross all the species. Larger scombrids are more
fecund than smaller species, as shown by the positive
correlation between the absolute fecundity at length ofmaturity and maximum length (r = 0.81, Fig. 1f).
However, smaller scombrids have higher mass-
1
3
5
7
9
WAH
BLT
LTA
SKJ
RAB
RAG
BEP
BON
MASA
MAC
BRS
KGM
ASM
ALB
YFT
SBF
BET
PBF BFT
LOTKAW COM
STS KAK NPH
SSM
QUM
MAS
MOS
MAABOP
30 70 110 150 190 230 270 310 350
Maximum length (cm)
Age
at m
atur
ity (
year
s)
10
310
610
910
1210
1510
18102110
WAH
MAA
MASA
MAS
MAC
KGM
COM
GUT
QUM
BBM
ALB YFT
SBF
BET
BFT
LOT
BKJ
STS
BEP
ASMSKJ
LTA
BRS
SCE
60 100 140 180 220 260 300 340
Maximum length (cm)
Fecu
ndity
at l
engt
h of
mat
urity
(1,
000
oocy
tes)
40
140
240
340
440
540
640
740
840
WAH
BLT
LTA
SKJ
BON
MAA
MAS
MAC
BRS
KGMSSM
ALB
YFT
SBF
BET
BFTBKJ
SCE
50 90 130 170 210 250 290 330 370
Maximum length (cm)
Num
ber
of o
ocyt
es p
er g
ram
1
4
7
10
13
16
19
22
25
28
WAH
SKJ
RAG
MAA
MASA
MAS
MAC
KGM
NPH
ALBYFT
SBF
BET
PBF
BFT
BKJ
40 80 120 160 200 240 280 320 360
Maximum length (cm)
Spa
wni
ng in
terv
als
(day
s)
e
g
f
h
Fig. 1 continued
Rev Fish Biol Fisheries
123
Author's personal copy
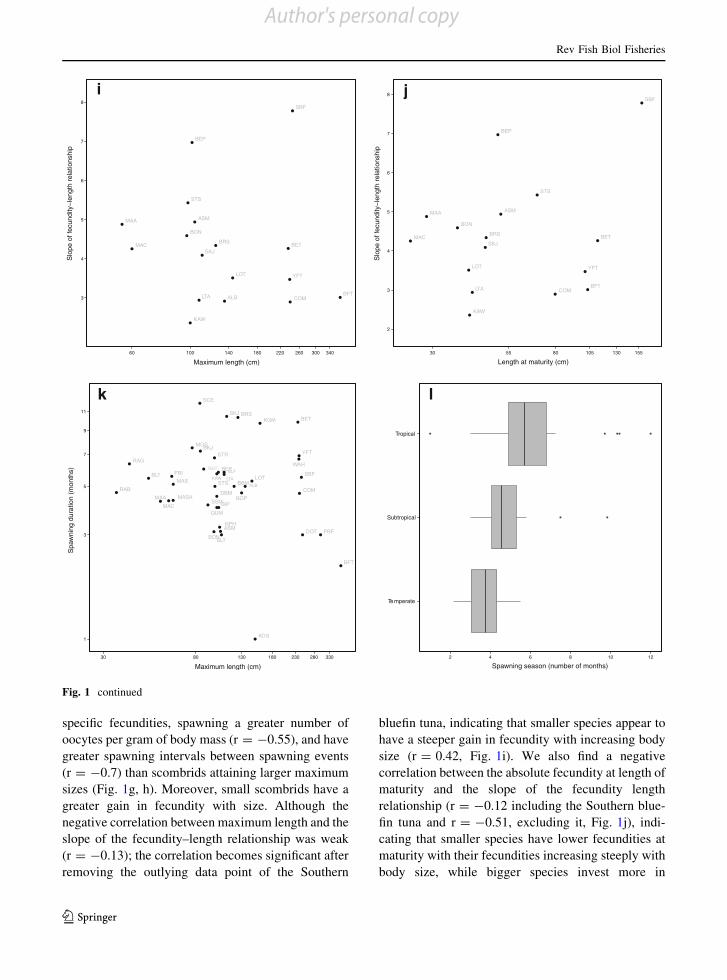
specific fecundities, spawning a greater number ofoocytes per gram of body mass (r = -0.55), and have
greater spawning intervals between spawning events
(r = -0.7) than scombrids attaining larger maximumsizes (Fig. 1g, h). Moreover, small scombrids have a
greater gain in fecundity with size. Although the
negative correlation between maximum length and theslope of the fecundity–length relationship was weak
(r = -0.13); the correlation becomes significant after
removing the outlying data point of the Southern
bluefin tuna, indicating that smaller species appear tohave a steeper gain in fecundity with increasing body
size (r = 0.42, Fig. 1i). We also find a negative
correlation between the absolute fecundity at length ofmaturity and the slope of the fecundity length
relationship (r = -0.12 including the Southern blue-
fin tuna and r = -0.51, excluding it, Fig. 1j), indi-cating that smaller species have lower fecundities at
maturity with their fecundities increasing steeply with
body size, while bigger species invest more in
3
4
5
6
7
8
KAW
LTA
SKJ
BEP
BON
MAA
MACBRS
COM
ASM
ALB
YFT
SBF
BET
BFT
LOT
STS
60 100 140 180 220 260 300 340
Maximum length (cm)
Slo
pe o
f fec
undi
ty−l
engt
h re
latio
nshi
p
2
3
4
5
6
7
8
KAW
LTA
SKJ
BEP
BON
MAA
MACBRS
COM
ASM
YFT
SBF
BET
BFT
LOT
STS
30 55 80 105 130 155
Length at maturity (cm)
Slo
pe o
f fec
undi
ty−l
engt
h re
latio
nshi
p
1
3
5
7
9
11
BLT FRI
SKJ
RAB
RAG
BEP
MASA
MAS
BRSKGM
COM
MOS
SSM
ASM NPH
BBM
YFT
SBF
BET
PBF
BFT
LOT
BKJ
DBM
DOT
BIP
KOS
STS
SCE
STR
MAA
MAC
KAW LTA
BLF
BONSLT
ALB
GUTWAH
BOP
QUM
30 80 130 180 230 280 330
Maximum length (cm)
Spa
wni
ng d
urat
ion
(mon
ths)
Temperate
Subtropical
Tropical
2 4 6 8 10 12
Spawning season (number of months)
i
k
j
l
Fig. 1 continued
Rev Fish Biol Fisheries
123
Author's personal copy

fecundity at maturity but their fecundities increase less
steeply with body size. Finally, the duration of thespawning season is the only reproductive trait that is
not correlated with maximum body size or any other
life history trait (Fig. 1k and Table 3). Instead, thespawning duration seems to be associated with the
type of environment species inhabit. Although there
are some exceptions, generally tropical species havelonger spawning seasons (an average of 6 months),
than their subtropical (5 months) and temperate
(4 months) relatives (Fig. 1l). Additional correlationsbetween life history traits are presented in Table 3.
The principal component analysis (PCA) of all 10
life history traits for seven scombrid species resultedin a first component with endpoints contrasting species
with large body size, long-lived, late maturing, slow
growing, having high absolute fecundities at length ofmaturity and small spawning intervals between
spawning events against those species with the
opposite suite of traits (Table 4, Fig. 2a). The firstcomponent explained 59 % of the variance, and
consisted mainly of size-related traits. The second
PCA component ordinated species along a slow-fastcontinuum of time-related life history traits. This axis
separated longer-lived, slow growing species with
shorter spawning seasons, also having higher relativefecundities, and spawning higher number of oocytes
per gram from species with the opposite suite of traits.
This second component explained 23 % of the vari-ance. The ordination of species along the two main
gradients of variation revealed two pairs groups of
species with distinct life history strategies (large sizeversus small size) separated by environment (slow life
histories in temperate waters versus fast life histories
in tropical waters):
(1a) Large, slow temperate. Larger-size, longer-
lived, and slower growing Atlantic bluefin andSouthern bluefin tunas.
(1b) Large, fast tropical. Larger-size but shorter-
lived, and faster growing bigeye tuna Thunnusobesus and yellowfin tuna.
Table 3 Pearson’s correlations matrix of life history traits of scombrid species with p values (lower diagonal) and sample sizes(upper diagonal)
Life history traits Lmax Lm50 Tm50 FLm50 Fslope Frel Spwint Spwseason k Tmax
Maximum lengthLmax (cm)
37 31 24 17 18 16 42 42 41
Length at 50 % maturityLm50 (cm)
0.92*** 29 23 16 17 14 35 36 36
Age at 50 % maturityTm50 (years)
0.49** 0.59*** 20 17 16 15 30 31 31
Fecundity at maturityFLm50 (# of oocytesin ‘000)
0.81*** 0.77*** 0.43 15 15 13 24 23 23
Slope of fecundity–length relationship(Fslope)
-0.13 0.23 0.4 -0.12 11 8 17 17 17
Relative fecundityFrel (# of oocytesper gram)
-0.55* -0.6* -0.01 -0.23 -0.14 12 18 17 17
Spawning intervalSpwint (days)
-0.7** -0.8*** -0.38 -0.78** -0.14 0.58* 16 16 16
Spawning seasonSpwseason (months)
-0.18 -0.14 -0.12 0.07 -0.18 -0.16 0.15 39 38
Growth coefficientk (1/years)
0.68*** 0.62*** 0.7*** 0.46* 0.07 -0.09 -0.38 0.01 41
Longevity Tmax & Tinf
(years)-0.62*** -0.55*** -0.67*** -0.55** -0.07 -0.05 0.57* 0.07 -0.8***
Correlations are based on all available data for scombrid species
*** p \ 0.001; ** p \ 0.01; * p \ 0.05
Rev Fish Biol Fisheries
123
Author's personal copy

(2a) Small, slow temperate. Smaller-size, longer-
lived, and slow-growing Atlantic mackerel
Scomber scombrus and spotted chub mackerelS. australasicus.
(2b) Small, fast tropical. Smaller-size but shorter-
lived, and fast-growing skipjack tuna.
The third component explained 13 % of the total
variance and captured trade-offs in reproductive allocationand correlated positively with the slope of the fecundity–
length relationship, andnegativelywith maximumsizeand
the absolute fecundity at length of maturity (Table 4,Fig. 2b). The third component mainly distinguished
species with high fecundity at maturity but with a slow
increase of fecundity with body size from species with lowfecundity at the length of maturity with a steeper increase
of fecundity with body size. The second and third
component together ordinated the species along a slow-fast continuum and at the same time separated the Atlantic
bluefin tuna with a slow increase of fecundity with size,
from the Southern bluefin and yellowfin tunas, whichappear to have a steeper increase in fecundity with size.
Table 4 PCA statistics forseven scombrid speciesbased on ten life historytraits
Life history traits PC1 PC2 PC3
Maximum length Lmax (cm) -0.38 0.13 -0.30
Growth coefficient k (1/years) 0.32 0.37 0.12
Empirical longevity Tmax (years) -0.32 -0.39 0.11
Length at 50 % maturity Lm50 (cm) -0.40 0.18 -0.02
Age at 50 % maturity Tm50 (years) -0.36 -0.20 0.29
Fecundity at maturity FLm50 (# of oocytes in ‘000) -0.38 0.06 -0.21
Slope of fecundity–length relationship (Fslope) -0.13 -0.08 0.82
Relative fecundity Frel (# of oocytes per gram) 0.25 -0.44 -0.05
Spawning interval Spwint (days) 0.37 -0.28 0.02
Spawning duration Spwseason (months) 0.06 0.58 0.28
% Variance explained 59 23 13
Axis 1
Axi
s 2
−2
−1
0
1
2
−3 −2 −1 0 1 2 3
Katsuwonuspelamis
Scomberaustralasicus
Scomberscombrus
Thunnusalbacares
Thunnusmaccoyii
Thunnusobesus
Thunnusthynnus
Maximum size
Longevity
Length at maturity
Fecundity at maturity
Number of eggs per gram
Age at maturity
Growth rate
Spwaning interval
Spawning duration
Slope F−L
a
Axis 2
Axi
s 3
−2
−1
0
1
2
−2 −1 0 1 2
Katsuwonuspelamis
Scomberaustralasicus
Scomberscombrus
Thunnusalbacares
Thunnusmaccoyii
Thunnusobesus
Thunnusthynnus
Maximum size
Longevity
Length at maturity
Fecundity at maturity
Number of eggsper gram
Ageat maturity
Growth rate
Spwaning interval
Spawningduration
Slope F−L
b
Fig. 2 Principal component analysis (PCA) results of 10 life history traits and 7 species of scombrids including the species scores andvector plots of the trait scores. See Table 4 for the factor loadings of the PCA
Rev Fish Biol Fisheries
123
Author's personal copy

Together the first three axes combined explained 95 % ofthe total variation in the data.
Here we extend and generalize the first two dimensions
of tuna life histories revealed by the PCA upon the sevenscombrid species which had complete life history infor-
mation. We placed the life history variation of forty-two
species of scombrids along the first two major axis ofvariation, ranking species both along a small-large
continuum and along a slow-fast continuum (Fig. 3). We
size-corrected the time-related traits of longevity andgrowth by calculating the residuals from linear regressions
of each life history trait on maximum length. While we
observe a positive relationship between the maximumlengths and longevities of the species reflecting that larger
species appear to be longer-lived, we also observed that for
any given maximum body size of the species there is awide range of longevities (Fig. 3a). For example, for
species with maximum lengths larger than 2 meters, the
tropical yellowfin tuna has a maximum length of 239 cmand can live up to 8 years, compared to the similar-sized
temperateSouthernbluefin tunawith amaximumlength of
245 cm can live up to 41 years. For the smallest scombridspecies with maximum lengths smaller than a meter,
tropical frigate tuna Auxis thazard (62 cm) has a longevity
of 4 years while temperate Atlantic mackerel (60 cm) hasa longevity of 15 years. Finally, for species with interme-
diate body sizes, we also find a wide range of longevities
for a given body size, for example Korean seerfishScomberomorus koreanus (maximum length of 150 cm)
has a longevity of 4.9 year and narrow-barred Spanish
mackerel Scomberomorus commerson (240 cm) has alongevity of 31 years. However, all the medium size
species in this case inhabited the tropical or the subtropical
oceans. Using the size-corrected traits of growth andlongevity we ranked the species according to their speed of
life (irrespective of their body sizes) (Fig. 3b). Temperate
species tended to have the slowest life histories whiletropical and subtropical species spread along most of the
slow-fast continuum of life histories. We find that the
tropical island mackerel and yellowfin tuna have the fastestlife histories while temperate Atlantic mackerel and
Southern bluefin tuna have the slowest life histories amongall the scombrid species.
Sexual dimorphisms in life history traitsin scombrid species
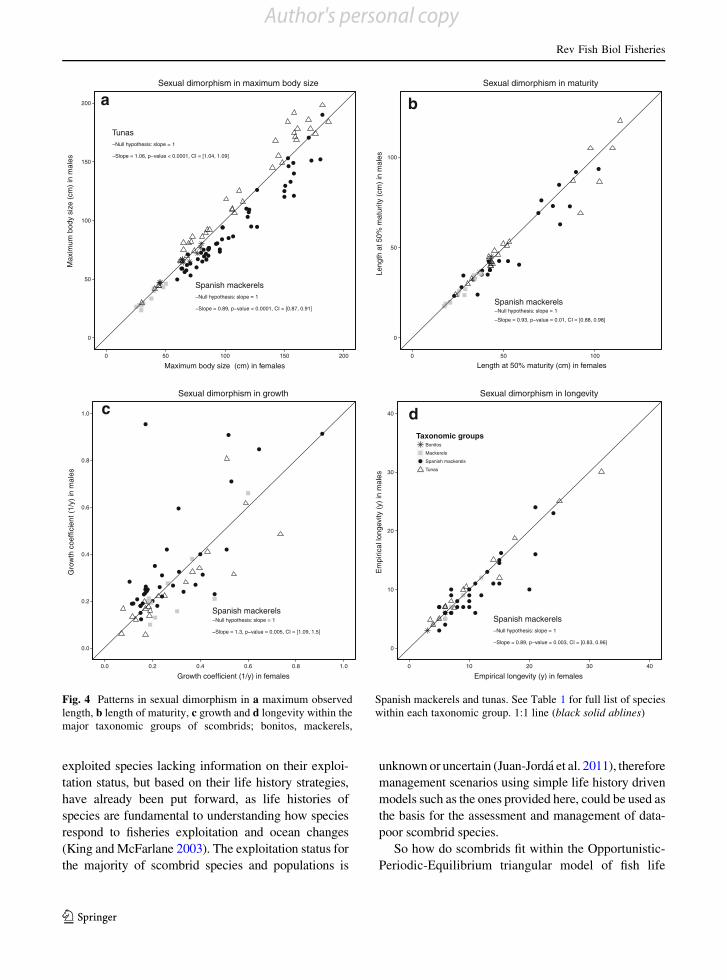
The patterns of sexual dimorphism differed amongtaxonomic groups. In Spanish mackerels, the females
attain larger body sizes and mature at a larger body sizethan males, and also appear to live longer (Fig. 4a,b
and d). Females grow at a slower rate than males
(Fig. 4c). In contrast, tunas only showed significantsexual dimorphism in maximum size with males
reaching larger maximum sizes than females (Fig. 4a)
and there was no significant evidence for sex differ-ences in size of maturity, growth or longevity
(Fig. 4b–d). Mackerels did not show sexual dimor-
phisms in any life history trait and there was not enoughdata to explore sexual dimorphisms in the bonito species.
Discussion
Patterns of covariation among life history traits ofscombrids revealed that most of the variation in the
traits can be explained along three gradients: size,
speed and reproductive schedule. We first explorethese three dimensions further, then suggest the
implications of such a narrowly bounded range of life
histories for fisheries assessment and management,finally placing the scombrids within the larger envelop
of fish life histories. Last we discuss what factors are
likely to shape sexual differences in the life historytraits of scombrid species.
The first gradient of variation is mostly influenced
by maximum size and highlights that all traits, exceptspawning duration, are correlated with size. Size
governs the first gradient of life history variation in
scombrids primarily ranking species along a small-large continuum as it is commonly viewed as a
fundamental determinant of and constraint upon spe-
cies life history evolution (Sibly and Brown 2007).Current views explaining the variations in body size
suggest that competition and predation are the driving
forces of adaptation leading to the evolution of speciesto attain optimum sizes to fill specific niches in nature
(Brown and Sibly 2006). The second gradient of life
history variation is mostly influenced by time-relatedtraits (longevity, age at maturity, growth rates, spawn-
ing duration, time between spawning events) andhighlights the trade-off between longevity and growth,
ranking species from the slowest to the fastest life
histories (irrespective of their body size) and ordinat-ing them along the slow-fast continuum of life
histories. This pattern is consistent with the discovery
of the importance of a similar slow-fast continuum in
Rev Fish Biol Fisheries
123
Author's personal copy

Rev Fish Biol Fisheries
123
Author's personal copy

mammals, birds, and reptiles (Gaillard et al. 1989;Saether et al. 2002; Bielby et al. 2007).
Scombrid species with the slowest life histories
tend to inhabit more temperate environments and thesespecies were characterized by having relatively longer
life spans, slower growth rates, short spawning
seasons and produce several batches of large numberof eggs per gram with a lower frequency (large
intervals between spawning events). While scombrid
species with faster life histories are typically found inmore tropical environments, and their life histories
were characterized by shorter life spans, faster growth
rates, long spawning season where species spawnmultiple batches of small number of eggs per gram at a
higher frequency (small time intervals between
spawning events). Current knowledge suggests thatvariations in the speed of life of species along the
slow-fast continuum are adaptations to temperature-
driven extrinsic rates of mortality imposed by theenvironment (Promislow and Harvey 1990; Brown
et al. 2004; Dobson 2007). Individuals experiencing
high mortality rates due to the metabolic forcing athigh temperatures evolve fast life histories in order to
reproduce before dying, shifting the whole life cycle
towards a faster end of the continuum. While speciesfacing low mortality rates and reaching longer life
expectancies have larger sizes at maturity, and invest
more heavily in reproduction after maturing, thusshifting their whole life cycle towards the slow end of
the continuum.
The third gradient found in scombrid life historieshighlights the negative correlation between number of
eggs produced at length of maturity and the slope of
the fecundity–length relationship. Although the thirdgradient of variation identified in our analysis was
weak in part because there were only seven species of
scombrids with full reproductive and fecundity lifehistory information, we also observed a negative
correlation between fecundity at length of maturity
and the rate at which fecundity increases with sizeacross a larger number scombrid species which hints
that the pattern may be more general (Fig. 1j). Thispattern has been interpreted in fishes as a gradient
describing a schedule of reproductive effort reflectingthe fundamental trade-off between reproduction and
somatic growth (Rochet et al. 2000). Small scombrid
species such as spotted chub mackerel and Atlanticmackerel first allocate more energy to growth and as
soon as they mature, spawn fewer eggs (due to their
small body cavity size) but then increase theirfecundity steeply with size, investing more energy
into reproduction, thus having less resources for
growth at their disposal (Charnov 2008). In contrast,larger scombrid species such as Atlantic bluefin tuna
and yellowfin tuna initially invest relatively more in
fecundity at maturity, but their fecundity increases lesssteeply with size leaving more resources for somatic
growth. As an aside we note that the steep rate of
increase of fecundity with size observed in Southernbluefin tuna does not follow the general pattern across
scombrid species. We wonder whether the steep rate of
increase in fecundity with size in Southern bluefin tunais a response of the species to the high rates of fishing
mortality experienced during the last half century
(CCSBT 2009). Other studies have reported anincrease in fecundity at maturity and higher rates of
increase of fecundity with size in species with high
rates of fishing exploitation. Increasing fishing pres-sure results in an increase in the reproductive invest-
ment of species during their individual lifetime
(Rochet et al. 2000). Although a gradient of slowand fast life histories, after accounting for the effect of
size, has been observed in previous comparative
studies of life histories, and is well supported in fishesas well other vertebrate groups such as birds, reptiles
and mammals (Gaillard et al. 1989; Saether et al.
2002; Bielby et al. 2007) a further third axis of lifehistory variation is less well supported and its
interpretation varies among groups (Rochet et al.
2000; Dobson 2007).By ranking the forty-two species of scombrids along
a small-large continuum and a slow-fast continuum, we
could identify what species have similar and dissimilarlife history strategies. Although we acknowledge that
the life history strategies of species vary along acontinuum, we highlight the importance of identifying
similarities among species and identify groups of
species with similar life histories since life historygroupings can be used as the basis to construct a
conceptual framework of management options for data-
poor species (King and McFarlane 2003). Conceptualmanagement frameworks to provide advice for those
Fig. 3 Life history variation of forty-two species of scombridsalong the small-large continuum and along the slow-fastcontinuum. a Relationship between maximum length andlongevity across scombrid species. b Relationship betweensize-corrected longevity and size-corrected growth rate acrossscombrid species. Regression line (black solid line)
b
Rev Fish Biol Fisheries
123
Author's personal copy
exploited species lacking information on their exploi-tation status, but based on their life history strategies,
have already been put forward, as life histories of
species are fundamental to understanding how speciesrespond to fisheries exploitation and ocean changes
(King and McFarlane 2003). The exploitation status for
the majority of scombrid species and populations is
unknown or uncertain (Juan-Jorda et al. 2011), thereforemanagement scenarios using simple life history driven
models such as the ones provided here, could be used as
the basis for the assessment and management of data-poor scombrid species.
So how do scombrids fit within the Opportunistic-
Periodic-Equilibrium triangular model of fish life
0
50
100
150
200
Tunas−Null hypothesis: slope = 1
−Slope = 1.06, p−value < 0.0001, CI = [1.04, 1.09]
Spanish mackerels−Null hypothesis: slope = 1
−Slope = 0.89, p−value < 0.0001, CI = [0.87, 0.91]
0 50 100 150 200
Maximum body size (cm) in females
Max
imum
bod
y si
ze (
cm)
in m
ales
Sexual dimorphism in maximum body size
0
50
100
Spanish mackerels−Null hypothesis: slope = 1
−Slope = 0.93, p−value = 0.01, CI = [0.88, 0.98]
0 50 100
Length at 50% maturity (cm) in females
Leng
th a
t 50%
mat
urity
(cm
) in
mal
es
Sexual dimorphism in maturity
0.0
0.2
0.4
0.6
0.8
1.0
Spanish mackerels−Null hypothesis: slope = 1
−Slope = 1.3, p−value = 0.005, CI = [1.09, 1.5]
0.0 0.2 0.4 0.6 0.8 1.0
Growth coefficient (1/y) in females
Gro
wth
coe
ffici
ent (
1/y)
in m
ales
Sexual dimorphism in growth
0
10
20
30
40
Spanish mackerels−Null hypothesis: slope = 1
−Slope = 0.89, p−value = 0.003, CI = [0.83, 0.96]
0 10 20 30 40
Empirical longevity (y) in females
Em
piric
al lo
ngev
ity (
y) in
mal
es
Taxonomic groupsBonitos
Mackerels
Spanish mackerels
Tunas
Sexual dimorphism in longevity
a
c
b
d
Fig. 4 Patterns in sexual dimorphism in a maximum observedlength, b length of maturity, c growth and d longevity within themajor taxonomic groups of scombrids; bonitos, mackerels,
Spanish mackerels and tunas. See Table 1 for full list of specieswithin each taxonomic group. 1:1 line (black solid ablines)
Rev Fish Biol Fisheries
123
Author's personal copy

histories? Earlier comparative analysis of a broadrange of fish life histories examined only two scom-
brid species (chub mackerel and albacore tuna) and
classified them as intermediate within the triangularmodel of life histories (Winemiller and Rose 1992;
King and McFarlane 2003). As we have shown here,
scombrid fishes have a wide range of life historyattributes exhibiting variation in longevities, growth
rates, maturity and fecundity schedules, sizes and
habitat preferences, but lacking investment in thesurvival of young. Along the small-large and slow-fast
gradients of life history variation in scombrids iden-
tified in this study, we can discern a continuum of lifehistory patterns, and the strategies at the two extremes
typify the Opportunistic and Periodic strategists
identified by Winemiller (1989) and Winemiller andRose (1992). On one extreme, the three bluefin tuna
species (Thunnus thynnus, T. maccoyii and T. orien-talis) which are the largest (245–372 cm) and longest-lived (26–41 years) species of scombrids and are
characterized by slow growth rates (0.11–0.15 years-1),
late maturation (103–159 cm and 4–9 years), highfecundities (average batch fecundities of two million
eggs at length of maturity) and short spawning seasons
(2–5 months) correspond well with the Periodic fishstrategists (Winemiller and Rose 1992; King and
McFarlane 2003). On the other extreme, three mack-
erels species (Rastrelliger brachysoma, R. faughni andR. kanagurta) which are the smallest (31–39 cm) and
shortest-lived (1–4 years) species of scombrids and are
characterized by early maturation (17–20 cm and0.6–2 years), fast growth (1.3–2.9 years-1), presum-
ably lower average batch fecundities at maturity (no
data available) and extended spawning seasons(5–6 months), correspond well to fish species with
Opportunistic strategists (Winemiller and Rose 1992;
King and McFarlane 2003).Therefore, in this study we show that the life
histories of scombrid species displayed a broad range
of intermediate strategies along the gradient betweenthe Opportunistic and Periodic strategists, with trop-
ical mackerel species being the best example in thegroup of an Opportunistic strategist, and temperate
bluefin tuna species providing good examples of
Periodic strategists. Temperate tuna species spentmost of their annual cycle in colder higher latitudes
and perform large-scale migrations to exploit the
relatively predictable seasonal environmental cyclesto reproduce in very specific time and well-defined
warmer habitats during spring time (Block et al. 2003).Migrating to favorable habitats to reproduce within a
small environmental window is a strategy favorable
for growth and survival of larvae that reduces uncer-tainty and minimize large scale temporal and spatial
environmental variability, a common strategy among
many Periodic strategist (Winemiller and Rose 1992).It has also been observed that long-lived marine
teleosts, which are typically temperate or deep-water
species, tend to have larger recruitment variability, anindicator of poor years in recruitment success, than
shorter-lived species which are typically tropical
species (Longhurst 2002). At first glance, the highrecruitment variability generally observed in temper-
ate scombrids species would not correspond very well
with the typical environment characteristic in Periodicstrategies (predictable large scale temporal and spatial
environmental variation). However, it has been
hypothesized that longevity, a characteristic of Peri-odic strategists, is crucial factor to sustain a safe level
of successful recruitment over the long term when
autocorrelated environmental variability across aseries of years might produce poor recruitment
(Murphy 1968; Longhurst 2002). Tropical mackerels
and tunas with life history characteristics more typicalof Opportunistic strategists appear to have adopted the
strategy of maturing earlier, spawning more frequently
and expanding their spawning seasons which provide alarger number of reproductive opportunities to max-
imize the probability of successful recruitment within
the relatively low seasonality of many low latitudeoceanographic regions (Longhurst and Pauly 1987;
Winemiller and Rose 1992). Therefore the life history
variation observed in scombrids corroborates thetriangular model of fish life histories proposed by
Winemiller and Rose (1992) as this model explains
well the life history variation observed in scombrids.The life history patterns and strategies described in
this study were mostly based on female life history
traits that we preferentially used over male traits.However, we also showed that sexual dimorphism in
some life history traits exist in the tunas and Spanishmackerels, but not in the mackerels. Past studies have
also reported significant sexual dimorphisms in size,
weight, growth and longevity in several species ofSpanish mackerels (McPherson 1992; Claereboudt
et al. 2005; McIlwain et al. 2005). It has been
hypothesized that the observed sexual dimorphismsin size and growth in Spanish mackerels could be
Rev Fish Biol Fisheries
123
Author's personal copy

related to the different amount of investment ingametogenesis by the two sexes (McIlwain et al.
2005). Sexual dimorphism in size has also been
reported in many species of tunas, while dimorphismin growth has only been reported in temperate tuna
species such as Atlantic bluefin tuna and Southern
bluefin tuna and appears to be non-existent in tropicaltuna species of bigeye and yellowfin (Schaefer 2001;
Gunn et al. 2008). It has been suggested that higher
natural mortality rates in females than in males couldexplain the predominance of males within the larger
size classes of tunas rather than sex differences in
growth or vulnerability to capture (Schaefer 1998).
Acknowledgments We gratefully acknowledge theconstructive comments and suggestions from the Earth to OceanResearch Group, particularly Jennifer Sunday and SebastianPardo, on earlier versions of this manuscript. We are also gratefulto two anonymous reviewers for their constructive comments andsuggestions. MJJJ was supported in part by EU Marie Curie EarlyStage Research Training project METAOCEANS, MEST-CT-2005-019678 and a Maria Barbeito Scholarship from Xunta deGalicia, Spain. NKD was supported by the Natural EnvironmentResearch Council of Canada.
References
Beverton RJH (1992) Patterns of reproductive strategy param-eters in some marine teleost fishes. J Fish Biol 41:137–160
Beverton RJH, Holt SJ (1959) A review of the lifespans andmortality rates of fish in nature and the relation to growthand other physiological characteristics. In: WolstenholmeGEW, O’Connor M (eds) Ciba Foundation Symposium—The Lifespan of Animals (Colloquia on Ageing), vol 5. J. &A. Churchill Ltd, London, pp 142–180
Bielby J, Mace G, Bininda-Emonds O, Cardillo M, Gittleman J,Jones K, Orme C, Purvis A (2007) The fast-slow contin-uum in mammalian life history: an empirical reevaluation.Am Nat 169(6):748–757
Blanck A, Lamouroux N (2007) Large-scale intraspecific vari-ation in life-history traits of European freshwater fish.J Biogeogr 34:862–875
Block BA, Finnerty JR (1994) Endothermy in fishes: a phylo-genetic analysis of constraints, predispositions, and selec-tion pressures. Environ Biol Fishes 40:283–302
Block BA, Teo SLH, Walli A, Boustany A, Stokesbury MJW,Farwell CJ, Weng KC, Dewar H, Williams TD (2003)Electronic tagging and population structure of Atlanticbluefin tuna. Nature 2795:109–112
Boyce D, Tittensor D, Worm B (2008) Effects of temperature onglobal patterns of tuna and billfish richness. Mar Ecol ProgSer 355:267–276
Brown JH, Sibly RM (2006) Life-history evolution under aproduction constraint. Proc Natl Acad Sci USA103:17595–17599
Brown JH, Gillooly JF, Allen AP, Savage VM, West GB (2004)Toward a metabolic theory of ecology. Ecology85(7):1771–1789
CCSBT (2009) Report of the Fourteenth Meeting of theScientific Committee, Busan, 5–11 September 2009,CCSBT
Charnov EL (2008) Fish growth: bertalanffy k is proportional toreproductive effort. Environ Biol Fishes 83:185–187
Claereboudt MR, McIlwain JL, Al-Oufi HS, Ambu-Ali AA(2005) Patterns of reproduction and spawning of thekingfish (Scomberomorus commerson, Lacepede) in thecoastal waters of the Sultanate of Oman. Fish Res73:273–282
Claudet J, Osenberg CW, Domenici P, Badalamenti F, MilazzoM, Falcon JM, Bertocci I, Benedetti-Cecchi L, Garcıa-Charton Ja, Goni R, Borg Ja, Forcada A, De Lucia Ga,Perez-Ruzafa A, Afonso P, Brito A, Guala I, Le Direach L,Sanchez-Jerez P, Somerfield PJ, Planes S (2010) Marinereserves: fish life history and ecological traits matter. EcolAppl 20:830–839
Collette BB, Nauen CE (1983) FAO Species Catalogue. Vol. 2.Scombrids of the world: an annotated and illustrated cat-alogue of tunas, mackerels, bonitos and related speciesknown to date. FAO Fisheries Synopsis No 125. FAO,Rome
Collette BB, Reeb C, Block BA (2001) Systematics of the tunasand mackerels (Scombridae). In: Block BA, Stevens ED(eds) Tuna: Physiology, Ecology, and Evolution, vol FishPhysiology 19. Academic Press, San Diego, pp 1–33
Collette BB, Carpenter KE, Polidoro BA, Juan-Jorda MJ,Boustany A, Die DJ, Elfes C, Fox W, Graves J, HarrisonLR, McManus R, Minte-Vera CV, Nelson R, Restrepo V,Schratwieser J, Sun C-L, Amorim A, Brick Peres MB,Canales C, Cardenas G, Chang S-K, Chiang W-C,de Oliveira Leite Jr. N, Harwell H, Lessa R, Fredou FL,Oxenford HA, Serra R, Shao K-T, Sumaila R, Wang S-P,Watson R, Yanez E (2011) High value and long life -Double jeopardy for tunas and billfishes. Science333:291–292
Dalgleish HJ, Koons DN, Adler PB (2010) Can life-history traitspredict the response of forb populations to changes in cli-mate variability? J Ecol 98:209–217
Dobson FS (2007) A lifestyle view of life-history evolution.Proc Natl Acad Sci USA 104:17565–17566
Dulvy NK, Forrest RE (2009) Life histories, populationdynamics and extinction risks in chondrichthyans. In:Carrier JC, Musick JA, Heithaus MR (eds) Biology ofsharks and their relatives. CRC Press, Boca Raton,pp 639–679
Dulvy NK, Ellis JR, Goodwin NB, Grant A, Reynolds JD,Jennings S (2004) Methods of assessing extinction risk inmarine fishes. Fish Fish 5:255–276
Fromentin JM, Fonteneau A (2001) Fishing effects and lifehistory traits: a case study comparing tropical versus tem-perate tunas. Fish Res 53:133–150
Gaillard JM, Pontier D, Allaine D, Lebreton JD, Trouvilliez J,Clobert J (1989) An analysis of demographic tactics inbirds and mammals. Oikos 56:59–76
Golovlev EL (2001) Ecological strategy of bacteria: specificnature of the problem. Microbiology 70:379–383
Rev Fish Biol Fisheries
123
Author's personal copy

Graham JB, Dickson KA (2004) Tuna comparative physiology.J Exp Biol 207:4015–4024
Grime JP (1974) Vegetation classification by reference tostrategies. Nature 250:26–31
Grime JP (1977) Evidence for the existence of three primarystrategies in plants and its relevance to ecological andevolutionary theory. Am Nat 111:1169–1194
Grime JP (2001) Plant strategies, vegetation processes andecosystem properties, 2nd edn. Wiley, Chichester
Grime JP, Pierce S (2012) The evolutionary strategies that shapeecosystems. Wiley-Blackwell, UK
Gunn JS, Clear NP, Carter TI, Rees AJ, Stanley CA, Farley JH,Kalish JM (2008) Age and growth in southern bluefin tuna,Thunnus maccoyii (Castelnau): direct estimation from ot-oliths, scales and vertebrae. Fish Res 92:207–220
Jennings S, Reynolds JD, Mills SC (1998) Life history correlatesof responses to fisheries exploitation. Proc R Soc Lond BBiol Sci 265:333–339
Juan-Jorda MJ, Mosqueira I, Cooper AB, Freire J, Dulvy NK(2011) Global population trajectories of tunas and theirrelatives. Proc Natl Acad Sci USA 51:20650–20655
King JR, McFarlane GA (2003) Marine fish life history strate-gies: applications to fisheries management. Fish ManagEcol 10:249–264
Longhurst A (2002) Murphy’s law revisited: longevity as a factorin recruitment to fish populations. Fish Res 56:125–131
Longhurst A, Pauly D (1987) Ecology of tropical oceans.Academic Press, San Diego
MacArthur RH, Wilson EO (1967) The theory of Island bio-geography. Princeton University Press, Princeton
Majkowski J (2007) Global fishery resources of tuna and tuna-like species. FAO Fisheries Technical Paper No 483. FAO,Rome
McIlwain JL, Claereboudt M, Aloufi H, Zaki S, Goddard J(2005) Spatial variation in age and growth of the kingfish(Scomberomorus commerson) in the coastal waters of theSultanate of Oman. Fish Res 73:283–298
McPherson GR (1992) Age and growth of the narrow-barredSpanish mackerel (Scomberomorus commerson Lacepede,1800) in north-eastern Queensland waters. Aust J MarFreshw Res 43:1269–1282
Molles MCJ (2000) Ecology: concepts and applications.McGraw-Hill, Boston
Murphy GI (1968) Pattern in life history and the environment.Am Nat 102:391–403
Ockinger E, Schweiger O, Crist TO, Debinski DM, Krauss J,Kuussaari M, Petersen JD, Poyry J, Settele J, SummervilleJS, Bommarco R (2010) Life-history traits predict speciesresponses to habitat area and isolation: a cross-continentalsynthesis. Ecol Lett 13:969–979
Olden JD, Poff NL, Bestgen KR (2008) Trait synergisms and therarity, extirpation, and extinction risk of desert fishes.Ecology 89:847–856
Pauly D, Munro JL (1984) Once more on the comparison ofgrowth in fish and invertebrates. Fishbyte 2(1):21
Peters RH (1983) The ecological implications of body size.Cambridge University Press, Cambridge
Philip D (2003) VEGAN, a package of R functions for com-munity ecology. J Veg Sci 14:927–930
Pianka ER (1972) r and K selection or b and d selection? Am Nat106:581–588
Promislow DEL, Harvey PH (1990) Living fast and dyingyoung: a comparative analysis of life-history variationamong mammals. J Zool 220:417–437
R Development Core Team (2010) R: a language and environ-ment for statistical computing. R Foundation for StatisticalComputing, Vienna
Reznick D, Bryant MJ, Bashey F (2002) r- and K-selectionrevisited: the role of population regulation in life-historyevolution. Ecology 83(6):1509–1520
Rochet MJ, Cornillon PA, Sabatier R, Pontier D (2000) Com-parative analysis of phylogenetic and fishing effects in lifehistory patterns of teleost fishes. Oikos 91(2):255–270
Saether BE, Engen S, Matthysen E (2002) Demographic char-acteristics and population dynamical patterns of solitarybirds. Science 295:2070–2073
Schaefer KM (1998) Reproductive biology of yellowfin tuna(Thunnus albacares) in the eastern Pacific Ocean. BullInter-American Trop Tuna Comm IATTC 21:205–272
Schaefer KM (2001) Reproductive biology of tunas. In: BlockBA, Stevens ED (eds) Tunas: ecological physiology andevolution. Academic Press, San Diego, pp 225–270
Sibly RM, Brown JH (2007) Effects of body size and lifestyle onevolution of mammal life histories. Proc Natl Acad SciUSA 104:17707–17712
Southwood TRE (1977) Habitat, the templet for ecologicalstrategies? J Anim Ecol 46:337–365
Stearns SC (1976) Life-history tactics: a review of the ideas.Q Rev Biol 51:3–47
Stearns SC (1977) The evolution of life history traits: a critiqueof the theory and a review of the data. Annu Rev Ecol Syst8:145–171
Taylor CC (1958) Cod growth and temperature. ICES J Mar Sci23:366–370
Vila-Gispert A, Moreno-Amich R, Garcia-Berthou E (2002)Gradients of life-history variation: an intercontinentalcomparison of fishes. Rev Fish Biol Fish 12:417–427
Warton DI, Wright IJ, Falster DS, Westoby M (2006) Bivariateline-fitting methods for allometry. Biol Rev Camb PhilosSoc 81:259–291
Wickham H (2009) ggplot2: Elegant graphics for data analysis.Springer, New York
Winemiller KO (1989) Patterns of variation in life historyamong South American fishes in seasonal environments.Oecologia 81:225–241
Winemiller KO, Rose KA (1992) Patterns of life-historydiversification in North American fishes: implications forpopulation regulation. Can J Fish Aquat Sci 49:2196–2218
Rev Fish Biol Fisheries
123
Author's personal copy