Embed Size (px)
Citation preview

Looking after all our water needs
Margaret River Hydrology Summary
Department of Water
Surface Water Hydrology Series
Report no. 27
July 2008

Department of Water 168 St Georges Terrace Perth Western Australia 6000 Telephone +61 8 6364 7600 Facsimile +61 8 6364 7601 www.water.wa.gov.au
© Government of Western Australia 2008
July 2008
This work is copyright. You may download, display, print and reproduce this material in unaltered form only (retaining this notice) for your personal, non-commercial use or use within your organisation. Apart from any use as permitted under the Copyright Act 1968, all other rights are reserved. Requests and inquiries concerning reproduction and rights should be addressed to the Department of Water.
ISBN 978-1-921468-85-8 (print) ISBN 978-1-921468-86-5 (online)
Acknowledgements
This publication was prepared by Kathryn Crossley.
Subject of cover photograph: Margaret River Weir and fish ladder (by Peter Muirden)
For more information about this report, contact the Manager, Surface Water Assessment Section of the Department of Water.

Margaret River Hydrology Summary
Department of Water iii
Contents Contents ..................................................................................................................... iii 1 Introduction..............................................................................................................5
2 Catchment description.............................................................................................6 2.1 Landforms ........................................................................................................................6 2.2 Groundwater ....................................................................................................................8 2.3 Land use ..........................................................................................................................9
3 Climate ..................................................................................................................11
4 Streamflow ............................................................................................................14 4.1 Annual streamflow.......................................................................................................... 17 4.2 Monthly streamflow ........................................................................................................ 19 4.3 Daily streamflow............................................................................................................. 20
5 Comparison between upper and lower catchment ................................................24
6 Conclusion.............................................................................................................27
Appendix....................................................................................................................28
References ................................................................................................................30
Figures
Figure 1 Location of the Margaret River catchment..............................................5 Figure 2 Margaret River catchment geology.........................................................8 Figure 3 Margaret River catchment, existing vegetation.....................................10 Figure 4 Rainfall and streamflow gauge locations ..............................................11 Figure 5 Mean monthly rainfall at Margaret River Post Office (009574) .............12 Figure 6 Annual rainfall at Margaret River Post Office (009574) ........................13 Figure 7 Streamflow gauging stations in the Margaret River catchment.............14 Figure 8 Observed and modelled annual-flow comparison at Willmot's Farm
(610001) ...............................................................................................16 Figure 9 Annual flow contributions from baseflow and direct flow ......................17 Figure 10 Annual-flow series for Margaret River at Willmot's Farm (610001).......18 Figure 11 Annual series flood frequency for Margaret River at Willmot's Farm
(610001) ...............................................................................................19 Figure 12 Observed monthly flow distribution for Margaret River at Willmot's Farm
(610001) ...............................................................................................20 Figure 13 Continuous-flow period for the Margaret River at Willmot’s Farm from
1973 to 2004 ........................................................................................21 Figure 14 Daily flow-duration curves for 610001 ..................................................22 Figure 15 Daily flow-duration curves for 610001 categorised by month ...............23 Figure 16 Examples of catchment land use with state forest on the left and
cleared farmland on the right (photographs by Kathryn Crossley)........24 Figure 17 Daily flow-duration curves for 610008 categorised by month ...............25 Figure 18 Daily flow-duration curves for 610008 ..................................................25

Margaret River Hydrology Summary
iv Department of Water
Figure 19 Continuous-flow periods for Margaret River north branch at Whicher Range from 1978 to 1998.....................................................................26
Tables
Table 1 Annual series flood-frequency data for Margaret River at Willmot's Farm (610001) ...............................................................................................18

Margaret River Hydrology Summary
Department of Water 5
1 Introduction The Margaret River is located 283 km south of Perth in south-west Western Australia (Figure 1). This report describes the hydrology of the Margaret River and is part of an environmental water provision study. Information on the hydrologic characteristics will be used to help establish environmental flow requirements for the river.
Figure 1 Location of the Margaret River catchment

Margaret River Hydrology Summary
6 Department of Water
2 Catchment description The Margaret River catchment has an area of 477 km2 and is 21 per cent cleared. The Margaret River townsite is located in the cleared lower region of the catchment, while smaller nearby towns include Cowaramup, Prevelly and Gracetown (Figure 1).
The river drains sections of the Blackwood and Margaret river plateaus, passing through the Leeuwin–Naturaliste Ridge and discharging to the ocean near Prevelly. It is one of 17 major creeks that drain the Leeuwin–Naturaliste Ridge; it is, however, the only true river system to pass through it (Bari, Mayer & Ruprecht 2005). Major tributaries include the Mowen River, Bramely Brook and Ten Mile Brook. The Ten Mile Brook dam supplies water to the towns of Margaret River, Prevelly, Gnarabup and Cowaramup.
2.1 Landforms
Three major land formations are crossed by the Margaret River including the Blackwood and Margaret river plateaus and the Leeuwin–Naturaliste Coast. Located east of the Margaret River Plateau in the centre of the Leeuwin–Naturaliste region is the Blackwood Plateau, which is formed on lateritised sedimentary rocks of the Perth Basin. The Margaret River Plateau land formation is 5–15 km wide and stretches from Dunsborough to Augusta. It is formed on lateritised granitic and gniessic basement rock of the Leeuwin Block. Stretching along the coast between Cape Leeuwin and Cape Naturaliste, the Leeuwin–Naturaliste Coast is 0.2–6 km wide and consists of a discontinuous ridge of Tamala Limestone over Leeuwin Block granite, exposed in some places (Hall, Langford & Marnham 2000).
Both the Blackwood and Margaret river plateau formations are characterised by gently undulating to low hilly relief. The dominant soil types on the crests and slopes are yellow-brown gravelly duplex and pale grey mottled soils. Alluvial flats and well-drained red-brown and grey loamy soils occur along the river. Other soil types on the plateaus include deep bleached sands and shallow rocky soils (Hall, Langford & Marnham 2000). Near the ocean outlet, soils consist of deep brown/yellow siliceous sands (Hall, Langford & Marnham 2000).
A number of geological systems have been identified in the region. Those that occur within the Margaret River catchment include the Treeton, Cowaramup, Caves Road, Spearwood and Quindalup systems. Figure 2 illustrates the regolith-land systems that occur within the catchment, though systems in its upper half have not been included due to insufficient data.
The Cowaramup System is characterised by gently to moderately inclined low hills and rises. Near the coast these slopes become steep to precipitous, forming localised cliffs. The system forms a north–south corridor between the Spearwood and Quindalup coastal systems in the west and the Treeton System in the east. The elevation of the system decreases from north to south and ranges from 90 to

Margaret River Hydrology Summary
Department of Water 7
140 m AHD in its central part. The type and distribution of regolith and rock materials of the Cowaramup System in the Margaret River catchment are shown in Figure 2.
The Treeton System is characterised by low hills and rises with gently to moderately inclined slopes. Its northern section is an undulating near-level plateau, approximately 120 m AHD. The southern section is more deeply incised, and drained westerly and south-westerly by the Margaret River and Chapman Brook respectively. Regolith materials are formed by erosion of the sedimentary rocks and underlying Leederville Formation. Details of the regolith and rock material in the Treeton System that are relevant to the Margaret River catchment are shown in Figure 2.
The Caves Road System can be found sporadically along the Leeuwin–Naturaliste Coast. It consists of level to gently inclined shelf with height ranging from 60 m AHD near the western coast to 100 m AHD inland. The system has an undulating surface, with shallow hollows and rises, as well as swamps and poorly drained depressions. The dominant regolith and rock material of the system is residual leached quartz sand with grain size that varies from fine gravel to fine sand.
The Spearwood System is a discontinuous ridge up to 3 km wide that stretches along the Leeuwin–Naturaliste coastline. It consists of a series of deflated dunes and swales, composed of quartz sand, over eolian calcarenite.
The Quindalup System is composed of parabolic dunes, swales and blowouts. It is located along the Leeuwin–Naturaliste Coast, occupying a width of up to 2 km. It overlies Tamala Limestone or rocks of Leeuwin Complex. To the west the system consists of beach backed by foredune. Beaches can be dominated by limestone boulders and backed by cliffs of calcarenite or, in some places, bluffs of granitite. Dunes of the system reach 110 m AHD, while beaches are low-lying, with gently to moderately inclined slopes (Hall, Langford & Marnham 2000).

Margaret River Hydrology Summary
8 Department of Water
Figure 2 Margaret River catchment geology
2.2 Groundwater
Small to moderate amounts of fresh groundwater are available from sand or duricrust on the Blackwood Plateau where the Leederville Formation outcrops near the surface. In contrast to this, groundwater from the Margaret River Plateau is brackish to saline and confined to faults or fractures, making it difficult to locate from the surface. Bores in this region typically yield very small amounts of water or are dry. Rapid channel flow through limestone closer to the ocean means that a watertable is often not developed in the Leeuwin–Naturaliste Coast (Hall, Langford & Marnham 2000).

Margaret River Hydrology Summary
Department of Water 9
2.3 Land use
Tourism and agriculture are two important industries in the region. Agricultural activities include dairy and beef cattle farming, viticulture and horticulture. The Group Settlement Scheme, which began in the early 1920s, led to a major expansion of agriculture, in particular dairying, in the Margaret River catchment. During the 1970s the relative importance of dairying decreased as numbers of beef cattle and sheep increased (Department of Environment 2005). The first vineyards were established in the region in 1967, and the area has since become known for its wine production. Tourists visit the area for the restaurants and wineries and to enjoy the scenery and surrounding beaches.
Margaret River Hydrology Summary
10 Department of Water
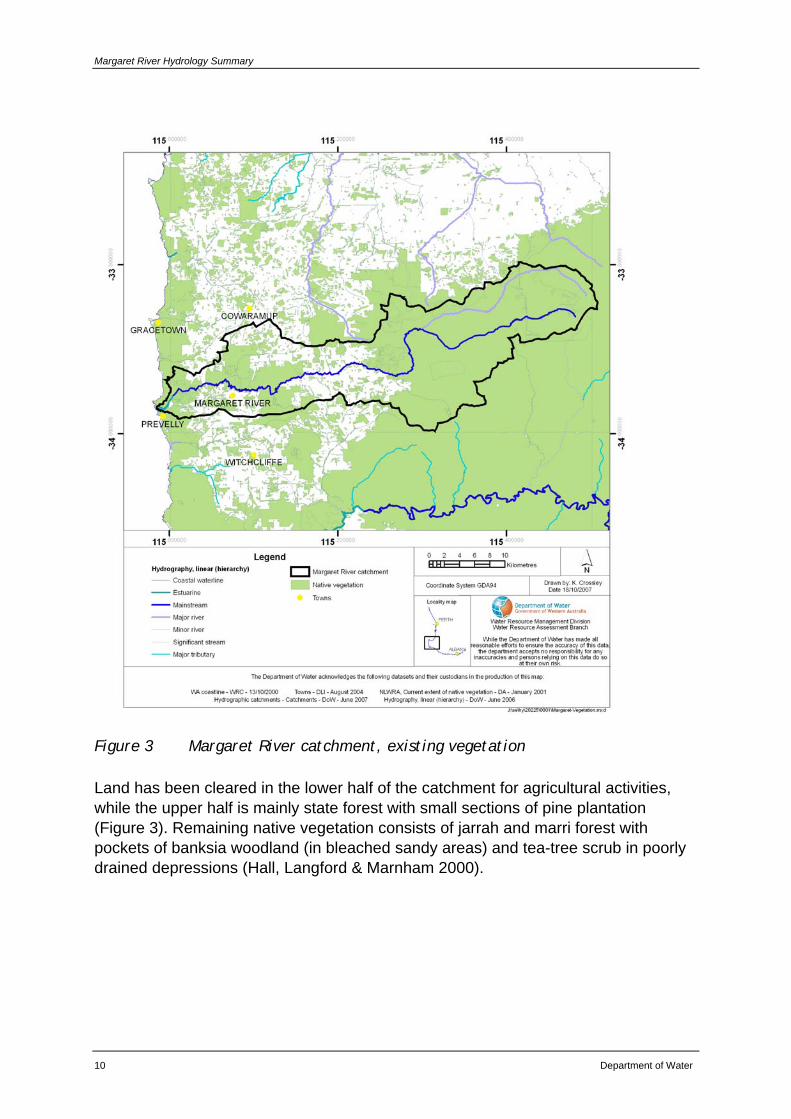
Figure 3 Margaret River catchment, existing vegetation
Land has been cleared in the lower half of the catchment for agricultural activities, while the upper half is mainly state forest with small sections of pine plantation (Figure 3). Remaining native vegetation consists of jarrah and marri forest with pockets of banksia woodland (in bleached sandy areas) and tea-tree scrub in poorly drained depressions (Hall, Langford & Marnham 2000).

Margaret River Hydrology Summary
Department of Water 11
3 Climate The Margaret River catchment has a temperate climate, with hot dry summers and cool wet winters (Bureau of Meteorology 2001). Rainfall is generated in winter by rain-bearing low-pressure systems moving in an easterly direction. In summer these fronts are blocked by high-pressure systems, but occasional widespread heavy rain may result from decaying tropical cyclones (Pen 1999).
Figure 4 Rainfall and streamflow gauge locations

Margaret River Hydrology Summary
12 Department of Water
Rain gauges are located throughout the catchment, and those used in this study are illustrated in Figure 4. The Margaret River Post Office meteorological site (009574) has been used to describe rainfall in the catchment, as it is located close to the town and has a long record. Rainfall data from all gauges in Figure 4 and evaporation data from 009574 have been used in streamflow modelling.
0
50
100
150
200
250
Jan Feb Mar Apr May Jun Jul Aug Sep Oct Nov Dec
Month
Mon
thly
rain
(mm
)
1929 to 20041975 to 2004
Figure 5 Mean monthly rainfall at Margaret River Post Office (009574)
The catchment receives a mean annual rainfall of approximately 1000 mm, 77 per cent of it occurring between May and September. Figure 5 shows the average monthly rainfall measured at Margaret River Post Office (009574). Long-term monthly rainfall averages tend to be higher than the short-term figures (1975 to 2004). This trend is consistent with the IOCI observation that rainfall has decreased since the 1970s, particularly in winter months (IOCI 2002).
Mean annual rainfall varies throughout the catchment. Values are highest in the south-west and decrease towards the north-east. For instance, mean annual rainfall at Margaret River Post Office was 1134 mm while the corresponding figure for Whicher Range was 932 mm.
Inter-annual variability in rainfall is low, with a coefficient of variation of 0.15. While variability is low, there was a trend of decreasing annual rainfall from the mid-1970s onwards. This trend is evident in the negative gradient of the cumulative deviation from the mean in Figure 6. The annual rainfall mean from 1975 to 2004 was 1047 mm compared to the long-term mean of 1136 mm at Margaret River Post Office (009574).

Margaret River Hydrology Summary
Department of Water 13
0
200
400
600
800
1000
1200
1400
1600
1800
1929 1939 1949 1960 1970 1980 1990 2000
Year
Ann
ual r
ain
(mm
)
-500
0
500
1000
1500
2000
2500
3000
Cum
ulat
ive
devi
atio
n fro
m
mea
n (m
m)
Margaret River PO (009574)Cumulative deviation from mean annual rainMean 1929 to 2004Mean 1975 to 2004
Figure 6 Annual rainfall at Margaret River Post Office (009574)

Margaret River Hydrology Summary
14 Department of Water
4 Streamflow Five streamflow gauging stations have been operating on the Margaret River for various durations from 1958 to the present (Figure 4). Located downstream from the townsite is the Willmot’s Farm streamflow gauge (610001), which has the longest continuous streamflow record of all gauges on the river and has a catchment area of 443 km2. The Whicher Range streamflow gauge (610008) is located on the Margaret River north branch in the upper catchment. Its catchment area is 15.5 km2, and the characteristics of the flows recorded there are very different from those seen at the Willmot’s Farm gauge. The location and period of operation for each gauge is shown in Figure 7.
Jan '55 Jan '60 Jan '65 Jan '70 Jan '75 Jan '80 Jan '85 Jan '90 Jan '95 Jan '00 Jan '05
Willmot's Farm (610001)
Low er Tow n Weir (610128)
Bramely Brook (610018)
Margaret River north/Whicher Range (610008)
Margaret River north/Whicher Range (610008)
Great North Road (610030)
Figure 7 Streamflow gauging stations in the Margaret River catchment
Although the flow record at Willmot’s Farm is long and continuous compared to other gauges in the catchment, there are still some gaps in the record. Data are missing for a total of 126 days between 1973 and 1985.
Data gaps were filled to create a continuous flow record from 1971 to 2004. The lack of a hydrologically similar catchment with a long gauging record meant that data could not be filled using correlation techniques. Instead, a rainfall runoff model was prepared using AWBM2000, a continuous-loss model within the Continuous Simulation System (CSS). The rainfall runoff model was calibrated using Willmot’s Farm streamflow data from 1987 to 1996. In addition to the monthly and daily streamflow inputs, the model required one rainfall and one evaporation input to be applied over the entire catchment. Rainfall varies throughout the catchment, so the Thiessen weighted polygon method was applied to five rainfall gauges throughout the catchment to generate a rainfall file that would account for this.

Margaret River Hydrology Summary
Department of Water 15
Calibration results were assessed using several methods including the coefficient of efficiency (E) (Nash & Sutcliffe 1970), the mean absolute error (MAE) and the root of the mean square error (RMSE). The final model parameter set can be found in the Appendix. Modelled annual runoff estimates were similar to observed, with a coefficient of efficiency of 0.85 (Figure 8). Calibration values were applied to a longer period of daily rain and evaporation data from 1973 to 2004, and the missing data in the observed streamflow record were filled using the model-generated streamflow.

Margaret River Hydrology Summary
16 Department of Water
0
50
100
150
200
250
300
0 50 100 150 200 250 300Observed monthly runoff (mm)
Mod
elle
d m
onth
ly ru
noff
(mm
)
1:1 line
E = 0.95
0
100
200
300
400
500
600
700
0 100 200 300 400 500 600 700
Observed annual runoff (mm)
Mod
elle
d an
nual
runo
ff (m
m) 1:1 line
0
50
100
150
200
250
300
350
400
1986 1987 1988 1989 1990 1991 1992 1993 1994 1995 1996
Year
Flow
(mm
)
Modelled flowObserved flow
Figure 8 Observed and modelled annual-flow comparison at Willmot's Farm (610001)

Margaret River Hydrology Summary
Department of Water 17
Calibration of AWBM2000 involves partitioning the flow into base and surface-flow components (Figure 9). The baseflow component is determined by visually fitting a baseflow index to the observed flow record. When an acceptable visual fit is achieved, the program can output a partitioned flow series containing both the base and surface-flow components. Using this technique it was found that, on average, 57 per cent of annual flow at Willmot’s Farm is baseflow contribution.
0
50
100
150
200
250
300
350
400
1986 1988 1990 1992 1994 1996Year
Ann
ual f
low
(mm
)
BaseflowDirect flowTotal flow
Figure 9 Annual flow contributions from baseflow and direct flow
4.1 Annual streamflow
Mean annual flow at Willmot’s Farm was quite high in comparison to mean annual rainfall. The mean annual runoff was 203 mm for 1973–2004, while mean annual catchment rainfall for this period was 996 mm. As a result, the annual runoff coefficient for the catchment was 20 per cent. There was low variability of annual flow in Margaret River at Willmot’s Farm, with a coefficient of variation of 0.45. Mean annual flow over the 33-year record period was 86.2 GL and the maximum and minimum flows on record were 190 GL (1973) and 20.9 GL (2001) respectively. Annual flow was consistent with annual rainfall, and both annual rainfall and flow have been well below the long-term average values since 2000 (see Figures 6 and 10).

Margaret River Hydrology Summary
18 Department of Water
0
20
40
60
80
100
120
140
160
180
200
1971 1976 1981 1986 1991 1996 2001
Year
Ann
ual f
low
(GL)
610001 Filled data Mean annual flow Mean annual flow filled data
Figure 10 Annual-flow series for Margaret River at Willmot's Farm (610001)
A flood-frequency analysis was conducted by fitting a Log Pearson type III distribution to peak annual flows recorded at Willmot’s Farm. The program FLIKE was used to fit the probability distribution to 34 years of peak flows (Figure 11). Peak annual flow for a selection of average recurrence intervals is given in Table 1.
Table 1 Annual series flood-frequency data for Margaret River at Willmot's Farm (610001)
Average recurrence interval (1:year)
Annual exceedance probability (%)
Peak annual flow expected probability
(m3/s)
50% AEP growth factor
1:1.1 90.9 14.1 – 1:2 50 33.0 – 1:5 25 51.6 1.56 1:10 10 63.5 1.91 1:20 5 75.1 2.26 1:50 2 89.6 2.65
1:100 1 102.0 2.93

Margaret River Hydrology Summary
Department of Water 19
Margaret River - Willmots Farm (610001)
200
10050201052
1.25
1.11
1.05
1.02
1.01
1.00
5
1.00
2
1.00
1
500
0.1
1
10
100
1000
10000
Annual exceedance (1 in y)
Pea
k flo
w (m
3 /s)
Fitted LP3 distribution90%'ile CL(610001)
Figure 11 Annual series flood frequency for Margaret River at Willmot's Farm (610001)
4.2 Monthly streamflow
Streamflow in the Margaret River is highly seasonal, with 93 per cent occurring from June to October. August is the peak flow month, with a mean flow of 25 GL. There is a lag between the peak rainfall month (June) and the peak flow month (August). This lag indicates that the catchment has a large soil-storage capacity (Figure 12).

Margaret River Hydrology Summary
20 Department of Water
0
5
10
15
20
25
30
Jan Feb Mar Apr May Jun Jul Aug Sep Oct Nov Dec
Mon
thly
flow
(GL)
0
50
100
150
200
250
Rai
nfal
l (m
m)
mean flow median flow mean rainfall mm (009574)
Figure 12 Observed monthly flow distribution for Margaret River at Willmot's Farm (610001)
4.3 Daily streamflow
Figure 13 shows the continuous flow period of the Margaret River at Willmot’s Farm (610001) for the years 1973 to 2004. Flow is perennial until the early 1980s, and the continuous flow period appears to decrease from then on, particularly from the mid-1990s to 2004. However, during this period there have been some years when the river flowed continuously.

Margaret River Hydrology Summary
Department of Water 21
Jan Feb Mar Apr May Jun Jul Aug Sep Oct Nov Dec
19731974197519761977197819791980198119821983198419851986198719881989199019911992199319941995199619971998199920002001200220032004
Figure 13 Continuous-flow period for the Margaret River at Willmot’s Farm from 1973 to 2004
The daily flow-duration curve for the entire period of record is shown in Figure 14 along with separate daily duration curves for each year on record. Daily flow-duration analysis for the entire period of record shows that flow has exceeded 0.1 ML on 93 per cent of days and median daily flow is 47.2 ML. During the period of record, daily flow has exceeded 0.1 ML between 65 per cent and 100 per cent of days in each year. The inter-annual variation in daily flow durations (particularly low flows) over the period of record gives an indication of the types of flow the river has adapted to in the past. The ability of the river to adapt to different flow regimes has implications for determining future environmental flow requirements.

Margaret River Hydrology Summary
22 Department of Water
0.01
0.1
1
10
100
1000
10000
0% 10% 20% 30% 40% 50% 60% 70% 80% 90% 100%Probability of exceedance (%)
Dai
ly fl
ow (M
L)
Annual seriesTotal series
Figure 14 Daily flow-duration curves for 610001
There are two groupings evident from categorising daily flows into months at Willmot’s Farm (Figure 15):
• January to May, where median daily flow is less than 5 ML and flow is not continuous throughout the month
• June to December, where median daily flow is greater than 10 ML and flow is continuous throughout the month.

Margaret River Hydrology Summary
Department of Water 23
0.01
0.1
1
10
100
1000
10000
0% 10% 20% 30% 40% 50% 60% 70% 80% 90% 100%
Probability of exceedance (%)
Dai
ly fl
ow (M
L)
January February March April May June
July August September October November December
Figure 15 Daily flow-duration curves for 610001 categorised by month

Margaret River Hydrology Summary
24 Department of Water
5 Comparison between upper and lower catchment
The Margaret River catchment can be categorised into two regions of distinctly different land use. The upper half of the catchment is mainly state forest while the lower half has been extensively cleared (Figure 16). Because clearing is localised to the lower half of the catchment, it is expected that there will be differences in hydrologic characteristics between the upper and lower parts. These differences have been investigated in this study by comparing flow characteristics from the Whicher Range streamflow gauge (610008) in the north branch of the river to the Willmot’s Farm streamflow gauge (610001) in the lower end of the catchment.
Figure 16 Examples of catchment land use with state forest on the left and cleared farmland on the right (photographs by Kathryn Crossley)
Mean annual runoff at Whicher Range (610008) was 108 mm compared to 202 mm at Willmot’s Farm. Lower runoff is due in part to the lower rainfall experienced in the upper section of the catchment compared to the lower. However, comparison of runoff coefficients shows that there was a lower proportion of streamflow to rainfall at Whicher Range than at Willmot’s Farm: 11 per cent and 20 per cent respectively. The lower runoff in the upper catchment can be attributed to higher storage and loss values (higher evapotranspiration due to denser vegetation).
Monthly categorisation of daily flow-duration curves at Whicher Range streamflow gauge highlights the discontinuous nature of flows in the upper catchment (Figures 17 and 18). Flow is discontinuous from November to July inclusive, while flow at Willmot’s Farm is discontinuous from January to May (Figure 17). Figure 19 shows the continuous-flow record at Whicher Range from 1978 to 1998. This graph highlights the discontinuity of flow at Whicher Range, flow having been discontinuous for every year on record.

Margaret River Hydrology Summary
Department of Water 25
0.01
0.1
1
10
100
1000
0% 10% 20% 30% 40% 50% 60% 70% 80% 90% 100%
Probability of exceedance (%)
Dai
ly fl
ow (M
L)
Annual seriesTotal series
Figure 17 Daily flow-duration curves for 610008 categorised by month
0.01
0.1
1
10
100
1000
0% 10% 20% 30% 40% 50% 60% 70% 80% 90% 100%
Probability of exceedance (%)
Dai
ly fl
ow (M
L)
January February March April May JuneJuly August September October November December
Figure 18 Daily flow-duration curves for 610008

Margaret River Hydrology Summary
26 Department of Water
Jan Feb Mar Apr May Jun Jul Aug Sep Oct Nov Dec
197819791980198119821983198419851986198719881989199019911992199319941995199619971998
Figure 19 Continuous-flow periods for Margaret River north branch at Whicher Range from 1978 to 1998

Margaret River Hydrology Summary
Department of Water 27
6 Conclusion Data gaps in the streamflow record at Willmot’s Farm have been filled to create a daily flow record from 1971 to 2004. The flow record has been analysed over a range of different timescales from daily to monthly to annual.
Flow in the Margaret River has a high annual variability, the maximum and minimum annual flows on record being 190 GL and 20.9 GL respectively. Monthly analysis has illustrated that 93 per cent of flow occurs between June and October inclusive. The seasonality of flow is consistent with rainfall in the region, as 77 per cent of rainfall occurs between May and September inclusive. There is, however, a lag of one month between the peak rainfall month (June) and peak flow month (July), which indicates a large soil-storage capacity in the catchment.
Daily flow-duration analysis illustrates that flow is not perennial, though the river has flowed for 93 per cent of days on record. In the lowest flow month (March) flow exceeded 0.04 ML 50 per cent of the time and daily flow exceeded 0.001 ML 71 per cent of the time. Flow is continuous from June to December.
The average baseflow index is 57 per cent. This represents a large baseflow contribution to the catchment water balance, but it can vary both seasonally and with individual storm events.
The catchment has a large mean annual flow compared to mean annual rainfall. Mean annual runoff was 203 mm while rainfall was 996 mm, which gives a runoff coefficient of 20 per cent. Comparison was made between stream flow in the upper and lower ends of the catchment because of the different land use in the two areas. The runoff coefficient for the upper catchment was 11 per cent compared to 20 per cent at Willmot’s Farm. Lower runoff in the upper end of the catchment indicates greater loss and/or storage values, which can be attributed to denser vegetation cover in this area.

Margaret River Hydrology Summary
28 Department of Water
Appendix Table A Statistics comparing the observed and simulated results of the CSS
calibration for Margaret River at Willmot’s Farm
Statistic (1987–1995) Observed Simulated Annual Average (mm) 191.80 182.47 Standard deviation (mm) 81.07 99.76 Mean absolute error (MAE) (mm) 25.75 Root mean square error (RMSE) (mm) 28.96 Coefficient of efficiency (E) 0.86 Monthly Average (mm) 15.98 15.20 Standard deviation (mm) 22.56 23.54 Mean absolute error (MAE) (mm) 2.96 Root mean square error (RMSE) (mm) 4.93 Coefficient of efficiency (E) 0.95 Daily Average (mm) 0.52 0.50 Standard deviation (mm) 0.89 0.92 Mean absolute error (MAE) (mm) 0.16 Root mean square error (RMSE) (mm) 0.38 Coefficient of efficiency (E) 0.81
Where:
MAE is calculated as ii SON
−∑1 and has a range of 0 to infinity and a perfect score
of 0
RMSE is calculated as ( )21ii SO
N−∑ and has a range of 0 to infinity and a perfect
score of 0
E is calculated as ( )( )2
2
1OO
SO
i
ii
−∑
−∑− and has a range of negative infinity to 1 and a
perfect score of 1
and O represents the observed data point, S the simulated data point and N the total number of observations.

Margaret River Hydrology Summary
Department of Water 29
Table B Final CSS parameter set for Margaret River at Willmot’s Farm*
Parameter Value
Capacity C1 – mm 74 Capacity C2 – mm 253 Capacity C3 – mm 552 Area A1 0<=A1<=1 0.151 Area A2 0<=A2<=1 0.361 Area A3 0<=A3<=1 0.448 Baseflow index (BFI) 0<=BFI<=1 0.577 Baseflow recession constant Kbase 0<=KBase<=1 0.643 Surface runoff recession constant Ksurf 0<= Ksurf <=1 0.965 * Optimising criterion = 0.8

Margaret River Hydrology Summary
30 Department of Water
References Bureau of Meteorology 2001, Climate of Australia based on Modified Koeppen Climate Classification System, Bureau of Meteorology, Canberra, viewed 4 May 2006, <http://www.bom.gov.au/climate/environ/other/kpngrp.gif>.
Department of Environment 2005, Margaret River catchment area (including Ten Mile Brook catchment) drinking water source protection plan, Water Resource Protection Series, no. WRP 53, Department of Environment, Perth, Western Australia.
Indian Ocean Climate Initiative 2002, Climate variability and change in southwest Western Australia, Indian Ocean Climate Initiative Panel, Perth, viewed 4 May 2006, <http://www.ioci.org.au/publications/pdf/IOCI_TechnicalReport02.pdf>.
Marnham, JR, Hall, GJ & Langford, RL 2000, Regolith-landform resources of the Cowaramup–Mentelle 1:50 000 Sheet, Record 2000/18, Geological Survey of Western Australia, Perth.
Pen, LJ 1999, Managing our rivers: A guide to the nature and management of the streams of southwest Western Australia, Water and Rivers Commission, Perth.
Tille, PJ & Lantzke, NC 1990, Busselton – Margaret River – Augusta land capability study, Land Resources Series no. 5, Western Australian Department of Agriculture, Perth.