Embed Size (px)
Citation preview

March 9, 2017 | 1

March 9, 2017 | 2
01
2016 OVERVIEW AND OUTLOOK

March 9, 2017 | 3
Carrefour, the reference in food retail
01. 2016 OVERVIEW & OUTLOOK
March 9, 2017 | 3
March 9, 2017 | 4
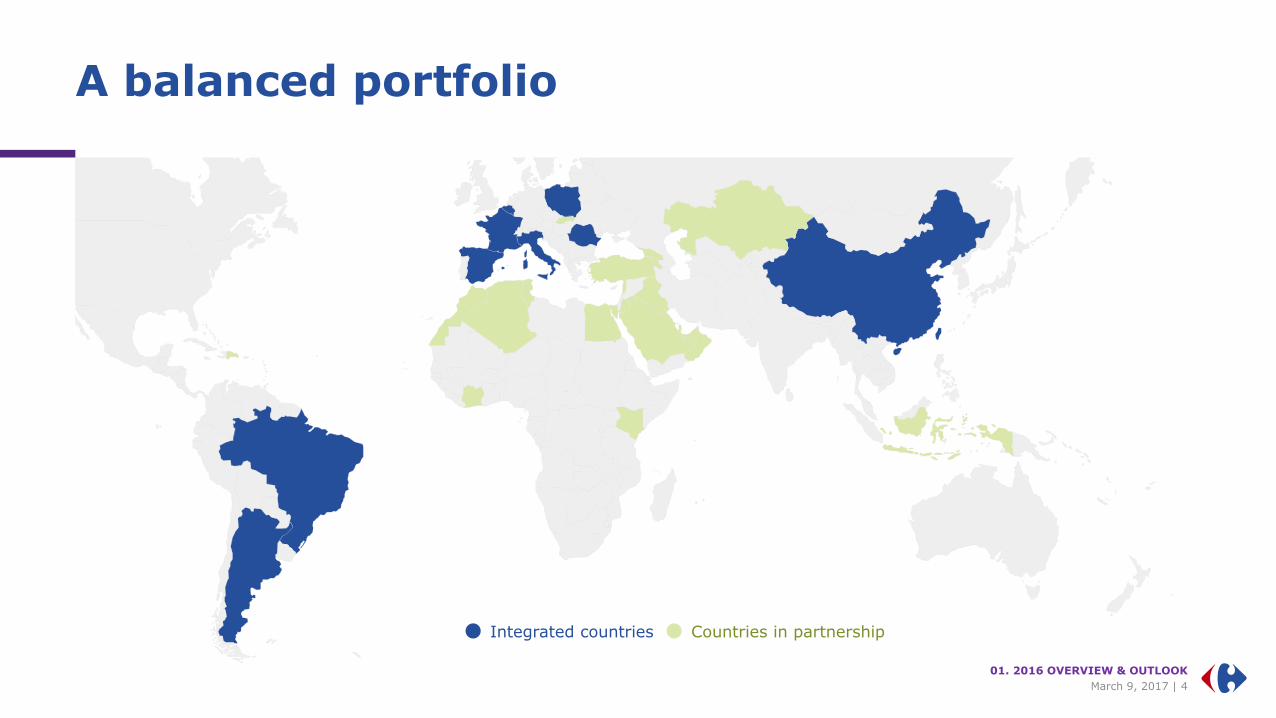
A balanced portfolio
Integrated countries Countries in partnership
01. 2016 OVERVIEW & OUTLOOK

March 9, 2017 | 5
Carrefour: The reference in food retail
Food represents 83% of the Group sales in 2016(growth of over 4% in 2016)
01. 2016 OVERVIEW & OUTLOOK
Quality
accessible to all
Unique know-
how
in fresh produce
Pioneer
in organic food
and Quality Lines
Powerful
exclusive brands
Sourcing
expertise

March 9, 2017 | 6
CSR is at the heart of Carrefour’s know-how
Fight wastage Biodiversity Partnerships
Food
Climate – Energy
Packaging
Waste
Agroecology
Sustainable fishing
Sustainable forestry
Beekeeping
Diversity
SMEs and Producers
Nutrition/Health
Solidarity
Included in the Dow Jones Sustainability Index Europe in 2016Present in the DJSI Europe, Stoxx Global ESG, FTSE4Good, Ethibel
01. 2016 OVERVIEW & OUTLOOK

March 9, 2017 | 7
Carrefour, pioneer in organic products
ROLL-OUT OF ORGANIC FOOD AREAS IN STORE
DEVELOPMENT OF OFFER ACQUISITION OF GREENWEEZ
PROGRAM TO ACCELERATE ORGANIC FARMING
PARTNERSHIPS WITH 300 FARMS BY 2020
3,000 ORGANIC FOOD SKUs
OF WHICH MORE THAN 800 UNDER
PRIVATE LABELS
+32%
ORGANIC FOOD SALES IN 2016:
LEADING ONLINE ORGANIC FOOD RETAILER
01. 2016 OVERVIEW & OUTLOOK

March 9, 2017 | 8
A multiformat Group: “Everyone under one roof”
First hypermarket Promodès Atacadão
Accelerationin convenienceBilla, Dia, Eroski
1999 20072012
to 20151963
Rue du Commerce
2016
01. 2016 OVERVIEW & OUTLOOK

March 9, 2017 | 9
The center of gravity is shifting towards convenience
BREAKDOWN OF STORES UNDER BANNERS BY FORMAT
5,4797,075
9,000
2,986
3,227
3,700
1,366
1,328
1 450
164
305
350
2012 2016 2019e
9,995 stores
11,935stores
14,500stores
Evolution 2012 vs. 2019e
+100%
+6%
+24%
+ 64%
Cash & CarryHypermarketsSupermarketsConvenience
GROSS SALES BREAKDOWN – (%)
58%51%
<50%
42%49%
>50%
2012 2016 2019e
Hypermarkets Other formats
01. 2016 OVERVIEW & OUTLOOK
March 9, 2017 | 9
March 9, 2017 | 10
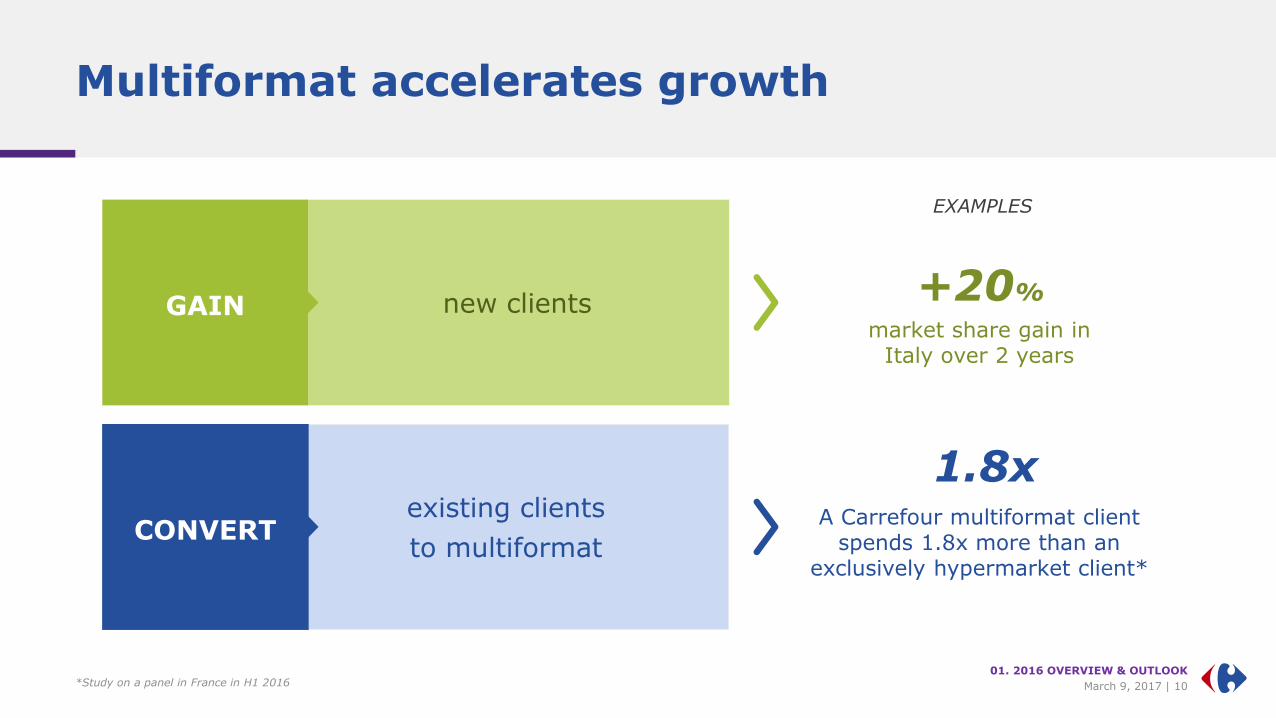
Multiformat accelerates growth
*Study on a panel in France in H1 2016
+20%GAIN
1.8x
CONVERTexisting clients
to multiformat
market share gain in Italy over 2 years
A Carrefour multiformat client spends 1.8x more than an
exclusively hypermarket client*
new clients
EXAMPLES
01. 2016 OVERVIEW & OUTLOOK

March 9, 2017 | 11
E-commerce, an additional format
HYPERMARKETS SUPERMARKETS
CONVENIENCE
CASH &CARRY
E-COMMERCE
Selected banners
01. 2016 OVERVIEW & OUTLOOK
March 9, 2017 | 12
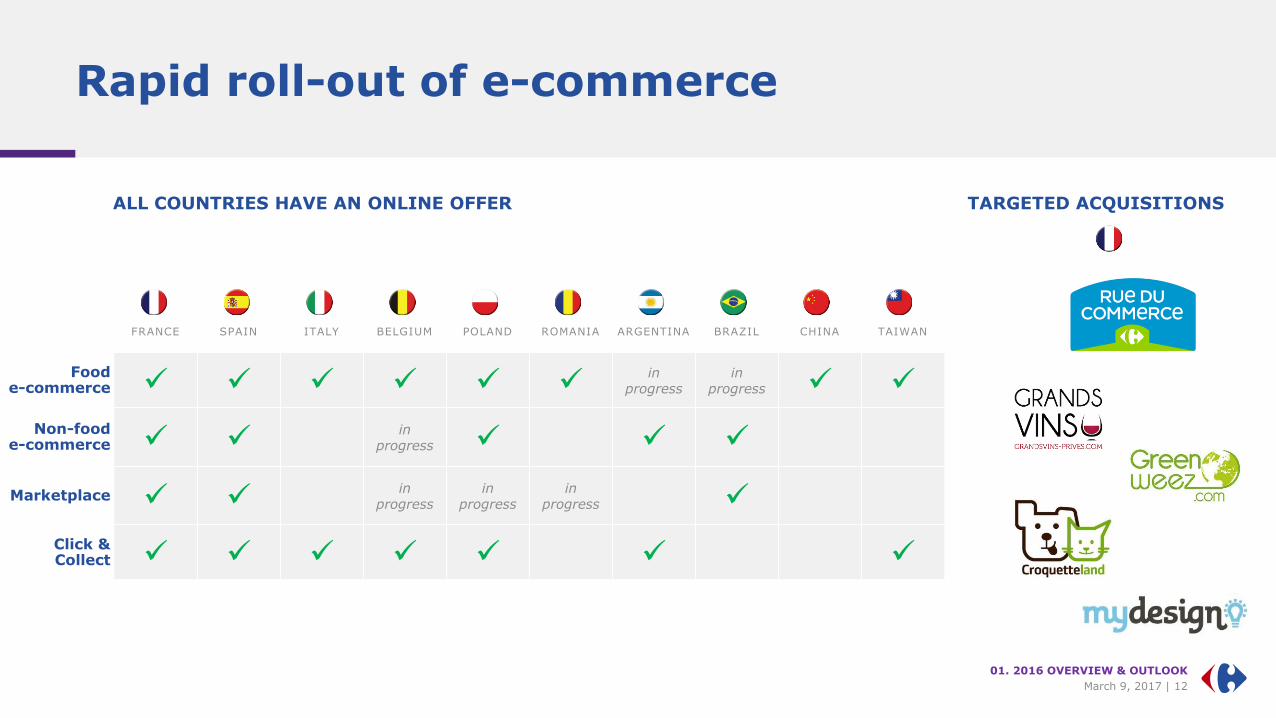
Rapid roll-out of e-commerce
ALL COUNTRIES HAVE AN ONLINE OFFER
FRANCE SPAIN ITALY BELGIUM POLAND ROMANIA ARGENTINA BRAZIL CHINA TAIWAN
Foode-commerce
in progress
in progress
Non-foode-commerce
in progress
Marketplace in
progressin
progressin
progress
Click & Collect
TARGETED ACQUISITIONS
01. 2016 OVERVIEW & OUTLOOK

March 9, 2017 | 13
€4bnTarget
x3
2020 e-commerce prospects
€1.2bn
in 20162020 target
GROSS MERCHANDISE VOLUME
01. 2016 OVERVIEW & OUTLOOK

March 9, 2017 | 14
Omnichannel reinforces multiformat
Increasein average basket
Growthof traffic
Gainnew clients
Rejuvenateclient base
+20% +10%
Hyper-market
Hyper-market
+Drive
Hyper-market
Hyper-market
+Click & Collect
A CLIENT WHO ADOPTS DRIVE OR CLICK & COLLECT SPENDS MORE
01. 2016 OVERVIEW & OUTLOOK
Source : 2016 study based on a panel in France and Spain
March 9, 2017 | 15
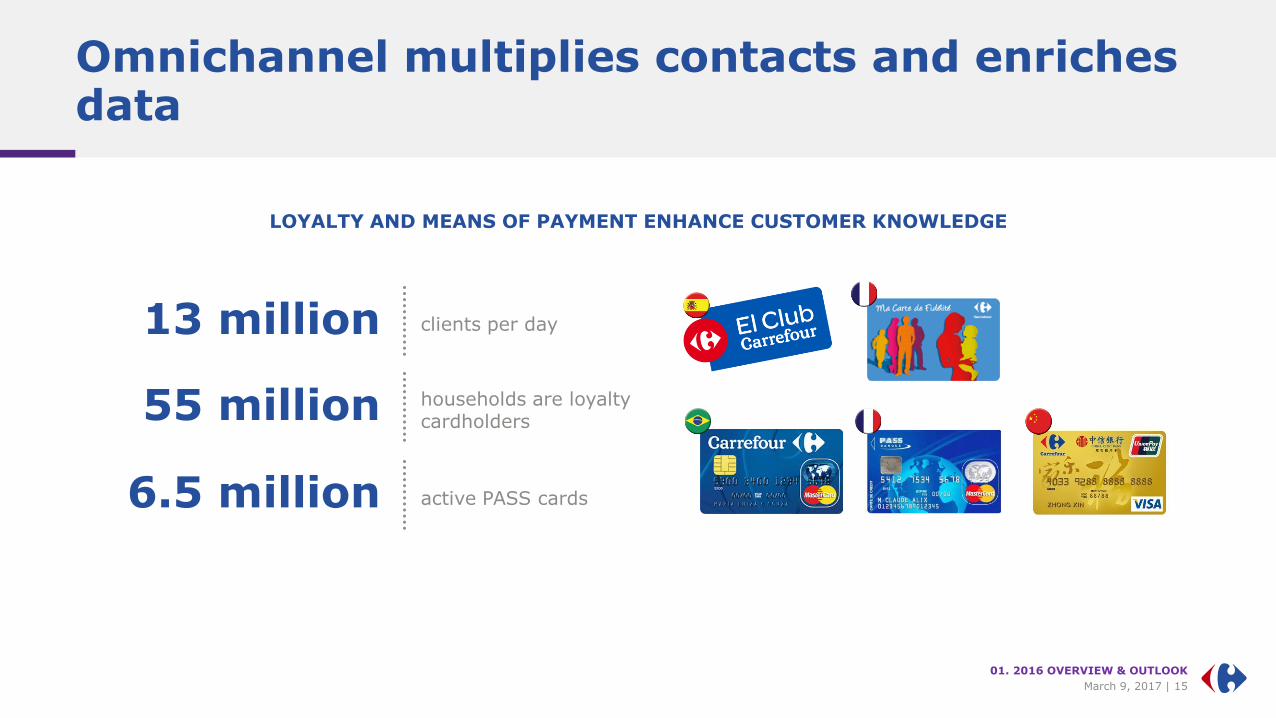
Omnichannel multiplies contacts and enriches data
55 million households are loyalty cardholders
6.5 million active PASS cards
13 million clients per day
LOYALTY AND MEANS OF PAYMENT ENHANCE CUSTOMER KNOWLEDGE
01. 2016 OVERVIEW & OUTLOOK
March 9, 2017 | 16
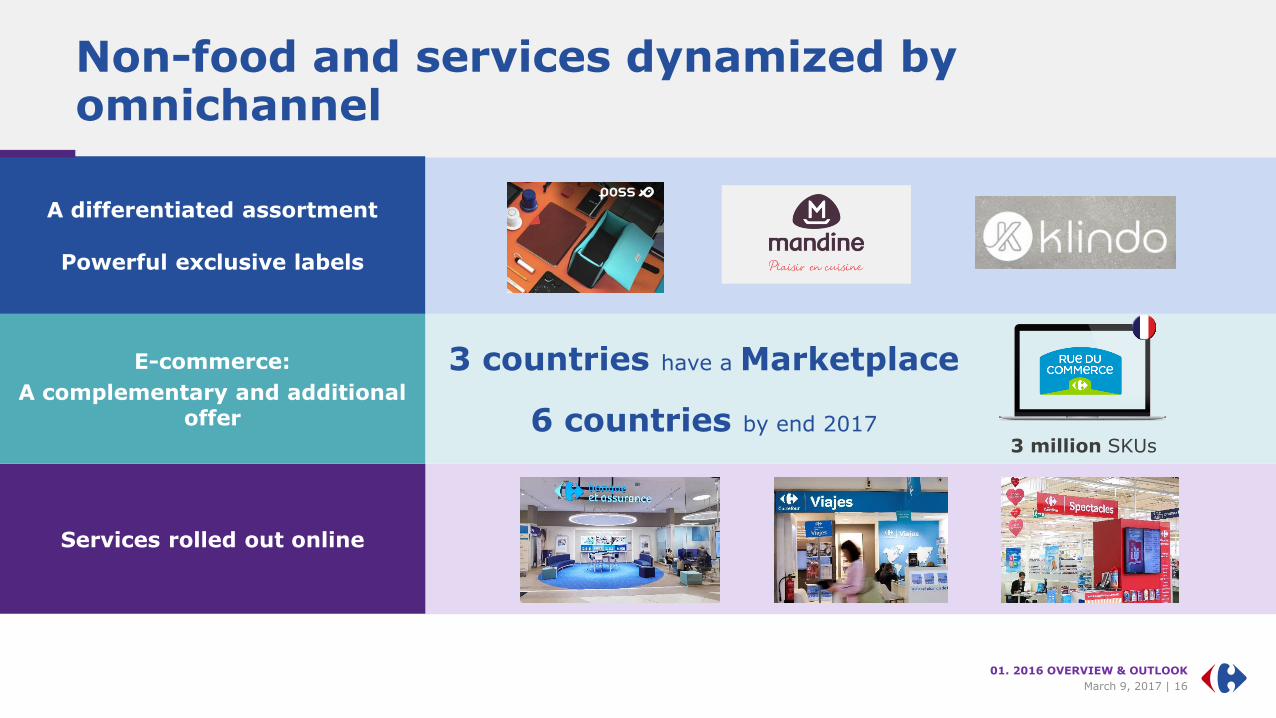
Non-food and services dynamized by omnichannel
A differentiated assortment
Powerful exclusive labels
Services rolled out online
E-commerce:
A complementary and additional offer
3 million SKUs
3 countries have a Marketplace
6 countries by end 2017
01. 2016 OVERVIEW & OUTLOOK

March 9, 2017 | 17
Carrefour, a culture of innovation
ProductsFormats
ServicesConcepts
Experiment
Iterate
Deploy
01. 2016 OVERVIEW & OUTLOOK

March 9, 2017 | 18
SUPECO: C&CFORMAT INSPIRED BY ATACADÃOAND ROLLED OUT IN 4 COUNTRIES TO DATE
FRANCE:MARKET
ST MARCEL
Differentiated formats
ITALIE: CLUSTERIZATION
URBAN ATTRACTIONGOURMET
01. 2016 OVERVIEW & OUTLOOK

March 9, 2017 | 19
Innovative concepts
ITALY: TERRE D’ITALIA RESTAURANT FRANCE: BULK WALL SPAIN: NEW LAYOUT FOR APPLIANCES
SPAIN: NEW FMCG LAYOUT BELGIUM: BEER CELLAR FRANCE: ORGANIC FOOD AREA
01. 2016 OVERVIEW & OUTLOOK

March 9, 2017 | 20
Products that make a difference
FRESH PRODUCE: REAL KNOW-HOW REFLETS DE FRANCE: 600 SKUs ORGANIC FOOD SALES:+32% IN 2016
VEGGIE: THE 1ST VEGETARIAN PRIVATE LABEL « REPACKAGING » OF OWN BRAND
800 CARREFOUR BIO SKUs
TEX: 22% MARKET SHARE IN HYPERS & SUPERS
01. 2016 OVERVIEW & OUTLOOK
March 9, 2017 | 21
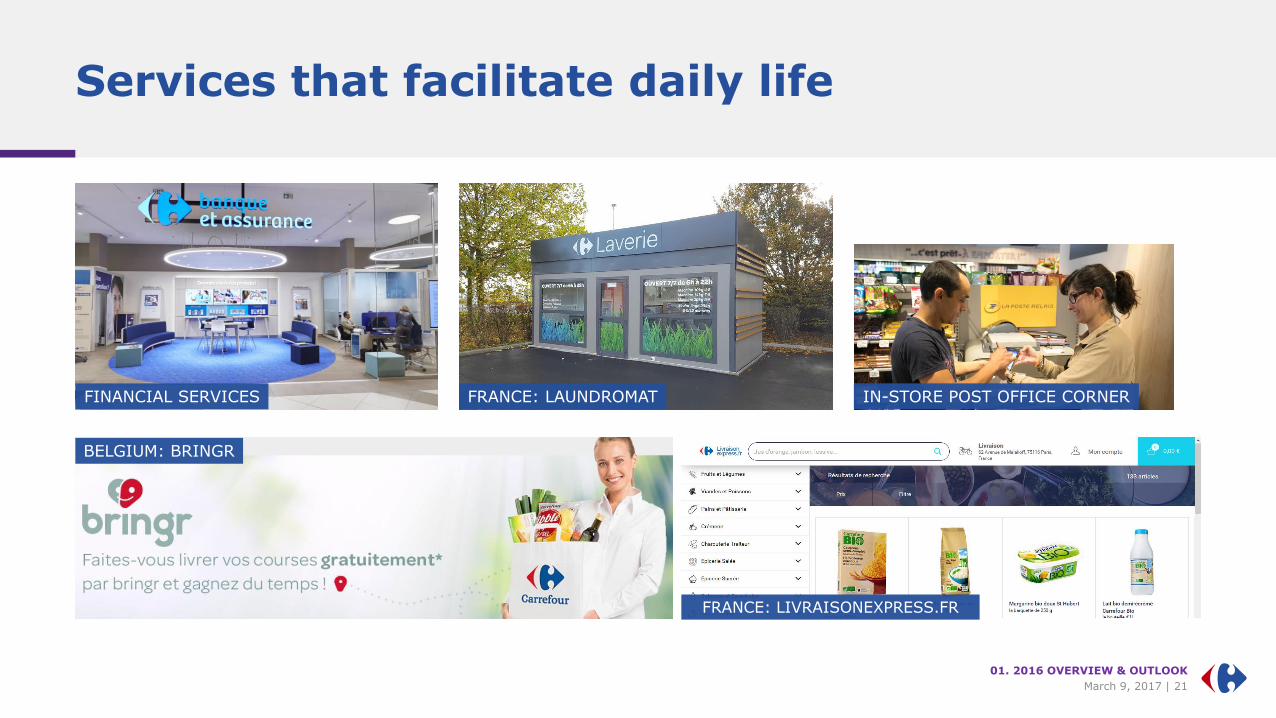
Services that facilitate daily life
01. 2016 OVERVIEW & OUTLOOK
BELGIUM: BRINGR
FRANCE: LIVRAISONEXPRESS.FR
FRANCE: LAUNDROMAT IN-STORE POST OFFICE CORNERFINANCIAL SERVICES

March 9, 2017 | 22
A new collaborative and agile spirit of innovation
Innovation team dedicated to identifying innovative start-ups.
OptiMiam: Fight against food waste
2 HACKATHONSin 2016
129 participants
15 projects
6+ incubations
Cargo
Creation of a dedicated real estate company
for logistics
01. 2016 OVERVIEW & OUTLOOK
France – PIKIT
Connected object allowing to shop online from home
March 9, 2017 | 23
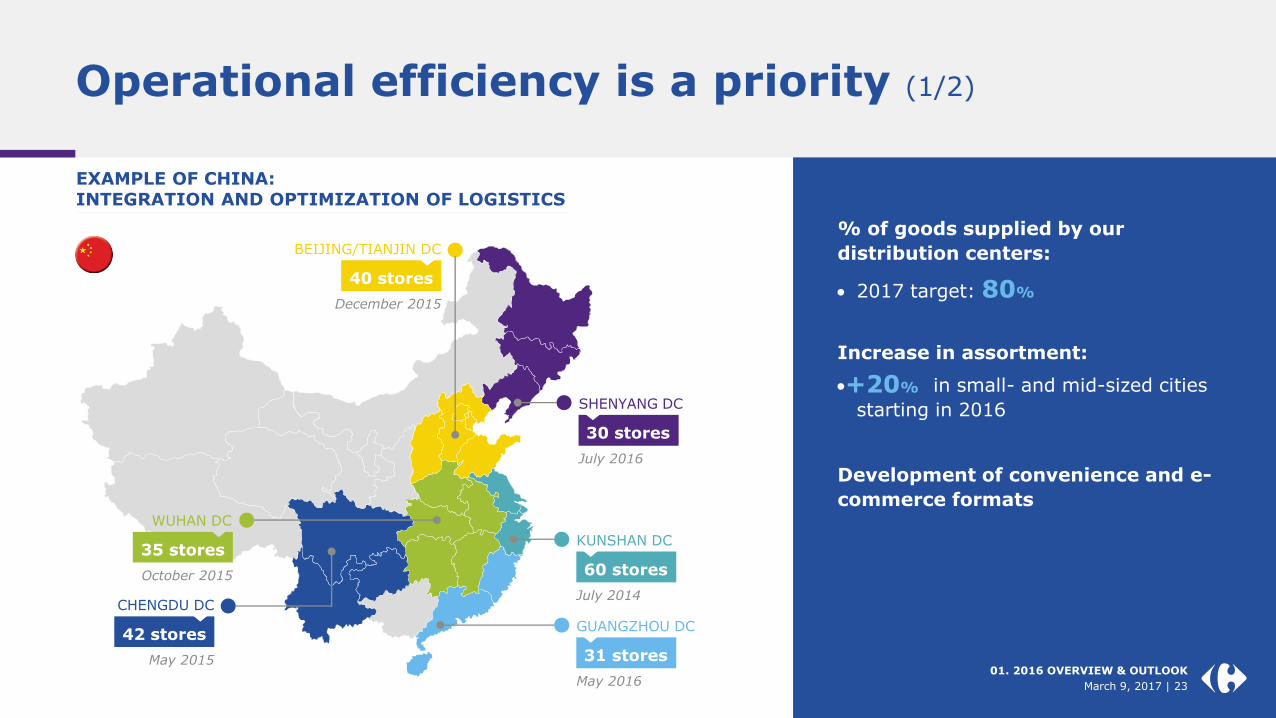
Operational efficiency is a priority (1/2)
EXAMPLE OF CHINA:INTEGRATION AND OPTIMIZATION OF LOGISTICS
30 stores
SHENYANG DC
July 2016
60 stores
KUNSHAN DC
July 2014
31 stores
GUANGZHOU DC
May 2016
40 stores
BEIJING/TIANJIN DC
December 2015
42 stores
CHENGDU DC
May 2015
35 stores
WUHAN DC
October 2015
% of goods supplied by our
distribution centers:
2017 target: 80%
Increase in assortment:
in small- and mid-sized cities
starting in 2016
Development of convenience and e-
commerce formats
+20%
01. 2016 OVERVIEW & OUTLOOK
March 9, 2017 | 23

March 9, 2017 | 24
Operational efficiency is a priority (2/2)
EXAMPLE OF FRANCE: REINFORCED NETWORK OF MULTIFORMAT WAREHOUSES 2018 CARAVELLE TARGETS*
From 67 to 55 warehouses in France
of which 34 are multiformat
Number of Km -20%
Cost of package -5%
Product availability +2%
2013 2018
*2018 targets versus 2012
01. 2016 OVERVIEW & OUTLOOK
March 9, 2017 | 24

March 9, 2017 | 25
CSR:Doing our
job well
CSR contributes to operational efficiency
Reducing wastage
Reduce food waste by 50%
by 2025
Biodiversity
Increase sales of products from Quality Lines and organic farming every year
Training
New skills: data scientists, innovation, job training
Energy
Energy consumption reduced by -9.3% in 2016
01. 2016 OVERVIEW & OUTLOOK
March 9, 2017 | 26
A model strongly focused on value-creation
01. 2016 OVERVIEW & OUTLOOK
March 9, 2017 | 26
March 9, 2017 | 27
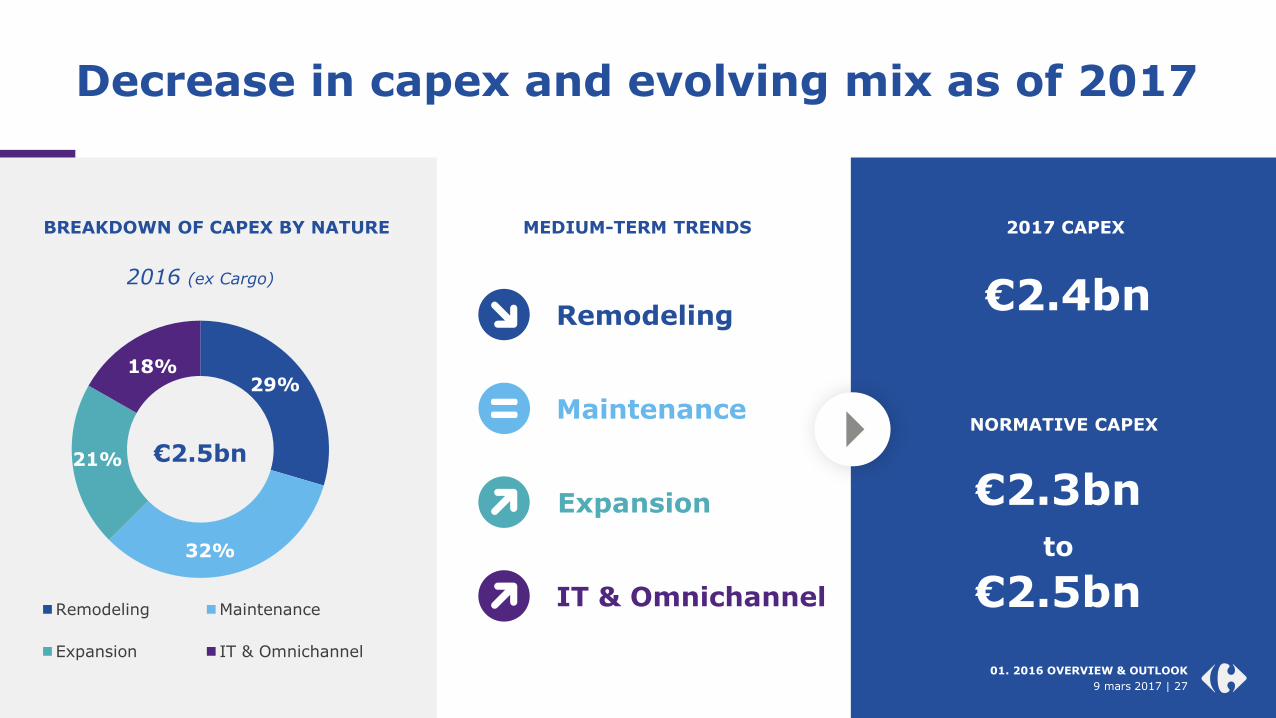
Decrease in capex and evolving mix as of 2017
01. PRÉSENTATION DE L’ANNÉE 2016 & PERSPECTIVES
29%
32%
21%
18%
Remodeling Maintenance
Expansion IT & Omnichannel
€2.5bn
2016 (ex Cargo)
€2.3bn to
€2.5bn
Remodeling
Maintenance
Expansion
IT & Omnichannel
2017 CAPEX
€2.4bn
NORMATIVE CAPEX
9 mars 2017 | 27
01. 2016 OVERVIEW & OUTLOOK
BREAKDOWN OF CAPEX BY NATURE MEDIUM-TERM TRENDS

March 9, 2017 | 28
Value-creation drivers
Solid generation of
operating cash flow
linked to improved results
Disciplined Capex
between €2.3bn and €2.5bn per year (€2.4bn in
2017), with strict Return on Investment criteria and an
evolution in the mix
Control of Working Capital
Requirements
Balanced capital
allocation,
combiningcontinued targeted
acquisitions,
45-50% payout*,
maintaining a BBB+ rating
*of the adjusted net income, Group share
01. 2016 OVERVIEW & OUTLOOK

March 9, 2017 | 29
Financial outlook – 2017 & medium-term
Payout of between 45% and 50% of adjusted net income,
Group share
Capex decrease in 2017 to €2.4bn, and normative capex between €2.3bn and €2.5bn
Planned IPOs of Carmilaand Brazilian operations in 2017,
market conditions permitting
Continued tactical acquisitions
Total sales growth of 3% to 5%
at constant exchange rates in 2017
Continued increase in Free Cash Flow, with a new increase in 2017
01. 2016 OVERVIEW & OUTLOOK

March 9, 2017 | 30
02
2016 FINANCIAL RESULTS

March 9, 2017 | 31
2016 key figures
02. FULL-YEAR 2016 RESULTS
(1) At constant exchange rates
(2) EBITDA: Recurring operating income before depreciation and amortization (including supply chain depreciation)
€76,645m
up
+2.7%(1)
€2,351m
a margin of
3.1%
€1,039m
up
+9.2%
€4,531m
an improvement of
€15m
NET SALES
RECURRING
OPERATING
INCOMEFREE CASH FLOWEX. EXCEPTIONAL ITEMS NET DEBTEBITDA MARGIN(2)
5.1%
a
Stable margin
€1,031m
or
1.39 €/per share
ADJUSTED
NET INCOME,GROUP SHARE

March 9, 2017 | 32
Organic growth of 3.0% in 2016
02. FULL-YEAR 2016 RESULTS
2016 SALES EVOLUTION – (in €m and %)
€76.9bn
+3.0% 0.0%
-0.5%
+0.2%
-3.1%
-0.4%
+3.0%
€79.2bn
+2.7%
€79.0bn €76.6
bn
2015net sales
2016 organic net salesex petrol
ex calendar
2016 net salesat constant exch. rates
2016 net sales
Scope effect1 Petrol & calendar effect
Acquisitions/disposals
Currenciesimpact
LFLex petrol
ex calendar
(1) Scope effect includes store openings/closings and temporary store closures

March 9, 2017 | 33
+1.0%
+2.3%
+3.9%
+3.0%
+3.0%
2012 2013 2014 2015 20162016
Further sales growth
ORGANIC SALES GROWTH EVOLUTION EX PETROL - 2012 TO 2016 – (in %)
02. FULL-YEAR 2016 RESULTS
March 9, 2017 | 33
CAGR2012 – 2016
+2.6%

March 9, 2017 | 34
Gross margin from recurring operations held up well
02. FULL-YEAR 2016 RESULTS
+3.5%
at constantexch. rates
GROSS MARGINFROM RECURRING
OPERATIONS
(in €m) 18,019
17,985
2015
20162016
+10bp
GROSS MARGINFROM RECURRING
OPERATIONS
(as a % of net sales) 23.4%
23.5%
2015
20162016

March 9, 2017 | 35
Good control of operating costs
02. FULL-YEAR 2016 RESULTS
+4.9%
at constantexch. rates
OPERATINGCOSTS
(in €m) 13,070
13,125
2015
20162016
+10bpOPERATING
COSTS
(as a % of net sales,ex. petrol) 18.6%
18.7%
2015
20162016

March 9, 2017 | 36
Stable asset costs as a percentage of sales
02. FULL-YEAR 2016 RESULTS
+2.8%
at constantexch. rates
ASSET COSTS
(in €m) 2,505
2,509
2015
20162016
StableASSET COSTS
(as a % of net sales,ex. petrol) 3.6%
3.6%
2015
20162016

March 9, 2017 | 37
France: ROI reflecting investmentsto prepare for the future
NET SALES
€35,877m
ROI
€1,031m
LFL (1)
+0.3%
MARGIN
2.9%
(1) ex. petrol, ex. calendar 02. FULL-YEAR 2016 RESULTS

March 9, 2017 | 38
Other European countries: Strong increase in profitability
NET SALES
€20,085m
ROI
€712m
LFL (1)
+2.0%
MARGIN
3.5% +70 bps
+ 25.7%at constant exch. rates
(1) ex. petrol, ex. calendar 02. FULL-YEAR 2016 RESULTS

March 9, 2017 | 39
Latin America: Continued strong momentum, driven by Brazil
NET SALES
€14,507m
ROI
€711m
LFL (1)
+13.5%
MARGIN
4.9% Stable
+ 3.7%at constant exch. rates
(1) ex. petrol, ex. calendar 02. FULL-YEAR 2016 RESULTS
March 9, 2017 | 40
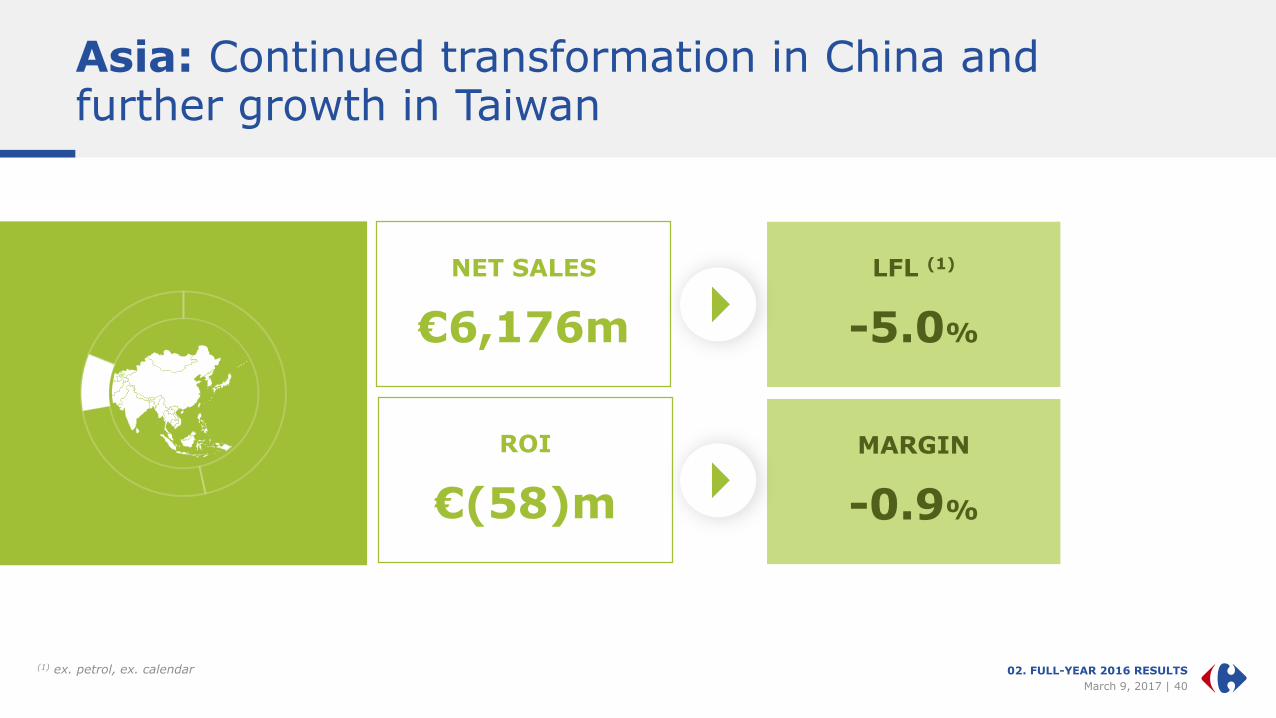
Asia: Continued transformation in China and further growth in Taiwan
NET SALES
€6,176m
ROI
€(58)m
LFL (1)
-5.0%
MARGIN
-0.9%
(1) ex. petrol, ex. calendar 02. FULL-YEAR 2016 RESULTS

March 9, 2017 | 41
Adjusted net income, Group share
02. FULL-YEAR 2016 RESULTS
(in €m) 2015 2016
EBITDA (1) 3,955 3,886
Recurring operating income 2,445 2,351
Net income from associates and JVs 44 -36
Non-recurring income -257 -372
EBIT 2,232 1,943
Net financial expenses -515 -515
Net interest expense -347 -377
Other net financial expenses -168 -138
Income before taxes 1,717 1,428
Income tax expense -597 -494
Effective tax rate 34.8% 34.6%
(in €m) 2015 2016
Net income from continuing operations 1,120 934
Minority share of net income from continuing operations
-143 -148
Net income from continuing operations, Group share
977 786
Net income from discontinued operations, Group share
4 -40
Net income, Group share 980 746
Adjusted net income, Group share 1,113 1,031
Notes : (1) Recurring operating income before depreciation and amortization (including supply chain depreciation)

March 9, 2017 | 42
2016 Free cash flow
02. FULL-YEAR 2016 RESULTS
(in €m) 2015 2016
Gross cash flow 2,733 2,964
Change in working capital 81 351
Discontinued activities 3 -11
Operating cash flow 2,818 3,305
Capital expenditure (ex. Cargo) -2,378 -2,492
Net capital expenditure (Cargo) - -249
Change in net payables to fixed asset suppliers 136 -78
Asset disposals (business-related) 104 118
Discontued operations 7 -
Free cash flow 687 603
Impact of Cargo - -249
Impact of exceptional items -265 -186
Free cash flow from continuing operations, excluding exceptional items 951 1,039
March 9, 2017 | 43
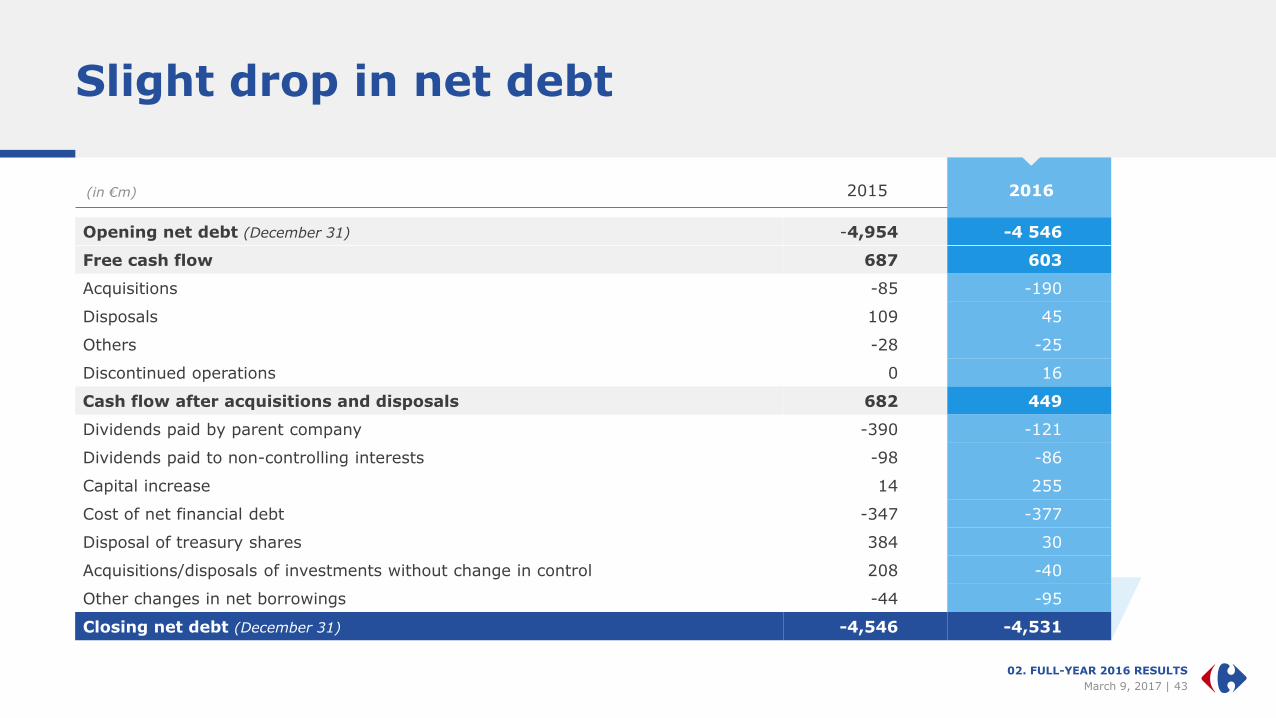
Slight drop in net debt
02. FULL-YEAR 2016 RESULTS
(in €m) 2015 2016
Opening net debt (December 31) -4,954 -4 546
Free cash flow 687 603
Acquisitions -85 -190
Disposals 109 45
Others -28 -25
Discontinued operations 0 16
Cash flow after acquisitions and disposals 682 449
Dividends paid by parent company -390 -121
Dividends paid to non-controlling interests -98 -86
Capital increase 14 255
Cost of net financial debt -347 -377
Disposal of treasury shares 384 30
Acquisitions/disposals of investments without change in control 208 -40
Other changes in net borrowings -44 -95
Closing net debt (December 31) -4,546 -4,531

March 9, 2017 | 44
Credit rating and debt maturity maintained
On April 26, 2016, issua issuance of a €750m bond with a maturity of 8 years and a 0.75% coupon
In 2016, €667m of bonds reached maturity
At end 2016, the debt maturity was 4.1 years
02. FULL-YEAR 2016 RESULTS
1,250
279
1,000 1,000 1,000 1,000
750 750
2.44%
5.25%
1.75%4.00% 3.88%
1.75%0.75% 1.25%
2017 2018 2019 2020 2021 2022 2024 2025
Average annual coupon
DEBT REDEMPTION SCHEDULE – (in %)
2016 issuance
Credit rating maintainted: BBB+
March 9, 207 | 44

March 9, 2017 | 45
Stable proposed dividend: €0.70 per share
02. FULL-YEAR 2016 RESULTS
Dividend of €0,70proposed
to the General Shareholders’
meeting on June 15, 2017
Payout of 51% of
adjusted net income, Group share, in line with our distribution
policy
Payment in
shares or in cash

March 9, 2017 | 46
APPENDIX
March 9, 2017 | 47
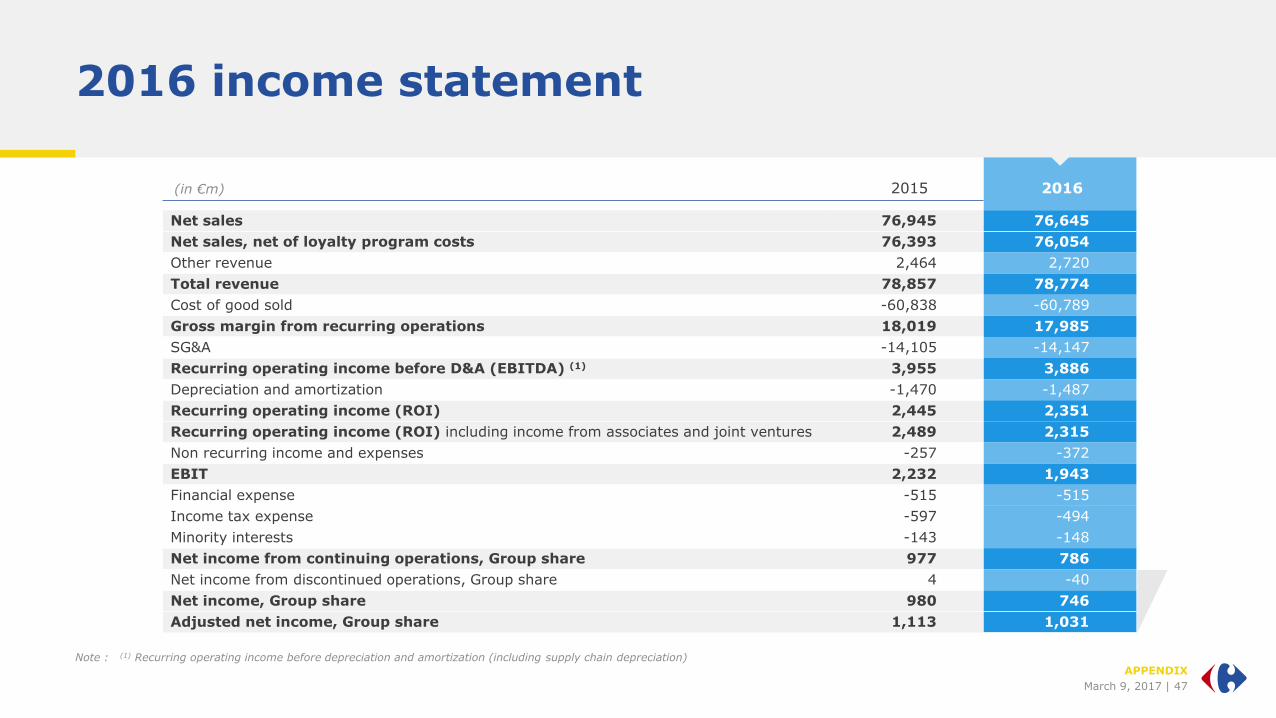
2016 income statement
APPENDIX
Note : (1) Recurring operating income before depreciation and amortization (including supply chain depreciation)
(in €m) 2015 2016
Net sales 76,945 76,645
Net sales, net of loyalty program costs 76,393 76,054
Other revenue 2,464 2,720
Total revenue 78,857 78,774
Cost of good sold -60,838 -60,789
Gross margin from recurring operations 18,019 17,985
SG&A -14,105 -14,147
Recurring operating income before D&A (EBITDA) (1) 3,955 3,886
Depreciation and amortization -1,470 -1,487
Recurring operating income (ROI) 2,445 2,351
Recurring operating income (ROI) including income from associates and joint ventures 2,489 2,315
Non recurring income and expenses -257 -372
EBIT 2,232 1,943
Financial expense -515 -515
Income tax expense -597 -494
Minority interests -143 -148
Net income from continuing operations, Group share 977 786
Net income from discontinued operations, Group share 4 -40
Net income, Group share 980 746
Adjusted net income, Group share 1,113 1,031
March 9, 2017 | 48
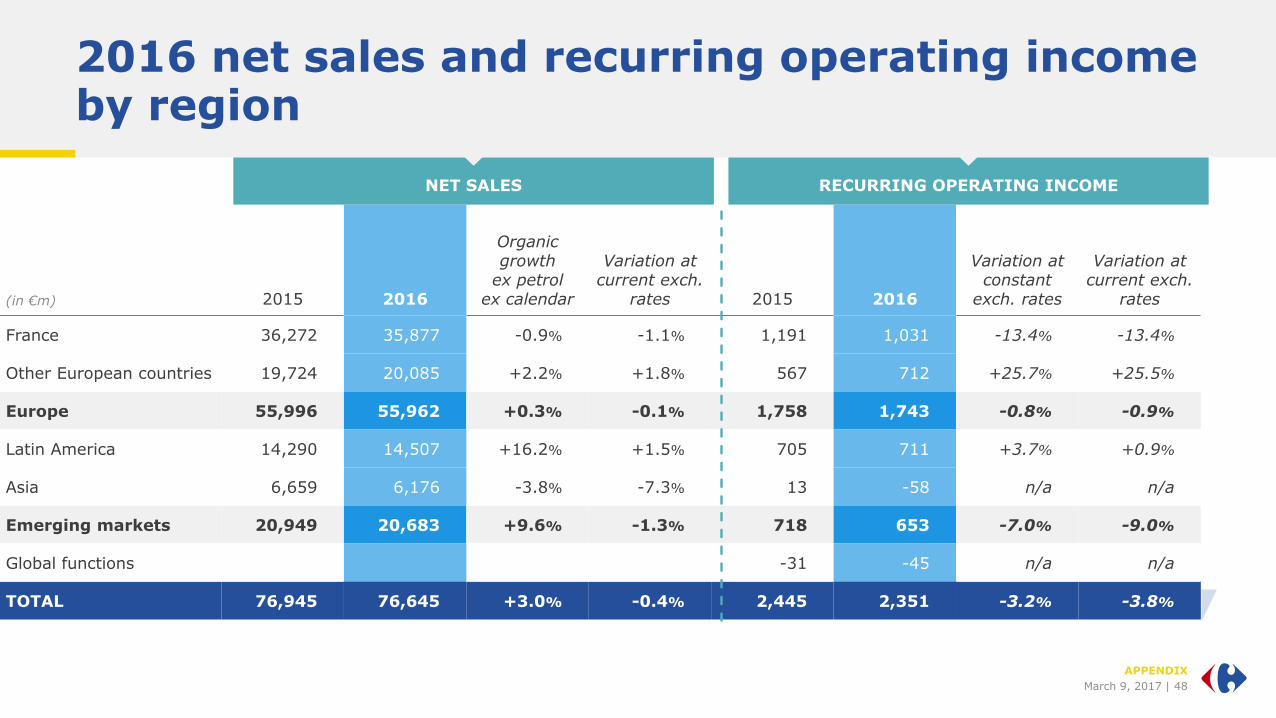
2016 net sales and recurring operating income by region
APPENDIX
(in €m) 2015 2016
Organicgrowth
ex petrolex calendar
Variation at current exch.
rates 2015 2016
Variation at constant
exch. rates
Variation at current exch.
rates
France 36,272 35,877 -0.9% -1.1% 1,191 1,031 -13.4% -13.4%
Other European countries 19,724 20,085 +2.2% +1.8% 567 712 +25.7% +25.5%
Europe 55,996 55,962 +0.3% -0.1% 1,758 1,743 -0.8% -0.9%
Latin America 14,290 14,507 +16.2% +1.5% 705 711 +3.7% +0.9%
Asia 6,659 6,176 -3.8% -7.3% 13 -58 n/a n/a
Emerging markets 20,949 20,683 +9.6% -1.3% 718 653 -7.0% -9.0%
Global functions -31 -45 n/a n/a
TOTAL 76,945 76,645 +3.0% -0.4% 2,445 2,351 -3.2% -3.8%
NET SALES RECURRING OPERATING INCOME

March 9, 2017 | 49
Adjusted net income, Groupe share
APPENDIX
Note : (1) Tax impact of restated items (from non-recurring income and expenses and financial expenses) and non-recurring tax items
(in €m) 2015 2016
Net income from continuing operations, Group share 977 786
Restatement for non-recurring income and expenses (before tax) 257 372
Restatement for exceptional items in net financial expenses 65 30
Tax impact(1) -159 -179
Restatement on share of income from minorities and companies consolidated by the equity method
-27 22
Adjusted net income, Group share 1,113 1,031
March 9, 2017 | 50
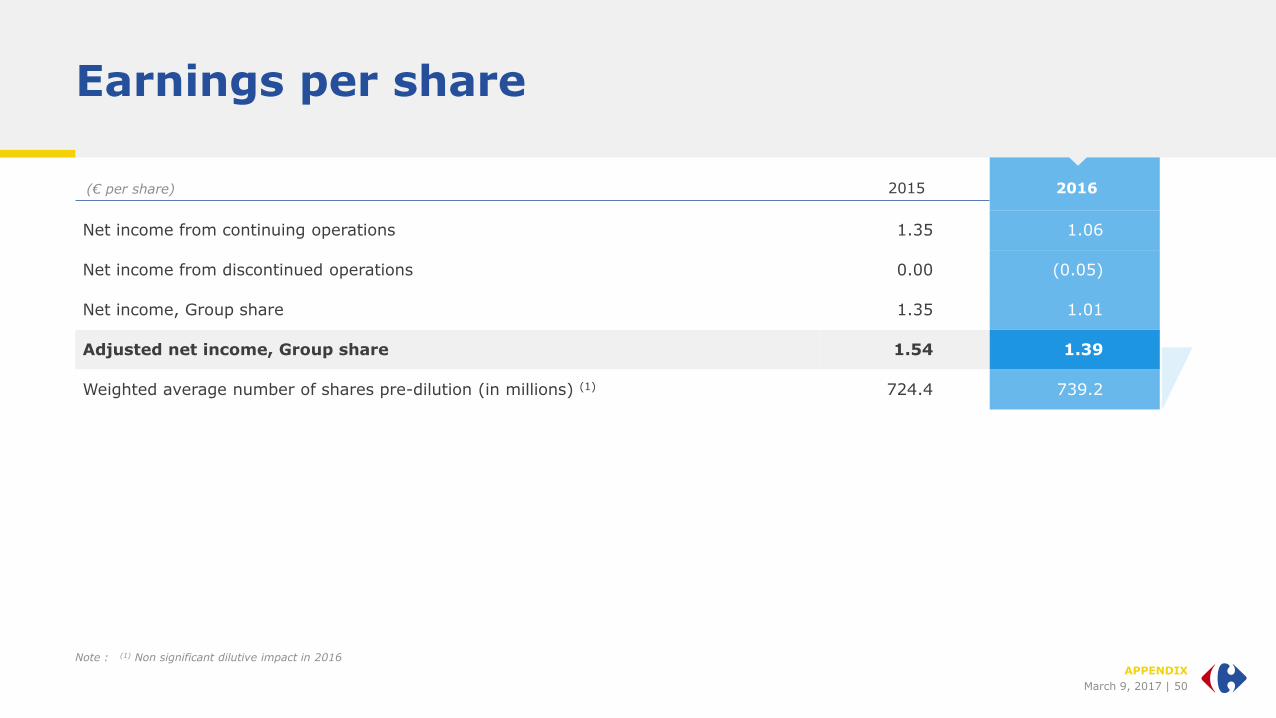
Earnings per share
APPENDIX
Note : (1) Non significant dilutive impact in 2016
(€ per share) 2015 2016
Net income from continuing operations 1.35 1.06
Net income from discontinued operations 0.00 (0.05)
Net income, Group share 1.35 1.01
Adjusted net income, Group share 1.54 1.39
Weighted average number of shares pre-dilution (in millions) (1) 724.4 739.2

March 9, 2017 | 51
Stores under banners1 at end 2016
APPENDIX
Notes : (1) including franchisees and partners; (2) Maghreb, Middle East and Dominican Republic
(#) Hypermarkets Supermarkets Convenience Cash & Carry Total
France 243 1,062 4,222 143 5,670
Spain 175 129 545 849
Belgium 45 442 285 772
Italy 57 412 586 13 1,068
Poland 86 159 641 886
Romania 32 213 53 298
Others 44 422 202 668
Other European countries 439 1,777 2,312 13 4,541
Argentina 79 126 398 603
Brazil 237 42 70 349
Latin America 316 168 468 0 952
China 229 25 254
Taiwan 64 30 94
Others 81 8 2 2 93
Asia 374 38 27 2 441
Others (2) 90 182 46 13 331
Total 1,462 3,227 7,075 171 11,935
March 9, 2017 | 52
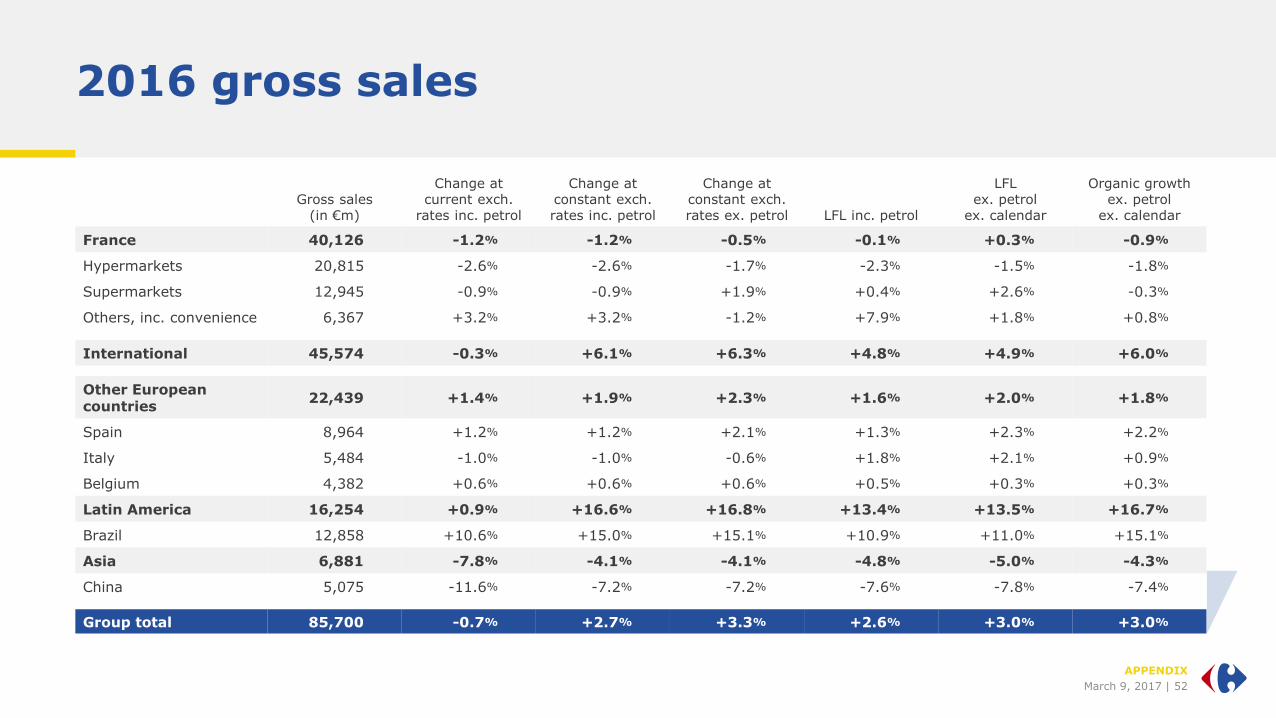
2016 gross sales
APPENDIX
Gross sales(in €m)
Change at current exch.
rates inc. petrol
Change at constant exch. rates inc. petrol
Change at constant exch. rates ex. petrol LFL inc. petrol
LFLex. petrol
ex. calendar
Organic growthex. petrol
ex. calendar
France 40,126 -1.2% -1.2% -0.5% -0.1% +0.3% -0.9%
Hypermarkets 20,815 -2.6% -2.6% -1.7% -2.3% -1.5% -1.8%
Supermarkets 12,945 -0.9% -0.9% +1.9% +0.4% +2.6% -0.3%
Others, inc. convenience 6,367 +3.2% +3.2% -1.2% +7.9% +1.8% +0.8%
International 45,574 -0.3% +6.1% +6.3% +4.8% +4.9% +6.0%
Other Europeancountries
22,439 +1.4% +1.9% +2.3% +1.6% +2.0% +1.8%
Spain 8,964 +1.2% +1.2% +2.1% +1.3% +2.3% +2.2%
Italy 5,484 -1.0% -1.0% -0.6% +1.8% +2.1% +0.9%
Belgium 4,382 +0.6% +0.6% +0.6% +0.5% +0.3% +0.3%
Latin America 16,254 +0.9% +16.6% +16.8% +13.4% +13.5% +16.7%
Brazil 12,858 +10.6% +15.0% +15.1% +10.9% +11.0% +15.1%
Asia 6,881 -7.8% -4.1% -4.1% -4.8% -5.0% -4.3%
China 5,075 -11.6% -7.2% -7.2% -7.6% -7.8% -7.4%
Group total 85,700 -0.7% +2.7% +3.3% +2.6% +3.0% +3.0%

March 9, 2017 | 53
2016 capex breakdown
29%
32%
21%
18%
41%
6%25%
21%
7%
2016 CAPEX
€2,492m(ex Cargo)
Remodelling Maintenance
Expansion IT & omnichannel
France Europe
LatinAmerica
Asia
DIA
APPENDIX
BREAKDOWN OF CAPEXBY NATURE
BREAKDOWN OF CAPEXBY REGION

March 9, 2017 | 54
Hypermarkets: The format for routine shopping needs
With low prices all year round, in-store animations and promotions
1,328 stores ranging from 2,400 m² to 23,000 m²
Banner : 439 stores in other European countries
182 stores in Latin America
243 stores in France
374 storesin Asia
90 stores in other countries
APPENDIX
March 9, 207 | 54
March 9, 2017 | 55
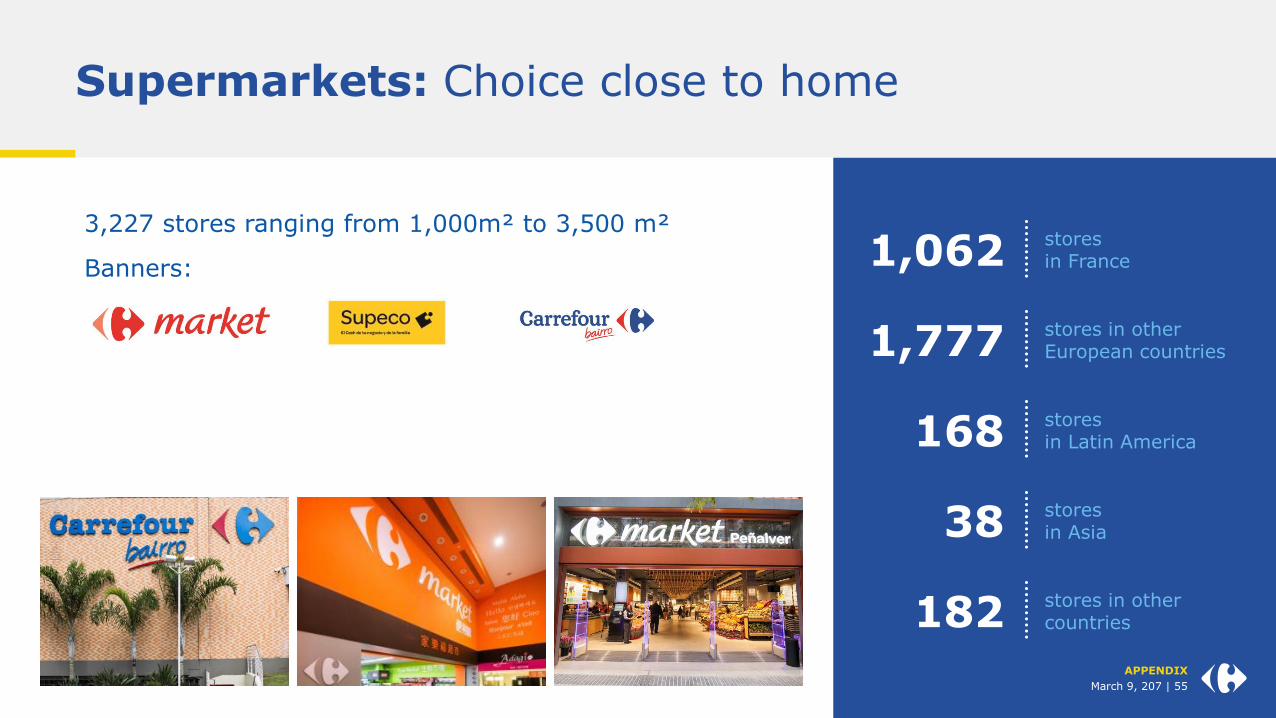
Supermarkets: Choice close to home
APPENDIX
3,227 stores ranging from 1,000m² to 3,500 m²
Banners:
1,777 stores in other European countries
168 stores in Latin America
1,062 stores in France
38 storesin Asia
182 stores in other countries
March 9, 207 | 55

March 9, 2017 | 56
Convenience: Essential daily products
APPENDIX
Catering to daily shopping needs with extended shopping hours
7,075 stores ranging from 200 m² to 900 m²
Banners: 2,312 stores in other European countries
468 stores in Latin America
4,222 stores in France
27 storesin Asia
46 stores in other countries
March 9, 207 | 56

March 9, 2017 | 57
Cash & Carry: Wholesale prices and customized services
APPENDIX
305 stores
Banners:
13 stores in other European countries
134 stores in Latin America
143 stores in France
2 storesin Asia
13 stores in other countries
March 9, 207 | 57

Disclaimer
This presentation contains both historical and forward-looking statements. These
forward-looking statements are based on Carrefour management's current views and
assumptions. Such statements are not guarantees of future performance of the
Group. Actual results or performances may differ materially from those in such
forward-looking statements as a result of a number of risks and uncertainties,
including but not limited to the risks described in the documents filed with the Autorité
des Marchés Financiers as part of the regulated information disclosure requirements
and available on Carrefour's website (www.carrefour.com), and in particular the
Annual Report (Document de Référence). These documents are also available in the
English language on the company's website. Investors may obtain a copy of these
documents from Carrefour free of charge. Carrefour does not assume any obligation
to update or revise any of these forward-looking statements in the future.