Embed Size (px)
Citation preview

MARCH 2019 INVESTOR MEETINGS

March 12, 2019 – P.2
Safe harbor
FORWARD-LOOKING STATEMENTS• This presentation contains certain forward-looking information within the meaning of the Private Securities Litigation Reform Act of 1995.
The words “may,” “will,” “expect,” “intend,” “estimate,” “anticipate,” “aspiration,” “objective,” “project,” “believe,” “continue,” “on track” or “target” or the negative thereof and similar expressions, among others, identify forward-looking statements. All forward looking statements are based on information currently available to management. Such forward-looking statements are subject to certain risks and uncertainties that could cause events and the Company’s actual results to differ materially from those expressed or implied. Please see the disclosure regarding forward-looking statements immediately preceding Part I of the Company’s Annual Report on the most recently filed Form 10-K. The company assumes no obligation to update any forward-looking statements.
REGULATION G• This presentation includes certain non-GAAP financial measures like EBITDA and other measures that exclude special items such as
restructuring and other unusual charges and gains that are volatile from period to period. Management of the company uses the non-GAAP measures to evaluate ongoing operations and believes that these non-GAAP measures are useful to enable investors to perform meaningful comparisons of current and historical performance of the company. All non-GAAP data in the presentation are indicated by footnotes. Tables showing the reconciliation between GAAP and non-GAAP measures are available at the end of this presentation and on the Greif website at www.greif.com.
March 12, 2019 – P.3
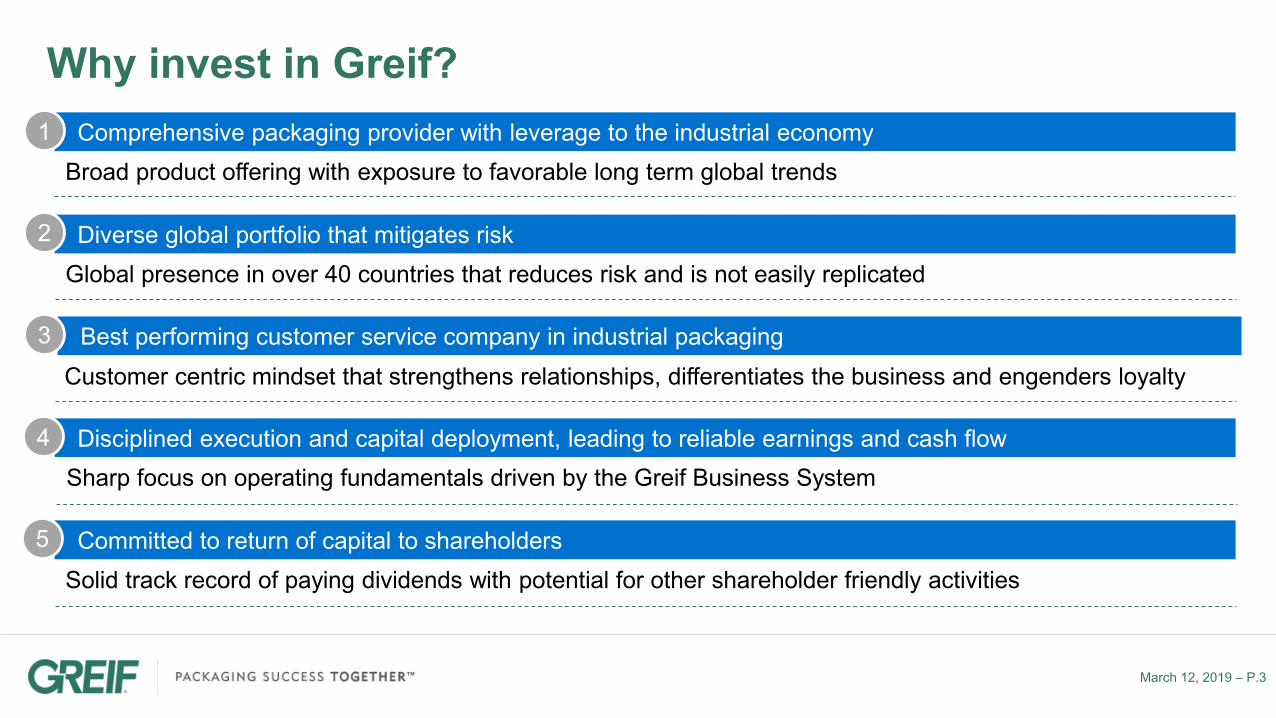
Why invest in Greif?Comprehensive packaging provider with leverage to the industrial economy
Broad product offering with exposure to favorable long term global trends1
Diverse global portfolio that mitigates riskGlobal presence in over 40 countries that reduces risk and is not easily replicated
2
Best performing customer service company in industrial packagingCustomer centric mindset that strengthens relationships, differentiates the business and engenders loyalty
3
Disciplined execution and capital deployment, leading to reliable earnings and cash flowSharp focus on operating fundamentals driven by the Greif Business System
4
Committed to return of capital to shareholdersSolid track record of paying dividends with potential for other shareholder friendly activities
5

March 12, 2019 – P.4
Global, diversified industrial packaging solutions providerFY 2018 Portfolio CompositionFiscal 2018 Snapshot ($M)
2018 Sales Mix
Net Sales: $3,873.8
Gross Profit: $788.9
% Margin: 20.4%
OPBSI(1): $391.7
% of Net Sales: 10.1%
Free Cash Flow(2): $177.8
(1) A summary of all adjustments for special items that are included in the operating profit before special items is set forth in the appendix of this presentation.
(2) Free cash flow is defined as net cash provided by operating activities less cash paid for capital expenditures and excludes a one time $65 million dollar pension contribution made in 2018
Note: A reconciliation of the differences between all non-GAAP financial measures used in this presentation with the most directly comparable GAAP financial measures is included in the appendix of this presentation.
Sales / OPBSI(1)Rigid Industrial Packaging & Services (RIPS)
Steel, fibre and plastic drums Rigid intermediate bulk containers Closure systems for industrial packaging products Transit protection products and water bottles Reconditioned industrial steel and plastic containers
$2,623.6 / $206.3
Sales / OPBSI(1)Paper Packaging & Services (PPS)
Containerboard Corrugated sheets Other corrugated products
$898.5 / $158.8
Sales / OPBSI(1)Flexible Products & Services (FPS)
Flexible intermediate bulk Other flexible products for a variety of applications
$324.2 / $19.3
Sales / OPBSI(1)Land Management (LM)
Timber and timberland Special use properties
$27.5 / $7.3
By Geography
EMEA
APAC & Other
United States
By Segment
RIPSPPS
FPS LM

March 12, 2019 – P.5
Leading product positions across multiple substrates
Fibre
#1
IBC
#3
Closures
#1
Plastic
#2
#1
Steel
#1
Flexible IBCs
Note: Ranking denotes standing in global market. Based on company estimates.
Industrial Packaging
Tube & Core CPG
Upstream Operations
Uncoated Recycled Paperboard (URB)
Coated Recycled Paperboard (CRB)
#1
#3
#1 Leading Producer
Recovered Fiber Group
Top 10

March 12, 2019 – P.6
Global footprint with presence in over 40 countries

March 12, 2019 – P.7
Key strategic priorities and strategy in place
In industrial packaging, be the best performing customer service company in the world
People and Teams Customer Service Excellence Performance
• Environment, health and safety
• Colleague engagement
• Accountability aligned to value creation
• Deliver superior customer satisfaction
• Create value for our customers through a solutions based approach
• Earn our customers trust and loyalty
• Growth aligned to value
• Margin expansion via Greif Business System execution
• Fiscal discipline and free cash flow expansion
THE GREIF WAY
Our strategy is to be the premier global industrial packaging solutions provider, creating value for our customers with the most diversified products and services offering
Note: According to Gallup’s State of the American Workplace, work units in the top quartile in employee engagement outperformed bottom-quartile units by 10% on customer ratings, 22% in profitability, and 21% in productivity.
Vision
Priorities
Values
March 12, 2019 – P.8
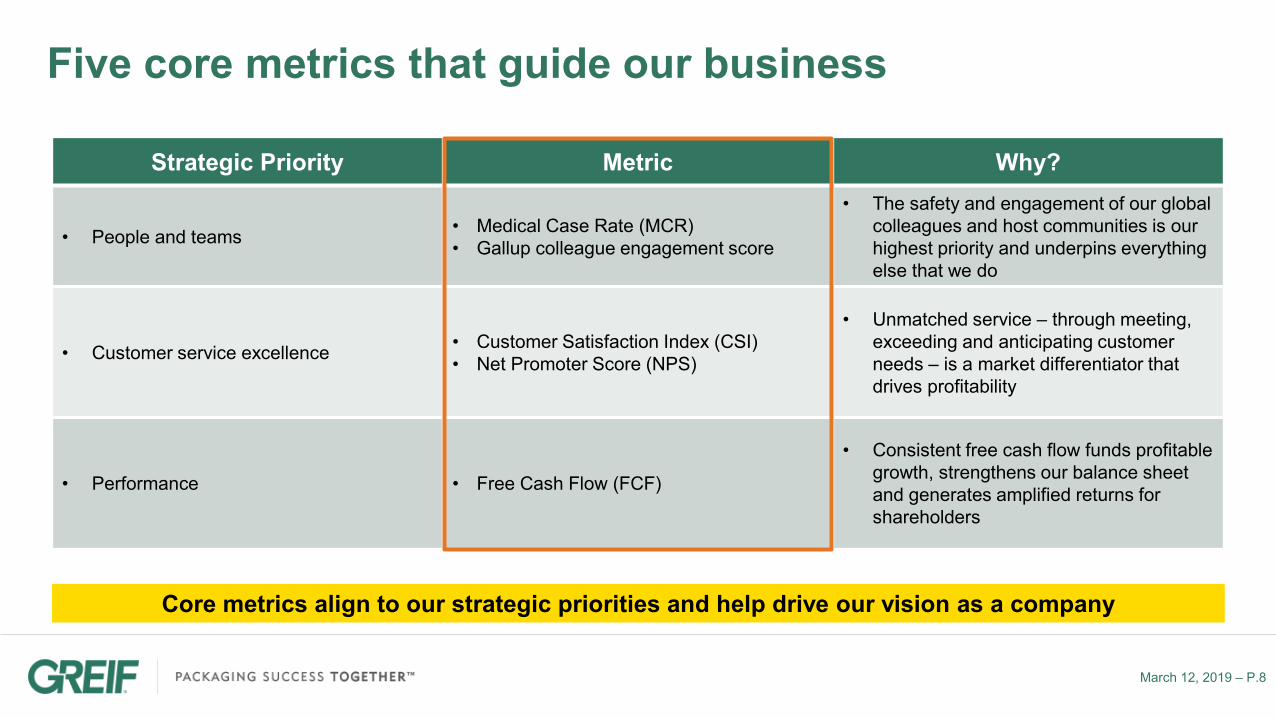
Five core metrics that guide our business
Strategic Priority Metric Why?
• People and teams • Medical Case Rate (MCR)• Gallup colleague engagement score
• The safety and engagement of our global colleagues and host communities is our highest priority and underpins everything else that we do
• Customer service excellence • Customer Satisfaction Index (CSI)• Net Promoter Score (NPS)
• Unmatched service – through meeting, exceeding and anticipating customer needs – is a market differentiator that drives profitability
• Performance • Free Cash Flow (FCF)
• Consistent free cash flow funds profitable growth, strengthens our balance sheet and generates amplified returns for shareholders
Core metrics align to our strategic priorities and help drive our vision as a company
March 12, 2019 – P.9
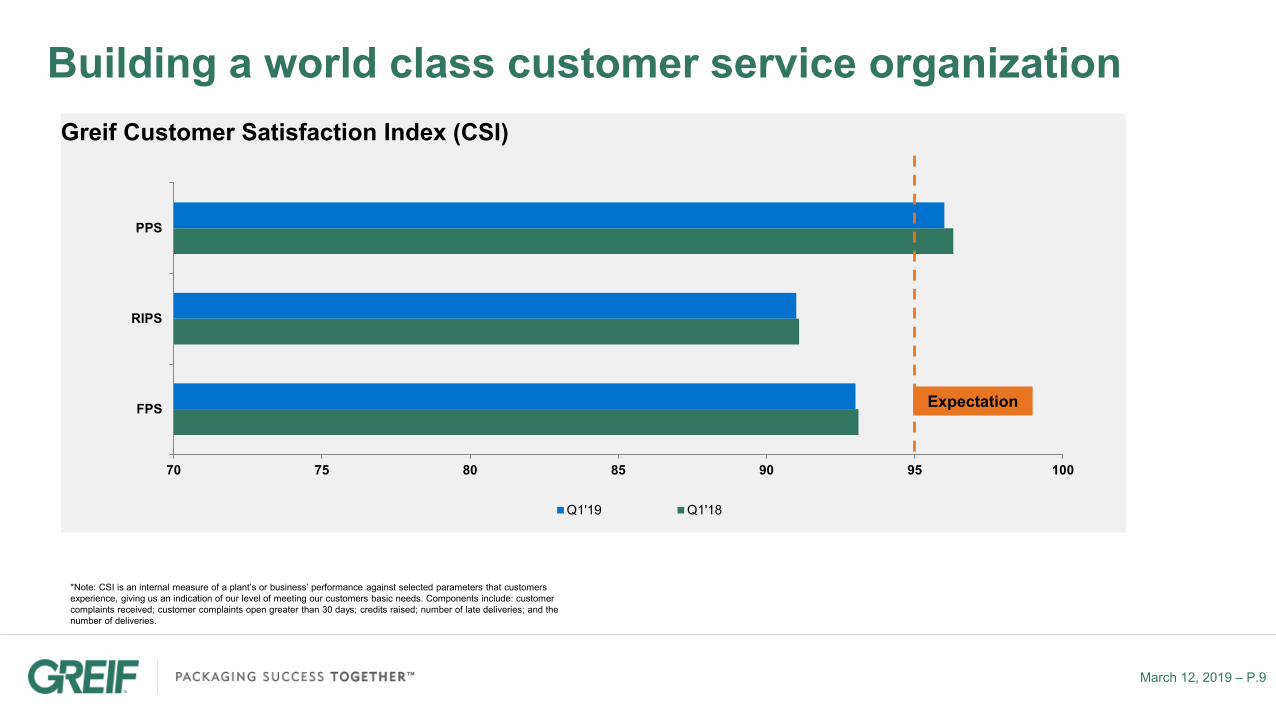
70 75 80 85 90 95 100
FPS
RIPS
PPS
Q1'19 Q1'18
*Note: CSI is an internal measure of a plant’s or business’ performance against selected parameters that customers experience, giving us an indication of our level of meeting our customers basic needs. Components include: customer complaints received; customer complaints open greater than 30 days; credits raised; number of late deliveries; and the number of deliveries.
Greif Customer Satisfaction Index (CSI)
Expectation
Building a world class customer service organization

March 12, 2019 – P.10
Improved financial performance with additional upside
(1) A summary of all special items that are excluded from operating profit before special items is set forth in the appendix of this presentation
Note: A reconciliation of the differences between all non-GAAP financial measures used in this presentation with the most directly comparable GAAP financial measures is included in the appendix of this presentation.
$0
$50
$100
$150
$200
$250
$300
$350
$400
$450
$500
2016 2017 2018 2020 Commitment
Operating Profit Before Special Items ($M)(1)

March 12, 2019 – P.11
Near term capital priorities focused on de-leveragingFiscal 2019 capital priorities
Reinvest in the business
• Fund maintenance and organic growth opportunities that exceed required returns
Maintain annual dividend and periodically review
• Class A and B shares currently yield ~4% and ~5%,respectively
De-leverage the balance sheet
• Target leverage ratio between 2.0 – 2.5x within 36-48 months of Caraustar deal closing
Grow the business
• Advance opportunistic capital options if justified by returns
1Net debt is defined as total debt less cash and cash equivalents.2Adjusted EBITDA is defined as net income, plus interest expense, net, plus income tax expense, plus depreciation, depletion and amortization expense, plus restructuring charges, plus acquisition-related costs, plus non-cash impairment charges, less gain ondisposal of properties, plants, equipment and businesses, net.
Anticipated path to de-leveraging(Net debt1 to trailing four quarter Adj. EBITDA2)
~3.6x
~3.0x ~3.0x to
~2.5x
~2.5x to ~2.0x ~2.0x
.0x
.5x
1.0x
1.5x
2.0x
2.5x
3.0x
3.5x
4.0x
Caraustaracquisition
close
YE 2019 YE 2020 YE 2021 YE 20220.0x
0.5x
Robust FCF generation will drive de-leveraging by a half turn or better each year

March 12, 2019 – P.12
Pursuing three avenues to growth
Any investment pursued must demonstrate an adequate return in line with new risk framework
Organic Growth Capital Expansion Merger & Acquisition
• Strategic customer share expansion via broad portfolio of products and services
• Alignment of resources to targeted end use markets and profit pools (value over volume)
• Customer service differentiation
• Guided by strategy alignment to customer needs, markets, products / services, innovation
• Expansion of existing manufacturing facilities
• New manufacturing expansion in existing geographic footprint
• Growth aligned to serve strategic customer needs and current end use markets that extends from our core businesses
1 2 3
March 12, 2019 – P.13
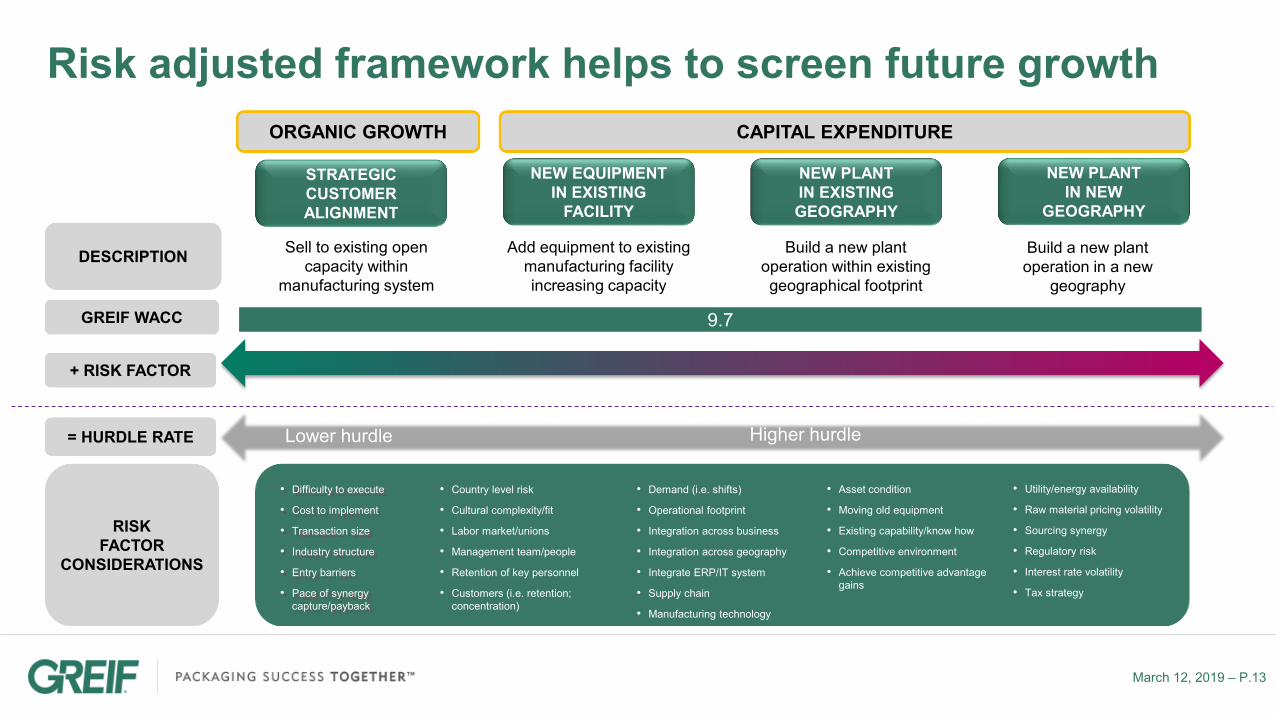
NEW EQUIPMENT IN EXISTING
FACILITY
NEW PLANTIN EXISTING GEOGRAPHY
RISK FACTOR
CONSIDERATIONS
NEW PLANTIN NEW
GEOGRAPHY
STRATEGIC CUSTOMER ALIGNMENT
Sell to existing open capacity within
manufacturing system
Add equipment to existing manufacturing facility increasing capacity
Build a new plant operation within existing geographical footprint
Build a new plant operation in a new
geography
DESCRIPTION
• Difficulty to execute
• Cost to implement
• Transaction size
• Industry structure
• Entry barriers
• Pace of synergy capture/payback
• Country level risk
• Cultural complexity/fit
• Labor market/unions
• Management team/people
• Retention of key personnel
• Customers (i.e. retention; concentration)
• Demand (i.e. shifts)
• Operational footprint
• Integration across business
• Integration across geography
• Integrate ERP/IT system
• Supply chain
• Manufacturing technology
• Asset condition
• Moving old equipment
• Existing capability/know how
• Competitive environment
• Achieve competitive advantage gains
• Utility/energy availability
• Raw material pricing volatility
• Sourcing synergy
• Regulatory risk
• Interest rate volatility
• Tax strategy
CAPITAL EXPENDITURE
9.7GREIF WACC
+ RISK FACTOR
= HURDLE RATE Lower hurdle Higher hurdle
ORGANIC GROWTH
Risk adjusted framework helps to screen future growth

March 12, 2019 – P.14
ACQUISITION
GEOGRAPHIC EXPANSION
PRODUCT ADJACENCY
PRODUCT EXPANSION / NEW
PLATFORM
CONSOLIDATION OF CURRENT FOOTPRINT
Acquisition of competitor in a geography that Greif currently operates in (e.g.
roll-up; consolidation)
Acquisition of competitor outside of
Greif’s current manufacturing footprint
but that operates in Greif’s core business
Acquisition of a company providing new products and services close to Greif’s current core
business and within Greif’s existing channel
Acquisition of a company providing new products and services outside of
Greif’s current core business via a new
channel
DESCRIPTION
RISK FACTOR
CONSIDERATIONS
• Difficulty to execute
• Cost to implement
• Transaction size
• Industry structure
• Entry barriers
• Pace of synergy capture/payback
• Country level risk
• Cultural complexity/fit
• Labor market/unions
• Management team/people
• Retention of key personnel
• Customers (i.e. retention; concentration)
• Demand (i.e. shifts)
• Operational footprint
• Integration across business/geography
• Integrate ERP/IT system
• Supply chain
• Manufacturing technology
• Asset condition
• Moving old equipment
• Existing capability/know how
• Competitive environment
• Achieve competitive advantage gains
• Utility/energy availability
• Raw material pricing volatility
• Sourcing synergy
• Regulatory risk
• Interest rate volatility
• Tax strategy
PROCESSADJACENCY
Acquisition of a company with a production process
that is similar to Greif’s current production
process
9.7GREIF WACC
+ RISK FACTOR
= HURDLE RATE Lower hurdle Higher hurdle
Risk adjusted framework helps to screen future growth
March 12, 2019 – P.15
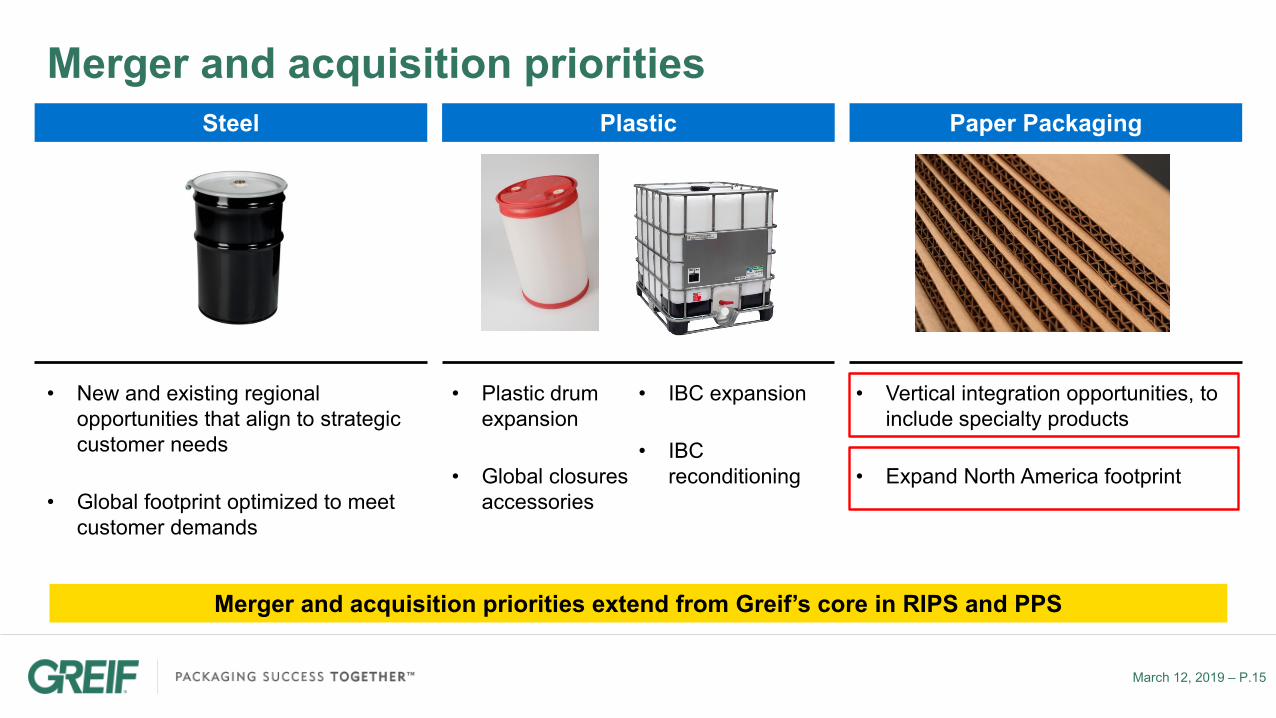
Merger and acquisition priorities extend from Greif’s core in RIPS and PPS
Steel Plastic Paper Packaging
Merger and acquisition priorities
• New and existing regional opportunities that align to strategic customer needs
• Global footprint optimized to meet customer demands
• Plastic drum expansion
• Global closures accessories
• IBC expansion
• IBC reconditioning
• Vertical integration opportunities, to include specialty products
• Expand North America footprint

ACQUISITION OF CARAUSTAR INDUSTRIESSignificantly Enhances Margins and Free Cash Flow
Strengthening its Leadership in Industrial Packaging
March 12, 2019 – P.17
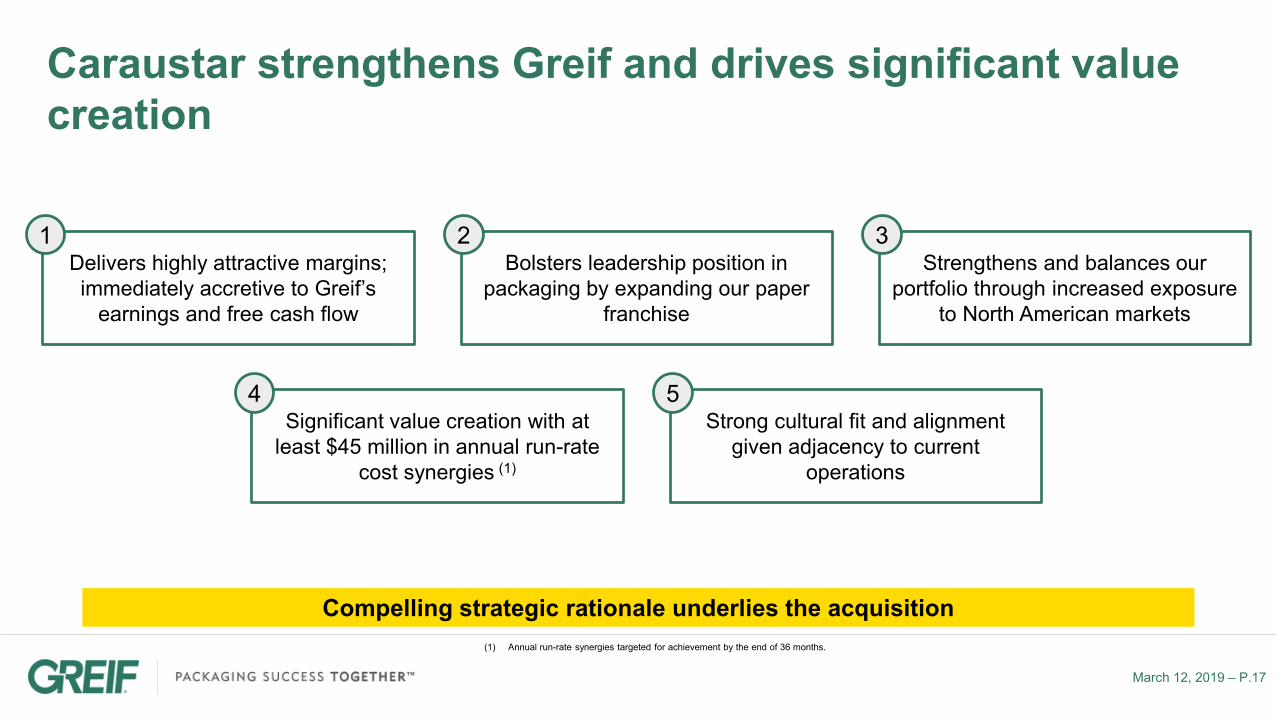
Caraustar strengthens Greif and drives significant value creation
Delivers highly attractive margins; immediately accretive to Greif’s
earnings and free cash flow
1Bolsters leadership position in
packaging by expanding our paper franchise
2Strengthens and balances our
portfolio through increased exposure to North American markets
3
Significant value creation with at least $45 million in annual run-rate
cost synergies (1)
4Strong cultural fit and alignment
given adjacency to current operations
5
(1) Annual run-rate synergies targeted for achievement by the end of 36 months.
Compelling strategic rationale underlies the acquisition

March 12, 2019 – P.18
Caraustar acquisition closed February 11, 2019
Consideration • $1.8 billion total consideration, corresponding to 8.2x the run-rate EBITDA of $220 million, or 6.8x the synergized run-rate EBITDA(3) of $265 million
Compelling strategic
combination
• Combined pro-forma revenue of $5.3 billion and EBITDA(1) of more than $720 million• Generates earnings accretion and substantial free cash flow accretion within first year• Creates at least $45 million in annual run-rate cost synergy opportunities(2) and performance improvements• Strengthens and balances Greif’s existing portfolio• Expected to increase Greif’s pro-forma U.S. sales to approximately two-thirds of total consolidated sales
from approximately half in fiscal year 2018• Strong cultural fit and operational alignment
Financing• Funded via new $500M senior debt issuance; revolver draw and Term Loan A• Pro-forma leverage = ~3.6x, robust free cash flow enables rapid deleveraging to 2.0x – 2.5x within 36 – 48
months• New financing reduced Greif’s overall cash interest rate by roughly 50 basis points to ~4.9%
(1) Combined revenue and EBITDA includes Greif data for Fiscal 2018 (sales and EBITDA BSI) and Caraustar data for the last twelve months as of 9/30/18. Caraustar EBITDA is a run rate figure.
(2) Annual run-rate synergies targeted for achievement by the end of 36 months.(3) Caraustar last twelve month EBITDA as of 9/30/18 was $174M. Based on trailing twelve month actual volume, adjusted for current market
conditions, the run- rate EBITDA is $220 million. EBITDA is defined as earnings before interest and taxes, plus depreciation and amortization. Run rate synergies estimated to be $45 million.

March 12, 2019 – P.19
Caraustar at a glanceKey Caraustar Figures (1) Business Highlights
$1.4 BillionSales
$220 MillionEBITDA
16.0%EBITDA Margin
$177 Million2
Free Cash Flow
Caraustar is a leading vertically-integrated paperboard manufacturer that operates across four primary
segments in North America
• Leader in uncoated recycled paperboard and Tube & Core products
• Diverse mix of specialty products, customers and end markets, manufactured to a wide range of specifications and volumes across categories
• Vertically integrated platform, from recycled fiber processing to recycled paperboard production to industrial / consumer converting operations
• Scalable platform for further growth; proven acquisition track record
(1) Caraustar data for the last twelve months as of 9/30/18. EBITDA is a run rate figure.(2) Free cash flow defined as run-rate EBITDA less capital expenditure.
Geographic Footprint
Headquarters
Recycled Fiber (23)
Mills (12)
Industrial Products (45)
Consumer Products (7)

March 12, 2019 – P.20
Caraustar business and product overview
Recovered Fiber
Specialty
Brokerage
Fee Based
Mills
Uncoated Recycled Paperboard (URB)
Coated Recycled Paperboard (CRB)
Industrial Products
Tube & Core
Construction Products
Protective Packaging
Adhesives
Consumer Packaging
Folding Cartons
Food Service
Paper mill cores
Film cores
Yarn carriers
Construction cores
Other cores
Other products
Industrial End Markets
Frozen/perishablefoods
Household, hardware,auto
Dry foods
Pharma & healthcare
Other folding carton
Consumer End Markets
Vertically integrated system…. …That serves a variety of markets
March 12, 2019 – P.21
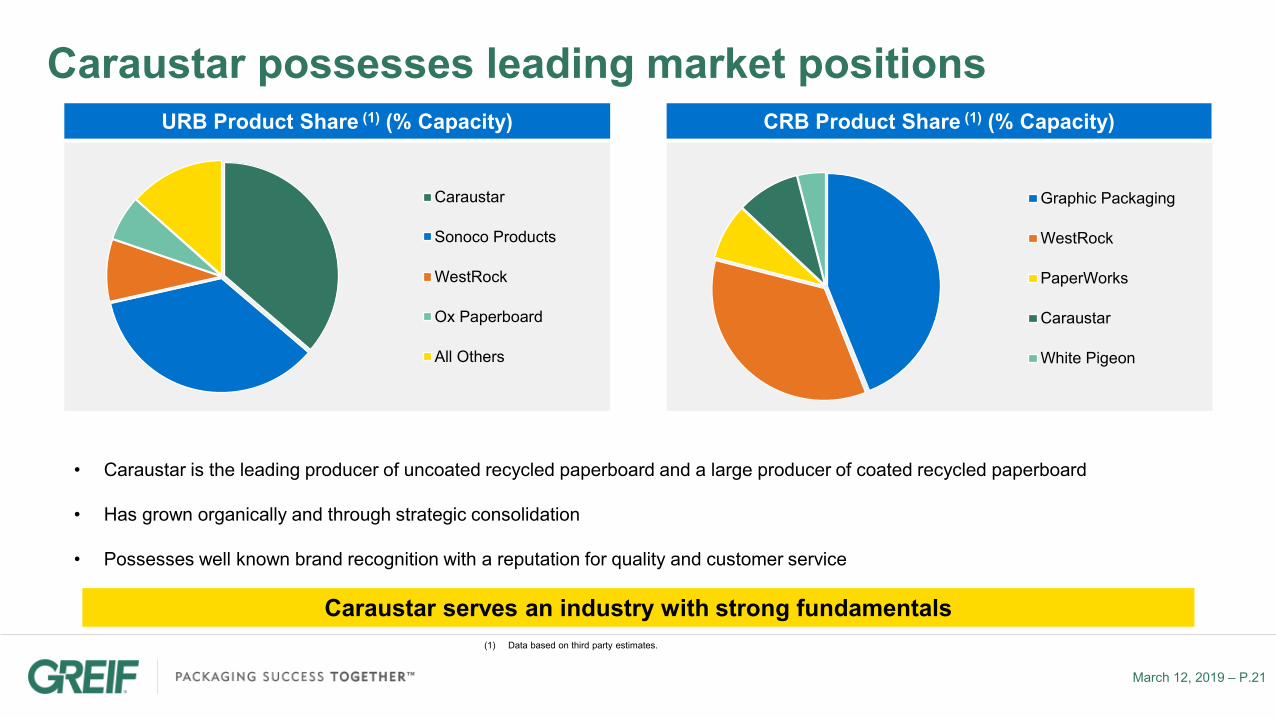
Caraustar possesses leading market positions
• Caraustar is the leading producer of uncoated recycled paperboard and a large producer of coated recycled paperboard
• Has grown organically and through strategic consolidation
• Possesses well known brand recognition with a reputation for quality and customer service
Caraustar serves an industry with strong fundamentals(1) Data based on third party estimates.
CRB Product Share (1) (% Capacity)
Graphic Packaging
WestRock
PaperWorks
Caraustar
White Pigeon
URB Product Share (1) (% Capacity)
Caraustar
Sonoco Products
WestRock
Ox Paperboard
All Others

March 12, 2019 – P.22
Caraustar possesses strong business attributes
Strong industry fundamentals1
• Strong operating rates and backlogs driven by increased demand
• Favorable supply/demand dynamics
• Defensible, cost-advantaged products with low substitution risk
• Domestic fiber markets have reset and are expected to remain stable
Well-positioned company 2
• Market leadership‒ Leading URB and CRB producer‒ Leading domestic recovered fiber business‒ Long tenured customer base
• Vertically integrated business model‒ Certainty of supply‒ Reduced exposure to input price volatility
• National footprint‒ National network of strategically located mill
and converting operations
Caraustar is strategically positioned for long-term value creation

March 12, 2019 – P.23
Favorable industry fundamentals support profit growthURB Industry Operating Rates1
(1) Based on third party historical data.
84.0%
86.0%
88.0%
90.0%
92.0%
94.0%
96.0%
98.0%
100.0%
1/1/
2015
3/1/
2015
5/1/
2015
7/1/
2015
9/1/
2015
11/1
/201
51/
1/20
163/
1/20
165/
1/20
167/
1/20
169/
1/20
1611
/1/2
016
1/1/
2017
3/1/
2017
5/1/
2017
7/1/
2017
9/1/
2017
11/1
/201
71/
1/20
183/
1/20
185/
1/20
187/
1/20
189/
1/20
1811
/1/2
018
1/1/
2019
URB overview• Derived from 100% recovered fiber and serves a
wide variety of applications
• Often utilized for industrial applications where functional performance characteristics (e.g. tensile strength, rigidity, etc.) are essential
• URB market is roughly 2M tons per year (containerboard ~38M tons)1
• Operating rates have grown over time due to strong demand and industry capacity reduction

March 12, 2019 – P.24
Caraustar strengthens and balances Greif’s portfolio
RIPSPPSFPSLM
Impact
US
EMEA
APAC &Other
RIPSPPSFPSLM
PaperPackaging &Services
US
PaperPackaging &Services
US
EMEA
APAC &Other
Sales by Segment
Sales by Geography
EBITDA by Segment
Combined pro-forma
Strengthens and balances Greif’s existing portfolio
Increases Greif’s exposure to the U.S.
Margin accretive to Greif’s portfolio
(1) Greif Fiscal 2018 data.(2) EBITDA represents Greif’s Fiscal 2018 EBITDA BSI. A summary of all adjustments for the impact of special items that are included in the EBITDA
before special items is set forth in the appendix of this presentation. EBITDA is defined as earnings before interest and taxes, plus depreciation and amortization.
(3) Caraustar data based on the last twelve months as of 9/30/18. Caraustar EBITDA is a run-rate figure.
(1)(3)
RIPSPPSFPSLM
(2)RIPSPPSFPSLM
March 12, 2019 – P.25
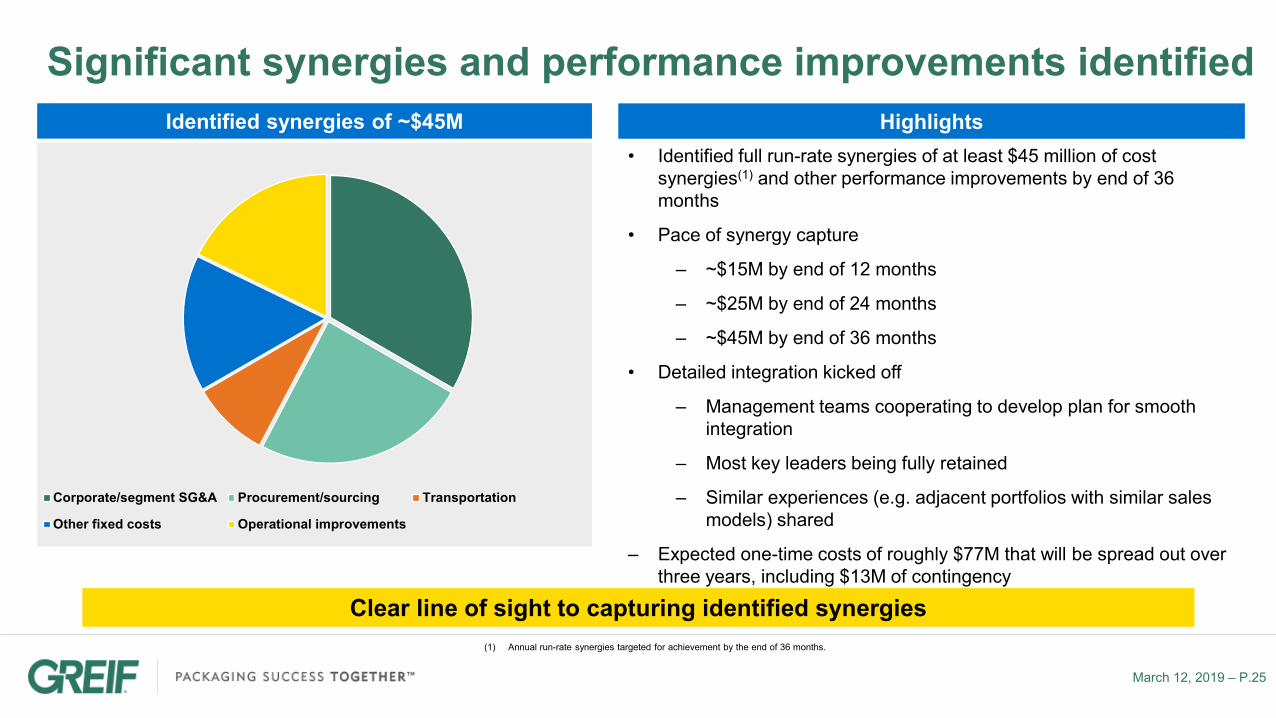
Significant synergies and performance improvements identified
• Identified full run-rate synergies of at least $45 million of cost synergies(1) and other performance improvements by end of 36 months
• Pace of synergy capture
‒ ~$15M by end of 12 months
‒ ~$25M by end of 24 months
‒ ~$45M by end of 36 months
• Detailed integration kicked off
‒ Management teams cooperating to develop plan for smooth integration
‒ Most key leaders being fully retained
‒ Similar experiences (e.g. adjacent portfolios with similar sales models) shared
‒ Expected one-time costs of roughly $77M that will be spread out over three years, including $13M of contingency
Clear line of sight to capturing identified synergies
Corporate/segment SG&A Procurement/sourcing Transportation
Other fixed costs Operational improvements
Identified synergies of ~$45M
(1) Annual run-rate synergies targeted for achievement by the end of 36 months.
Highlights

March 12, 2019 – P.26
Highly accretive transaction for strong value creation
Significant sales, margin and EBITDA enhancement generated through the transaction even before giving effect to run-rate synergies of at least $45 million
Combined pro-forma
Sales (1) ($M)
EBITDA (1) ($M)
% Margin
EBITDA (1) –Capex ($M)
$3,873.8
$503.2
13.0%
$363.0
$1,376.0
$220.0
16.0%
$177.0
$5,249.8
$723.2
13.8%
$540.0
Significant improvement
across all key metrics, even prior to
including synergies
(1)(2)
(1) Greif data is Fiscal 2018 figures. EBITDA for Greif represents EBITDA BSI. A summary of all adjustments for the impact of special items that are included in the EBITDA before special items and Class A EPS before special items is set forth in the appendix of this presentation. EBITDA is defined as earnings before interest and taxes, plus depreciation and amortization.
(2) Caraustar data based on the last twelve months as of 9/30/18. Caraustar EBITDA is a run-rate figure.Note: No reconciliation of pro-forma combined financials is included in this presentation because, due to the high variability and difficulty in making accurate forecasts and projections of some of the excluded information, together with some of the excluded information not being ascertainable or accessible, we are unable to quantify certain amounts that would be required to be included in the most directly comparable GAAP financial measure without unreasonable efforts.
Class A Earnings per
Share BSI$3.53 Immediately accretive
APPENDIX
March 12, 2019 – P.28
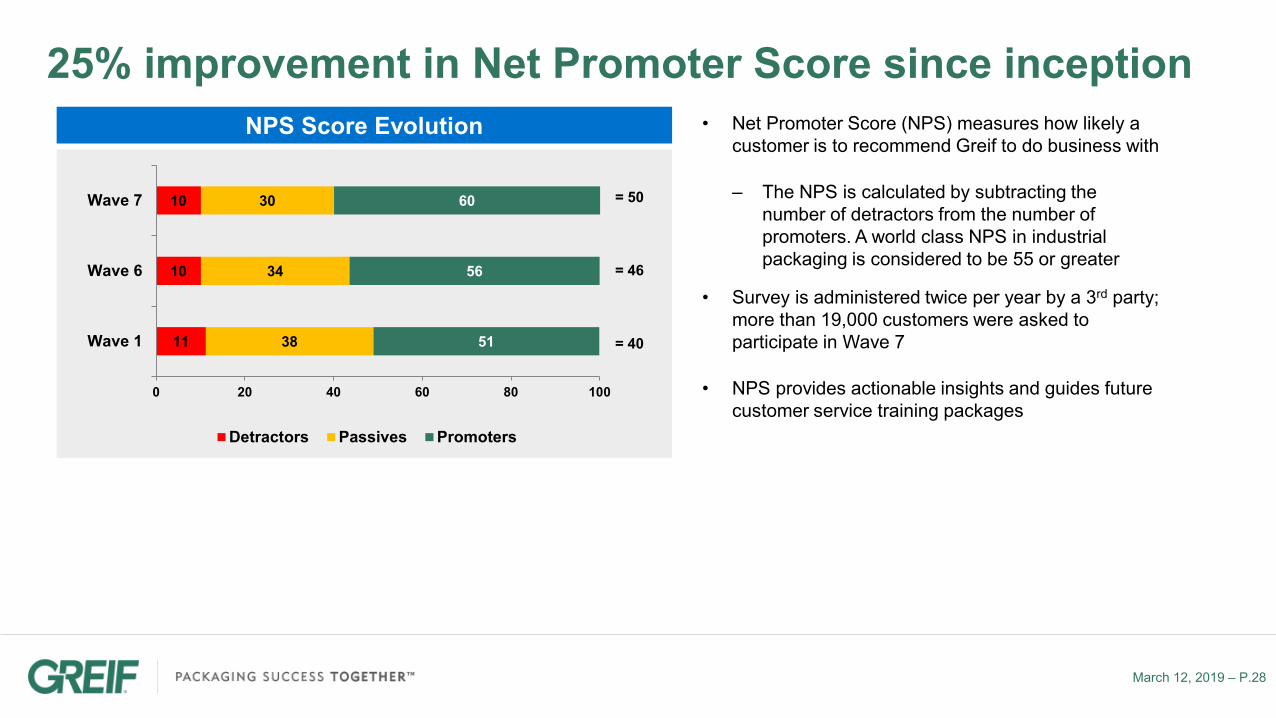
25% improvement in Net Promoter Score since inception• Net Promoter Score (NPS) measures how likely a
customer is to recommend Greif to do business with
‒ The NPS is calculated by subtracting the number of detractors from the number of promoters. A world class NPS in industrial packaging is considered to be 55 or greater
• Survey is administered twice per year by a 3rd party; more than 19,000 customers were asked to participate in Wave 7
• NPS provides actionable insights and guides future customer service training packages
11
10
10
38
34
30
51
56
60
0 20 40 60 80 100
Wave 1
Wave 6
Wave 7
Detractors Passives Promoters
= 50
= 46
= 40
NPS Score Evolution

March 12, 2019 – P.29
Experienced and proven management team
Larry A. Hilsheimer, EVP & CFOJoined Greif in 2014Previous Experience:
Gary R. Martz, EVP, General Counsel & SecretaryJoined Greif in 2002Previous Experience:
Doug Lingrel, VP & CAOJoined Greif in 1998Previous Experience:
Ole Rosgaard, SVP & Group PresidentJoined Greif in 2015Previous Experience:
Peter G. Watson, President & CEOJoined Greif in 1999Previous Experience:
Experienced team of operators with strong track record of success
Michael Cronin, SVP & Group PresidentJoined Greif in 2015Previous Experience:
Hari Kumar, VP & Division PresidentJoined Greif in 2012Previous Experience:
Tim Bergwall, Group PresidentJoined Greif in 2002Previous Experience:
Bala V. Sathyanarayanan, SVP & CHROJoined Greif in 2018Previous Experience:

March 12, 2019 – P.30
Market information
Rank Institution %1 The Vanguard Group, Inc. 15.7%
2 BlackRock Institutional Trust Company, N.A. 10.6%
3 Wellington Management Company, LLP 7.1%
4 Dimensional Fund Advisors, L.P. 6.7%
5 Gabelli Funds, LLC 5.0%
6 State Street Global Advisors (US) 3.3%
7 Quantitative Management Associates LLC 2.1%
8 Norges Bank Investment Management (NBIM) 1.9%
9 Pictet Asset Management Ltd. 1.7%
10 DePrince, Race & Zollo 1.7%
Rank Institution %1 Raymond James & Associates 8.6%
2 Arbiter Partners Capital Management LLC 2.7%
3 Advisors Asset Management, Inc. 1.7%
4 BlackRock Institutional Trust Company, N.A 1.2%
5 The Vanguard Group, Inc. 1.0%
6 Dimensional Fund Advisors LP 0.9%
7 Gabelli Funds LLC 0.6%
8 State Street Global Advisors (US) 0.5%
9 BNY Mellon Asset Management North America Corp 0.4%
10 Geode Capital Management, L.L.C 0.3%
Current Quarterly Dividend Proxy Vote Shares Outstanding
Class A $0.44 per share No voting rights 25.8
Class B $0.65 per share 1 vote per share 22.0
Market Ticker Share Price Market Cap Cash Total Debt
Class A NYSE GEF $40.74 $1.056B$94.2M $953M
Class B NYSE GEF/B $46.03 $1.013B
Key Market Data (2)
Share Class Characteristics
Analyst Coverage• Robert W. Baird & Co.• Bank of America Merrill Lynch • Sidoti & Company, LLC • Wells Fargo Securities, LLC• KeyBanc Capital Markets• D.A. Davidson & Co.• BMO Capital Markets Corp.
Top 10 Class A Institutional Owners (1) Top 10 Class B Institutional Owners (1)
(1) Data as of 12/31/2018 and based on most recent 13-F filings(2) Data as of 3/1/2019

March 12, 2019 – P.31
Compensation tied to shareholder returns
Salary
Short-termIncentives
Long-termIncentives
Named Executive Officer Compensation Mix
Salary
Short-termIncentives
Long-termIncentives
2018 CEO Compensation Mix
Incentive Plans(1)
(1) Named Executive Officer Compensation Mix. Refer to the Greif’s Proxy Statement dated Jan 11, 2019.
• Short-Term Incentive Plan (STIP):
- FY2018 based on Return on Net Assets
- FY2019 updated; now based on Operating Profit Before Special Items and modified simple free cash flow which better aligns to company focus on profitability and cash flow
• Long-Term Incentive Plan (LTIP):
- Considers three-year performance periods, based on EBITDA
• Insider purchases:
- Since Caraustar announcement, Company executives have purchased a combination of ~23K Class A and B shares on open market

SUSTAINABILITY HIGHLIGHTS

March 12, 2019 – P.33
Significant progress toward our sustainability agendaGovernance Structure & Sustainability Highlights
Board of Directors
Sustainability Steering
Committee
Sustainability Management
Team
Energy & Emissions Team
Waste Team
Water Team
Governance Team
Labor Practices Team
Innovation Team
Procurement Team
Published ninth annual sustainability report, which is in full accordance with the GRI Standards Core guidelines
Conducted a materiality assessment to identify our highest-priority sustainability impacts, risks and opportunities
Established governance structure and stakeholder engagement process
Identified 16 environmental, social, product, governance and economic topics that were the highest priorities for our stakeholders

March 12, 2019 – P.34
Selected 2025 Sustainability goalsGovernance
• Provide online training of the Greif code of Business Conduct and Ethics to 100% of employees(1)
• Provide training and information on the Greif Anti-bribery Policy to 100% of employees(1)
• Provide online training of the Fair Treatment of Employees policy to 100% of employees(1) and provide accessible and traceable information to all employees(1)
Procurement• Using a FY17 baseline, reduce all raw
materials/logistics costs used to produce current product offering by 1%
Environment• Divert 90% of waste from landfills from all Greif
production facilities globally
• Reduce Biochemical Oxygen Demand (BOD) discharged in kilograms by 10% per metric ton of production from Riverville and Massillon Mills using a FY14 baseline
Labor Practices• Reduce Medical Case Rate by 10% annually
• Using FY17 baseline, increase the proportion of women in management positions by 25%
• Using FY17 baseline, increase average hours of annual training per employee by 50%
See complete list of sustainability goals in the 2017 Sustainability Report(1) Refers to all employees with access to computers and whom training is relevant
March 12, 2019 – P.35
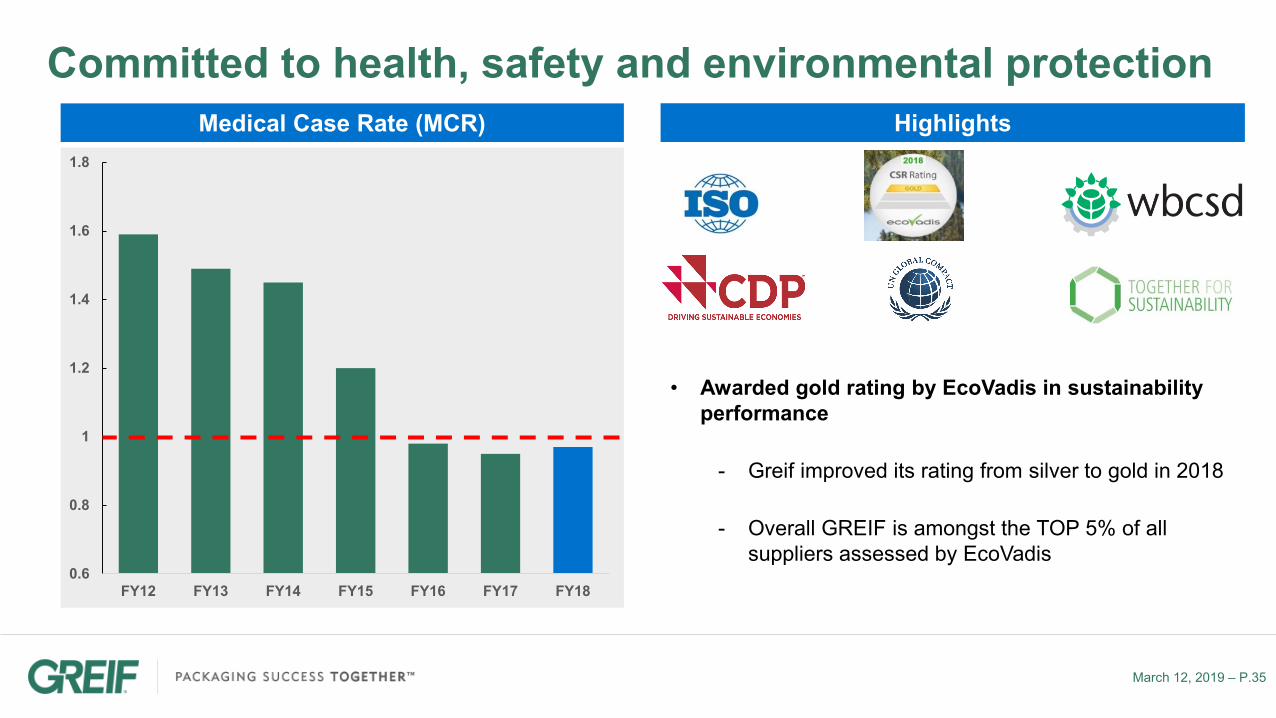
Committed to health, safety and environmental protectionMedical Case Rate (MCR)
0.6
0.8
1
1.2
1.4
1.6
1.8
FY12 FY13 FY14 FY15 FY16 FY17 FY18
Highlights
• Awarded gold rating by EcoVadis in sustainability performance
- Greif improved its rating from silver to gold in 2018
- Overall GREIF is amongst the TOP 5% of all suppliers assessed by EcoVadis

Q1’2019 EARNINGS REVIEW

March 12, 2019 – P.37
First Quarter Fiscal Year (FY) 2019 key takeaways
1 A summary of all special items that are included in Adjusted EBITDA and Adjusted Class A earnings per share is set forth in the appendix of this presentation.Note: A reconciliation of the differences between all non-GAAP financial measures used in this presentation with the most directly comparable GAAP financial measures is included in the appendix of this presentation.
Key performance statistics• Adjusted EBITDA and Adjusted
Class A EPS up 15.4% and 32.7%, respectively, versus prior year
‒ PPS: solid demand and volume growth; continued favorable price/cost environment
‒ FPS: improved manufacturing performance and F/X tailwind helped to offset market softness
‒ RIPS: ongoing market softness impacting steel volumes, but continued strong IBC growth; margin challenged by market softness and F/X headwind
Key themes / markets
• Announced agreement to acquire Caraustar Industries on December 20, 2018; acquisition closed February 11, 2019
‒ Fiscal 2019 guidance revised higher for Caraustar
‒ Revised capital allocation priorities with emphasis on deleveraging
‒ In-depth integration process underway
Caraustar updateTrailing 12 mos Customer Satisfaction Index
Adjusted EBITDA1 ($M)
Adjusted Class A EPS 1 ($/sh)
Step up in profitability despite market softness
Q1'18 Q2'18 Q3'18 Q4'18 Q1'19
$92.1
$106.3
Q1'18 Q1'19
$0.49 $0.65
Q1'18 Q1'19

March 12, 2019 – P.38
Q1’19 vs. Q1’18: financial comparison
(1) A summary of the adjustments for the impact of currency translation is set forth in the appendix of this presentation.(2) A summary of all adjustments excluded from net income attributable to Greif, Inc, the Adjusted Class A earnings per share and
Adjusted EBITDA is set forth in the appendix of this presentation.(3) Adjusted free cash flow is defined as net cash provided by operating activities, less cash paid for purchases of properties, plants
and equipment, plus acquisition related expenses.Note: A reconciliation of the differences between all non-GAAP financial measures used in this presentation with the most directlycomparable GAAP financial measures is included in the appendix of this presentation.
Key financial metrics ($M and $/sh) Q1 2019 Q1 2018Net Sales, Excluding the Impact of Currency Translation1 $923.8 $905.7
Gross Profit $172.8 $171.7
SG&A $98.1 $103.6
Adjusted EBITDA2 $106.3 $92.1
Interest expense $11.7 $13.3
Other expense $(0.2) $7.7
Adjusted Net Income Attributable to Greif, Inc. 2 $38.3 $28.8
Adjusted Class A Earnings Per Share2 $0.65 $0.49
Capital expenditures $26.0 $28.0
Adjusted Free Cash Flow3 $(35.6) $(81.5)
March 12, 2019 – P.39
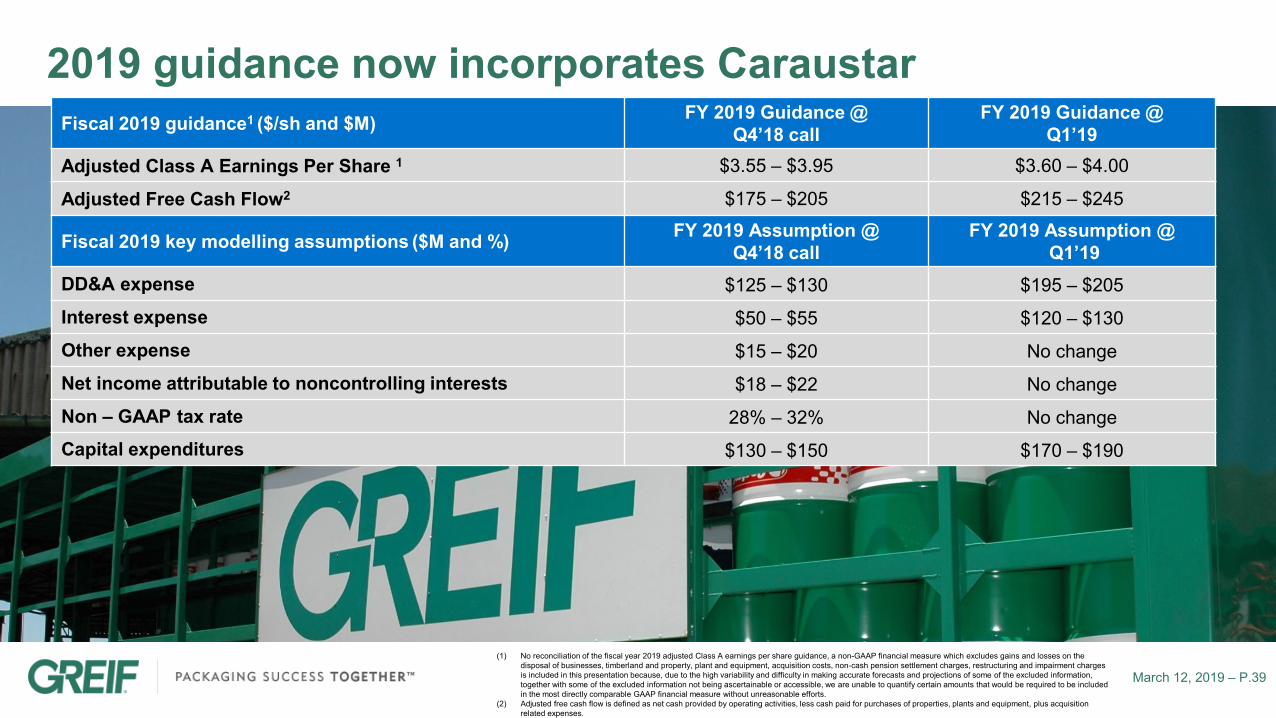
2019 guidance now incorporates CaraustarFiscal 2019 guidance1 ($/sh and $M) FY 2019 Guidance @
Q4’18 callFY 2019 Guidance @
Q1’19Adjusted Class A Earnings Per Share 1 $3.55 – $3.95 $3.60 – $4.00
Adjusted Free Cash Flow2 $175 – $205 $215 – $245
Fiscal 2019 key modelling assumptions ($M and %) FY 2019 Assumption @ Q4’18 call
FY 2019 Assumption @Q1’19
DD&A expense $125 – $130 $195 – $205
Interest expense $50 – $55 $120 – $130
Other expense $15 – $20 No change
Net income attributable to noncontrolling interests $18 – $22 No change
Non – GAAP tax rate 28% – 32% No changeCapital expenditures $130 – $150 $170 – $190
(1) No reconciliation of the fiscal year 2019 adjusted Class A earnings per share guidance, a non-GAAP financial measure which excludes gains and losses on the disposal of businesses, timberland and property, plant and equipment, acquisition costs, non-cash pension settlement charges, restructuring and impairment charges is included in this presentation because, due to the high variability and difficulty in making accurate forecasts and projections of some of the excluded information, together with some of the excluded information not being ascertainable or accessible, we are unable to quantify certain amounts that would be required to be included in the most directly comparable GAAP financial measure without unreasonable efforts.
(2) Adjusted free cash flow is defined as net cash provided by operating activities, less cash paid for purchases of properties, plants and equipment, plus acquisition related expenses.

BUSINESS SEGMENT OVERVIEWS

March 12, 2019 – P.41
RIPS: highlights and differentiation
• Global network with industry’s most comprehensive product line offering
• Diverse customer mix
‒ Petro and chemicals, pharmaceuticals, agriculture, paints and coatings, food and beverage
• Robust operational execution and value delivery
Highlights• Focus on earning value first, volume second
• Valued industry partner with strategic customer relationships
• Pursuing organic expansions to improve product mix and better align to market needs
Differentiation
March 12, 2019 – P.42
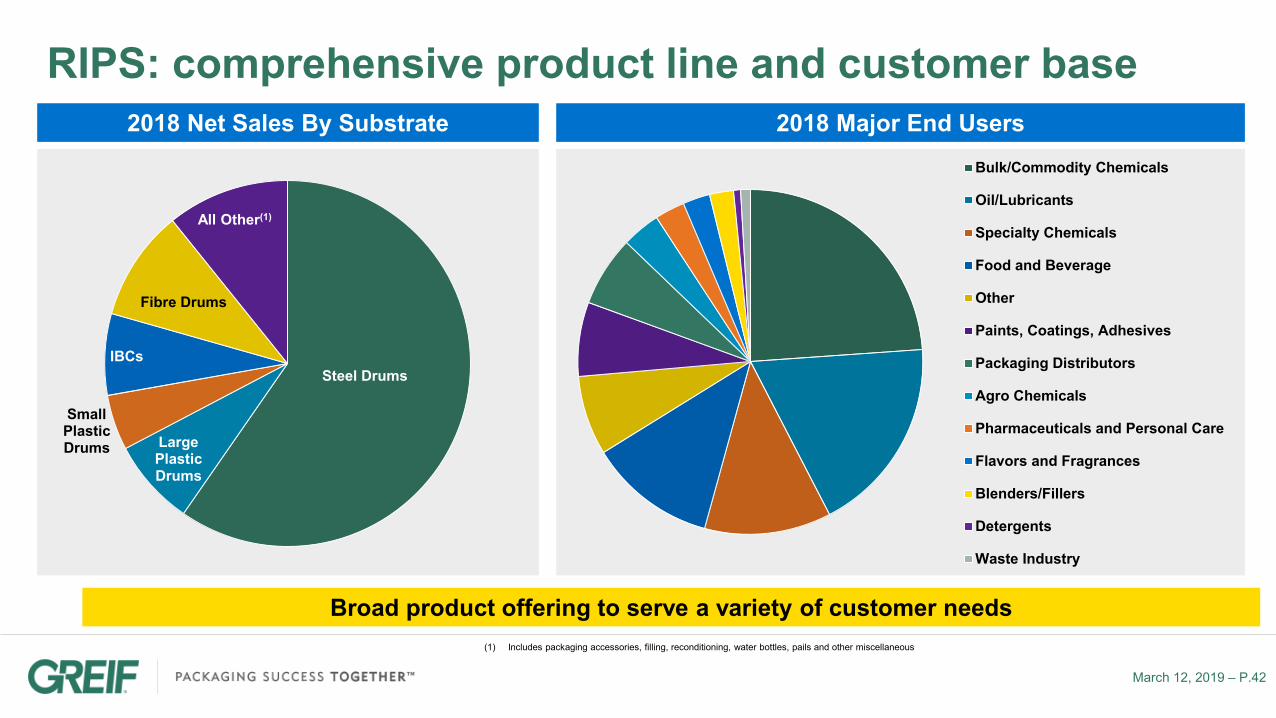
RIPS: comprehensive product line and customer base
Broad product offering to serve a variety of customer needs
2018 Net Sales By Substrate
Steel Drums
Large Plastic Drums
Small Plastic Drums
IBCs
Fibre Drums
All Other(1)
2018 Major End UsersBulk/Commodity Chemicals
Oil/Lubricants
Specialty Chemicals
Food and Beverage
Other
Paints, Coatings, Adhesives
Packaging Distributors
Agro Chemicals
Pharmaceuticals and Personal Care
Flavors and Fragrances
Blenders/Fillers
Detergents
Waste Industry
(1) Includes packaging accessories, filling, reconditioning, water bottles, pails and other miscellaneous

March 12, 2019 – P.43
RIPS: growing IBC capacity in response to customer needsGlobal Intermediate Bulk Container (IBC) Volumes IBC Highlights
• Fastest growing industrial packaging substrate – growing at high single digit CAGR
• Holds between 450 and 1,250 liters of material (although sizes can vary)
• Advantages include: greater reusability; simplified handling; ease of filling/dispensing;space efficiency; stackability. Can also be integrated directly into manufacturing lines
Q1 Q2 Q3 Q4 Q1 Q2 Q3 Q4 Q1 Q2 Q3 Q4 Q1 Q2 Q3 Q4 Q1
FY2015 FY2016 FY2017 FY2018 FY2019
March 12, 2019 – P.44
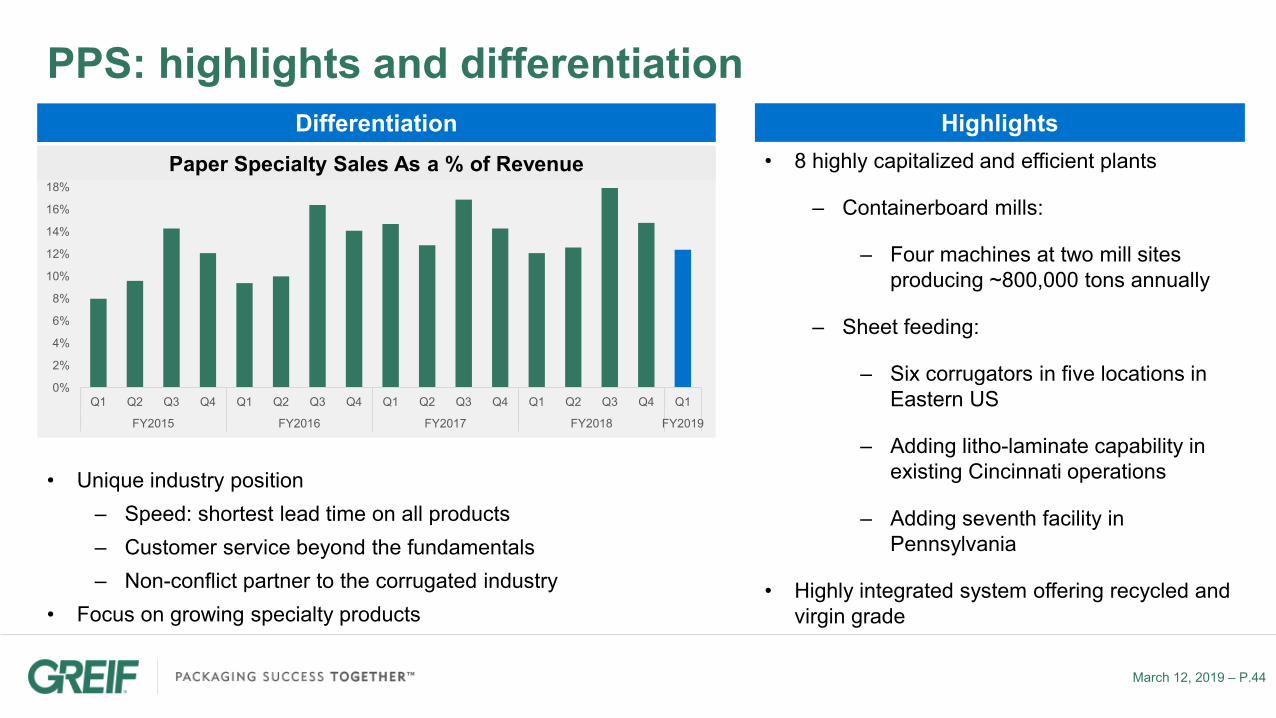
0%
2%
4%
6%
8%
10%
12%
14%
16%
18%
20%
Q1 Q2 Q3 Q4 Q1 Q2 Q3 Q4 Q1 Q2 Q3 Q4 Q1 Q2 Q3 Q4 Q1
FY2015 FY2016 FY2017 FY2018 FY2019
Paper Specialty Sales As a % of Revenue
PPS: highlights and differentiation
• Unique industry position‒ Speed: shortest lead time on all products‒ Customer service beyond the fundamentals‒ Non-conflict partner to the corrugated industry
• Focus on growing specialty products
Differentiation Highlights• 8 highly capitalized and efficient plants
‒ Containerboard mills:
‒ Four machines at two mill sites producing ~800,000 tons annually
‒ Sheet feeding:
‒ Six corrugators in five locations in Eastern US
‒ Adding litho-laminate capability in existing Cincinnati operations
‒ Adding seventh facility in Pennsylvania
• Highly integrated system offering recycled and virgin grade

March 12, 2019 – P.45
PPS: tonnage and specialty product highlights
Triplewall• Triple corrugated sheet product with added
strength• Serves a variety of customers, including
agriculture and automotive sectors
Litho-laminates• Superior print surface for use in point of
purchase displays• Largest format sized litho-laminate in U.S.
Coated products• Provides a variety of wax free, anti-scuff and
highly water resistant solutions• Multiple applications in produce, construction,
meats, etc.
Containerboard Production By Type(1) Specialty Products
27%
45%
28%
Recyclyed Medium SemiChem Medium Recycled Linerboard
(1) Data in tonnage; as of FY 2018

March 12, 2019 – P.46
PPS: sheet feeder PLUS business model is unique
CPG or Mfg. customer
E-commerce customer
Point of Purchase customer
Grower / Packer customer
Corrugated Box Plant
Corrugator and general converting equipment
Sheet Plant
Box Converting equipment only
CorrChoice Sheet Feeder
• High speed corrugators
• Fast order change• All paper grades• All flutes• Complex orders• Any quantity
PLUS
SpecialtyConverting
• Best available technology
• Lowest cost model• Complimentary to
customer needs• Sold through trade &
direct to market
The sheet feeder plus model has gross margins 2x that of a traditional model
Customer Direct
Narrow focus on targeted end use segments
March 12, 2019 – P.47
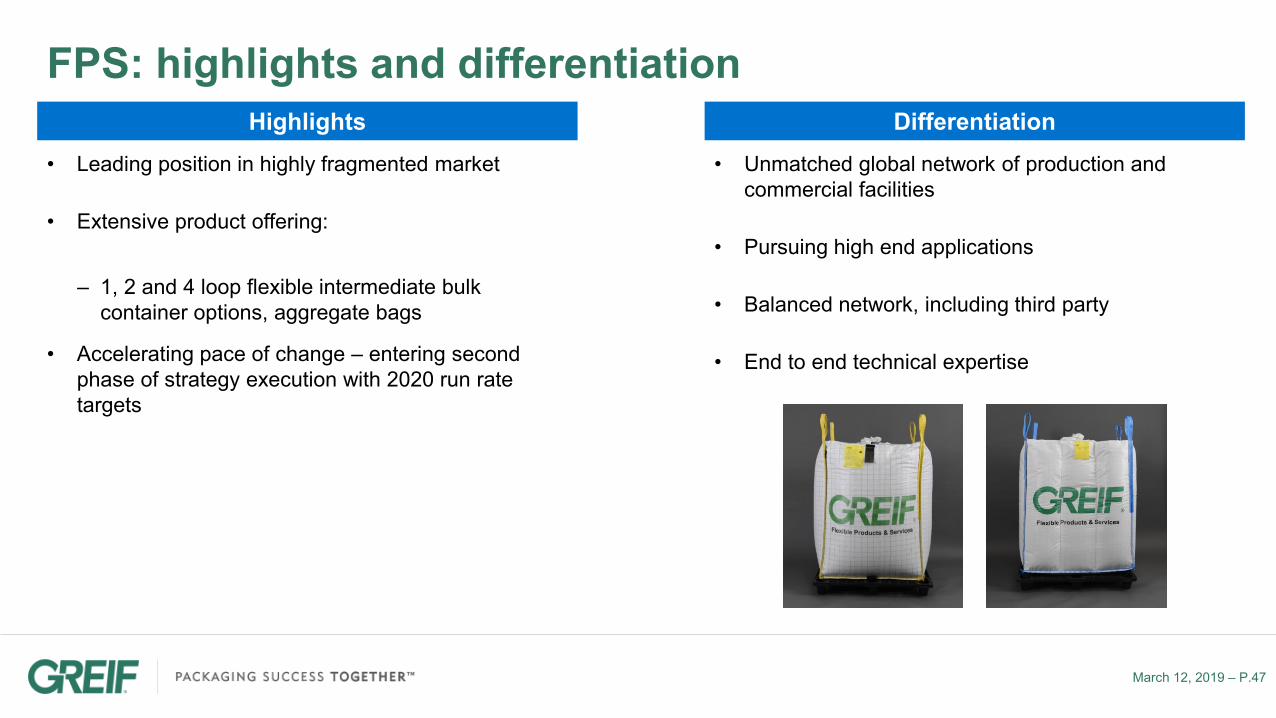
FPS: highlights and differentiation
• Leading position in highly fragmented market
• Extensive product offering:
‒ 1, 2 and 4 loop flexible intermediate bulk container options, aggregate bags
• Accelerating pace of change – entering second phase of strategy execution with 2020 run rate targets
Highlights• Unmatched global network of production and
commercial facilities
• Pursuing high end applications
• Balanced network, including third party
• End to end technical expertise
Differentiation

March 12, 2019 – P.48
FPS: broad end market exposure
FPS manufactures a variety of 1, 2 and 4 loop bulk bags that can be highly customized
2018 Major End Users
Chemicals
Nutrition
Agriculture
Other
Distributor
Phamaceuticals
Mining & Minerals
Construction & Cement
Animal feed
(1) Includes packaging accessories, filling, reconditioning, water bottles, pails and other miscellaneous

March 12, 2019 – P.49
Land: highlights and differentiation
• ~243,000 acres in Louisiana, Mississippi, and Alabama
• Steady cash flows with minimal capital reinvestment
• Valued at $1,700 - $1,900 per acre
Highlights• Emphasis on generating non-timber related revenue
- Consulting services and solar applications
- Recreation and mitigation credits
- Waste application processes
- Mineral rights exploitation
Differentiation
PRODUCT OVERVIEW
March 12, 2019 – P.51
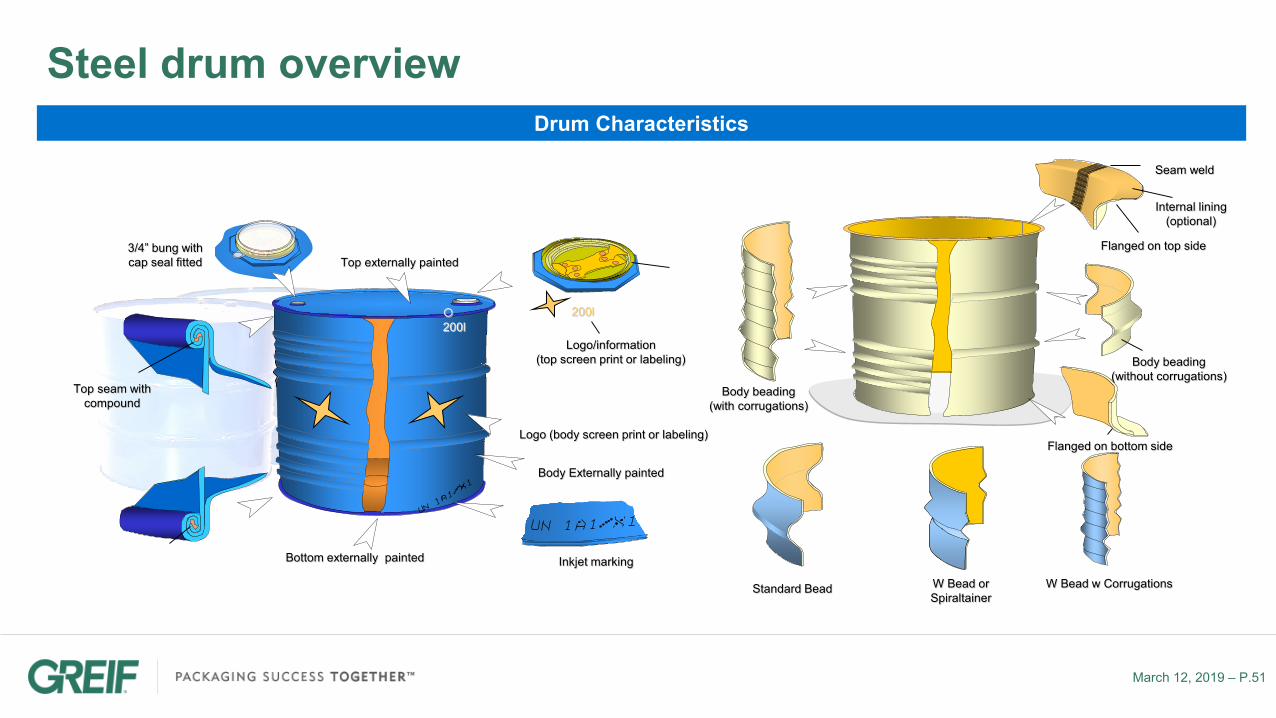
Steel drum overviewDrum Characteristics
Top seam withcompound
Flanged on top sideTop externally painted
Body Externally painted
Bottom externally painted Inkjet marking
3/4” bung withcap seal fitted
Logo (body screen print or labeling)
200l200l
Logo/information(top screen print or labeling)
Flanged on bottom side
Body beading(with corrugations)
Standard Bead W Bead or Spiraltainer
W Bead w Corrugations
Internal lining(optional)
Body beading(without corrugations)
Seam weld

March 12, 2019 – P.52
Steel drums examplesGreif is the largest steel drum producer in the world
Stainless Steel Drum – Widely used in the food and pharmaceuticals industries for its purity & ease of cleaning & sterilization
Bitumen Drum – Designed for hot filling of solidifying asphalt after cooling. Economical solution for export that’s 100% recyclable
Agitator Steel Drum – Large steel drum equipped with a built-in mixing device. Easy to fill thanks to the lid, easy to mix thanks to the integrated agitator powered by pneumatic or electrical motor, easy to empty thanks to the bottom body bung
Knock-Down Drums (KDD) – Large steel drums assembled close to the filling station (from pre-painted parts) optimizing transportation costs, a large number of drums can be exported in ISO-containers over long distances
Small & Intermediate Steel Drums – 4 to 42 gallon (15 to 160 liters) steel drums, tight and open head, plain or lacquered/lined that provide complete range to comply with various industries' specifications
Composite Steel Drum (Valethene) – Tight or open head steel drum with a rigid plastic liner inside. Combine the strength of a steel drum with the chemical safety of a plastic drum
Conical Steel Drum – Maximum number of storage in a minimum amount of space, ideal for seasonal productions. The special conical design allows you to reduce the steel thickness, reduces the transport cost and finally optimizes the full logistics costs of the drum
Large Steel Drum – The large steel drum is a recognized global container with the same specifications around the world. With a wide range of internal coatings and liners, most goods can be packaged and transported in steel drums. Tight head & open head, plain or internally lacquered/lined
March 12, 2019 – P.53
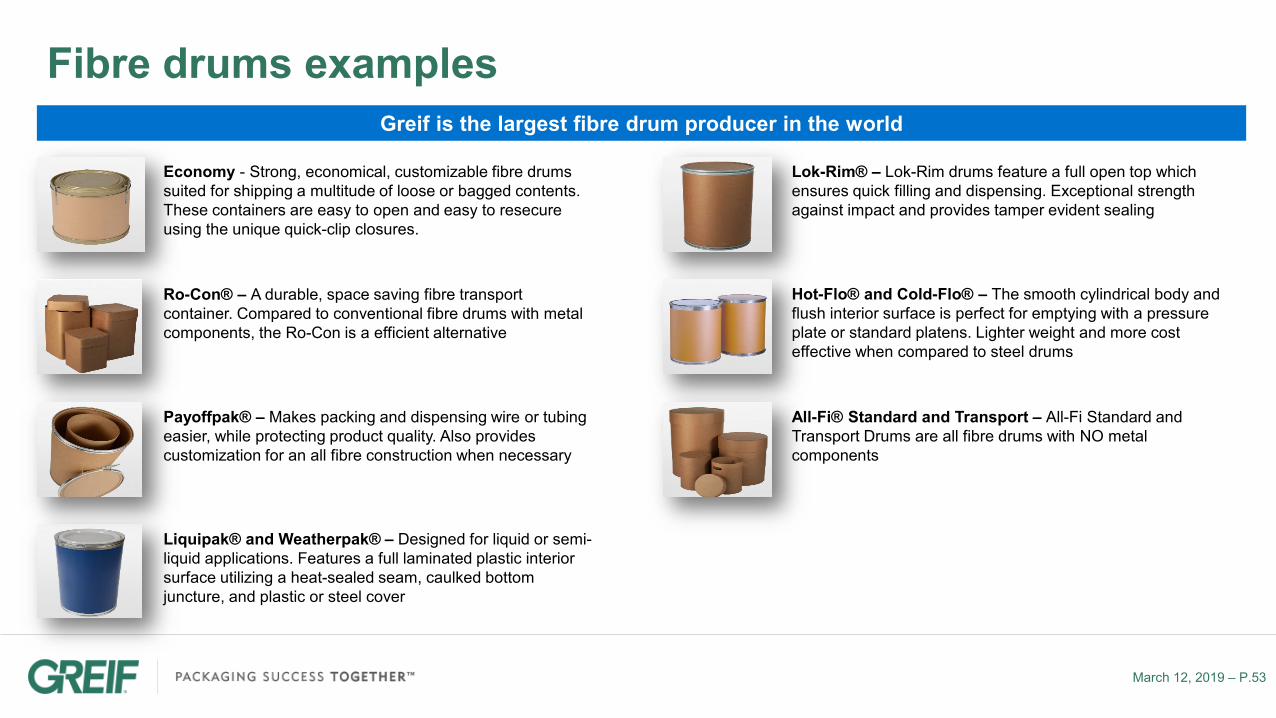
Fibre drums examplesGreif is the largest fibre drum producer in the world
Economy - Strong, economical, customizable fibre drums suited for shipping a multitude of loose or bagged contents. These containers are easy to open and easy to resecure using the unique quick-clip closures.
Ro-Con® – A durable, space saving fibre transport container. Compared to conventional fibre drums with metal components, the Ro-Con is a efficient alternative
Liquipak® and Weatherpak® – Designed for liquid or semi-liquid applications. Features a full laminated plastic interior surface utilizing a heat-sealed seam, caulked bottom juncture, and plastic or steel cover
Payoffpak® – Makes packing and dispensing wire or tubing easier, while protecting product quality. Also provides customization for an all fibre construction when necessary
Lok-Rim® – Lok-Rim drums feature a full open top which ensures quick filling and dispensing. Exceptional strength against impact and provides tamper evident sealing
Hot-Flo® and Cold-Flo® – The smooth cylindrical body and flush interior surface is perfect for emptying with a pressure plate or standard platens. Lighter weight and more cost effective when compared to steel drums
All-Fi® Standard and Transport – All-Fi Standard and Transport Drums are all fibre drums with NO metal components

March 12, 2019 – P.54
Plastic drums examplesGreif is the second largest producer of plastic drums in the world
EcobalanceTM – Containers made from post-consumer recycled (PCR) Resin. Made using approximately 75% recycled HDPE obtained from post-consumer containers and requires less energy to manufacture
Adrum, Valerex®, NexDRUM® – Different models gal plastic drums available to fit most customers' need depending on chemical compatibility, food contact and filling methods. Multiple types of filling both for a high cleanliness food contact and high chemical resistance as with surfactantsPC Drum Series – The PC Series of plastic drums is typically used for transporting hazardous and non-hazardous liquids. The body is extruded blow molded high molecular weight high density polyethylene
NexDRUM® Tight Head – Best performing tight head plastic drum. Optimizes top load stacking strength and provides two times the vacuum resistance than other plastic drums
GP Series Tight Head – Tight head plastic drums designed to fit customary filling requirements. Proven over many years to be a safe and dependable package
P Series Tight Head – Intermediate size plastic drums. Sizes designed to fit customary filling requirements and easy to handle when drums are empty or near empty. The natural color allows user to gauge the liquid level
055FR Open Head – Footring style open head plastic designed for handling when empty or near empty. Strong rigid cover provides a safe and secure fit
PCL/PCH Series – Ag-Chem plastic drum. Specially designed closed probe systems and dip tubes available to meet the needs of the Ag Chem industry

March 12, 2019 – P.55
Intermediate Bulk Containers (IBCs)IBCs are the fastest growing rigid substrate in industrial packaging
GCUBE IBC Shield®– The best barrier technology to protect your product against gas permeation through high density polyethylene
GCUBE IBC - Wooden Pallet – The ideal choice for one-way shipments due to the strong cage and a universally compatible valve
GCUBE IBC - Plastic Pallet – Combines the strongest IBC cage in the market with a new pallet concept that is flexible and yet rigid
GCUBE IBC - Hybrid Pallet – Perfect balance between performance and cost. The strongest IBC for multi-way shipments and long-time storing in racks
GCUBE IBC ELEKTRON – GCUBE Elektron uses multi-layer technology approved for EX zones
GCUBE IBC FOOD – GCUBE Food complying with applicable food packaging requirements
UNEX IBC – An alternative to a stainless steel IBC for easier management of containers and safer shipment of your product

RECONCILIATION & KEY ASSUMPTIONS

March 12, 2019 – P.57
Q1 Price, Volume and Foreign Currency Impact to Net Sales for Primary Products: Excluding Divestitures

March 12, 2019 – P.58
Key sensitivities and assumptionsF/x sensitivity by currency 10% strengthening of the USD;
impact to EBITDA Cumulative impact
Euro $(9M) – $(11M) $(9M) – $(11M)
Next five largest exposures $(7M) – $(10M) $(16M) – $(21M)
Turkish Lira $3M – $4M
Singapore Dollar $(3M) – $(4M)
Russia Ruble $(3M) – $(4M)
British Pound $(2M) – $(3M)
Israeli Shekel $(2M) – $(3M)
All remaining exposures $(3M) – $(5M) $(19M) – $(26M)
• Greif transacts in more than 25 global currencies
• Our currency exposure profile results in a benefit when the US dollar broadly weakens, and we face challenges when the US dollar broadly strengthens
• Offsets created by our global supply chain and cost structure help to mitigate our foreign exchange exposure
Key products / inputs
Annual production tonnage or
consumption
Per month sensitivity to
a $10/ton change (EBITDA)
Containerboard ~1M ~$830K
Uncoated recycled board (URB) ~800K ~$670K
Coated recycled board (CRB) ~180K ~$150K
Old corrugated containers (OCC) ~1.6M ~1.2M

March 12, 2019 – P.59
($M) Fiscal 2018 2020 ConsolidatedCommitments
Net Sales $3,873.8 $3,870
Gross Profit $788.9 $810 - $830
SG&A $397.9 $385 - $365
Operating Profit Before Special Items(1) $391.7 $425 - $465
Free Cash Flow(2) $177.8 $230 - $270
Targets drive Greif towards performance potential
Note: No reconciliation of 2020 Operating Profit Before Special Items (OPBSI) commitment, a non-GAAP financial measure which excludes gains and losses on the sales of businesses, timberland and property, plant and equipment, acquisition costs and restructuring and impairment charges, or 2020 Free Cash Flow commitment, is included in this presentation because, due to the high variability and difficulty in making accurate forecasts and projections of some of the excluded information and assumptions, together with some of such information not being ascertainable or accessible, we are unable to quantify certain amounts that would be required to be included in the most directly comparable GAAP financial measure without unreasonable efforts.
(1) A summary of all adjustments for the special items that are included in the operating profit before special items is set forth in the appendix of this presentation.
(2) Free cash flow is defined as net cash provided by operating activities less cash paid for capital expenditures and excludes a one time $65 million dollar pension contribution made in 2018
Note: A reconciliation of the differences between all non-GAAP financial measures used in this presentation with the most directly comparable GAAP financial measures is included in the appendix of this presentation.

March 12, 2019 – P.60
• Annual market growth rate of 0-1%
• Raw material costs (including OCC) assumed flat against current indices in the markets in which we participate
• Raw material price increases are passed to customers through price adjustment mechanisms in contracts or otherwise with customary delay in our RIPS and FPS businesses (not PPS)
• FX rates assumed flat to April 2017 rates
• Salary and benefit increases based on estimated inflationary rates per jurisdiction consistent with 2015 - 2017
• Net income attributable to NCI assumed to increase to approximately $20M by Fiscal 2020
• Annual other expense assumed to remain the same as Fiscal 2017
• Effective tax rate expense and cash paid assumed to be within the range of 32-36%
• Pension and post-retirement cash funding requirements increase by $8M over Fiscal 2017
• Interest expense assumed to remain approximately flat to Fiscal 2017, not reflecting any benefit from further debt reduction nor refinancing at maturity of 2019 bonds – $250M at 7.75%)
• Annual cash from OWC flat to a slight use based on assumed growth
• Annual CapEx of $100M – $120M
• Acquisitions not contemplated in targets
2020 target assumptions (as of June 28, 2017)

March 12, 2019 – P.61
Non – GAAP Financial Measures
Non-GAAP measures are intended to supplement and should be read together with our financial results. They should not be considered an alternative or substitute for, and should not be considered superior to, our reported financial results. Accordingly, users of this financial information should not place undue reliance on these non-GAAP financial measures.

March 12, 2019 – P.62
GAAP to Non-GAAP reconciliation:Segment and Consolidated Q4 2018, Q4 2017, and Q4 2016 Operating Profit (Loss) Before Special Items ($ Millions)

March 12, 2019 – P.63
GAAP to Non-GAAP reconciliation:Segment and Consolidated Q4 2018, Q3 2018, Q2 2018, Q1 2018 and trailing four quarters Operating Profit (Loss) Before Special Items ($ Millions)

March 12, 2019 – P.64
GAAP to Non-GAAP reconciliation:Consolidated Operating Profit (Loss) Before Special Items for FY 2016, FY 2017, and FY 2018 ($ Millions)
March 12, 2019 – P.65
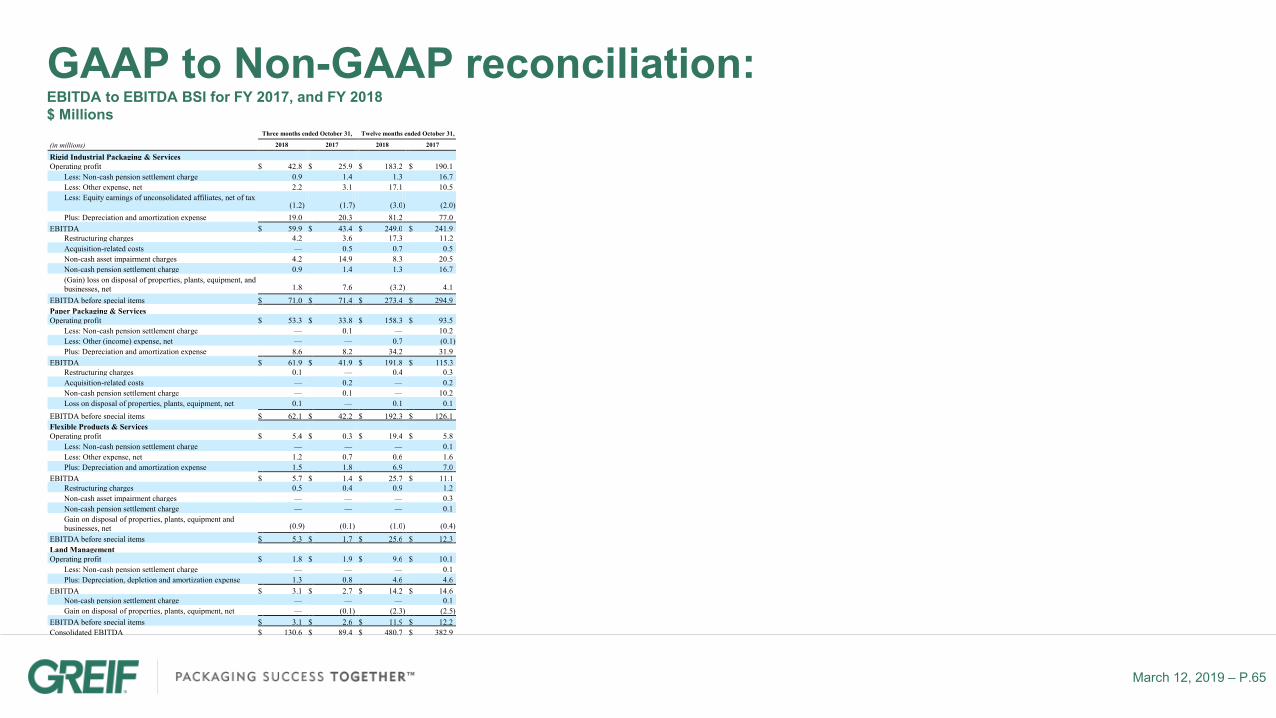
Three months ended October 31, Twelve months ended October 31,
(in millions) 2018 2017 2018 2017
Rigid Industrial Packaging & Services Operating profit $ 42.8 $ 25.9 $ 183.2 $ 190.1
Less: Non-cash pension settlement charge 0.9 1.4 1.3 16.7 Less: Other expense, net 2.2 3.1 17.1 10.5 Less: Equity earnings of unconsolidated affiliates, net of tax
(1.2 ) (1.7 ) (3.0 ) (2.0 ) Plus: Depreciation and amortization expense 19.0 20.3 81.2 77.0
EBITDA $ 59.9 $ 43.4 $ 249.0 $ 241.9 Restructuring charges 4.2 3.6 17.3 11.2 Acquisition-related costs — 0.5 0.7 0.5 Non-cash asset impairment charges 4.2 14.9 8.3 20.5 Non-cash pension settlement charge 0.9 1.4 1.3 16.7 (Gain) loss on disposal of properties, plants, equipment, and businesses, net 1.8
7.6
(3.2 ) 4.1
EBITDA before special items $ 71.0 $ 71.4 $ 273.4 $ 294.9 Paper Packaging & Services Operating profit $ 53.3 $ 33.8 $ 158.3 $ 93.5
Less: Non-cash pension settlement charge — 0.1 — 10.2 Less: Other (income) expense, net — — 0.7 (0.1 ) Plus: Depreciation and amortization expense 8.6 8.2 34.2 31.9
EBITDA $ 61.9 $ 41.9 $ 191.8 $ 115.3 Restructuring charges 0.1 — 0.4 0.3 Acquisition-related costs — 0.2 — 0.2 Non-cash pension settlement charge — 0.1 — 10.2 Loss on disposal of properties, plants, equipment, net 0.1 — 0.1 0.1
EBITDA before special items $ 62.1 $ 42.2 $ 192.3 $ 126.1 Flexible Products & Services Operating profit $ 5.4 $ 0.3 $ 19.4 $ 5.8
Less: Non-cash pension settlement charge — — — 0.1 Less: Other expense, net 1.2 0.7 0.6 1.6 Plus: Depreciation and amortization expense 1.5 1.8 6.9 7.0
EBITDA $ 5.7 $ 1.4 $ 25.7 $ 11.1 Restructuring charges 0.5 0.4 0.9 1.2 Non-cash asset impairment charges — — — 0.3 Non-cash pension settlement charge — — — 0.1 Gain on disposal of properties, plants, equipment and businesses, net (0.9 ) (0.1 ) (1.0 ) (0.4 )
EBITDA before special items $ 5.3 $ 1.7 $ 25.6 $ 12.3 Land Management Operating profit $ 1.8 $ 1.9 $ 9.6 $ 10.1
Less: Non-cash pension settlement charge — — — 0.1 Plus: Depreciation, depletion and amortization expense 1.3 0.8 4.6 4.6
EBITDA $ 3.1 $ 2.7 $ 14.2 $ 14.6 Non-cash pension settlement charge — — — 0.1 Gain on disposal of properties, plants, equipment, net — (0.1 ) (2.3 ) (2.5 )
EBITDA before special items $ 3.1 $ 2.6 $ 11.9 $ 12.2 Consolidated EBITDA $ 130.6 $ 89.4 $ 480.7 $ 382.9
GAAP to Non-GAAP reconciliation:EBITDA to EBITDA BSI for FY 2017, and FY 2018 $ Millions

March 12, 2019 – P.66
GAAP to Non-GAAP reconciliation:Segment and Consolidated Financials: FQ1 2019, FQ1 2018$ Millions

March 12, 2019 – P.67
GAAP to Non-GAAP reconciliation:Reconciliation of FQ1 2019 Net Sales to Net Sales Excluding the Impact of Currency Translation$Millions
March 12, 2019 – P.68
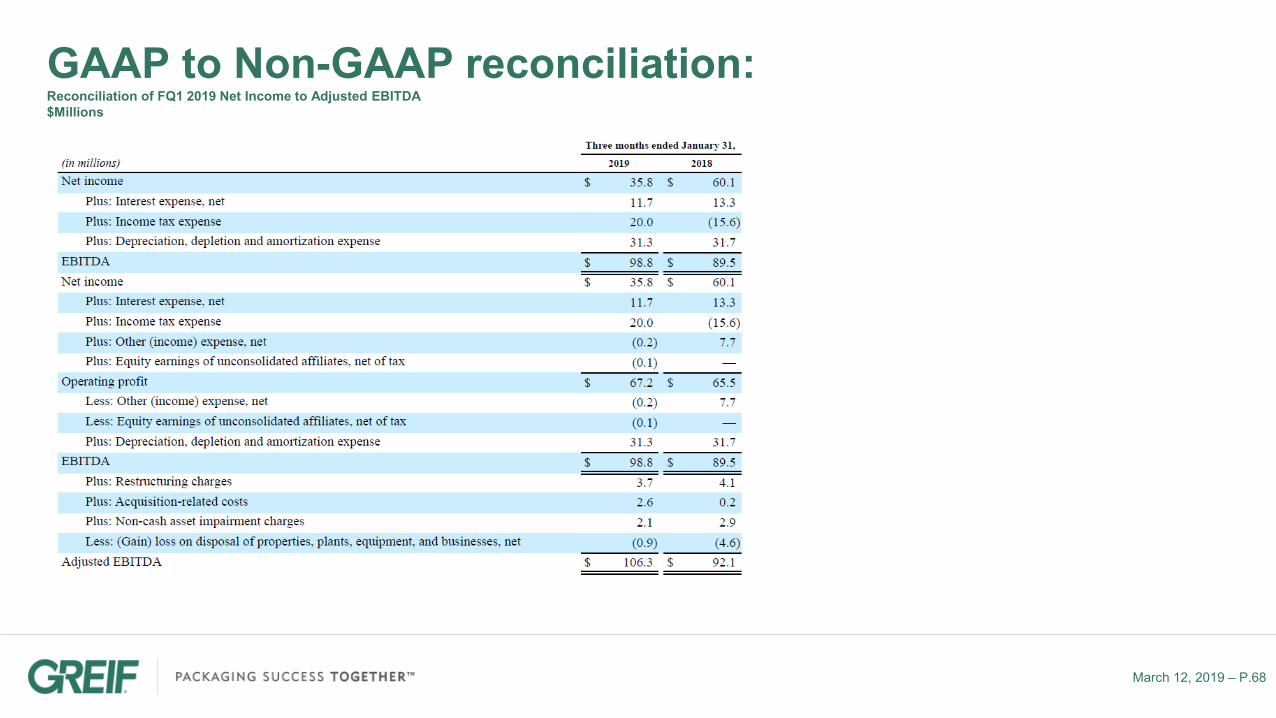
GAAP to Non-GAAP reconciliation:Reconciliation of FQ1 2019 Net Income to Adjusted EBITDA$Millions

March 12, 2019 – P.69
GAAP to Non-GAAP reconciliation:Reconciliation of FQ1 2019 Segment Operating Profit to Adjusted EBITDA$Millions

March 12, 2019 – P.70
GAAP to Non-GAAP reconciliation:Net Income and Class A Earnings Per Share Excluding Adjustments$Millions and $/sh

March 12, 2019 – P.71
GAAP to Non-GAAP reconciliation:2018 Free Cash Flow; 2019 Adjusted Free Cash Flow for FQ1 2019 and projected 2019 Adjusted Free Cash Flow guidance$ Millions
Three months ended January 31,
(in millions) 2019 2018
Net cash used in operating activities $ (9.6 ) $ (53.7 ) Cash paid for purchases of properties, plants and equipment (26.0 ) (28.0 )
Free cash flow $ (35.6 ) $ (81.7 ) Cash paid for acquisition-related costs — 0.2
Adjusted free cash flow $ (35.6 ) $ (81.5 )