Embed Size (px)
Citation preview

4.0
cm
CRISIL Performance Report
1.0 cm1.0 cm
19.0 cm
4.0 cm
0.9
72 c
m
0.972 cm
Ratings
ABS & MBS Pools
March 2017

Krishnan Sitaraman
Senior Director
Tel: +91 22 3342 8070
Email: [email protected]
Shailendra Biyani
Regional Manager
Email: [email protected]
Kruti Rawal
Associate Director
Email: [email protected]
Subhasree Mitra
Regional Manager
Email: [email protected]
Atal Agarwal Rohit Chugh
Senior Director Director
Tel: +91 22 4097 8052 Tel: +91 124 6722117
Email: [email protected] Email: [email protected]
Anand Agarwal
Associate Director
Email: [email protected]
Ruchita Pandya
Regional Manager Email: [email protected]
Reema Doshi
Regional Manager
Email: [email protected]
Rajendra Lodd
Director
Tel: +91 22 3342 8589
Tel: +91 22 3342 3497Tel: +91 44 6656 3107
Email: [email protected]
Business Development
Structured Finance Ratings
Gurpreet Chhatwal
President
Apurva Sharma
Rating Analyst
Email: [email protected]
Ajit Velonie
Director
Tel: +91 22 4097 8209
Email: [email protected]
Viral Malia
Director
Email: [email protected]
Bharadwaja Panchagnula
Regional Manager
Email: [email protected]
Hemant Bilay
Associate Director
Email: [email protected]
Suman Chowdhury
Director
Tel: +91 22 3342 3293
Email: [email protected]
Arihant Dudhodia
Associate Director
Email: [email protected]
Bhawmik Mehta
Associate Director
Email: [email protected]
Dolly Parmar
Regional Manager
Email: [email protected]
Jasmine Chaney
Associate Director
Email: [email protected]
Pallavi Mitra
Senior Business Development Manager
Email: [email protected]
Amit Khare
Regional Manager
Email: [email protected]
Ashish Jha
Associate Director
Email: [email protected]
0.7
28 c
m CRISIL Performance Report
Rakesh Kumar Seal Senior Business Development ManagerEmail: [email protected]
V Rajesh N RaoRegional ManagerEmail: [email protected]
Hoshil Thapar Senior Business Development ManagerEmail: [email protected]
Sanyukta Nagesh Bandekar Regional managerEmail: [email protected]
Rajesh Basanna Regional managerEmail: [email protected]
Sunanda AgarwalRegional ManagerEmail: [email protected]
Pankaj SharmaRegional ManagerEmail: [email protected]

1
Index
Sr. no Contents Page no
1 Review of CRISIL-rated ABS and MBS pools 04
2 Rating Actions 11
3 Commercial Mortgage-backed Securities (CMBS) Ratings 13
4 Glossary of Terms Used 14
5 ABS Pools (Initial Pool Details & Pool Performance, as of December 2016 payouts) 17
6 MBS Pools (Initial Pool Details & Pool Performance, as of December 2016 payouts) 39
7 CRISIL Rating Scales 51

CRISIL Performance Report
2
List of ABS originators covered in this publication
Sr. no Originator Name Page no
1 Au Financiers (India) Limited 18
2 Equitas Small Finance Bank Limited 19
3 ESAF Microfinance and Investments Private Limited 21
4 HDB Financial Services Limited 22
5 Indiabulls Infrastruture Credit Limited 23
6 Janalakshmi Financial Services Limited 24
7 Magma Fincorp Limited 27
8 Magma ITL Finance Limited 28
9 Mahindra & Mahindra Financial Services Limited 29
10 Multi Originator 30
11 Muthoot Capital Services Limited 31
12 Muthoot Microfin Limited 32
13 Shriram Transport Finance Company Limited 34
14 SREI Equipment Finance Limited 36
15 Tata Motors Finance Limited 37
16 Ujjivan Financial Services Limited 38
List of MBS originators covered in this publication
Sr. no Name of originator Page no
1 Dewan Housing Finance Corporation Limited 41
2 Housing Development Finance Corporation Limited 42
4 ICICI Bank Limited 43
3 Indiabulls Housing Finance Limited 45
5 LIC Housing Finance Limited 46
6 Reliance Capital Limited 47
7 Reliance Home Finance Private Limited 48
8 Standard Chartered Bank 49
9 Sundaram BNP Paribas Home Finance Limited 50

3
DISCLAIMER
The ratings/credit opinions are not a recommendation to purchase, sell or hold the payouts/facilities in as much as the opinions do
not comment on the market price of the payouts/facilities or its suitability for a particular investor. CRISIL reserves the right to
suspend, withdraw or revise the credit opinions assigned to the payouts/facilities at any time on the basis of new information, or
unavailability of information or other circumstances, which CRISIL believes, may have an impact on the opinions.
The performance update presented in this publication is based on payouts made till December 2016. The ratings/credit opinions
mentioned in this publication are outstanding as on February 28, 2017.
CRISIL has taken due care and caution in preparing this report. Information has been obtained by CRISIL from sources which
considers reliable. However, CRISIL does not guarantee the accuracy, adequacy or completeness of any information, and is not
responsible for any errors in transmission, and especially states that it has no financial liability whatsoever to the subscribers/
users/ transmitters/ distributors of this report.
No part of this report may be reproduced in any form or any means without permission of the publisher.
Contents may be used by news media with due credit to CRISIL.
© CRISIL. All rights reserved.
CRISIL COMPLEXITY LEVELS
CRISIL assigns complexity levels to various types of financial instruments on a voluntary basis. This is a pro-bono exercise aimed
at strengthening Indian capital markets through greater transparency. CRISIL Complexity Levels reflect the ease of understanding
and analysing the risk elements in these instruments and allow investors to gauge the level of sophistication and due diligence
required before investing in any financial product. Instruments are classified into three categories: simple, complex, and highly
complex. This is done using four parameters: ease of calculation of payout and returns, clarity on timing of cash flows, number of
counterparties involved in the transaction, and familiarity of market participants with the instrument. Complexity is distinct from
risk: saying that an instrument is simple is not to say that it is less risky, but the risk will be easier to understand in a simple
instrument than in a complex one. Accordingly, the complexity level applicable to PTC instrument / direct assignment indicated in
the above report is ‘Highly Complex’.
Investors can refer to http://crisil.com/ratings/crisil-complexity-levels-of-financial-instruments.html for more details and a
comprehensive list of CRISIL Complexity Levels or call the Customer Service Helpdesk Toll free number: 1800 267 1301.
CRISIL Performance Report
4
Demonetisation impact on securitised pools reflects V-shaped recovery
Across a number of asset classes, demonetisation’s impact on CRISIL rated securitised pools reflects a V-shaped recovery. The
announcement of the demonetisation process on November 8, 2016 impacted loan repayments in various retail asset classes in
November 2016. Unavailability of legal tender due to withdrawal restrictions severely hampered collections for most non-bank
lenders. Borrowers preferred prioritising the use of cash for personal needs, rather than to service debt. Loan waiver rumours linked
to the Reserve Bank of India’s (RBI’s) notification on deferral of asset classification norms added to the woes of financiers. Asset
classes where collections were predominantly in the form of cash witnessed a sharp drop in collection efficiencies. The impact of
demonetisation was not restricted to any specific geography, and was a pan-India phenomenon.
However, come December 2016 and collections began to recover across loan segments. Most financiers had helped educate
borrowers by then regarding the benefits of using bank facilities and aided them in opening bank accounts. In some regions, such
as the south, return to normalcy was early, due to the higher penetration of banking channels in these states.
CRISIL’s rated securitisation portfolio comprises transactions backed by several asset classes, such as commercial vehicles (CVs),
cars, construction equipment (CE), two-wheelers (TW), tractors, microfinance, housing loans, loans against property (LAP) and
secured business loans. This article covers the performance of 84 asset-backed securities (ABS), 38 mortgage-backed securities
(MBS), and 2 commercial mortgage-backed securities (CMBS) transactions aggregating Rs 280 billion in rated amount.
Collection efficiency for vehicle pools dropped to 92% in the December 2016 payouts (pertaining to collections in November 2016),
with instances of credit collateral (CC) utilisation in some pools. As of January 2017, however, the situation improved and CC was
topped up for most pools.
In microfinance pools, collection ratios in the January 2017 payouts—that is for collections in December 2016—recovered
significantly barring a few geographies where socio-political issues continued to influence borrowers’ repayment behaviour.
Collections were hit in tractor pools immediately post demonetisation primarily because its implementation date coincided with
the typical collections period. In housing loans, however, the impact on collections was minimal, largely because most collections
were not cash-based.
Increasing availability of currency in the banking system and the recent lifting of curbs on cash withdrawals have largely mitigated
the challenges of cash availability for trade. Additionally, the Union Budget has announced rural- and infrastructure-focused
measures along with income tax incentives – which should start providing impetus to consumption spending over the near to
medium term.
CRISIL has been closely monitoring the performance of pools for the impact of demonetisation. Here are the trends observed in
each asset class:
Vehicle pools:
In the weeks following the announcement of demonetisation, collection efficiencies moderated for CRISIL-rated vehicle pools,
comprising CV loans, other automobile loans and construction equipment loans. The impact was more pronounced in CV loans—
where collections are largely cash-based—than in other automobile or construction equipment loans. Freight movement was hit
by demonetisation as truckers faced a shortage of funds, although tolls were waived and old bank notes could be used for purchase
of diesel for some time. Also, lack of funds with the general public resulted in consumption demand and freight movement reducing
across the country. These factors, in turn, constrained truckers’ earnings capabilities and debt servicing ability, particularly in
November 2016.
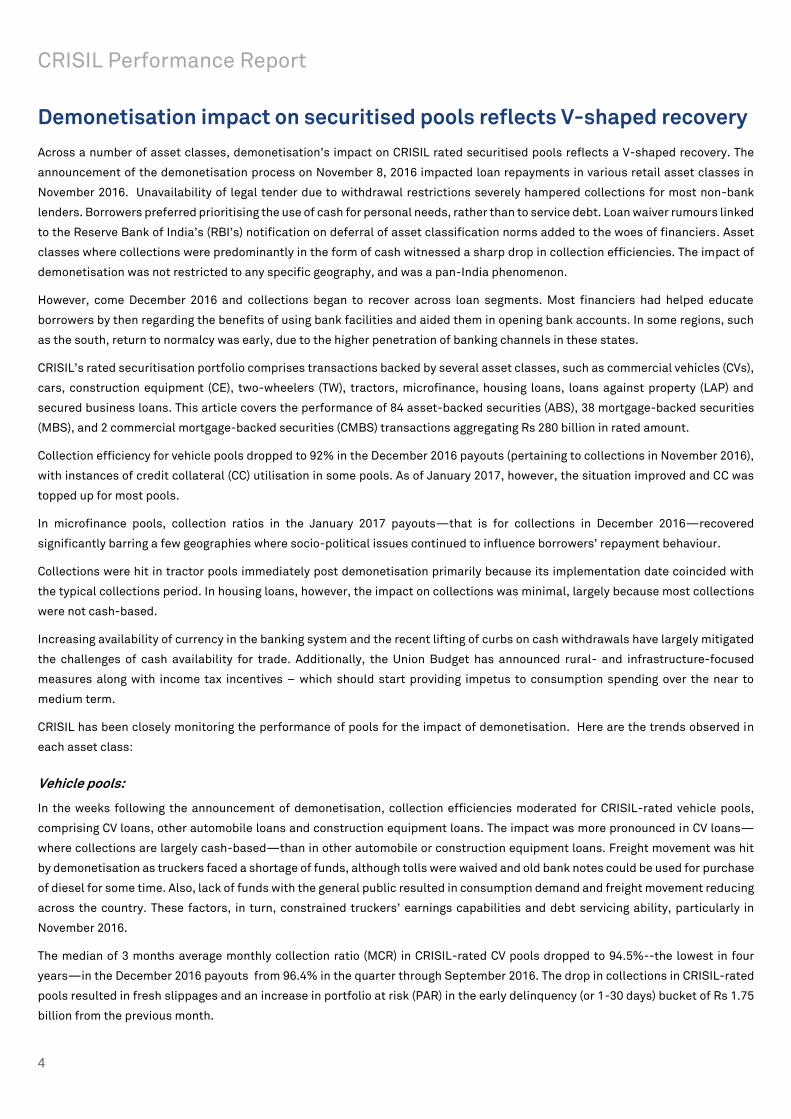
The median of 3 months average monthly collection ratio (MCR) in CRISIL-rated CV pools dropped to 94.5%--the lowest in four
years—in the December 2016 payouts from 96.4% in the quarter through September 2016. The drop in collections in CRISIL-rated
pools resulted in fresh slippages and an increase in portfolio at risk (PAR) in the early delinquency (or 1-30 days) bucket of Rs 1.75
billion from the previous month.
5
The current collections for medium and heavy CVs (MHCVs) dropped to around 75%, although with arrears and advance collections
included, the collections were at 85.8%. For pools backed by new CVs, the impact was higher than in used CV pools, largely because
the EMIs are higher for new vehicle loans.
Currency availability improved for borrowers by mid-December, with increase in cash withdrawal limits. The median MCR for CV
pools, therefore, increased to 92.5% after December’s collections from 88.0% after the November collections. Collection ratios for
CV pools should recover to the pre-demonetisation levels by the quarter through March 2017.
There were instances when CC was utilised in a few pools post demonetisation, although the quantum of utilisation has been low
at under 1% of the stipulated CC.
Tractor pools:
Collection efficiencies were low in tractor pools in the two years through fiscal 2016, because of deficient rainfall and low
agricultural production. Collection ratios had, however, begun to recover in the first half of fiscal 2017, and were expected to remain
steady thereafter, given the good monsoon and improved crop output. However, collection ratios for this asset class went down in
November 2016, post demonetisation.
88.0%
90.0%
92.0%
94.0%
96.0%
98.0%
100.0%
102.0%
104.0%
106.0%D
ec
-10
Ma
r-1
1
Ju
n-1
1
Se
p-1
1
De
c-1
1
Ma
r-1
2
Ju
n-1
2
Se
p-1
2
De
c-1
2
Ma
r-1
3
Ju
n-1
3
Se
p-1
3
De
c-1
3
Ma
r-1
4
Ju
n-1
4
Se
p-1
4
De
c-1
4
Ma
r-1
5
Ju
n-1
5
Se
p-1
5
De
c-1
5
Ma
r-1
6
Ju
n-1
6
Se
p-1
6
De
c-1
6
Chart 1: Three months average MCR for CV pools
3-month average MCR

CRISIL Performance Report
6
*For payout months
While the MCR was 94.4% for tractor pools in the quarter through December 2016, the median specifically for the December payouts
was 78.1%.
Demonetisation coincided with the sale of kharif produce by farmers. Such sales are typically cash-based transactions, and with
unavailability of adequate currency in the system, the farmers faced challenges in offloading the harvest. This impacted their
incomes and debt servicing ability. Most tractor financiers structure loan repayments based on the half-yearly crop cycle to help
agriculture-dependent borrowers service their loans. However, the EMIs are, therefore, chunkier. Moreover, the EMIs for October
and November coincided with the demonetisation announcement, adding to the pressure on the borrowers’ debt repayment ability.
The collection ratios of CRISIL-rated tractor pools, however, recovered to 89.7% in January 2017, from 78.1% in December 2016.
Microfinance pools:
The impact of demonetisation was most pronounced in the microfinance industry, given the cash-intensive nature of its
transactions. Most MFIs tend to operate largely in the rural areas where financial inclusion is low and the economy is largely cash
dependent. The productivity of collection agents reduced significantly as much of their time was spent in helping borrowers
exchange old currency notes for new ones, rather than on the field.
Furthermore, misinterpretation of the RBI notification to extend the period for recognising NPAs for financiers led to loan waiver
rumours for microfinance loans in parts of the country. States such as Uttar Pradesh, Uttarakhand and Maharashtra also faced
local socio-political issues, particularly on account of the upcoming elections in February 2017, compelling borrowers in these
states to default on their MFI loans.
Collections dipped to 20-30% nationwide, in the wake of demonetisation, from 99% earlier. Financiers faced challenges in making
collections in new currency notes. As per data available with CRISIL, collections began to improve by end-November. Recoveries
were far higher in the south, than in the rest of the country. Collections in certain parts of Uttar Pradesh, Maharashtra, Madhya
Pradesh, Chhattisgarh and Uttarakhand were, however, low even two months after demonetisation. Additionally, there were fresh
collection challenges in parts of Karnataka.
0.0%
1.0%
2.0%
3.0%
4.0%
5.0%
6.0%
7.0%
8.0%
0.0%
20.0%
40.0%
60.0%
80.0%
100.0%
120.0%
140.0%
160.0%
FY 2014-15
H1
FY 2014-15
H2
FY 2015-16
H1
FY 2015-16
H2
FY 2016-17
H1
Oct-16 Nov-16 Dec-16
Chart 2: Collection efficiency in tractor pools
Collection efficiency 90+ dpd (RHS)
7
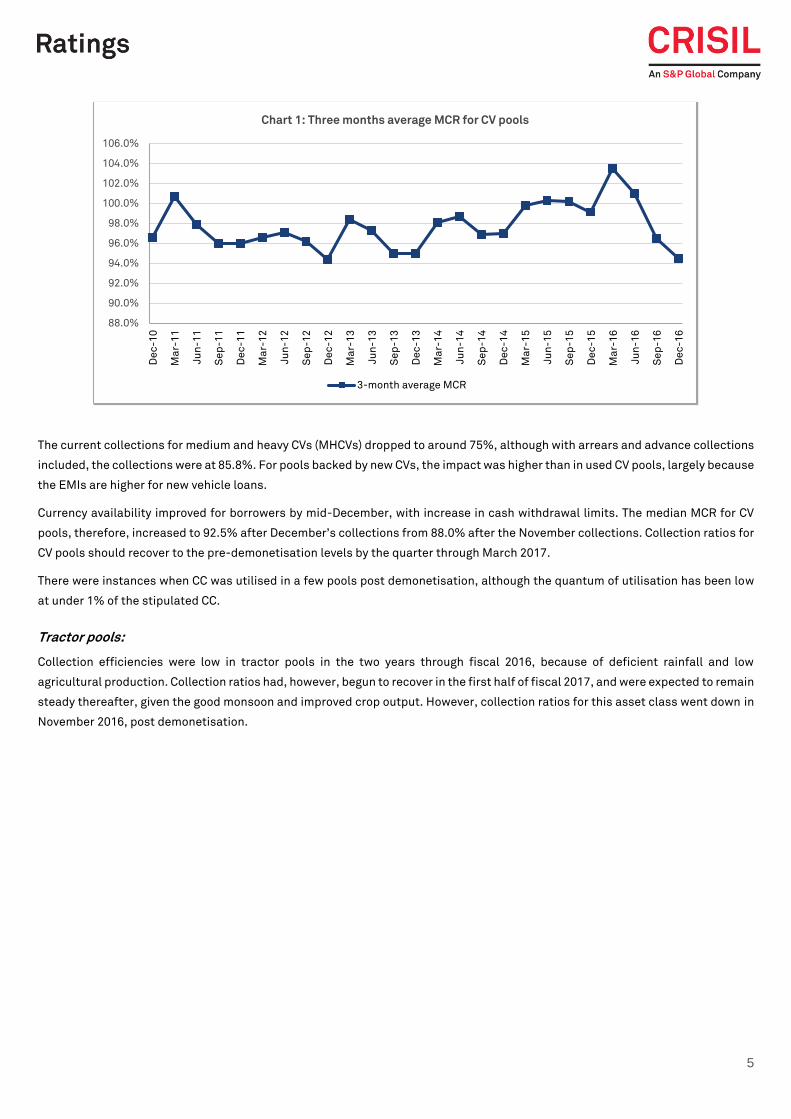
In the weeks following demonetisation, the collection efficiency in CRISIL-rated MFI pools declined in line with that in the industry.
Although collections dropped to around 70% in November 2016, CC utilisation was reported in only one transaction, because most
pools have a timely interest and ultimate principal (TIUP) structure wherein lenders are promised only interest payments on time,
while principal may be serviced even at the end of the transaction. For transactions with a timely interest and timely principal (TITP)
structure, on the other hand, the CC was utilised to ensure both principal and interest were serviced.
Small finance bank (SFB) MFIs retained collection performance despite the demonetisation, with an MCR of around 99% for
November 2016. However, for the December 2016 collections, the MCR moderated to 96.4% owing to local level socio-political
issues plaguing the industry (refer to Chart 3).
Overall, the median collections have improved significantly for all CRISIL-rated MFI pools to around 95%.
Mortgage pools:
In MBS pools, the impact of demonetisation was negligible for those backed by housing loan receivables because the general mode
of repayment for this asset class is by post-dated cheque (PDC) or electronic clearing service (ECS). Collection efficiency stood
unhindered at around 99% for the December 2016 payouts.
While there was no immediate impact on collection ratios in LAP pools for November 2016—when the MCR was 100.8%--the ratio
moderated to 95.5% for the December 2016 collections. LAP loans are generally extended to self-employed borrowers, whose
businesses faced decline in cash flows post demonetisation. Collections are likely to remain low for LAP pools till the underlying
economic activities return to normalcy.
Other asset classes:
Secured business loan pools maintained stable collection performance as these loans are generally originated by SFBs. Two-
wheeler loan pools, however, reported a temporary drop in collections post demonetisation, only to recover soon thereafter. CRISIL
also has ratings outstanding on two CMBS transactions, both of which have maintained Interest Service Coverage Ratio (ISCR) at
levels commensurate with their outstanding ratings.
80.0%
85.0%
90.0%
95.0%
100.0%
105.0%
Mar-16 Apr-16 May-16 Jun-16 Jul-16 Aug-16 Sep-16 Oct-16 Nov-16 Dec-16
Chart 3: Monthly collection efficiency for MFI pools
TIUP (27 pools) TITP (4 pools) SFB (9 pools)

CRISIL Performance Report
8
Outlook:
The impact of demonetisation on collection ratios has varied across asset classes. The degree of variance was a direct outcome of
the dependence on cash for loan repayments. While collection ratios for some asset classes declined sharply as of November 2016,
financiers have reported considerable recovery from the arrear contracts as of December 2016. CRISIL believes the trend of
recoveries will continue over the next few months.
Most asset classes have recovered quickly, while collection ratios in others seem to recover gradually post demonetisation. It is
crucial that financiers avoid large slippages in contracts from the 1-30 delinquency buckets into higher delinquency buckets. Ability
to maintain asset quality will, therefore, remain a key monitorable for financiers. Most financiers were already focused on the early
delinquency buckets, even prior to demonetisation, keeping in mind RBI’s notification regarding NPA recognition at 120+ by March
2017 and 90+ by March 2018. The measures put in place by the financiers will be tested in coming months.
CRISIL will continue to closely monitor the performance of all rated pools until investor payouts are made in full.
70.0%
75.0%
80.0%
85.0%
90.0%
95.0%
100.0%
105.0%
110.0%
Collection efficiency Oct'16 Collection efficiency Nov'16 Collection efficiency Dec'16
Chart 4: Median collection efficiency across asset classes
Vehicle Microfinance Tractor TW Small and High Ticket Size LAP

9
Performance Update – Commercial Vehicle Pools
Chart 5
75%
80%
85%
90%
95%
100%
1 4 7 10 13 16 19 22 25 28 31 34 37 40 43 46
Comparison of CCR across vintages - CV Pools
2008 (31 pools) 2009 (24 pools) 2010 (20 pools)
2011 (25 pools) 2012 (32 pools) 2013 (24 pools)
2014 (9 pools) 2015 (3 pools) 2016 (11 pools)
Month Post Securitisation
Chart 6
0%
2%
4%
6%
8%
1 4 7 10 13 16 19 22 25 28 31 34 37 40 43 46
Total overdues across vintages - CV Pools
2008 (31 pools) 2009 (24 pools) 2010 (20 pools)
2011 (25 pools) 2012 (32 pools) 2013 (24 pools)
2014 (9 pools) 2015 (3 pools) 2016 (11 pools)
Month Post Securitisation
Chart 7
85%
88%
91%
94%
97%
100%
Dec-11Mar-12 Jun-12 Sep-12Dec-12Mar-13 Jun-13 Sep-13Dec-13Mar-14 Jun-14 Sep-14Dec-14Mar-15 Jun-15 Sep-15Dec-15Mar-16 Jun-16 Sep-16Dec-16
Performance month
Amortisation based quarterly movement of Median MCR - CV Pools
20%-50% amortised pools 50%-80% amortised pools
85%
88%
91%
94%
97%
100%
Sep-04 Sep-05 Sep-06 Sep-07 Sep-08 Sep-09 Sep-10 Sep-11 Sep-12 Sep-13 Sep-14 Sep-15 Sep-16
Performance month
CRISIL CCR Index - CV Pools
7-12 13-18 19-24
Chart 8

CRISIL Performance Report
10
Performance Update – Car Pools
Performance Update – MBS Pools
Chart 9
75%
85%
95%
1 4 7 10 13 16 19 22 25 28 31 34 37 40
Comparison of CCR across vintages - Car Pools
2006 (14 pools) 2007 (28 pools) 2008 (4 pools)
2009 (5 pools) 2010 (4 pools) 2012 (1 pool)
2013 (1 pool) 2014 (2 pools)
Month Post Securitisation
Chart 10
0%
2%
4%
6%
8%
1 4 7 10 13 16 19 22 25 28 31 34 37 40
Total overdues across vintages - Car Pools
2006 (14 pools) 2007 (28 pools) 2008 (4 pools)
2009 (5 pools) 2010 (4 pools) 2012 (1 pool)
2013 (1 pool) 2014 (2 pools)
Month Post Securitisation
Chart 11
80%
84%
88%
92%
96%
100%
1 8 15 22 29 36 43 50 57 64 71 78 85 92 99 106113120
Comparison of CCR across vintages - MBS Pools
2004 (3 pools) 2005 (14 pools) 2007 (6 pools)
2008 (1 pool) 2009 (1 pool) 2012 (4 pools)
2013 (5 pools) 2014 (6 pools) 2015 (1 pool)
Month Post Securitisation
Chart 12
0.0%
0.2%
0.4%
0.6%
0.8%
1.0%
1 8 15 22 29 36 43 50 57 64 71 78 85 92 99 106113120
Total overdues across vintages - MBS Pools
2004 (3 pools) 2005 (14 pools) 2007 (6 pools)
2008 (1 pool) 2009 (1 pool) 2012 (4 pools)
2013 (5 pools) 2014 (6 pools) 2015 (1 pool)
Month Post Securitisation
Chart 13
0.0%
20.0%
40.0%
60.0%
80.0%
1 4 7 10 13 16 19 22 25 28 31 34 37 40 43 46 49 52 55 58 61 64 67 70 73 76 79 82 85 88 91 94 97 100103106109112115118
Comparison of prepayments across vintages - MBS Pools
2004 (3 pools) 2005 (14 pools) 2007 (6 pools) 2008 (1 pool) 2009 (1 pool)
Months Post Securitisation

11
Rating Actions
New transactions Table 1 provides the details of 3 new pools that were securitised between December 1, 2016 and February 28,
2017.
Table 1: New pools rated during the period
# Indicates door-to-door tenure. Actual tenure will depend on the level of prepayments in the pools and the exercise of clean-up call option (if
available) in the underlying transactions.
Rating withdrawals Table 2 provides the details of 4 pools whose ratings were withdrawn between December 1, 2016 and February
28, 2017.
Table 2: Pools that were redeemed
Sr. no Originator/Seller Transaction name
1 Shriram Transport Finance Company Limited Sansar Trust Feb 2014 - II
2 Janalakshmi Financial Services Private Limited JFS Microfinance Trust September 2015
3 Janalakshmi Financial Services Private Limited JFS Microfinance Trust-2 September 2015
4 Mahindra and Mahindra Financial Services Limited MMFSL Assignment of Receivables February 2012
Sr.
no Originator/ Seller Transaction name
Asset
class
Instrument
details
Door-to-door
tenure#
(months)
Rated amount
(Rs. Million)
Rating/Credit Opinion
assigned
1 Shriram Transport Finance
Company Limited
Sansar Trust
December 2016 II CV & CE
Series A PTCs 54 4002.0 Provisional CRISIL AAA
(SO)
Second loss
facility 54 281.1
Provisional CRISIL BBB+
(SO) Equivalent
2 Muthoot Capital Services
Limited
Starling CV IFMR
Capital 2016 TW
Series A1 PTCs 41 997.0 Provisional CRISIL A- (SO)
Series A2 PTCs 41 22.1 Provisional CRISIL BBB
(SO)
3 Indiabulls Housing
Finance Limited
Innovation Trust XV
Dec 2016 LAP Series A PTCs 348 5127.0
Provisional CRISIL AAA
(SO)
CRISIL Performance Report
12
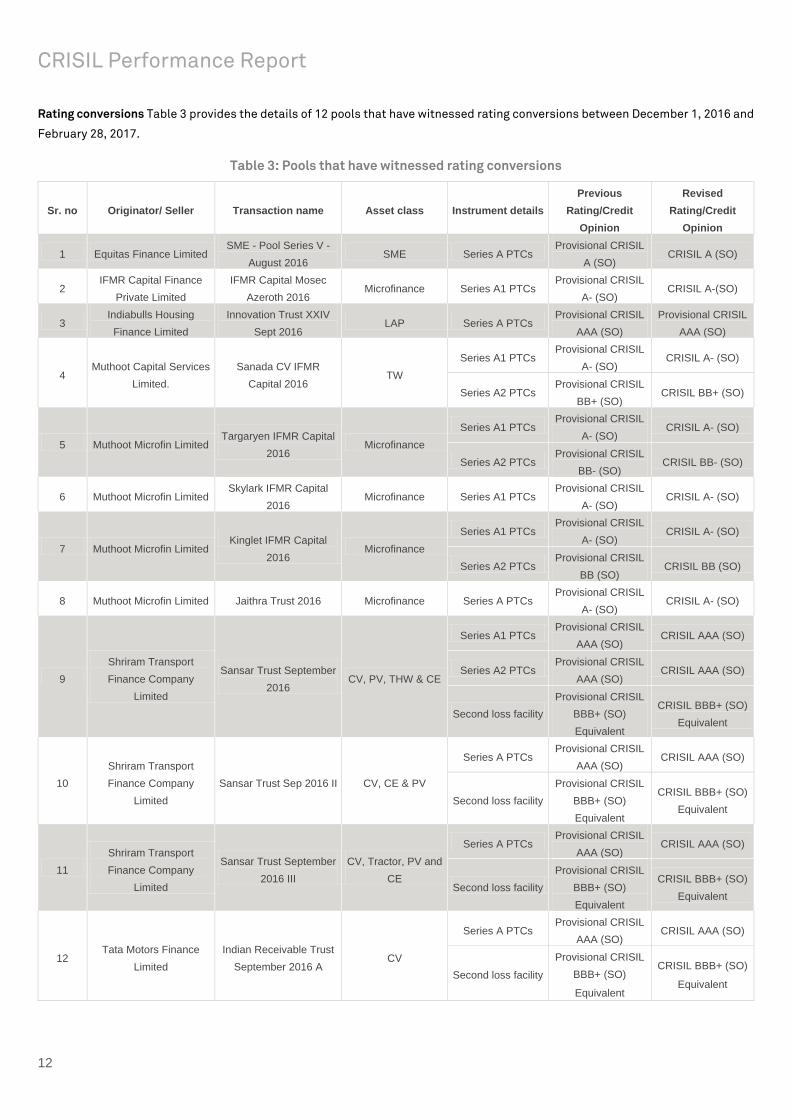
Rating conversions Table 3 provides the details of 12 pools that have witnessed rating conversions between December 1, 2016 and
February 28, 2017.
Table 3: Pools that have witnessed rating conversions
Sr. no Originator/ Seller Transaction name Asset class Instrument details
Previous
Rating/Credit
Opinion
Revised
Rating/Credit
Opinion
1 Equitas Finance Limited SME - Pool Series V -
August 2016 SME Series A PTCs
Provisional CRISIL
A (SO) CRISIL A (SO)
2 IFMR Capital Finance
Private Limited
IFMR Capital Mosec
Azeroth 2016 Microfinance Series A1 PTCs
Provisional CRISIL
A- (SO) CRISIL A-(SO)
3 Indiabulls Housing
Finance Limited
Innovation Trust XXIV
Sept 2016 LAP Series A PTCs
Provisional CRISIL
AAA (SO)
Provisional CRISIL
AAA (SO)
4 Muthoot Capital Services
Limited.
Sanada CV IFMR
Capital 2016 TW
Series A1 PTCs Provisional CRISIL
A- (SO) CRISIL A- (SO)
Series A2 PTCs Provisional CRISIL
BB+ (SO) CRISIL BB+ (SO)
5 Muthoot Microfin Limited Targaryen IFMR Capital
2016 Microfinance
Series A1 PTCs Provisional CRISIL
A- (SO) CRISIL A- (SO)
Series A2 PTCs Provisional CRISIL
BB- (SO) CRISIL BB- (SO)
6 Muthoot Microfin Limited Skylark IFMR Capital
2016 Microfinance Series A1 PTCs
Provisional CRISIL
A- (SO) CRISIL A- (SO)
7 Muthoot Microfin Limited Kinglet IFMR Capital
2016 Microfinance
Series A1 PTCs Provisional CRISIL
A- (SO) CRISIL A- (SO)
Series A2 PTCs Provisional CRISIL
BB (SO) CRISIL BB (SO)
8 Muthoot Microfin Limited Jaithra Trust 2016 Microfinance Series A PTCs Provisional CRISIL
A- (SO) CRISIL A- (SO)
9
Shriram Transport
Finance Company
Limited
Sansar Trust September
2016 CV, PV, THW & CE
Series A1 PTCs Provisional CRISIL
AAA (SO) CRISIL AAA (SO)
Series A2 PTCs Provisional CRISIL
AAA (SO) CRISIL AAA (SO)
Second loss facility
Provisional CRISIL
BBB+ (SO)
Equivalent
CRISIL BBB+ (SO)
Equivalent
10
Shriram Transport
Finance Company
Limited
Sansar Trust Sep 2016 II CV, CE & PV
Series A PTCs Provisional CRISIL
AAA (SO) CRISIL AAA (SO)
Second loss facility
Provisional CRISIL
BBB+ (SO)
Equivalent
CRISIL BBB+ (SO)
Equivalent
11
Shriram Transport
Finance Company
Limited
Sansar Trust September
2016 III
CV, Tractor, PV and
CE
Series A PTCs Provisional CRISIL
AAA (SO) CRISIL AAA (SO)
Second loss facility
Provisional CRISIL
BBB+ (SO)
Equivalent
CRISIL BBB+ (SO)
Equivalent
12 Tata Motors Finance
Limited
Indian Receivable Trust
September 2016 A CV
Series A PTCs Provisional CRISIL
AAA (SO) CRISIL AAA (SO)
Second loss facility
Provisional CRISIL
BBB+ (SO)
Equivalent
CRISIL BBB+ (SO)
Equivalent

13
Commercial Mortgage-backed Securities (CMBS) Ratings
CRISIL has outstanding ratings on two transactions under CMBS as per the table below. As of December 2016, the payout
confirmation for both transactions has been received.
Sr. no Issuer Amount
(Rs. Million) Instrument details
Current Rating/
Credit Opinion
1 DLF Emporio Limited 5250.0 NCDs CRISIL AA (SO)/Stable
2 DLF Promenade Limited 3750.0 NCDs CRISIL AA (SO)/Stable
CRISIL Performance Report
14
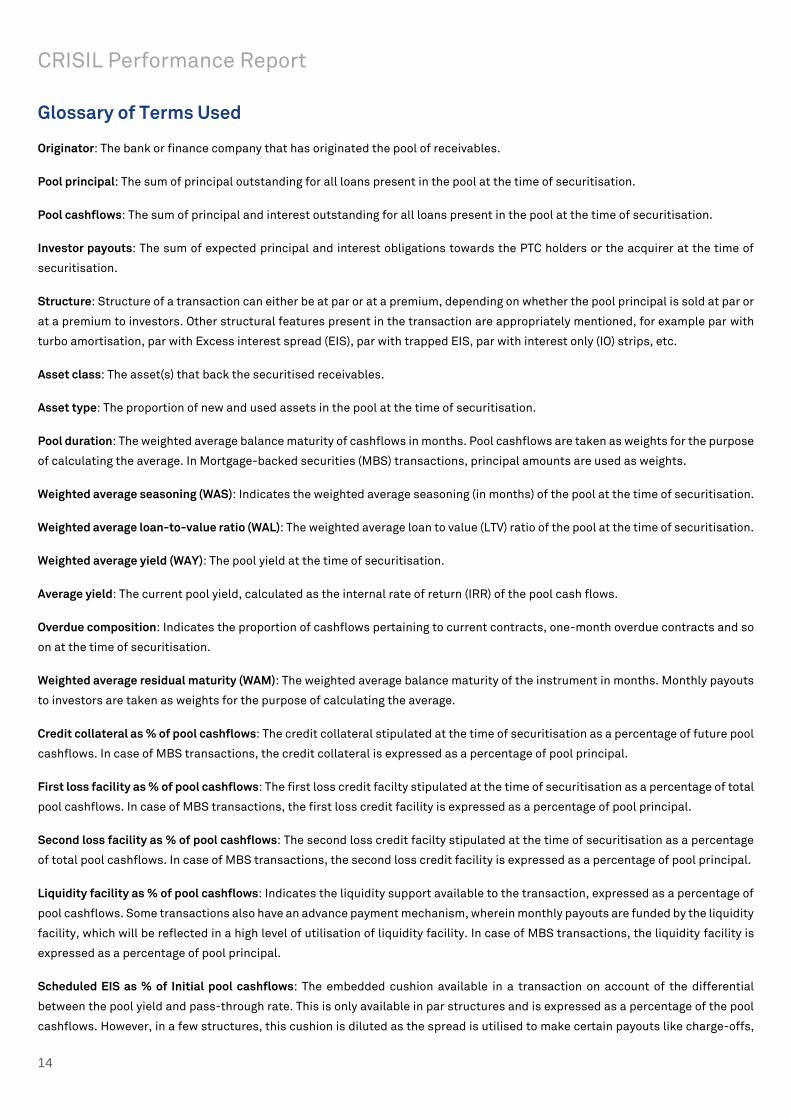
Glossary of Terms Used
Originator: The bank or finance company that has originated the pool of receivables.
Pool principal: The sum of principal outstanding for all loans present in the pool at the time of securitisation.
Pool cashflows: The sum of principal and interest outstanding for all loans present in the pool at the time of securitisation.
Investor payouts: The sum of expected principal and interest obligations towards the PTC holders or the acquirer at the time of
securitisation.
Structure: Structure of a transaction can either be at par or at a premium, depending on whether the pool principal is sold at par or
at a premium to investors. Other structural features present in the transaction are appropriately mentioned, for example par with
turbo amortisation, par with Excess interest spread (EIS), par with trapped EIS, par with interest only (IO) strips, etc.
Asset class: The asset(s) that back the securitised receivables.
Asset type: The proportion of new and used assets in the pool at the time of securitisation.
Pool duration: The weighted average balance maturity of cashflows in months. Pool cashflows are taken as weights for the purpose
of calculating the average. In Mortgage-backed securities (MBS) transactions, principal amounts are used as weights.
Weighted average seasoning (WAS): Indicates the weighted average seasoning (in months) of the pool at the time of securitisation.
Weighted average loan-to-value ratio (WAL): The weighted average loan to value (LTV) ratio of the pool at the time of securitisation.
Weighted average yield (WAY): The pool yield at the time of securitisation.
Average yield: The current pool yield, calculated as the internal rate of return (IRR) of the pool cash flows.
Overdue composition: Indicates the proportion of cashflows pertaining to current contracts, one-month overdue contracts and so
on at the time of securitisation.
Weighted average residual maturity (WAM): The weighted average balance maturity of the instrument in months. Monthly payouts
to investors are taken as weights for the purpose of calculating the average.
Credit collateral as % of pool cashflows: The credit collateral stipulated at the time of securitisation as a percentage of future pool
cashflows. In case of MBS transactions, the credit collateral is expressed as a percentage of pool principal.
First loss facility as % of pool cashflows: The first loss credit facilty stipulated at the time of securitisation as a percentage of total
pool cashflows. In case of MBS transactions, the first loss credit facility is expressed as a percentage of pool principal.
Second loss facility as % of pool cashflows: The second loss credit facilty stipulated at the time of securitisation as a percentage
of total pool cashflows. In case of MBS transactions, the second loss credit facility is expressed as a percentage of pool principal.
Liquidity facility as % of pool cashflows: Indicates the liquidity support available to the transaction, expressed as a percentage of
pool cashflows. Some transactions also have an advance payment mechanism, wherein monthly payouts are funded by the liquidity
facility, which will be reflected in a high level of utilisation of liquidity facility. In case of MBS transactions, the liquidity facility is
expressed as a percentage of pool principal.
Scheduled EIS as % of Initial pool cashflows: The embedded cushion available in a transaction on account of the differential
between the pool yield and pass-through rate. This is only available in par structures and is expressed as a percentage of the pool
cashflows. However, in a few structures, this cushion is diluted as the spread is utilised to make certain payouts like charge-offs,

15
servicing fees, fees to liquidity provider etc. In such cases the actual cushion available to investors due to EIS may be lower than
the amount stated herein. In case of MBS transactions, the EIS is expressed as a percentage of pool principal.
Subordinated cashflows as % of pool cashflows: In certain transactions, the initial pool cash flows are higher than the total payouts
promised to the investors. This could be on account of either over-collateralisation (initial pool principal being higher than the
principal payouts promised to the investors) or EIS (pool yield being higher than the investor yield). The subordinated cash flows
are computed as the difference between the initial pool cash flows and the total payouts promised to the investors expressed as a
percentage of initial pool cash flows. In case of transactions structured at par with EIS (either flow-back or trapped), the credit
support available in the form of subordinated EIS is reported under Scheduled EIS. However, in case of transactions having over-
collateral and in case of transactions structured at par with turbo amortisation (wherein excess cash flows from the pool are used
to prepay the investor’s principal), the credit support available in the form of subordinated cash flows is reported in this section.
Current rating/credit opinion: The current rating assigned by CRISIL to pass-through certificates (PTCs) issued by the SPV, or the
opinion provided by CRISIL on the credit profile of the acquirer payouts in transactions under the assignment of receivables
programme. The ratings/credit opinions mentioned represent CRISIL’s view on the transactions as on February 28, 2017.
Months post securitisation (MPS): The number of payouts elapsed since securitisation
Pool amortisation: The amortised pool principal, as a percentage of pool principal at the time of securitisation.
Cumulative collection ratio (CCR): The ratio of total collections till date to total billings till date. These billings include initial
overdues in the pool at the time of securitisation except in cases where these overdues are not subordinated. In such cases, the
CCR will be understated to that extent in comparison with other pools.
3 month average monthly collection ratio (MCR): The average of the ratio of monthly collections to monthly billings for the last 3
months. These billings and collections do not include prepayments.
Total Collection Efficiency (TCE): The ratio of monthly collections to monthly billings inclusive of overdue billings. These billings
and collections do not include prepayments.
Cumulative prepayments: The ratio of cumulative prepayments (including partial prepayments, wherever available) in a pool to the
pool principal at the time of securitisation.
90+ delinquencies: The unamortised principal plus the overdues on contracts delinquent for more than 90 days plus loss on sale of
repossessed assets (wherever available) as a percentage of pool principal at the time of securitisation.
180+ delinquencies: The unamortised principal plus the overdues on contracts delinquent for more than 180 days plus loss on sale
of repossessed assets (wherever available) as a percentage of pool principal at the time of securitisation.
1+ overdues: The total overdues in the pool plus loss on sale of repossessed assets (wherever available) as a percentage of pool
principal at the time of securitisation.
90+ overdues: The overdues on contracts delinquent for more than 90 days plus loss on sale of repossessed assets (wherever
available) as a percentage of pool principal at the time of securitisation.
Loss on repossession and sale: Cumulative loss/profit on sale of repossessed asset expressed as a percentage of pool principal at
the time of securitisation.
Credit collateral utilisation: The cumulative credit collateral utilised as a percentage of credit collateral stipulated at the time of
initial rating. In case of transactions that have witnessed reset of credit collateral, the utilisation is expressed as a percentage of
credit collateral available in the transaction subsequent to reset.

CRISIL Performance Report
16
Current credit collateral as % of future payouts: The credit collateral outstanding outstanding as a percentage of future investor
payouts. In case of MBS transactions, the credit collateral is expressed as a percentage of pool principal.
EIS as % of future payouts: The EIS outstanding as a percentage of future investor payouts. In case of MBS transactions, the credit
collateral is expressed as a percentage of pool principal.
Threshold collection ratio (TCR): The minimum cumulative collection ratio required on a pool’s future cash flows, to be able to
service the investor payouts on time. The lower the TCR, the lesser will be the degree of credit risk in the pool.
Threshold credit coverage (TCC): TCC represents the ratio of threshold credit loss in a pool (1-TCR) to the actual credit loss as on
date, as indicated by the number of contracts/principal outstanding in respect of contracts overdue for more than 180 days
(excluding charged off contracts).
Abbreviations used
Acronym Description
CE Construction equipment
CV Commercial vehicle
HCV Heavy commercial vehicle
IO Interest only strip
LCV Light commercial vehicle
MHCV Medium and heavy commercial vehicle
MPS Months post securitisation
MSME Micro, small & medium enterprise
MUV Multi-utility vehicle
N.A Not available
PV Passenger vehicle
SCV Small commercial vehicle
THW Three wheeler
TW Two wheeler
UV Utility vehicle
- Not applicable

17
Asset – backed Securities
18
Classification: INTERNAL: CONFIDENTIAL
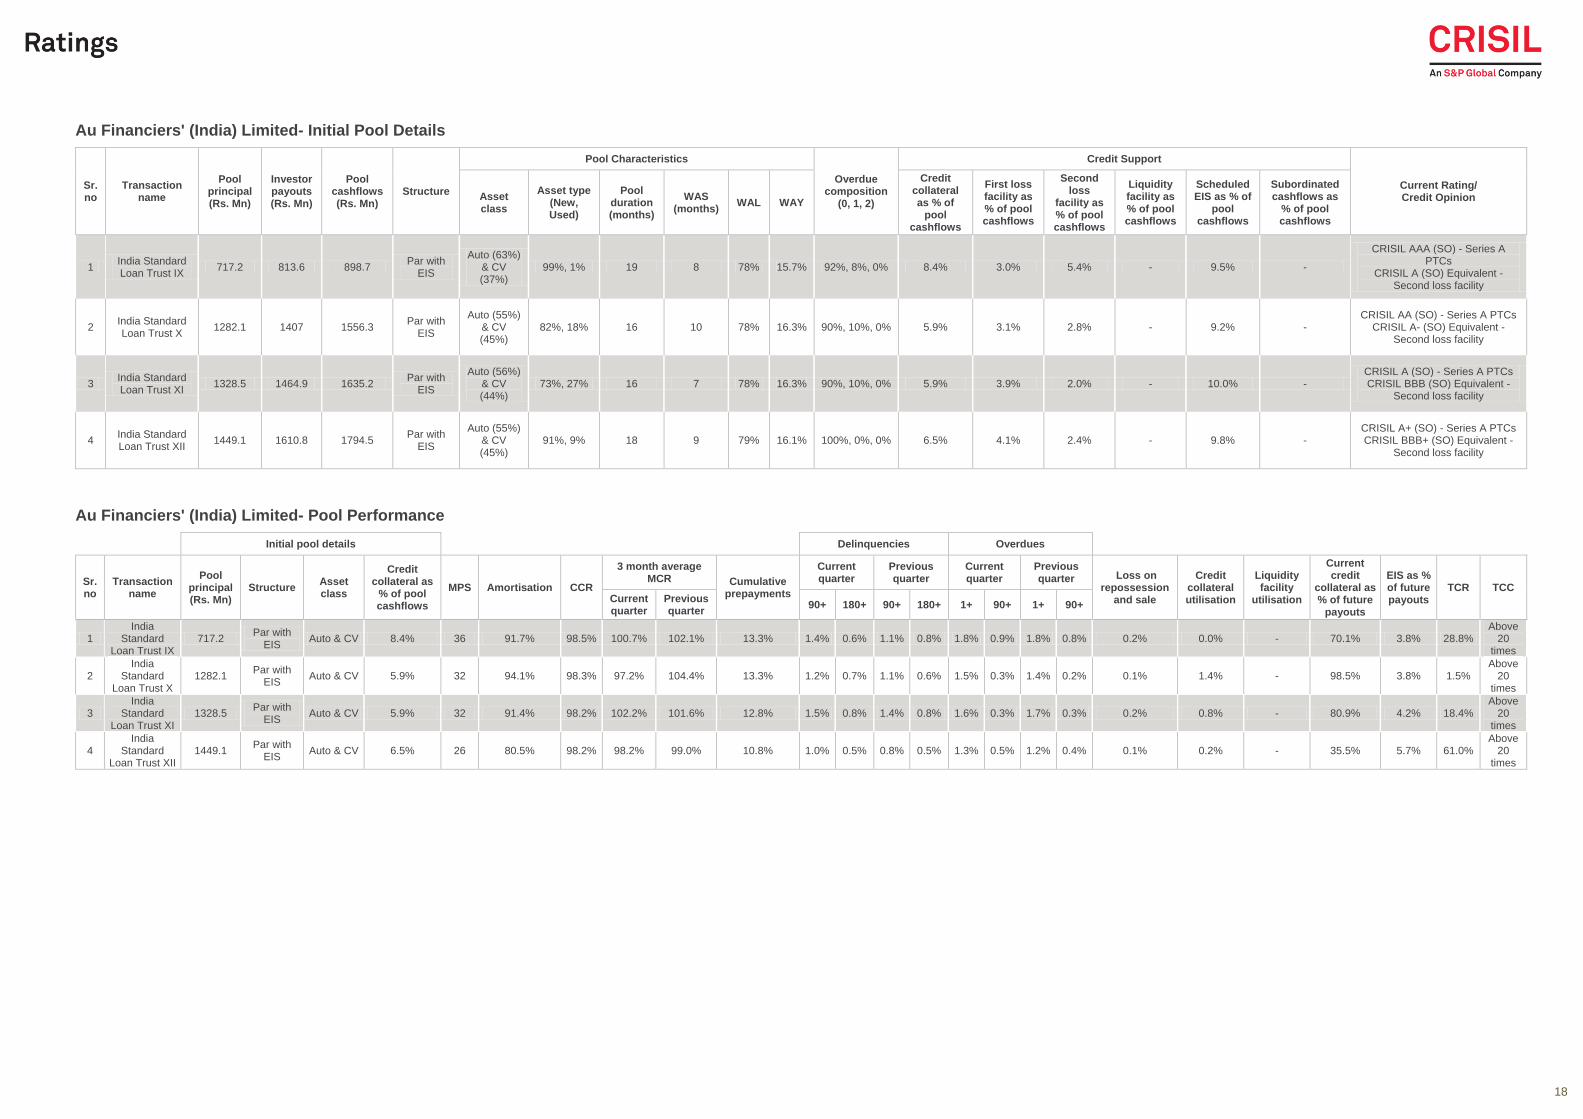
Au Financiers' (India) Limited- Initial Pool Details
Sr. no
Transaction name
Pool principal (Rs. Mn)
Investor payouts (Rs. Mn)
Pool cashflows (Rs. Mn)
Structure
Pool Characteristics
Overdue composition
(0, 1, 2)
Credit Support
Current Rating/ Credit Opinion Asset
class
Asset type (New, Used)
Pool duration (months)
WAS (months)
WAL WAY
Credit collateral as % of
pool cashflows
First loss facility as % of pool cashflows
Second loss
facility as % of pool cashflows
Liquidity facility as % of pool cashflows
Scheduled EIS as % of
pool cashflows
Subordinated cashflows as
% of pool cashflows
1 India Standard Loan Trust IX
717.2 813.6 898.7 Par with
EIS
Auto (63%) & CV (37%)
99%, 1% 19 8 78% 15.7% 92%, 8%, 0% 8.4% 3.0% 5.4% - 9.5% -
CRISIL AAA (SO) - Series A PTCs
CRISIL A (SO) Equivalent - Second loss facility
2 India Standard Loan Trust X
1282.1 1407 1556.3 Par with
EIS
Auto (55%) & CV (45%)
82%, 18% 16 10 78% 16.3% 90%, 10%, 0% 5.9% 3.1% 2.8% - 9.2% - CRISIL AA (SO) - Series A PTCs
CRISIL A- (SO) Equivalent - Second loss facility
3 India Standard Loan Trust XI
1328.5 1464.9 1635.2 Par with
EIS
Auto (56%) & CV (44%)
73%, 27% 16 7 78% 16.3% 90%, 10%, 0% 5.9% 3.9% 2.0% - 10.0% - CRISIL A (SO) - Series A PTCs CRISIL BBB (SO) Equivalent -
Second loss facility
4 India Standard Loan Trust XII
1449.1 1610.8 1794.5 Par with
EIS
Auto (55%) & CV (45%)
91%, 9% 18 9 79% 16.1% 100%, 0%, 0% 6.5% 4.1% 2.4% - 9.8% - CRISIL A+ (SO) - Series A PTCs CRISIL BBB+ (SO) Equivalent -
Second loss facility
Au Financiers' (India) Limited- Pool Performance
Initial pool details Delinquencies Overdues
Sr. no
Transaction name
Pool principal (Rs. Mn)
Structure Asset class
Credit collateral as
% of pool cashflows
MPS Amortisation CCR
3 month average MCR Cumulative
prepayments
Current quarter
Previous quarter
Current quarter
Previous quarter Loss on
repossession and sale
Credit collateral utilisation
Liquidity facility
utilisation
Current credit
collateral as % of future
payouts
EIS as % of future payouts
TCR TCC Current quarter
Previous quarter
90+ 180+ 90+ 180+ 1+ 90+ 1+ 90+
1 India
Standard Loan Trust IX
717.2 Par with
EIS Auto & CV 8.4% 36 91.7% 98.5% 100.7% 102.1% 13.3% 1.4% 0.6% 1.1% 0.8% 1.8% 0.9% 1.8% 0.8% 0.2% 0.0% - 70.1% 3.8% 28.8%
Above 20
times
2 India
Standard Loan Trust X
1282.1 Par with
EIS Auto & CV 5.9% 32 94.1% 98.3% 97.2% 104.4% 13.3% 1.2% 0.7% 1.1% 0.6% 1.5% 0.3% 1.4% 0.2% 0.1% 1.4% - 98.5% 3.8% 1.5%
Above 20
times
3 India
Standard Loan Trust XI
1328.5 Par with
EIS Auto & CV 5.9% 32 91.4% 98.2% 102.2% 101.6% 12.8% 1.5% 0.8% 1.4% 0.8% 1.6% 0.3% 1.7% 0.3% 0.2% 0.8% - 80.9% 4.2% 18.4%
Above 20
times
4 India
Standard Loan Trust XII
1449.1 Par with
EIS Auto & CV 6.5% 26 80.5% 98.2% 98.2% 99.0% 10.8% 1.0% 0.5% 0.8% 0.5% 1.3% 0.5% 1.2% 0.4% 0.1% 0.2% - 35.5% 5.7% 61.0%
Above 20
times
19
Classification: INTERNAL: CONFIDENTIAL
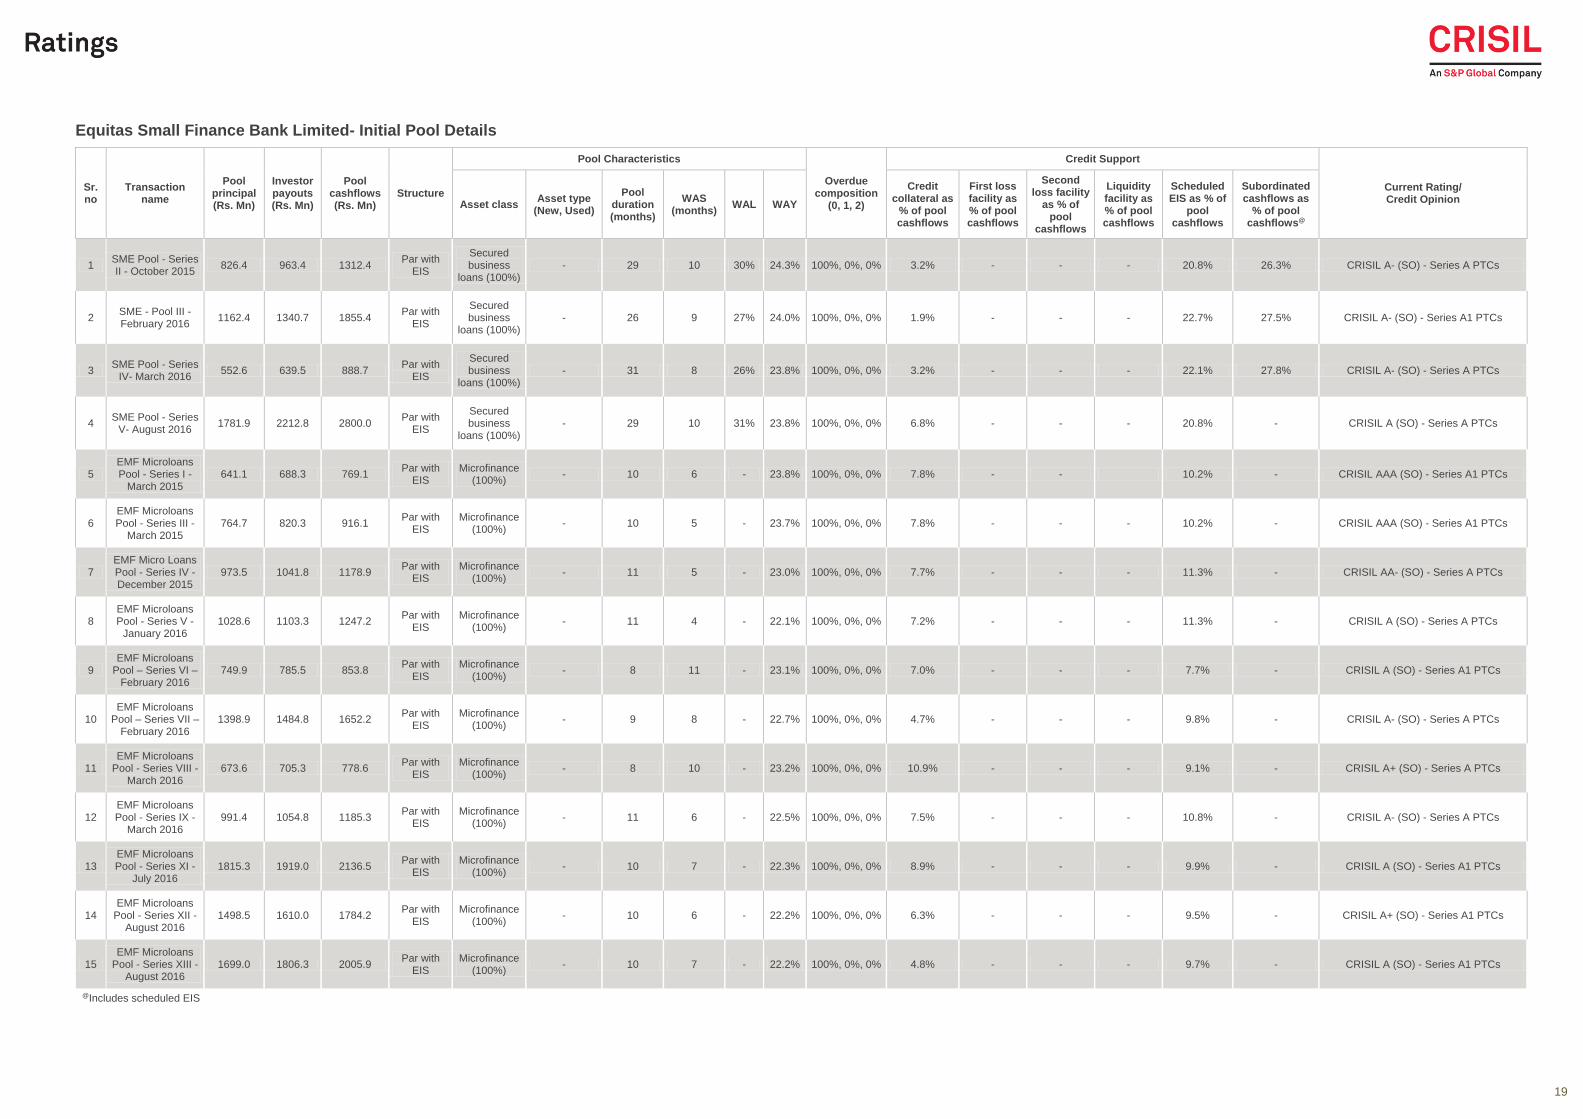
Equitas Small Finance Bank Limited- Initial Pool Details
Sr. no
Transaction name
Pool principal (Rs. Mn)
Investor payouts (Rs. Mn)
Pool cashflows (Rs. Mn)
Structure
Pool Characteristics
Overdue composition
(0, 1, 2)
Credit Support
Current Rating/ Credit Opinion
Asset class Asset type
(New, Used)
Pool duration (months)
WAS (months)
WAL WAY
Credit collateral as
% of pool cashflows
First loss facility as % of pool cashflows
Second loss facility
as % of pool
cashflows
Liquidity facility as % of pool cashflows
Scheduled EIS as % of
pool cashflows
Subordinated cashflows as
% of pool cashflows@
1 SME Pool - Series II - October 2015
826.4 963.4 1312.4 Par with
EIS
Secured business
loans (100%) - 29 10 30% 24.3% 100%, 0%, 0% 3.2% - - - 20.8% 26.3% CRISIL A- (SO) - Series A PTCs
2 SME - Pool III - February 2016
1162.4 1340.7 1855.4 Par with
EIS
Secured business
loans (100%) - 26 9 27% 24.0% 100%, 0%, 0% 1.9% - - - 22.7% 27.5% CRISIL A- (SO) - Series A1 PTCs
3 SME Pool - Series
IV- March 2016 552.6 639.5 888.7
Par with EIS
Secured business
loans (100%) - 31 8 26% 23.8% 100%, 0%, 0% 3.2% - - - 22.1% 27.8% CRISIL A- (SO) - Series A PTCs
4 SME Pool - Series
V- August 2016 1781.9 2212.8 2800.0
Par with EIS
Secured business
loans (100%) - 29 10 31% 23.8% 100%, 0%, 0% 6.8% - - - 20.8% - CRISIL A (SO) - Series A PTCs
5 EMF Microloans Pool - Series I -
March 2015 641.1 688.3 769.1
Par with EIS
Microfinance (100%)
- 10 6 - 23.8% 100%, 0%, 0% 7.8% - - 10.2% - CRISIL AAA (SO) - Series A1 PTCs
6 EMF Microloans Pool - Series III -
March 2015 764.7 820.3 916.1
Par with EIS
Microfinance (100%)
- 10 5 - 23.7% 100%, 0%, 0% 7.8% - - - 10.2% - CRISIL AAA (SO) - Series A1 PTCs
7 EMF Micro Loans Pool - Series IV -December 2015
973.5 1041.8 1178.9 Par with
EIS Microfinance
(100%) - 11 5 - 23.0% 100%, 0%, 0% 7.7% - - - 11.3% - CRISIL AA- (SO) - Series A PTCs
8 EMF Microloans Pool - Series V -
January 2016 1028.6 1103.3 1247.2
Par with EIS
Microfinance (100%)
- 11 4 - 22.1% 100%, 0%, 0% 7.2% - - - 11.3% - CRISIL A (SO) - Series A PTCs
9 EMF Microloans
Pool – Series VI – February 2016
749.9 785.5 853.8 Par with
EIS Microfinance
(100%) - 8 11 - 23.1% 100%, 0%, 0% 7.0% - - - 7.7% - CRISIL A (SO) - Series A1 PTCs
10 EMF Microloans
Pool – Series VII – February 2016
1398.9 1484.8 1652.2 Par with
EIS Microfinance
(100%) - 9 8 - 22.7% 100%, 0%, 0% 4.7% - - - 9.8% - CRISIL A- (SO) - Series A PTCs
11 EMF Microloans
Pool - Series VIII - March 2016
673.6 705.3 778.6 Par with
EIS Microfinance
(100%) - 8 10 - 23.2% 100%, 0%, 0% 10.9% - - - 9.1% - CRISIL A+ (SO) - Series A PTCs
12 EMF Microloans Pool - Series IX -
March 2016 991.4 1054.8 1185.3
Par with EIS
Microfinance (100%)
- 11 6 - 22.5% 100%, 0%, 0% 7.5% - - - 10.8% - CRISIL A- (SO) - Series A PTCs
13 EMF Microloans Pool - Series XI -
July 2016 1815.3 1919.0 2136.5
Par with EIS
Microfinance (100%)
- 10 7 - 22.3% 100%, 0%, 0% 8.9% - - - 9.9% - CRISIL A (SO) - Series A1 PTCs
14 EMF Microloans
Pool - Series XII - August 2016
1498.5 1610.0 1784.2 Par with
EIS Microfinance
(100%) - 10 6 - 22.2% 100%, 0%, 0% 6.3% - - - 9.5% - CRISIL A+ (SO) - Series A1 PTCs
15 EMF Microloans
Pool - Series XIII - August 2016
1699.0 1806.3 2005.9 Par with
EIS Microfinance
(100%) - 10 7 - 22.2% 100%, 0%, 0% 4.8% - - - 9.7% - CRISIL A (SO) - Series A1 PTCs
@Includes scheduled EIS

20
Classification: INTERNAL: CONFIDENTIAL
Equitas Small Finance Bank Limited- Pool Performance
Initial pool details Delinquencies Overdues
Sr. no
Transaction name
Pool principal (Rs. Mn)
Structure Asset class
Credit collateral as
% of pool cashflows
MPS Amortisation CCR
3 month average MCR Cumulative
prepayments
Current quarter
Previous quarter
Current quarter
Previous quarter Loss on
repossession and sale
Credit collateral utilisation
Liquidity facility
utilisation
Current credit
collateral as % of future
payouts
EIS as % of future payouts
TCR TCC Current quarter
Previous quarter
90+ 180+ 90+ 180+ 1+ 90+ 1+ 90+
1 SME Pool - Series II -
October 2015 826.4
Par with EIS
Secured business
loans 3.2% 14 26.7% 99.2% 98.1% 99.3% 7.7% 1.0% 0.7% 0.7% 0.5% 0.4% 0.3% 0.2% 0.2% N.A 0.0% - 6.6% 23.4% 69.9%
Above 20
times
2 SME - Pool III - February 2016
1162.4 Par with
EIS
Secured business
loans 1.9% 10 17.6% 99.6% 99.1% 99.7% 4.9% 0.3% 0.1% 0.1% 0.0% 0.1% 0.0% 0.0% 0.0% N.A 0.0% - 3.4% 35.5% 71.3%
Above 20
times
3 SME Pool -
Series IV- March 2016
552.6 Par with
EIS
Secured business
loans 3.2% 9 14.9% 99.4% 98.6% 99.7% 4.1% 0.3% 0.1% 0.2% 0.0% 0.2% 0.1% 0.0% 0.0% N.A 0.0% - 5.5% 26.8% 69.5%
Not relevant
4 SME Pool -
Series V- August 2016
1781.9 Par with
EIS
Secured business
loans 6.8% 4 6.8% 99.5% 99.3% 99.9% 1.5% 0.0% 0.0% 0.0% 0.0% 0.0% 0.0% 0.0% 0.0% N.A 0.0% - 9.3% 24.3% 73.0%
Not relevant
5 EMF Microloans Pool - Series I -
March 20152 641.1
Par with EIS
Microfinance 7.8% 19 94.3% 99.8% 99.8% 99.8% 9.5% 0.1% 0.1% 0.1% 0.1% 0.1% 0.1% 0.1% 0.1% - 0.0% - Fully covered 1.9% 0.0% Not
relevant
6 EMF Microloans Pool - Series III -
March 20151 764.7
Par with EIS
Microfinance 7.8% 19 92.2% 99.8% 99.6% 99.9% 8.7% 0.3% 0.3% 0.3% 0.2% 0.2% 0.2% 0.2% 0.1% - 0.0% - Fully covered 2.1% 0.0% Not
relevant
7 EMF Micro Loans Pool - Series IV -December 2015
973.5 Par with
EIS Microfinance 7.7% 12 53.7% 99.9% 99.6% 99.9% 1.0% 0.1% 0.0% 0.0% 0.0% 0.1% 0.0% 0.0% 0.0% - 0.0% - 19.5% 5.9% 75.9%
Above 20
times
8 EMF Microloans Pool - Series V -
January 2016 1028.6
Par with EIS
Microfinance 7.2% 11 46.6% 99.9% 99.6% 99.9% 0.7% 0.0% 0.0% 0.0% 0.0% 0.1% 0.0% 0.0% 0.0% - 0.0% - 15.8% 6.6% 79.1% Above
20 times
9 EMF Microloans Pool – Series VI – February 2016
749.9 Par with
EIS Microfinance 7.0% 10 69.6% 99.9% 99.9% 99.9% 9.8% 0.1% 0.0% 0.0% 0.0% 0.1% 0.0% 0.0% 0.0% - 0.0% - 25.6% 5.0% 70.8%
Above 20
times
10 EMF Microloans Pool – Series VII – February 2016
1398.9 Par with
EIS Microfinance 4.7% 10 57.3% 99.8% 99.6% 99.9% 4.1% 0.1% 0.0% 0.0% 0.0% 0.1% 0.0% 0.0% 0.0% - 0.0% - 12.6% 6.2% 82.9%
Above 20
times
11 EMF Microloans Pool - Series VIII
- March 2016 673.6
Par with EIS
Microfinance 10.9% 9 61.2% 100.0% 99.9% 100.0% 1.7% 0.0% 0.0% 0.0% 0.0% 0.0% 0.0% 0.0% 0.0% - 0.0% - 31.7% 4.6% 65.3% Above
20 times
12 EMF Microloans Pool - Series IX -
March 2016 991.4
Par with EIS
Microfinance 7.5% 9 45.8% 99.9% 99.8% 100.0% 1.0% 0.0% 0.0% 0.0% 0.0% 0.0% 0.0% 0.0% 0.0% - 0.0% - 16.0% 7.0% 78.6% Above
20 times
13 EMF Microloans Pool - Series XI -
July 2016 1815.2826
Par with EIS
Microfinance 8.9% 5 29.6% 99.9% 99.8% 100.0% 1.3% 0.0% 0.0% 0.0% 0.0% 0.0% 0.0% 0.0% 0.0% - 0.0% - 14.2% 8.5% 79.2% Not
relevant
14 EMF Microloans
Pool - Series XII - August 2016
1498.5 Par with
EIS Microfinance 6.3% 4 20.8% 99.8% 99.7% 100.0% 0.6% 0.0% 0.0% 0.0% 0.0% 0.1% 0.0% 0.0% 0.0% - 0.0% - 9.0% 8.9% 83.6%
Not relevant
15 EMF Microloans Pool - Series XIII
- August 2016 1699.0
Par with EIS
Microfinance 4.8% 4 22.6% 99.7% 99.7% 99.9% 0.8% 0.0% 0.0% 0.0% 0.0% 0.1% 0.0% 0.0% 0.0% - 0.0% - 6.9% 8.7% 85.6% Not
relevant
1 Data as of November'16 payouts
2 Data as of October'16 payouts

21
Classification: INTERNAL: CONFIDENTIAL
ESAF Microfinance and Investments Private Limited- Initial Pool Details
Sr. no
Transaction name
Pool principal (Rs. Mn)
Investor payouts (Rs. Mn)
Pool cashflows (Rs. Mn)
Structure
Pool Characteristics
Overdue composition
(0, 1, 2)
Credit Support
Current Rating/ Credit Opinion Asset
class Asset type
(New, Used)
Pool duration (months)
WAS (months)
WAL WAY
Credit collateral as
% of pool cashflows
First loss facility as %
of pool cashflows
Second loss facility
as % of pool
cashflows
Liquidity facility as % of pool cashflows
Scheduled EIS as % of pool
cashflows
Subordinated cashflows as
% of pool cashflows@
1 Cedar MFI Trust
23 530.2 530.2 608.8
Par with EIS
Microfinance (100%)
- 8 7 - 24.8% 100%, 0%,
0% 4.4% - - - 8.4% 12.8% CRISIL BBB (SO) - Series A PTCs
2 Cedar MFI Trust
24 530.1 527.7 610.1
Par with EIS
Microfinance (100%)
- 8 7 - 24.9% 100%, 0%,
0% 4.3% - - - 8.4% 13.4% CRISIL BBB+ (SO) - Series A PTCs
3 Cedar MFI Trust
27 979.1 978.6 1138.8
Par with EIS
Microfinance (100%)
- 8 4 - 24.4% 100%, 0%,
0% 4.3% - - - 8.5% 13.4%
CRISIL BBB (SO) [Watch developing]- Series A PTCs
4 Cedar MFI Trust
28 751.9 760.8 872.5
Par with EIS
Microfinance (100%)
- 9 5 - 24.4% 100%, 0%,
0% 3.7% - - - 8.6% 12.8% CRISIL BBB (SO) - Series A PTCs
5 Cedar MFI Trust
30 526.4 528.1 602.0
Par with EIS
Microfinance (100%)
- 8 4 - 23.0% 100%, 0%,
0% 3.9% - - - 7.9% 12.3% CRISIL BBB (SO) - Series A1 PTCs
@Includes scheduled EIS
ESAF Microfinance and Investments Private Limited- Pool Performance
Initial pool details Delinquencies Overdues
Sr. no
Transaction name
Pool principal (Rs. Mn)
Structure Asset class
Credit collateral as
% of pool cashflows
MPS Amortisation CCR
3 month average MCR
Cumulative prepayments
Current quarter
Previous quarter
Current quarter
Previous quarter Loss on
repossession and sale
Credit collateral utilisation
Liquidity facility
utilisation
Current credit
collateral as % of future
payouts
EIS as % of future payouts
TCR TCC Current quarter
Previous quarter
90+ 180+ 90+ 180+ 1+ 90+ 1+ 90+
1 Cedar MFI Trust
23 530.2
Par with EIS
Microfinance 4.4% 10 72.6% 98.9% 94.4% 100.0% 5.4% 0.1% 0.1% 0.1% 0.1% 0.7% 0.1% 0.1% 0.0% - 0.0% - 22.1% 5.6% 60.2% Above
20 times
2 Cedar MFI Trust
24 530.1
Par with EIS
Microfinance 4.3% 11 73.6% 99.2% 94.5% 100.0% 6.7% 0.1% 0.1% 0.1% 0.0% 0.7% 0.0% 0.0% 0.0% - 0.0% - 23.4% 6.2% 59.8% Above
20 times
3 Cedar MFI Trust
27 979.1
Par with EIS
Microfinance 4.3% 7 52.3% 96.0% 89.7% 100.0% 3.9% 0.1% 0.0% 0.0% 0.0% 2.5% 0.0% 0.0% 0.0% - 32.0% - 7.7% 8.8% 76.2% Above
20 times
4 Cedar MFI Trust
28 751.9
Par with EIS
Microfinance 3.7% 7 50.0% 97.9% 94.0% 99.9% 4.5% 0.1% 0.0% 0.0% 0.0% 0.4% 0.0% 0.0% 0.0% - 0.0% - 9.1% 8.7% 76.0% Above
20 times
5 Cedar MFI Trust
30 526.4
Par with EIS
Microfinance 3.9% 6 46.7% 97.7% 94.6% 100.0% 3.1% 0.1% 0.0% 0.0% 0.0% 0.3% 0.0% 0.0% 0.0% - 0.0% - 9.0% 7.3% 77.3% Not
relevant
22
Classification: INTERNAL: CONFIDENTIAL
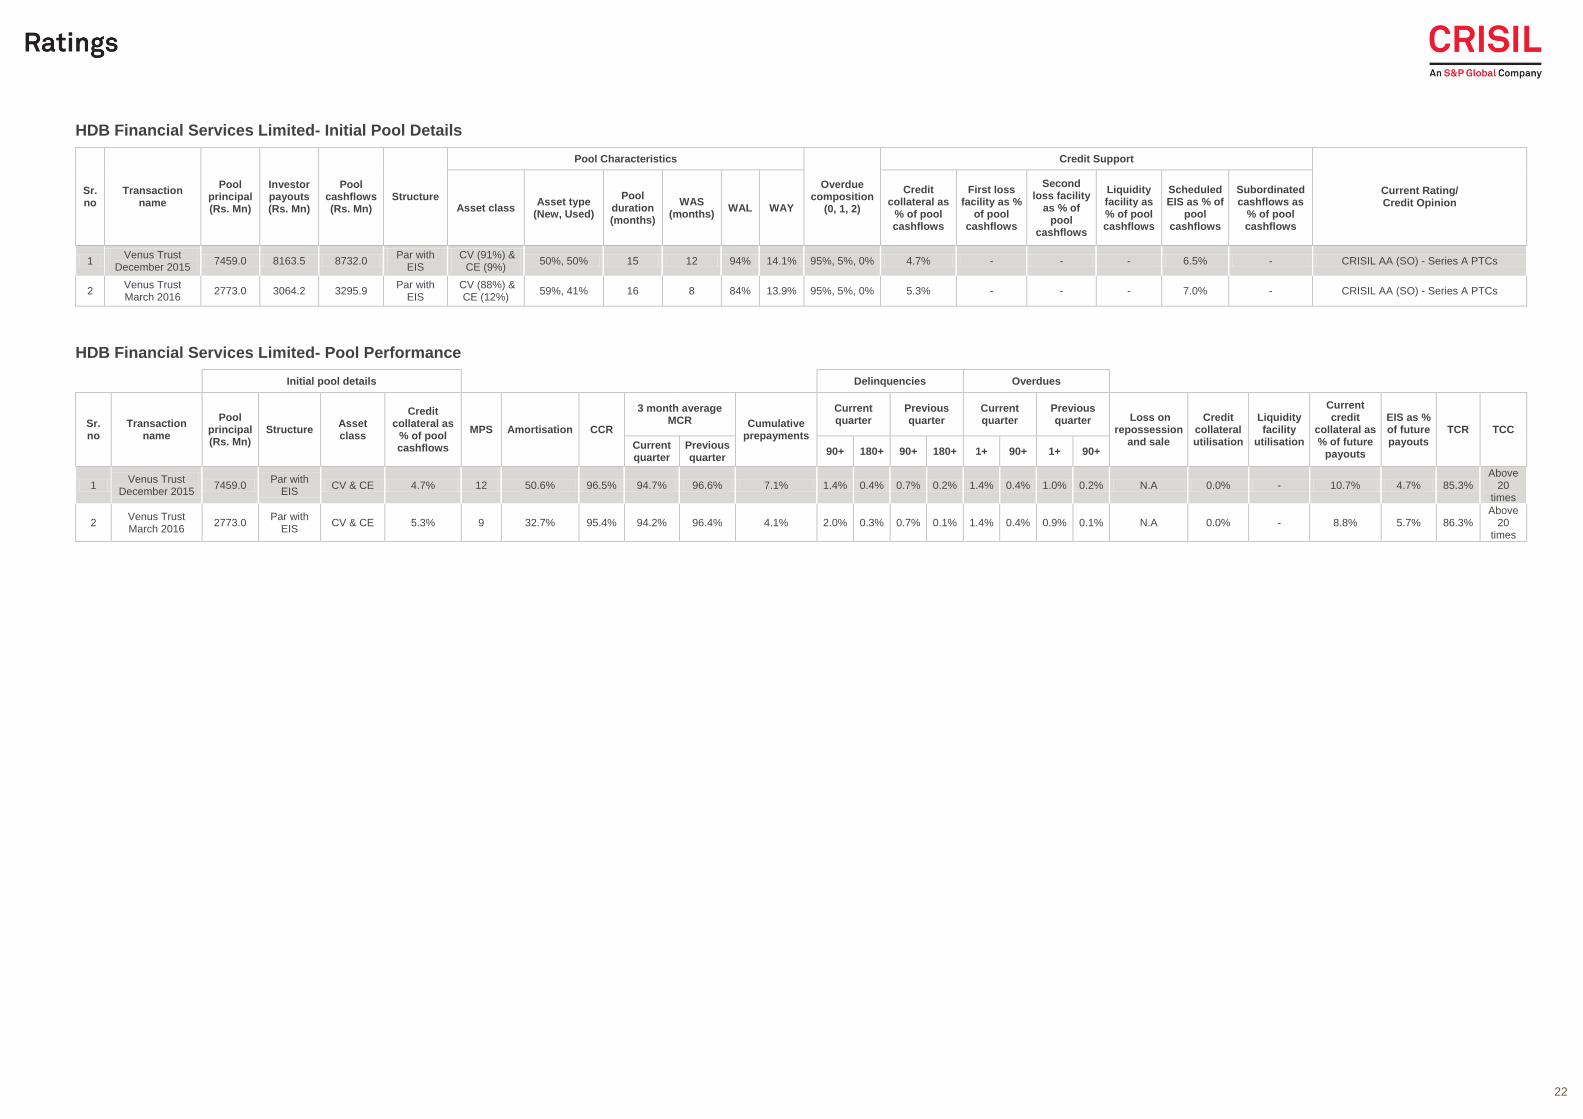
HDB Financial Services Limited- Initial Pool Details
Sr. no
Transaction name
Pool principal (Rs. Mn)
Investor payouts (Rs. Mn)
Pool cashflows (Rs. Mn)
Structure
Pool Characteristics
Overdue composition
(0, 1, 2)
Credit Support
Current Rating/ Credit Opinion
Asset class Asset type
(New, Used)
Pool duration (months)
WAS (months)
WAL WAY
Credit collateral as
% of pool cashflows
First loss facility as %
of pool cashflows
Second loss facility
as % of pool
cashflows
Liquidity facility as % of pool cashflows
Scheduled EIS as % of
pool cashflows
Subordinated cashflows as
% of pool cashflows
1 Venus Trust
December 2015 7459.0 8163.5 8732.0
Par with EIS
CV (91%) & CE (9%)
50%, 50% 15 12 94% 14.1% 95%, 5%, 0% 4.7% - - - 6.5% - CRISIL AA (SO) - Series A PTCs
2 Venus Trust March 2016
2773.0 3064.2 3295.9 Par with
EIS CV (88%) &
CE (12%) 59%, 41% 16 8 84% 13.9% 95%, 5%, 0% 5.3% - - - 7.0% - CRISIL AA (SO) - Series A PTCs
HDB Financial Services Limited- Pool Performance
Initial pool details Delinquencies Overdues
Sr. no
Transaction name
Pool principal (Rs. Mn)
Structure Asset class
Credit collateral as
% of pool cashflows
MPS Amortisation CCR
3 month average MCR Cumulative
prepayments
Current quarter
Previous quarter
Current quarter
Previous quarter Loss on
repossession and sale
Credit collateral utilisation
Liquidity facility
utilisation
Current credit
collateral as % of future
payouts
EIS as % of future payouts
TCR TCC
Current quarter
Previous quarter
90+ 180+ 90+ 180+ 1+ 90+ 1+ 90+
1 Venus Trust
December 2015 7459.0
Par with EIS
CV & CE 4.7% 12 50.6% 96.5% 94.7% 96.6% 7.1% 1.4% 0.4% 0.7% 0.2% 1.4% 0.4% 1.0% 0.2% N.A 0.0% - 10.7% 4.7% 85.3% Above
20 times
2 Venus Trust March 2016
2773.0 Par with
EIS CV & CE 5.3% 9 32.7% 95.4% 94.2% 96.4% 4.1% 2.0% 0.3% 0.7% 0.1% 1.4% 0.4% 0.9% 0.1% N.A 0.0% - 8.8% 5.7% 86.3%
Above 20
times

23
Classification: INTERNAL: CONFIDENTIAL
Indiabulls Infrastructure Credit Limited- Initial Pool Details
Sr. no
Transaction name
Pool principal (Rs. Mn)
Investor payouts (Rs. Mn)
Pool cashflows (Rs. Mn)
Structure
Pool Characteristics
Overdue composition
(0, 1, 2)
Credit Support
Current Rating/ Credit Opinion
Asset class Asset type
(New, Used)
Pool duration (months)
WAS (months)
WAL WAY
Credit collateral as
% of pool cashflows
First loss facility as %
of pool cashflows
Second loss facility
as % of pool
cashflows
Liquidity facility as % of pool cashflows
Scheduled EIS as % of
pool cashflows
Subordinated cashflows as
% of pool cashflows
1 Innovation Trust XXI Mar 2014
1463.8 1672.0 1807.6 Par with
EIS CV (100%) 85%, 15% 20 7 92% 13.5%
85%, 15%, 0%
10.0% - - - 7.5% - CRISIL AA+ (SO) - Series A PTCs
Indiabulls Infrastructure Credit Limited- Pool Performance
Initial pool details Delinquencies Overdues
Sr. no
Transaction name
Pool principal (Rs. Mn)
Structure Asset class
Credit collateral as
% of pool cashflows
MPS Amortisation CCR
3 month average MCR Cumulative
prepayments
Current quarter
Previous quarter
Current quarter
Previous quarter Loss on
repossession and sale$
Credit collateral utilisation
Liquidity facility
utilisation
Current credit
collateral as % of future
payouts
EIS as % of future payouts
TCR TCC
Current quarter
Previous quarter
90+ 180+ 90+ 180+ 1+ 90+ 1+ 90+
1 Innovation Trust XXI Mar 2014
1463.8 Par with flowback
EIS CV 10.0% 33 84.5% 96.5% 94.0% 96.5% 8.3% 4.5% 3.5% 5.1% 3.9% 4.1% 3.0% 4.3% 3.4% 1.3% 0.0% - 76.3% 2.4% 23.1% 15.2
$ Data as of May 2016 payouts

24
Classification: INTERNAL: CONFIDENTIAL
Janalakshmi Financial Services Limited- Initial Pool Details
Sr. no
Transaction name
Pool principal (Rs. Mn)
Investor payouts (Rs. Mn)
Pool cashflows (Rs. Mn)
Structure
Pool Characteristics
Overdue composition
(0, 1, 2)
Credit Support
Current Rating/ Credit Opinion
Asset class Asset type
(New, Used)
Pool duration (months)
WAS (months)
WAL WAY
Credit collateral as
% of pool cashflows
First loss facility as %
of pool cashflows
Second loss facility
as % of pool
cashflows
Liquidity facility as % of pool cashflows
Scheduled EIS as % of
pool cashflows
Subordinated cashflows as
% of pool cashflows@
1 JFS Microfinance Trust September
2015 836.3 777.7 962.2
Par with EIS
Microfinance (100%)
- 6 8 - 24.0% 100%, 0%,
0% 6.5% - - - 7.7% 13.7% Rating withdrawn
2 JFS Microfinance
Trust-2 September 2015
2762.2 2500.0 3144.8 Par with
EIS Microfinance
(100%) - 7 7 - 24.2%
100%, 0%, 0%
5.2% - - - 7.6% 15.9% Rating withdrawn
3 Libertas IFMR Capital 2015
1915.0 1819.2 2204.9 Par with
EIS Microfinance
(100%) - 9 6 - 23.9%
100%, 0%, 0%
1.7% - - - 8.0%
13.4% - Series A1 PTCs;
12.4% - Series A2 PTCs
CRISIL A (SO) - Series A1 PTCs, CRISIL BBB (SO) - Series A2 PTCs
4 Aergia IFMR Capital 2015
996.7 951.8 1131.2 Par with
EIS Microfinance
(100%) - 7 8 - 24.2%
100%, 0%, 0%
2.0% - - - 7.9%
16.9% - Series A1 PTCs;
15.9% - Series A2 PTCs
CRISIL A+ (SO) - Series A1 PTCs, CRISIL BBB+ (SO) - Series A2 PTCs
5 Morpheus IFMR
Capital 2015 2116.7 2114.8 2507.8
Par with EIS
Microfinance (100%)
- 9 6 - 23.8% 100%, 0%,
0% 4.2% - - - 9.8%
18.7% - Series A1 PTCs;
15.7% - Series A2 PTCs
CRISIL AA- (SO) - Series A1 PTCs, CRISIL A (SO) - Series A2 PTCs
6 Zion IFMR Capital
2016 2137.5 2166.5 2503.1
Par with EIS
Microfinance (100%)
- 8 6 - 24.0% 100%, 0%,
0% 2.8% - - - 9.2%
16.6%- Series A1 PTCs;
13.4% - Series A2 PTCs
CRISIL A- (SO) - Series A1 PTCs, CRISIL BBB- (SO) - Series A2 PTCs
7 Emerald Trust February 2016
2105.6 2027.4 2517.5 Par with
trapped EIS Microfinance
(100%) - 9 5 - 24.0%
100%, 0%, 0%
4.2% - - - 10.8% 19.5% CRISIL A+ (SO) - Series A1 PTCs
8 Sentinel IFMR Capital 2016
1873.7 1865.4 2206.4 Par with
EIS Microfinance
(100%) - 9 7 - 24.0%
100%, 0%, 0%
2.5% - - - 9.5%
16.5% - Series A1 PTCs;
15.5% - Series A2 PTCs
CRISIL A- (SO) - Series A1 PTCs, CRISIL BBB+ (SO) - Series A2 PTCs
9 Architect IFMR Capital 2016
1408.3 1388.0 1697.8 Par with
EIS Microfinance
(100%) - 10 5 - 24.0%
100%, 0%, 0%
2.8% - - - 10.8%
20.3% - Series A1 PTCs;
18.2% - Series A2 PTCs
CRISIL A (SO) - Series A1 PTCs, CRISIL BBB+ (SO) - Series A2 PTCs
10 Oracle IFMR Capital 2016
1881.0 1952.5 2267.3 Par with
EIS Microfinance
(100%) - 10 5 - 24.0%
100%, 0%, 0%
2.8% - - - 9.7%
16.9% - Series A1 PTCs;
13.9% - Series A2 PTCs
CRISIL A- (SO) - Series A1 PTCs, CRISIL BBB (SO) - Series A2 PTCs
11 Cypher IFMR Capital 2016
2527.6 2462.3 2948.5 Par with
EIS Microfinance
(100%) - 8 8 - 24.0%
100%, 0%, 0%
2.8% - - - 8.8%
18.5% - Series A1 PTCs;
16.5% - Series A2 PTCs
CRISIL A (SO) - Series A1 PTCs, CRISIL A- (SO) - Series A2 PTCs

25
Classification: INTERNAL: CONFIDENTIAL
Sr. no
Transaction name
Pool principal (Rs. Mn)
Investor payouts (Rs. Mn)
Pool cashflows (Rs. Mn)
Structure
Pool Characteristics
Overdue composition
(0, 1, 2)
Credit Support
Current Rating/ Credit Opinion
Asset class Asset type
(New, Used)
Pool duration (months)
WAS (months)
WAL WAY
Credit collateral as
% of pool cashflows
First loss facility as %
of pool cashflows
Second loss facility
as % of pool
cashflows
Liquidity facility as % of pool cashflows
Scheduled EIS as % of
pool cashflows
Subordinated cashflows as
% of pool cashflows@
12 Niobe IFMR Capital 2016
2195.2 2211.5 2646.7 Par with
EIS Microfinance
(100%) - 10 5 - 24.0%
100%, 0%, 0%
4.1% - - - 10.6%
19.5% - Series A1 PTCs;
16.4% - Series A2 PTCs
CRISIL A+ (SO) - Series A1 PTCs, CRISIL A (SO) - Series A2 PTCs
13 Mjolnir IFMR Capital 2016
543.0 556.7 651.4 Par with
EIS Microfinance
(100%) - 10 5 - 24.0%
100%, 0%, 0%
3.0% - - - 10.4%
14.5% - Series A1 PTCs;
17.6% - Series A2 PTCs
CRISIL A- (SO) - Series A1 PTCs, CRISIL BBB (SO) - Series A2 PTCs
14 Icharus IFMR Capital 2016
531.6 556.1 637.8 Par with
EIS Microfinance
(100%) - 10 5 - 24.0%
100%, 0%, 0%
3.0% - - - 9.5%
14.8% - Series A1 PTCs;
12.8% - Series A2 PTCs
CRISIL BBB+ (SO) - Series A1 PTCs, CRISIL BB+ (SO) - Series A2 PTCs
15 Frey IFMR Capital
2016 780.9 782.4 904.2
Par with EIS
Microfinance (100%)
- 8 9 - 24.0% 100%, 0%,
0% 2.2% - - - 8.3%
16.5% - Series A1 PTCs;
13.5% - Series A2 PTCs
CRISIL A- (SO) - Series A1 PTCs, CRISIL BBB+ (SO) - Series A2 PTCs
@Includes scheduled EIS

26
Classification: INTERNAL: CONFIDENTIAL
Janalakshmi Financial Services Limited- Pool Performance
Initial pool details Delinquencies Overdues
Sr. no
Transaction name
Pool principal (Rs. Mn)
Structure Asset class
Credit collateral as
% of pool cashflows
MPS Amortisation CCR
3 month average MCR Cumulative
prepayments
Current quarter
Previous quarter
Current quarter
Previous quarter Loss on
repossession and sale
Credit collateral utilisation
Liquidity facility
utilisation
Current credit
collateral as % of future
payouts
EIS as % of future payouts
TCR TCC
Current quarter
Previous quarter
90+ 180+ 90+ 180+ 1+ 90+ 1+ 90+
1 JFS Microfinance Trust September
20151 836.3
Par with EIS
Microfinance 6.5% 14 89.8% 99.7% 100.8% 99.5% 6.2% 0.4% 0.1% 0.7% 0.4% 0.2% 0.1% 0.3% 0.3% - 0.0% - 79.8% 4.0% 17.6% Above
20 times
2 JFS Microfinance
Trust-2 September 20151
2762.2 Par with
EIS Microfinance 5.2% 14 90.8% 99.8% 100.3% 99.4% 6.4% 0.3% 0.1% 0.5% 0.3% 0.2% 0.1% 0.3% 0.2% - 0.0% - 73.9% 3.7% 21.7%
Above 20
times
3 Libertas IFMR Capital 2015
1915.0 Par with
EIS Microfinance 1.7% 13 80.8% 98.7% 91.6% 99.5% 5.4% 0.5% 0.1% 0.6% 0.3% 1.2% 0.1% 0.2% 0.2% - 0.0% - 14.5% 6.9% 64.9%
Above 20
times
4 Aergia IFMR Capital 2015
996.7 Par with
EIS Microfinance 2.0% 13 89.3% 99.1% 93.1% 99.1% 3.6% 0.4% 0.1% 0.5% 0.3% 0.9% 0.1% 0.2% 0.2% - 0.0% - 61.4% 13.5% 12.8%
Above 20
times
5 Morpheus IFMR
Capital 2015 2116.7
Par with EIS
Microfinance 4.2% 12 68.9% 98.7% 92.8% 99.3% 3.7% 0.5% 0.1% 0.4% 0.2% 1.1% 0.1% 0.2% 0.1% - 0.0% - 19.7% 7.4% 60.5% Above
20 times
6 Zion IFMR
Capital 2016 2137.5
Par with EIS
Microfinance 2.8% 11 66.3% 97.9% 90.9% 99.2% 3.6% 0.7% 0.2% 0.4% 0.1% 1.6% 0.2% 0.2% 0.1% - 0.0% - 11.2% 6.5% 71.4% Above
20 times
7 Emerald Trust February 2016
2105.6 Par with trapped
EIS Microfinance 4.2% 9 54.6% 97.7% 92.0% 99.3% 1.9% 0.6% 0.1% 0.3% 0.1% 1.5% 0.1% 0.2% 0.1% - 0.0% - 11.4% 7.0% 74.7%
Above 20
times
8 Sentinel IFMR Capital 2016
1873.7 Par with
EIS Microfinance 2.5% 9 54.7% 97.3% 91.9% 99.4% 3.0% 0.6% 0.1% 0.2% 0.0% 1.7% 0.1% 0.3% 0.1% - 0.0% - 7.4% 7.5% 75.0%
Above 20
times
9 Architect IFMR Capital 2016
1408.3 Par with
EIS Microfinance 2.8% 9 46.2% 97.1% 91.3% 99.5% 1.3% 0.6% 0.1% 0.2% 0.0% 1.7% 0.1% 0.2% 0.0% - 0.0% - 7.2% 8.8% 73.7%
Above 20
times
10 Oracle IFMR Capital 2016
1881.0 Par with
EIS Microfinance 2.8% 9 46.0% 97.2% 91.9% 99.7% 2.3% 0.5% 0.1% 0.2% 0.0% 1.6% 0.1% 0.2% 0.1% - 0.0% - 6.7% 7.4% 79.0%
Above 20
times
11 Cypher IFMR Capital 2016
2527.6 Par with
EIS Microfinance 2.8% 8 55.1% 99.5% 99.1% 99.6% 3.7% 0.5% 0.1% 0.2% 0.0% 0.3% 0.1% 0.1% 0.0% - 0.0% - 7.6% 8.6% 69.6%
Above 20
times
12 Niobe IFMR Capital 2016
2195.2 Par with
EIS Microfinance 4.1% 9 46.1% 97.0% 91.1% 99.3% 1.2% 0.7% 0.1% 0.3% 0.0% 1.8% 0.2% 0.2% 0.1% - 0.0% - 10.0% 7.9% 74.8%
Above 20
times
13 Mjolnir IFMR Capital 2016
543.0 Par with
EIS Microfinance 3.0% 9 48.0% 97.4% 92.2% 99.4% 3.8% 0.7% 0.1% 0.2% 0.0% 1.6% 0.2% 0.2% 0.1% - 0.0% - 6.3% 8.0% 77.1%
Above 20
times
14 Icharus IFMR Capital 2016
531.6 Par with
EIS Microfinance 3.0% 9 47.8% 97.4% 92.3% 99.4% 3.7% 0.5% 0.1% 0.2% 0.0% 1.6% 0.1% 0.2% 0.1% - 0.0% - 6.1% 7.2% 79.4%
Above 20
times
15 Frey IFMR
Capital 2016 780.9
Par with EIS
Microfinance 2.2% 9 57.9% 97.0% 91.0% 99.4% 5.0% 0.6% 0.1% 0.2% 0.0% 2.0% 0.2% 0.2% 0.0% - 0.0% - 7.0% 7.2% 73.9% Above
20 times
1 Data as of November'16 payouts
27
Classification: INTERNAL: CONFIDENTIAL
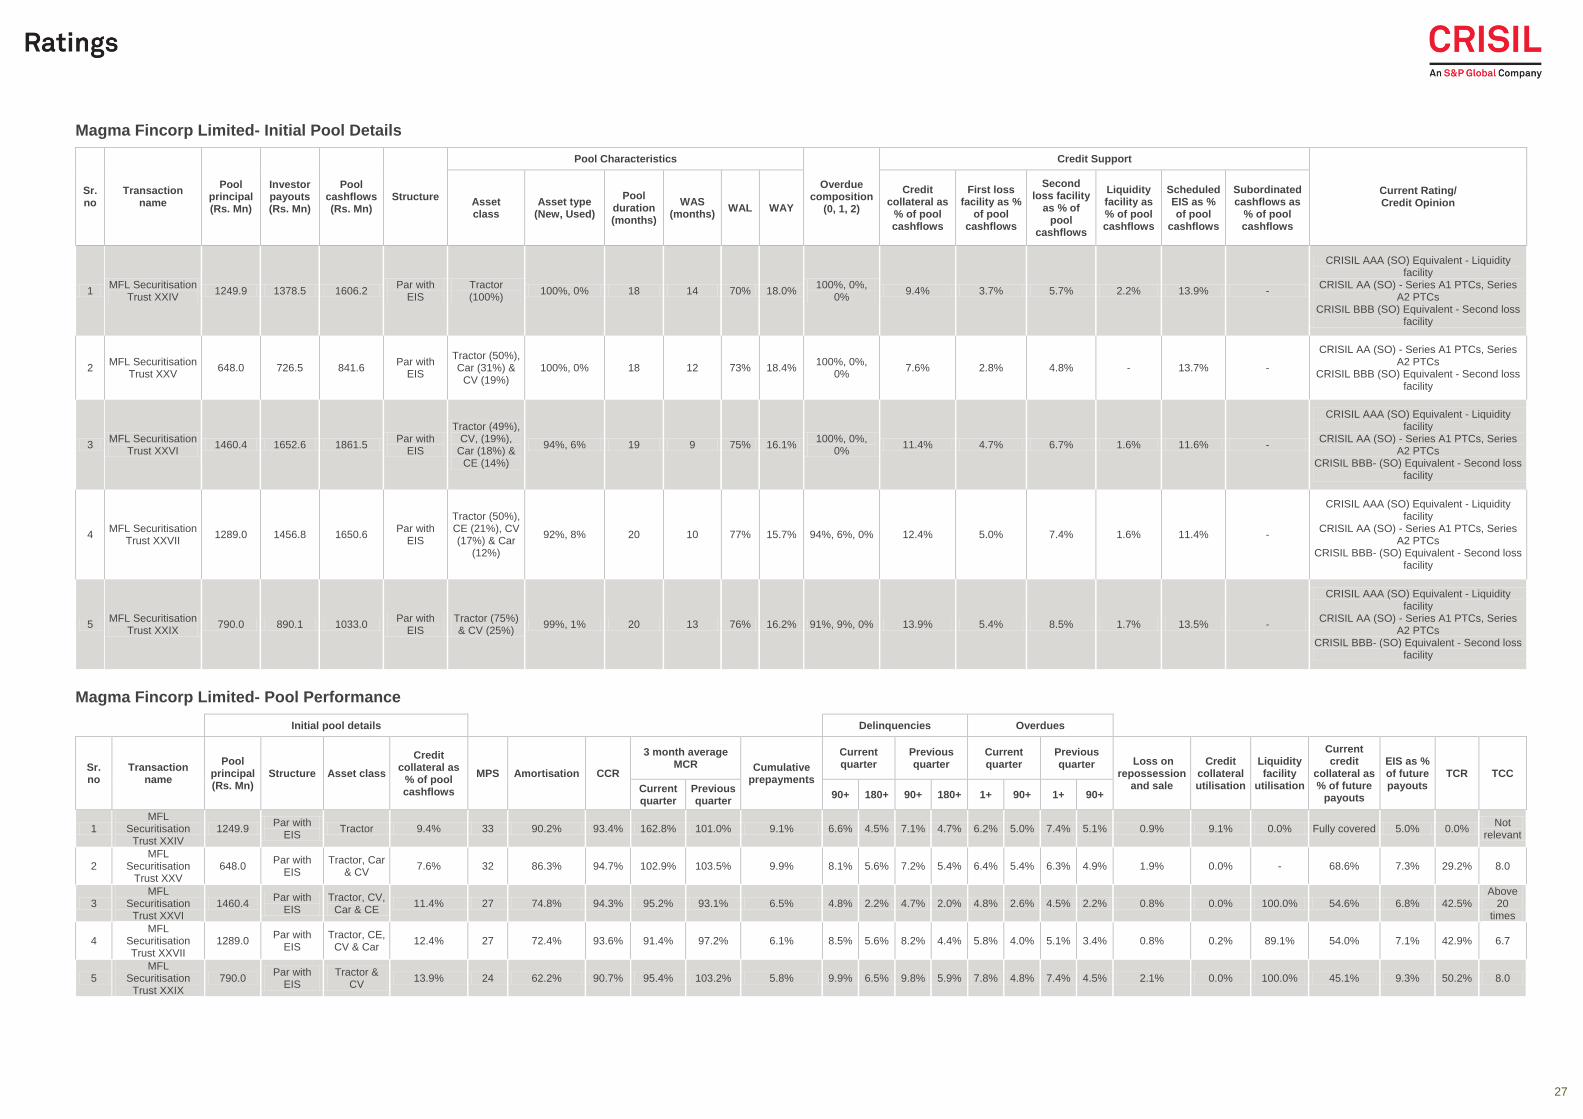
Magma Fincorp Limited- Initial Pool Details
Sr. no
Transaction name
Pool principal (Rs. Mn)
Investor payouts (Rs. Mn)
Pool cashflows (Rs. Mn)
Structure
Pool Characteristics
Overdue composition
(0, 1, 2)
Credit Support
Current Rating/ Credit Opinion Asset
class Asset type
(New, Used)
Pool duration (months)
WAS (months)
WAL WAY
Credit collateral as
% of pool cashflows
First loss facility as %
of pool cashflows
Second loss facility
as % of pool
cashflows
Liquidity facility as % of pool cashflows
Scheduled EIS as % of pool
cashflows
Subordinated cashflows as
% of pool cashflows
1 MFL Securitisation
Trust XXIV 1249.9 1378.5 1606.2
Par with EIS
Tractor (100%)
100%, 0% 18 14 70% 18.0% 100%, 0%,
0% 9.4% 3.7% 5.7% 2.2% 13.9% -
CRISIL AAA (SO) Equivalent - Liquidity facility
CRISIL AA (SO) - Series A1 PTCs, Series A2 PTCs
CRISIL BBB (SO) Equivalent - Second loss facility
2 MFL Securitisation
Trust XXV 648.0 726.5 841.6
Par with EIS
Tractor (50%), Car (31%) &
CV (19%) 100%, 0% 18 12 73% 18.4%
100%, 0%, 0%
7.6% 2.8% 4.8% - 13.7% -
CRISIL AA (SO) - Series A1 PTCs, Series A2 PTCs
CRISIL BBB (SO) Equivalent - Second loss facility
3 MFL Securitisation
Trust XXVI 1460.4 1652.6 1861.5
Par with EIS
Tractor (49%), CV, (19%),
Car (18%) & CE (14%)
94%, 6% 19 9 75% 16.1% 100%, 0%,
0% 11.4% 4.7% 6.7% 1.6% 11.6% -
CRISIL AAA (SO) Equivalent - Liquidity facility
CRISIL AA (SO) - Series A1 PTCs, Series A2 PTCs
CRISIL BBB- (SO) Equivalent - Second loss facility
4 MFL Securitisation
Trust XXVII 1289.0 1456.8 1650.6
Par with EIS
Tractor (50%), CE (21%), CV (17%) & Car
(12%)
92%, 8% 20 10 77% 15.7% 94%, 6%, 0% 12.4% 5.0% 7.4% 1.6% 11.4% -
CRISIL AAA (SO) Equivalent - Liquidity facility
CRISIL AA (SO) - Series A1 PTCs, Series A2 PTCs
CRISIL BBB- (SO) Equivalent - Second loss facility
5 MFL Securitisation
Trust XXIX 790.0 890.1 1033.0
Par with EIS
Tractor (75%) & CV (25%)
99%, 1% 20 13 76% 16.2% 91%, 9%, 0% 13.9% 5.4% 8.5% 1.7% 13.5% -
CRISIL AAA (SO) Equivalent - Liquidity facility
CRISIL AA (SO) - Series A1 PTCs, Series A2 PTCs
CRISIL BBB- (SO) Equivalent - Second loss facility
Magma Fincorp Limited- Pool Performance
Initial pool details Delinquencies Overdues
Sr. no
Transaction name
Pool principal (Rs. Mn)
Structure Asset class
Credit collateral as
% of pool cashflows
MPS Amortisation CCR
3 month average MCR Cumulative
prepayments
Current quarter
Previous quarter
Current quarter
Previous quarter Loss on
repossession and sale
Credit collateral utilisation
Liquidity facility
utilisation
Current credit
collateral as % of future
payouts
EIS as % of future payouts
TCR TCC
Current quarter
Previous quarter
90+ 180+ 90+ 180+ 1+ 90+ 1+ 90+
1 MFL
Securitisation Trust XXIV
1249.9 Par with
EIS Tractor 9.4% 33 90.2% 93.4% 162.8% 101.0% 9.1% 6.6% 4.5% 7.1% 4.7% 6.2% 5.0% 7.4% 5.1% 0.9% 9.1% 0.0% Fully covered 5.0% 0.0%
Not relevant
2 MFL
Securitisation Trust XXV
648.0 Par with
EIS Tractor, Car
& CV 7.6% 32 86.3% 94.7% 102.9% 103.5% 9.9% 8.1% 5.6% 7.2% 5.4% 6.4% 5.4% 6.3% 4.9% 1.9% 0.0% - 68.6% 7.3% 29.2% 8.0
3 MFL
Securitisation Trust XXVI
1460.4 Par with
EIS Tractor, CV,
Car & CE 11.4% 27 74.8% 94.3% 95.2% 93.1% 6.5% 4.8% 2.2% 4.7% 2.0% 4.8% 2.6% 4.5% 2.2% 0.8% 0.0% 100.0% 54.6% 6.8% 42.5%
Above 20
times
4 MFL
Securitisation Trust XXVII
1289.0 Par with
EIS Tractor, CE,
CV & Car 12.4% 27 72.4% 93.6% 91.4% 97.2% 6.1% 8.5% 5.6% 8.2% 4.4% 5.8% 4.0% 5.1% 3.4% 0.8% 0.2% 89.1% 54.0% 7.1% 42.9% 6.7
5 MFL
Securitisation Trust XXIX
790.0 Par with
EIS Tractor &
CV 13.9% 24 62.2% 90.7% 95.4% 103.2% 5.8% 9.9% 6.5% 9.8% 5.9% 7.8% 4.8% 7.4% 4.5% 2.1% 0.0% 100.0% 45.1% 9.3% 50.2% 8.0

28
Classification: INTERNAL: CONFIDENTIAL
Magma ITL Finance Limited- Initial Pool Details
Sr. no
Transaction name
Pool principal (Rs. Mn)
Investor payouts (Rs. Mn)
Pool cashflows (Rs. Mn)
Structure
Pool Characteristics
Overdue composition
(0, 1, 2)
Credit Support
Current Rating/ Credit Opinion
Asset class Asset type
(New, Used)
Pool duration (months)
WAS (months)
WAL WAY
Credit collateral as
% of pool cashflows
First loss facility as %
of pool cashflows
Second loss facility
as % of pool
cashflows
Liquidity facility as % of pool cashflows
Scheduled EIS as % of
pool cashflows
Subordinated cashflows as
% of pool cashflows
1 MIFL
Securitisation Trust IV
1031.3 1139.7 1338.4 Par with
EIS Tractor (100%)
100%, 0% 18 13 65% 18.6% 100%, 0%,
0% 7.2% 3.1% 4.1% - 14.8% -
CRISIL AA- (SO) - Series A1 PTCs, Series A2 PTCs
CRISIL BBB (SO) Equivalent - Second loss facility
2 MIFL
Securitisation Trust VI
513.6 581.5 672.7 Par with
EIS Tractor (100%)
100%, 0% 19 11 70% 17.7% 100%, 0%,
0% 11.6% 4.8% 6.8% 1.8% 13.6% -
CRISIL AAA (SO) Equivalent - Liquidity facility
CRISIL AA (SO) - Series A1 PTCs, Series A2 PTCs
CRISIL BBB- (SO) Equivalent - Second loss facility
Magma ITL Finance Limited- Pool Performance
Initial pool details Delinquencies Overdues
Sr. no
Transaction name
Pool principal (Rs. Mn)
Structure Asset class
Credit collateral as
% of pool cashflows
MPS Amortisation CCR
3 month average MCR Cumulative
prepayments
Current quarter
Previous quarter
Current quarter
Previous quarter Loss on
repossession and sale
Credit collateral utilisation
Liquidity facility
utilisation
Current credit
collateral as % of future
payouts
EIS as % of future payouts
TCR TCC
Current quarter
Previous quarter
90+ 180+ 90+ 180+ 1+ 90+ 1+ 90+
1 MIFL
Securitisation Trust IV
1031.3 Par with
EIS Tractor 7.2% 33 87.4% 92.3% 108.2% 94.8% 6.1% 9.4% 5.5% 9.2% 6.0% 7.4% 6.0% 7.5% 5.9% 0.9% 0.0% - 71.0% 7.3% 27.1% 7.2
2 MIFL
Securitisation Trust VI
513.6 Par with
EIS Tractor 11.6% 27 72.6% 92.8% 116.6% 93.8% 6.9% 7.4% 3.3% 7.1% 2.9% 6.1% 3.8% 6.4% 3.3% 1.4% 0.0% 97.6% 52.5% 7.6% 44.1% 16.1
29
Classification: INTERNAL: CONFIDENTIAL
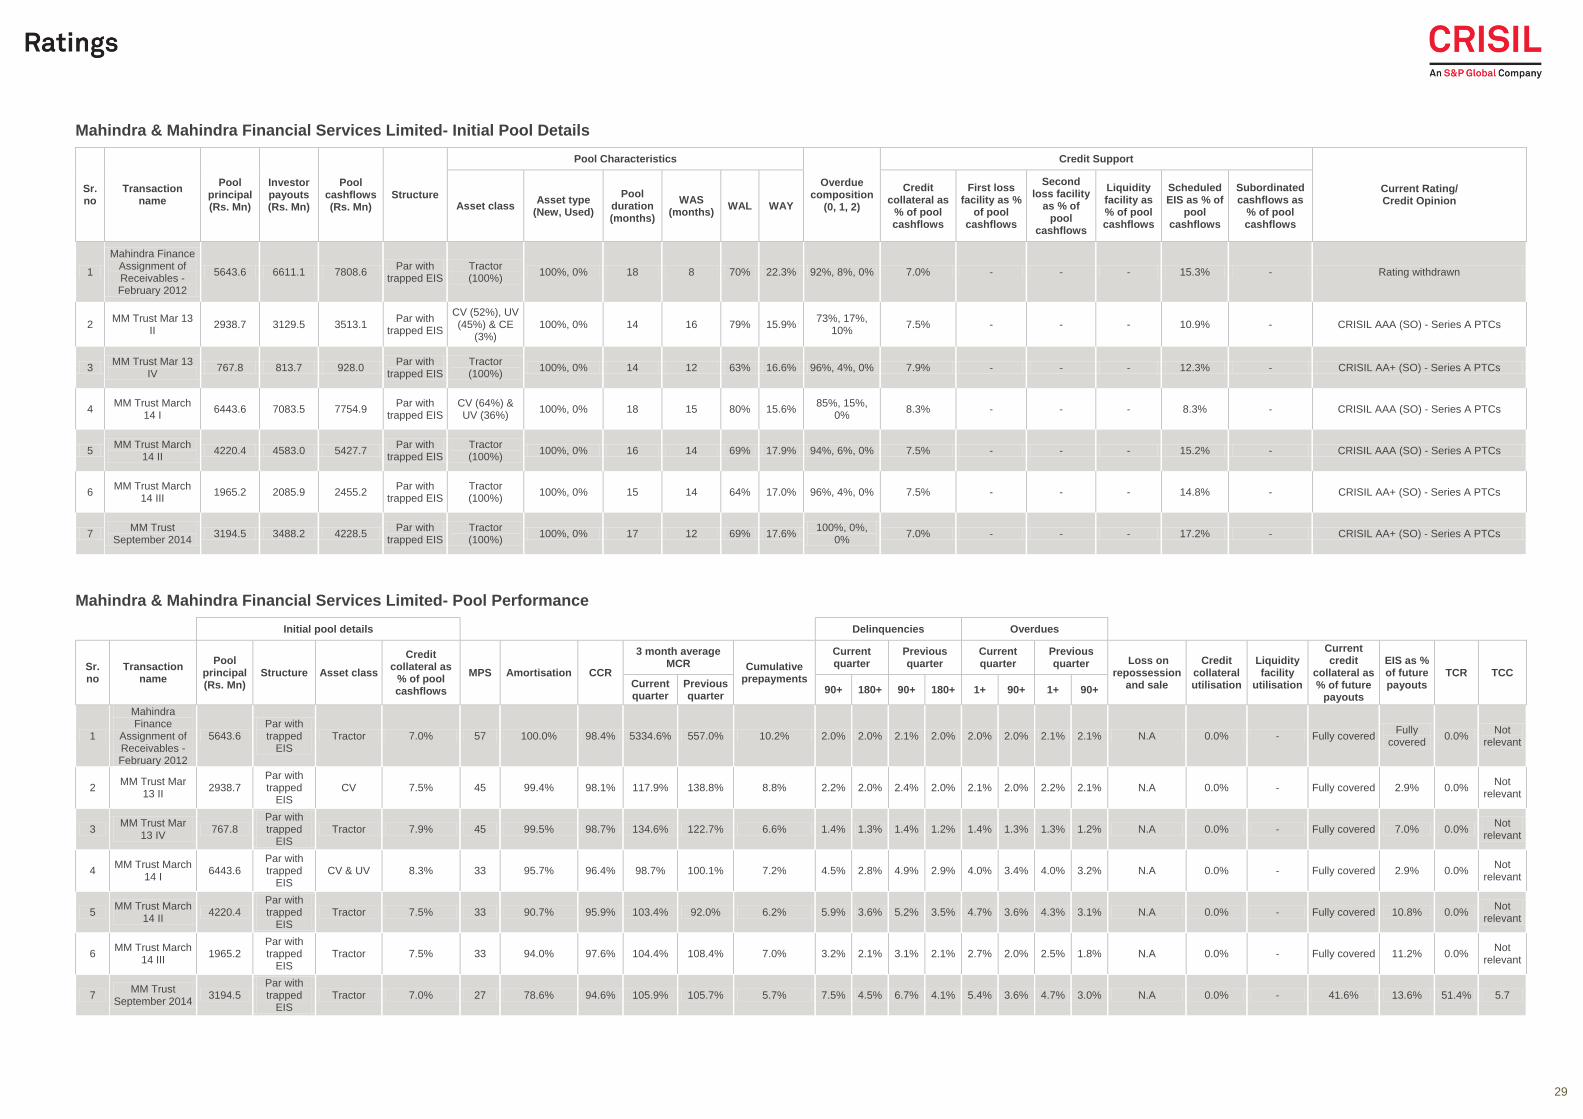
Mahindra & Mahindra Financial Services Limited- Initial Pool Details
Sr. no
Transaction name
Pool principal (Rs. Mn)
Investor payouts (Rs. Mn)
Pool cashflows (Rs. Mn)
Structure
Pool Characteristics
Overdue composition
(0, 1, 2)
Credit Support
Current Rating/ Credit Opinion
Asset class Asset type
(New, Used)
Pool duration (months)
WAS (months)
WAL WAY
Credit collateral as
% of pool cashflows
First loss facility as %
of pool cashflows
Second loss facility
as % of pool
cashflows
Liquidity facility as % of pool cashflows
Scheduled EIS as % of
pool cashflows
Subordinated cashflows as
% of pool cashflows
1
Mahindra Finance Assignment of Receivables - February 2012
5643.6 6611.1 7808.6 Par with
trapped EIS Tractor (100%)
100%, 0% 18 8 70% 22.3% 92%, 8%, 0% 7.0% - - - 15.3% - Rating withdrawn
2 MM Trust Mar 13
II 2938.7 3129.5 3513.1
Par with trapped EIS
CV (52%), UV (45%) & CE
(3%) 100%, 0% 14 16 79% 15.9%
73%, 17%, 10%
7.5% - - - 10.9% - CRISIL AAA (SO) - Series A PTCs
3 MM Trust Mar 13
IV 767.8 813.7 928.0
Par with trapped EIS
Tractor (100%)
100%, 0% 14 12 63% 16.6% 96%, 4%, 0% 7.9% - - - 12.3% - CRISIL AA+ (SO) - Series A PTCs
4 MM Trust March
14 I 6443.6 7083.5 7754.9
Par with trapped EIS
CV (64%) & UV (36%)
100%, 0% 18 15 80% 15.6% 85%, 15%,
0% 8.3% - - - 8.3% - CRISIL AAA (SO) - Series A PTCs
5 MM Trust March
14 II 4220.4 4583.0 5427.7
Par with trapped EIS
Tractor (100%)
100%, 0% 16 14 69% 17.9% 94%, 6%, 0% 7.5% - - - 15.2% - CRISIL AAA (SO) - Series A PTCs
6 MM Trust March
14 III 1965.2 2085.9 2455.2
Par with trapped EIS
Tractor (100%)
100%, 0% 15 14 64% 17.0% 96%, 4%, 0% 7.5% - - - 14.8% - CRISIL AA+ (SO) - Series A PTCs
7 MM Trust
September 2014 3194.5 3488.2 4228.5
Par with trapped EIS
Tractor (100%)
100%, 0% 17 12 69% 17.6% 100%, 0%,
0% 7.0% - - - 17.2% - CRISIL AA+ (SO) - Series A PTCs
Mahindra & Mahindra Financial Services Limited- Pool Performance
Initial pool details Delinquencies Overdues
Sr. no
Transaction name
Pool principal (Rs. Mn)
Structure Asset class
Credit collateral as
% of pool cashflows
MPS Amortisation CCR
3 month average MCR Cumulative
prepayments
Current quarter
Previous quarter
Current quarter
Previous quarter Loss on
repossession and sale
Credit collateral utilisation
Liquidity facility
utilisation
Current credit
collateral as % of future
payouts
EIS as % of future payouts
TCR TCC Current quarter
Previous quarter
90+ 180+ 90+ 180+ 1+ 90+ 1+ 90+
1
Mahindra Finance
Assignment of Receivables - February 2012
5643.6 Par with trapped
EIS Tractor 7.0% 57 100.0% 98.4% 5334.6% 557.0% 10.2% 2.0% 2.0% 2.1% 2.0% 2.0% 2.0% 2.1% 2.1% N.A 0.0% - Fully covered
Fully covered
0.0% Not
relevant
2 MM Trust Mar
13 II 2938.7
Par with trapped
EIS CV 7.5% 45 99.4% 98.1% 117.9% 138.8% 8.8% 2.2% 2.0% 2.4% 2.0% 2.1% 2.0% 2.2% 2.1% N.A 0.0% - Fully covered 2.9% 0.0%
Not relevant
3 MM Trust Mar
13 IV 767.8
Par with trapped
EIS Tractor 7.9% 45 99.5% 98.7% 134.6% 122.7% 6.6% 1.4% 1.3% 1.4% 1.2% 1.4% 1.3% 1.3% 1.2% N.A 0.0% - Fully covered 7.0% 0.0%
Not relevant
4 MM Trust March
14 I 6443.6
Par with trapped
EIS CV & UV 8.3% 33 95.7% 96.4% 98.7% 100.1% 7.2% 4.5% 2.8% 4.9% 2.9% 4.0% 3.4% 4.0% 3.2% N.A 0.0% - Fully covered 2.9% 0.0%
Not relevant
5 MM Trust March
14 II 4220.4
Par with trapped
EIS Tractor 7.5% 33 90.7% 95.9% 103.4% 92.0% 6.2% 5.9% 3.6% 5.2% 3.5% 4.7% 3.6% 4.3% 3.1% N.A 0.0% - Fully covered 10.8% 0.0%
Not relevant
6 MM Trust March
14 III 1965.2
Par with trapped
EIS Tractor 7.5% 33 94.0% 97.6% 104.4% 108.4% 7.0% 3.2% 2.1% 3.1% 2.1% 2.7% 2.0% 2.5% 1.8% N.A 0.0% - Fully covered 11.2% 0.0%
Not relevant
7 MM Trust
September 2014 3194.5
Par with trapped
EIS Tractor 7.0% 27 78.6% 94.6% 105.9% 105.7% 5.7% 7.5% 4.5% 6.7% 4.1% 5.4% 3.6% 4.7% 3.0% N.A 0.0% - 41.6% 13.6% 51.4% 5.7

30
Classification: INTERNAL: CONFIDENTIAL
Multi Originator- Initial Pool Details
Sr. no
Transaction name
Pool principal (Rs. Mn)
Investor payouts (Rs. Mn)
Pool cashflows (Rs. Mn)
Structure
Pool Characteristics
Overdue composition
(0, 1, 2)
Credit Support
Current Rating/ Credit Opinion
Asset class Asset type
(New, Used)
Pool duration (months)
WAS (months)
WAL WAY
Credit collateral as
% of pool cashflows
First loss facility as %
of pool cashflows
Second loss facility
as % of pool
cashflows
Liquidity facility as % of pool cashflows
Scheduled EIS as % of
pool cashflows
Subordinated cashflows as
% of pool cashflows
1 IFMR Capital
Mosec Azeroth 2016
551.2 645.2 651.0 Premium Microfinance
(100%) - 8 6 - 26.2%
100%, 0%, 0%
19.4% - - - - - CRISIL A- (SO) - Series A1 PTCs
Multi Originator- Pool Performance
Initial pool details Delinquencies Overdues
Sr. no
Transaction name
Pool principal (Rs. Mn)
Structure Asset class
Credit collateral as
% of pool cashflows
MPS Amortisation CCR
3 month average MCR Cumulative
prepayments
Current quarter
Previous quarter
Current quarter
Previous quarter Loss on
repossession and sale
Credit collateral utilisation
Liquidity facility
utilisation
Current credit
collateral as % of future
payouts
EIS as % of future payouts
TCR TCC
Current quarter
Previous quarter
90+ 180+ 90+ 180+ 1+ 90+ 1+ 90+
1 IFMR Capital
Mosec Azeroth 2016
551.2 Premium Microfinance 5.0% 4 30.6% 99.2% 98.7% 100.0% 0.0% 0.0% 0.0% 0.0% 0.0% 0.0% 0.0% 0.0% 0.0% - 0.0% - 7.4% - 92.1% Not
relevant
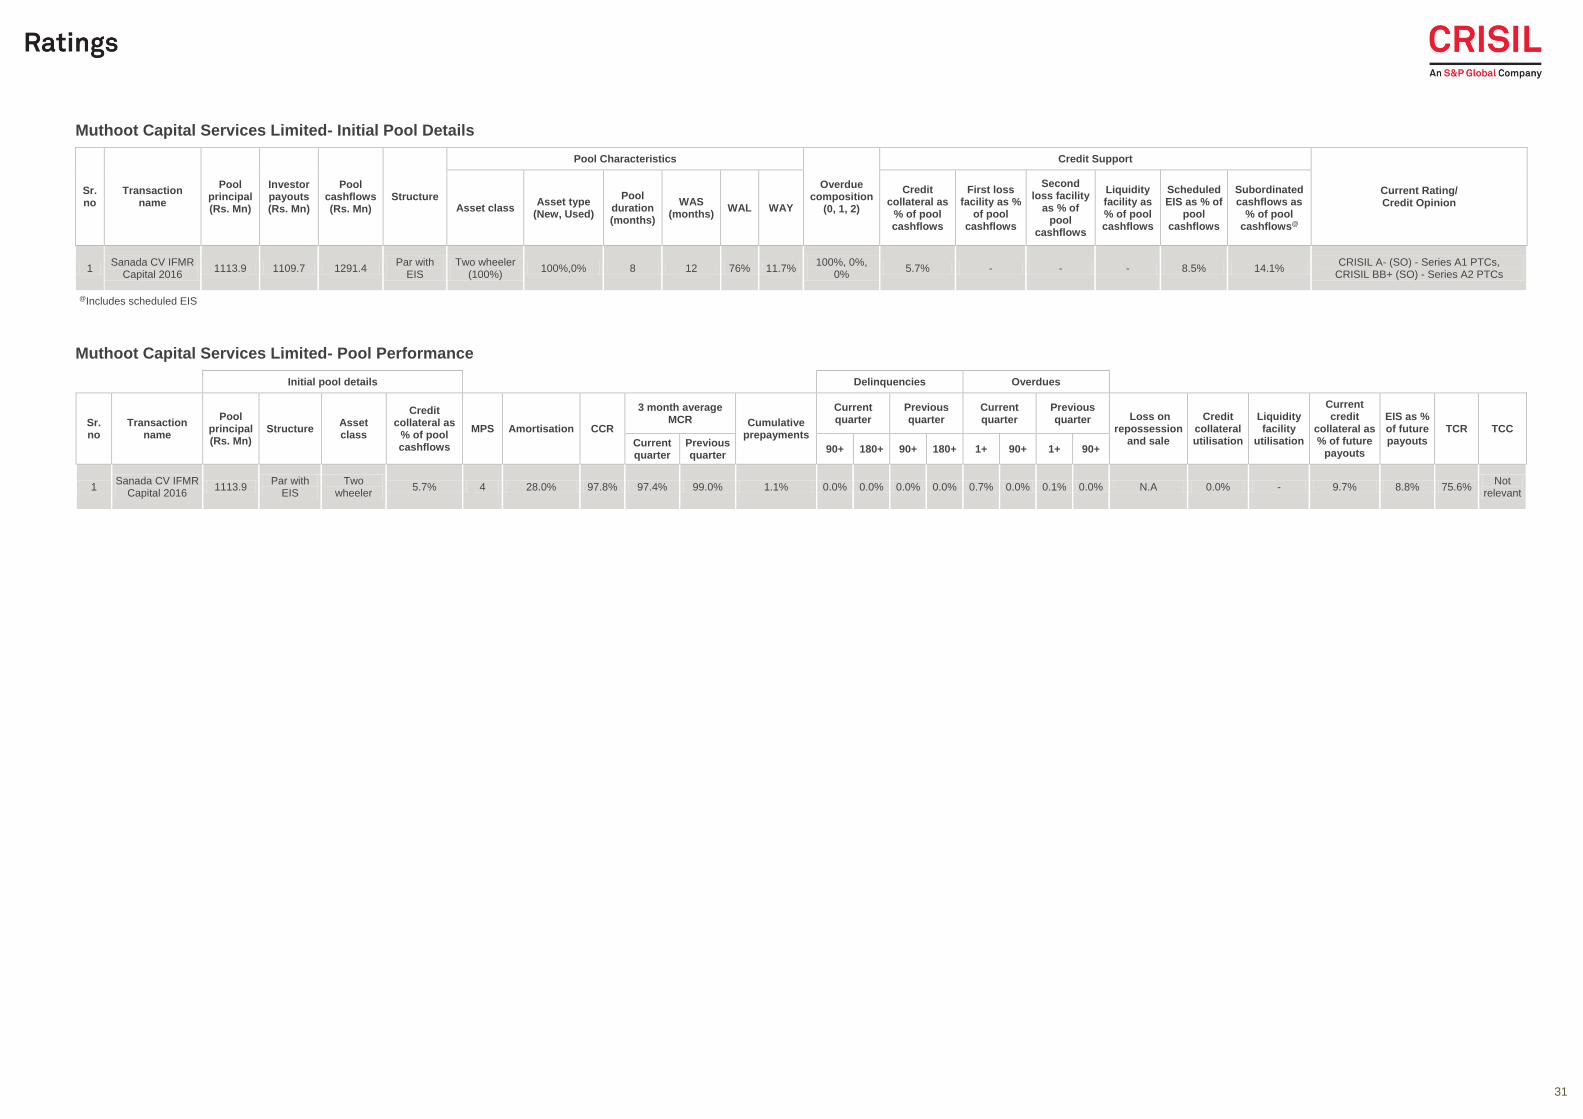
31
Classification: INTERNAL: CONFIDENTIAL
Muthoot Capital Services Limited- Initial Pool Details
Sr. no
Transaction name
Pool principal (Rs. Mn)
Investor payouts (Rs. Mn)
Pool cashflows (Rs. Mn)
Structure
Pool Characteristics
Overdue composition
(0, 1, 2)
Credit Support
Current Rating/ Credit Opinion
Asset class Asset type
(New, Used)
Pool duration (months)
WAS (months)
WAL WAY
Credit collateral as
% of pool cashflows
First loss facility as %
of pool cashflows
Second loss facility
as % of pool
cashflows
Liquidity facility as % of pool cashflows
Scheduled EIS as % of
pool cashflows
Subordinated cashflows as
% of pool cashflows@
1 Sanada CV IFMR
Capital 2016 1113.9 1109.7 1291.4
Par with EIS
Two wheeler (100%)
100%,0% 8 12 76% 11.7% 100%, 0%,
0% 5.7% - - - 8.5% 14.1%
CRISIL A- (SO) - Series A1 PTCs, CRISIL BB+ (SO) - Series A2 PTCs
@Includes scheduled EIS
Muthoot Capital Services Limited- Pool Performance
Initial pool details Delinquencies Overdues
Sr. no
Transaction name
Pool principal (Rs. Mn)
Structure Asset class
Credit collateral as
% of pool cashflows
MPS Amortisation CCR
3 month average MCR Cumulative
prepayments
Current quarter
Previous quarter
Current quarter
Previous quarter Loss on
repossession and sale
Credit collateral utilisation
Liquidity facility
utilisation
Current credit
collateral as % of future
payouts
EIS as % of future payouts
TCR TCC
Current quarter
Previous quarter
90+ 180+ 90+ 180+ 1+ 90+ 1+ 90+
1 Sanada CV IFMR
Capital 2016 1113.9
Par with EIS
Two wheeler
5.7% 4 28.0% 97.8% 97.4% 99.0% 1.1% 0.0% 0.0% 0.0% 0.0% 0.7% 0.0% 0.1% 0.0% N.A 0.0% - 9.7% 8.8% 75.6% Not
relevant

32
Classification: INTERNAL: CONFIDENTIAL
Muthoot Microfin Limited- Initial Pool Details
Sr. no
Transaction name
Pool principal (Rs. Mn)
Investor payouts (Rs. Mn)
Pool cashflows (Rs. Mn)
Structure
Pool Characteristics
Overdue composition
(0, 1, 2)
Credit Support
Current Rating/ Credit Opinion Asset
class Asset type
(New, Used)
Pool duration (months)
WAS (months)
WAL WAY
Credit collateral as
% of pool cashflows
First loss facility as % of pool cashflows
Second loss
facility as % of pool cashflows
Liquidity facility as % of pool cashflows
Scheduled EIS as % of pool
cashflows
Subordinated cashflows as
% of pool cashflows@
1 Meditrina IFMR
Capital 2016 500.2 515.5 604.6
Par with EIS
Microfinance (100%)
- 10 6 - 26.0% 100%, 0%,
0% 3.2% - - - 10.6%
Series A1 PTCs - 19.8%
Series A2 PTCs - 14.7%
CRISIL A- (SO) - Series A1 PTCs, CRISIL BBB- (SO) - Series A2 PTCs
2 Brutus IFMR Capital 2016
371.1 387.8 439.4 Par with
EIS Microfinance
(100%) - 10 4 - 25.5%
100%, 0%, 0%
4.2% - - - 10.5%
Series A1 PTCs - 20.5%
Series A2 PTCs - 16.4%
CRISIL AA- (SO) - Series A1 PTCs, CRISIL A- (SO) - Series A2 PTCs
3 Kunoichi IFMR Capital 2016
478.1 501.8 569.5 Par with
EIS Microfinance
(100%) - 9 3 - 24.9%
100%, 0%, 0%
2.8% - - - 9.4%
Series A1 PTCs - 19.0%
Series A2 PTCs - 11.7%
CRISIL A- (SO) - Series A1 PTCs, CRISIL BBB+ (SO) - Series A2 PTCs
4 Methe IFMR Capital 2016
301.4 307.5 358.1 Par with
EIS Microfinance
(100%) - 10 3 - 24.2%
100%, 0%, 0%
2.7% - - - 9.1%
Series A1 PTCs - 18.3%
Series A2 PTCs - 14.1%
CRISIL A- (SO) - Series A1 PTCs, CRISIL BBB+ (SO) - Series A2 PTCs
5 Medon IFMR Capital 2016
309.9 331.7 367.0 Par with
EIS Microfinance
(100%) - 9 4 - 24.2%
100%, 0%, 0%
14.4% 5.1% 9.3% - 9.5% - CRISIL A- (SO) - Series A1 PTCs
6 Jatasya 2016 550.5 536.4 651.6 Par with
EIS Microfinance
(100%) - 10 4 - 24.2%
100%, 0%, 0%
4.2% - - - 9.2% - CRISIL AA- (SO) - Series A PTCs
7 Pelican IFMR Capital 2016
581.6 607.9 687.4 Par with
EIS Microfinance
(100%) - 9 4 - 24.2%
100%, 0%, 0%
2.5% - - - 10.3%
Series A1 PTCs - 18.8%
Series A2 PTCs - 11.6%
CRISIL A+ (SO) - Series A1 PTCs, CRISIL BBB (SO) - Series A2 PTCs
8 Targaryen IFMR
Capital 2016 525.7 555.7 627.0
Par with EIS
Microfinance (100%)
- 9 3 - 24.2% 100%, 0%,
0% 3.2% - - - 10.5%
Series A1 PTCs - 15.5%
Series A2 PTCs - 11.4%
CRISIL A- (SO) - Series A1 PTCs, CRISIL BB- (SO) - Series A2 PTCs
9 Skylark IFMR Capital 2016
662.9 710.6 792.1 Par with
EIS Microfinance
(100%) - 10 3 - 24.3%
100%, 0%, 0%
12.6% 5.7% 6.9% - 9.8% - CRISIL A- (SO) - Series A1 PTCs
10 Kinglet IFMR Capital 2016
644.9 677.2 767.9 Par with
EIS Microfinance
(100%) - 9 4 - 23.8%
100%, 0%, 0%
2.0% - - - 9.2%
Series A1 PTCs - 15.9%
Series A2 PTCs - 11.7%
CRISIL A- (SO) - Series A1 PTCs, CRISIL BB (SO) - Series A2 PTCs
11 Jaithra Trust
2016 751.0 771.1 895.5
Par with EIS
Microfinance (100%)
- 10 3 - 23.7% 100%, 0%,
0% 2.8% - - - 9.6% 13.8%
Provisional CRISIL A- (SO) - Series A PTCs
@ Includes scheduled EIS

33
Classification: INTERNAL: CONFIDENTIAL
Muthoot Microfin Limited- Pool Performance
Initial pool details Delinquencies Overdues
Sr. no
Transaction name
Pool principal (Rs. Mn)
Structure Asset class
Credit collateral as
% of pool cashflows
MPS Amortisation CCR
3 month average MCR Cumulative
prepayments
Current quarter
Previous quarter
Current quarter
Previous quarter Loss on
repossession and sale
Credit collateral utilisation
Liquidity facility
utilisation
Current credit
collateral as % of future
payouts
EIS as % of future payouts
TCR TCC Current quarter
Previous quarter
90+ 180+ 90+ 180+ 1+ 90+ 1+ 90+
1 Meditrina IFMR
Capital 2016 500.2
Par with EIS
Microfinance 3.2% 11 57.8% 99.0% 98.3% 98.0% 8.1% 0.3% 0.1% N.A N.A 0.4% 0.1% N.A N.A - 0.0% - 11.2% 7.0% 67.0% Above
20 times
2 Brutus IFMR Capital 2016
371.1 Par with
EIS Microfinance 4.2% 9 58.0% 99.7% 98.1% 100.5% 3.6% 0.3% 0.1% N.A N.A 0.3% 0.1% N.A N.A - 0.0% - 14.3% 9.3% 64.6%
Above 20
times
3 Kunoichi IFMR Capital 2016
478.1 Par with
EIS Microfinance 2.8% 8 53.4% 100.0% 100.1% 99.8% 5.5% 0.5% 0.1% N.A N.A 0.4% 0.2% N.A N.A - 0.0% - 7.3% 8.3% 78.9%
Above 20
times
4 Methe IFMR Capital 2016
301.4 Par with
EIS Microfinance 2.7% 8 48.1% 100.0% 101.8% 100.7% 5.0% 0.4% 0.1% N.A N.A 0.4% 0.1% N.A N.A - 0.0% - 6.7% 9.0% 75.3%
Above 20
times
5 Medon IFMR Capital 2016
309.9 Par with
EIS Microfinance 14.4% 7 46.7% 99.9% 101.4% 98.9% 5.4% 0.2% 0.1% N.A N.A 0.3% 0.1% 0.1% 0.0% - 0.0% - 31.2% 7.9% 62.3%
Above 20
times
6 Jatasya 2016 550.5 Par with
EIS Microfinance 4.2% 6 36.8% 99.5% 99.6% 99.4% 3.8% 0.2% 0.0% 0.0% 0.0% 0.3% 0.1% 0.1% 0.0% - 0.0% - 8.5% 8.9% 75.2%
Not relevant
7 Pelican IFMR Capital 2016
581.6 Par with
EIS Microfinance 2.5% 6 38.8% 100.0% 101.0% 100.6% 3.5% 0.2% 0.0% 0.0% 0.0% 0.3% 0.0% 0.0% 0.0% - 0.0% - 5.0% 7.9% 83.0%
Not relevant
8 Targaryen IFMR
Capital 2016 525.7
Par with EIS
Microfinance 3.2% 5 32.6% 100.0% 101.2% 99.6% 2.8% 0.0% 0.0% 0.0% 0.0% 0.3% 0.0% 0.1% 0.0% - 0.0% - 5.5% 8.0% 84.9% Not
relevant
9 Skylark IFMR Capital 2016
662.9 Par with
EIS Microfinance 12.6% 5 27.9% 99.8% 100.1% 99.7% 1.9% 0.2% 0.0% 0.0% 0.0% 0.4% 0.0% 0.0% 0.0% - 0.0% - 19.7% 8.8% 73.7%
Not relevant
10 Kinglet IFMR Capital 2016
644.9 Par with
EIS Microfinance 2.0% 3 17.2% 99.5% 99.2% - 2.0% 0.0% 0.0% - - 0.2% 0.0% - - - 0.0% - 2.7% 9.2% 86.2%
Not relevant
11 Jaithra Trust
2016 751
Par with EIS
Microfinance 2.8% 3 14.0% 99.5% 99.1% - 1.9% 0.0% 0.0% - - 0.2% 0.0% - - - 0.0% - 3.8% 9.8% 83.7% Not
relevant
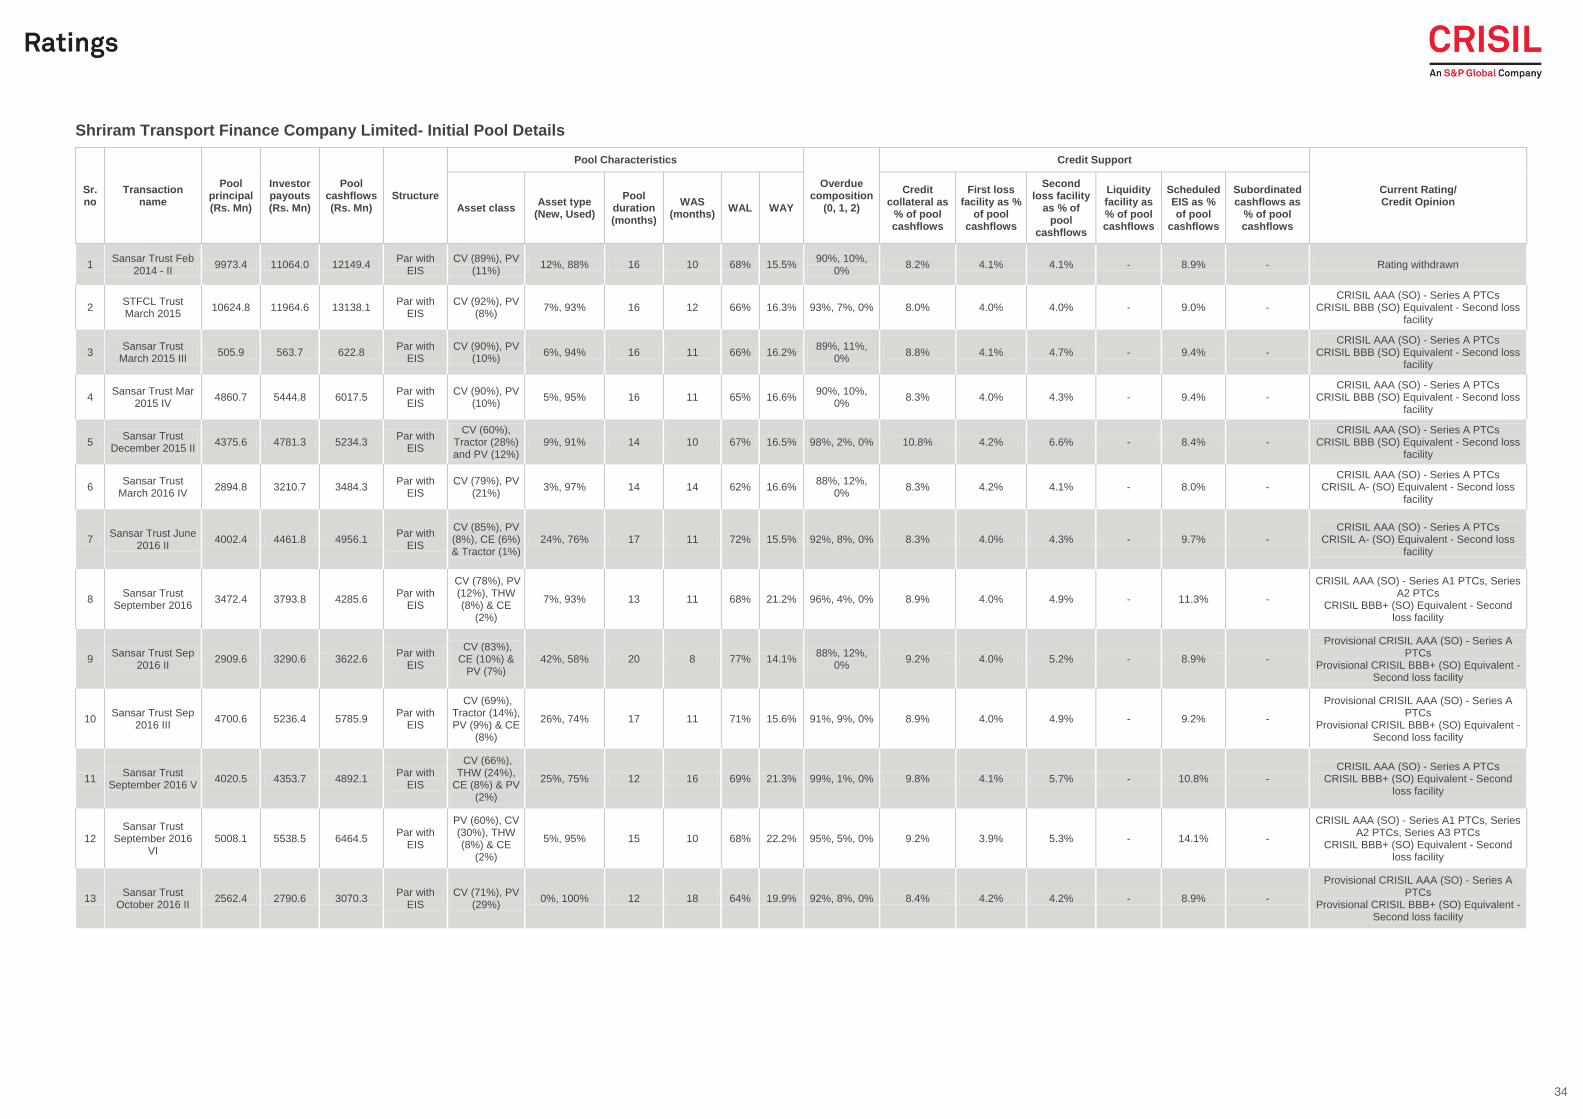
34
Classification: INTERNAL: CONFIDENTIAL
Shriram Transport Finance Company Limited- Initial Pool Details
Sr. no
Transaction name
Pool principal (Rs. Mn)
Investor payouts (Rs. Mn)
Pool cashflows (Rs. Mn)
Structure
Pool Characteristics
Overdue composition
(0, 1, 2)
Credit Support
Current Rating/ Credit Opinion
Asset class Asset type
(New, Used)
Pool duration (months)
WAS (months)
WAL WAY
Credit collateral as
% of pool cashflows
First loss facility as %
of pool cashflows
Second loss facility
as % of pool
cashflows
Liquidity facility as % of pool cashflows
Scheduled EIS as % of pool
cashflows
Subordinated cashflows as
% of pool cashflows
1 Sansar Trust Feb
2014 - II 9973.4 11064.0 12149.4
Par with EIS
CV (89%), PV (11%)
12%, 88% 16 10 68% 15.5% 90%, 10%,
0% 8.2% 4.1% 4.1% - 8.9% - Rating withdrawn
2 STFCL Trust March 2015
10624.8 11964.6 13138.1 Par with
EIS CV (92%), PV
(8%) 7%, 93% 16 12 66% 16.3% 93%, 7%, 0% 8.0% 4.0% 4.0% - 9.0% -
CRISIL AAA (SO) - Series A PTCs CRISIL BBB (SO) Equivalent - Second loss
facility
3 Sansar Trust
March 2015 III 505.9 563.7 622.8
Par with EIS
CV (90%), PV (10%)
6%, 94% 16 11 66% 16.2% 89%, 11%,
0% 8.8% 4.1% 4.7% - 9.4% -
CRISIL AAA (SO) - Series A PTCs CRISIL BBB (SO) Equivalent - Second loss
facility
4 Sansar Trust Mar
2015 IV 4860.7 5444.8 6017.5
Par with EIS
CV (90%), PV (10%)
5%, 95% 16 11 65% 16.6% 90%, 10%,
0% 8.3% 4.0% 4.3% - 9.4% -
CRISIL AAA (SO) - Series A PTCs CRISIL BBB (SO) Equivalent - Second loss
facility
5 Sansar Trust
December 2015 II 4375.6 4781.3 5234.3
Par with EIS
CV (60%), Tractor (28%) and PV (12%)
9%, 91% 14 10 67% 16.5% 98%, 2%, 0% 10.8% 4.2% 6.6% - 8.4% - CRISIL AAA (SO) - Series A PTCs
CRISIL BBB (SO) Equivalent - Second loss facility
6 Sansar Trust
March 2016 IV 2894.8 3210.7 3484.3
Par with EIS
CV (79%), PV (21%)
3%, 97% 14 14 62% 16.6% 88%, 12%,
0% 8.3% 4.2% 4.1% - 8.0% -
CRISIL AAA (SO) - Series A PTCs CRISIL A- (SO) Equivalent - Second loss
facility
7 Sansar Trust June
2016 II 4002.4 4461.8 4956.1
Par with EIS
CV (85%), PV (8%), CE (6%) & Tractor (1%)
24%, 76% 17 11 72% 15.5% 92%, 8%, 0% 8.3% 4.0% 4.3% - 9.7% - CRISIL AAA (SO) - Series A PTCs
CRISIL A- (SO) Equivalent - Second loss facility
8 Sansar Trust
September 2016 3472.4 3793.8 4285.6
Par with EIS
CV (78%), PV (12%), THW (8%) & CE
(2%)
7%, 93% 13 11 68% 21.2% 96%, 4%, 0% 8.9% 4.0% 4.9% - 11.3% -
CRISIL AAA (SO) - Series A1 PTCs, Series A2 PTCs
CRISIL BBB+ (SO) Equivalent - Second loss facility
9 Sansar Trust Sep
2016 II 2909.6 3290.6 3622.6
Par with EIS
CV (83%), CE (10%) &
PV (7%) 42%, 58% 20 8 77% 14.1%
88%, 12%, 0%
9.2% 4.0% 5.2% - 8.9% -
Provisional CRISIL AAA (SO) - Series A PTCs
Provisional CRISIL BBB+ (SO) Equivalent - Second loss facility
10 Sansar Trust Sep
2016 III 4700.6 5236.4 5785.9
Par with EIS
CV (69%), Tractor (14%), PV (9%) & CE
(8%)
26%, 74% 17 11 71% 15.6% 91%, 9%, 0% 8.9% 4.0% 4.9% - 9.2% -
Provisional CRISIL AAA (SO) - Series A PTCs
Provisional CRISIL BBB+ (SO) Equivalent - Second loss facility
11 Sansar Trust
September 2016 V 4020.5 4353.7 4892.1
Par with EIS
CV (66%), THW (24%),
CE (8%) & PV (2%)
25%, 75% 12 16 69% 21.3% 99%, 1%, 0% 9.8% 4.1% 5.7% - 10.8% - CRISIL AAA (SO) - Series A PTCs
CRISIL BBB+ (SO) Equivalent - Second loss facility
12 Sansar Trust
September 2016 VI
5008.1 5538.5 6464.5 Par with
EIS
PV (60%), CV (30%), THW (8%) & CE
(2%)
5%, 95% 15 10 68% 22.2% 95%, 5%, 0% 9.2% 3.9% 5.3% - 14.1% -
CRISIL AAA (SO) - Series A1 PTCs, Series A2 PTCs, Series A3 PTCs
CRISIL BBB+ (SO) Equivalent - Second loss facility
13 Sansar Trust
October 2016 II 2562.4 2790.6 3070.3
Par with EIS
CV (71%), PV (29%)
0%, 100% 12 18 64% 19.9% 92%, 8%, 0% 8.4% 4.2% 4.2% - 8.9% -
Provisional CRISIL AAA (SO) - Series A PTCs
Provisional CRISIL BBB+ (SO) Equivalent - Second loss facility

35
Classification: INTERNAL: CONFIDENTIAL
Shriram Transport Finance Company Limited- Pool Performance
Initial pool details Delinquencies Overdues
Sr. no
Transaction name
Pool principal (Rs. Mn)
Structure Asset class
Credit collateral as
% of pool cashflows
MPS Amortisation CCR#
3 month average MCR# Cumulative
prepayments
Current quarter
Previous quarter
Current quarter
Previous quarter Loss on
repossession and sale
Credit collateral utilisation
Liquidity facility
utilisation
Current credit
collateral as % of future
payouts
EIS as % of future payouts
TCR TCC
Current quarter
Previous quarter
90+ 180+ 90+ 180+ 1+ 90+ 1+ 90+
1 Sansar Trust Feb
2014 - II1 9973.4
Par with EIS
CV & PV 8.2% 30 90.2% 94.6% 91.8% 95.7% 10.7% 2.6% 1.6% 3.0% 1.4% 2.5% 1.9% 2.7% 1.9% 0.1%$ 1.8% - 95.7% 4.9% 4.1% Above
20 times
2 STFCL Trust March 2015
10624.8 Par with
EIS CV & PV 8.0% 20 68.6% 94.1% 93.7% 91.7% 7.4% 3.4% 0.8% 3.1% 0.6% 2.6% 1.6% 2.5% 1.4% N.A 0.0% - 29.4% 7.0% 66.0%
Above 20
times
3 Sansar Trust
March 2015 III 505.9
Par with EIS
CV & PV 8.8% 20 71.2% 94.4% 100.7% 94.1% 8.6% 2.8% 0.7% 2.7% 0.7% 1.5% 1.3% 2.2% 1.2% N.A 0.0% - 35.2% 7.1% 60.5% Above
20 times
4 Sansar Trust Mar
2015 IV 4860.7
Par with EIS
CV & PV 8.3% 20 70.5% 92.1% 96.7% 93.4% 8.6% 3.3% 1.2% 2.9% 1.1% 2.7% 1.8% 2.9% 1.5% N.A 0.0% - 32.6% 7.3% 62.8% Above
20 times
5 Sansar Trust
December 2015 II 4375.6
Par with EIS
CV, Tractor & PV
10.8% 11 51.9% 88.3% 88.9% 86.3% 5.3% 2.3% 0.4% 1.6% 0.2% 2.1% 0.9% 2.1% 0.5% N.A 0.0% - 25.0% 7.9% 69.5% Above
20 times
6 Sansar Trust
March 2016 IV 2894.8
Par with EIS
CV & PV 8.3% 7 33.1% 89.1% 90.5% 87.4% 2.8% 2.6% 0.3% 0.7% 0.0% 2.1% 1.0% 1.5% 0.2% N.A 0.0% - 13.8% 8.4% 79.5% Above
20 times
7 Sansar Trust June 2016 II
4002.4 Par with
EIS CV, PV, CE
& Tractor 8.3% 6 18.4% 83.3% 84.8% 83.6% 1.4% 1.3% 0.0% 0.3% 0.0% 2.8% 0.2% 1.5% 0.0% N.A 0.0% - 11.5% 9.3% 80.9%
Not relevant
8 Sansar Trust
September 2016 3472.42
Par with EIS
CV, PV, THW & CE
8.9% 3 15.0% 72.1% 72.7% - 1.9% 0.3% 0.0% - - 2.0% 0.1% - - N.A 0.0% - 12.0% 11.7% 78.8% Not
relevant
9 Sansar Trust Sep
2016 II 2909.55
Par with EIS
CV, CE & PV
9.2% 2 5.2% 84.4% 89.3% - 0.4% 0.2% 0.0% - - 1.3% 0.0% - - N.A 0.0% - 10.8% 10.1% 81.0% Not
relevant
10 Sansar Trust Sep
2016 III 4700.55
Par with EIS
CV, Tractor, PV & CE
8.9% 2 6.9% 80.9% 83.7% - 0.7% 0.2% 0.0% - - 1.3% 0.0% - - N.A 0.0% - 10.7% 10.5% 80.9% Not
relevant
11 Sansar Trust
September 2016 V
4020.5 Par with
EIS CV, THW, CE & PV
9.8% 3 15.0% 77.4% 77.3% - 1.1% 0.2% 0.0% - - 2.0% 0.0% - - N.A 0.0% - 13.1% 10.8% 78.5% Not
relevant
12 Sansar Trust
September 2016 VI
5008.1 Par with
EIS PV, CV,
THW & CE 9.2% 3 14.2% 70.0% 71.2% - 2.3% 0.4% 0.0% - - 2.4% 0.1% - - N.A 0.0% - 12.5% 15.2% 75.9%
Not relevant
13 Sansar Trust
October 2016 II 2562.4
Par with EIS
CV & PV 8.4% 1 6.5% 84.1% 87.4% - 1.0% 0.0% 0.0% - - 0.7% 0.0% - - N.A 0.0% - 10.0% 10.2% 81.7% Not
relevant
# Due to data limitation, billings and collection amounts considered in calculation of CCR and MCR include advance collections $ Data as of October 2015 payouts 1 Data as of November 2016 payouts

36
Classification: INTERNAL: CONFIDENTIAL
SREI Equipment Finance Limited- Initial Pool Details
Sr. no
Transaction name
Pool principal (Rs. Mn)
Investor payouts (Rs. Mn)
Pool cashflows (Rs. Mn)
Structure
Pool Characteristics
Overdue composition
(0, 1, 2)
Credit Support
Current Rating/ Credit Opinion
Asset class Asset type
(New, Used)
Pool duration (months)
WAS (months)
WAL WAY
Credit collateral as % of
pool cashflows
First loss facility as % of pool cashflows
Second loss
facility as % of pool cashflows
Liquidity facility as % of pool cashflows
Scheduled EIS as % of pool
cashflows
Subordinated cashflows as
% of pool cashflows
1
Indian Infrastructure Equipment
Receivables Trust March
2015
1036.8 1140.9 1236.0 Par with
EIS CE (100%) 90%, 10% 20 8 80% 13.1%
100%, 0%, 0%
8.9% - - - 7.7% - CRISIL AA (SO) - Series A PTCs
SREI Equipment Finance Limited- Pool Performance
Initial pool details Delinquencies Overdues
Sr. no
Transaction name
Pool principal (Rs. Mn)
Structure Asset class
Credit collateral as % of
pool cashflows
MPS Amortisation CCR
3 month average MCR Cumulative
prepayments
Current quarter
Previous quarter
Current quarter
Previous quarter Loss on
repossession and sale
Credit collateral utilisation
Liquidity facility
utilisation
Current credit
collateral as % of future
payouts
EIS as % of
future payouts
TCR TCC
Current quarter
Previous quarter
90+ 180+ 90+ 180+ 1+ 90+ 1+ 90+
1
Indian Infrastructure Equipment
Receivables Trust March
2015
1036.77 Par with
EIS CE 8.9% 21 64.5% 97.6% 98.0% 98.1% 2.6% 3.1% 1.9% 2.8% 1.9% 1.9% 1.5% 1.7% 1.1% 0.0% 0.0% - 28.6% 3.9% 68.8% 13.4

37
Classification: INTERNAL: CONFIDENTIAL
Tata Motors Finance Limited- Initial Pool Details
Sr. no
Transaction name
Pool principal (Rs. Mn)
Investor payouts (Rs. Mn)
Pool cashflows (Rs. Mn)
Structure
Pool Characteristics
Overdue composition
(0, 1, 2)
Credit Support Current Rating/
Asset class
Asset type
(New, Used)
Pool duration (months)
WAS (months)
WAL WAY
Credit collateral as % of
pool cashflows
First loss facility as % of pool cashflows
Second loss
facility as % of pool cashflows
Liquidity facility as % of pool cashflows
Scheduled EIS as % of
pool cashflows
Subordinated cashflows as %
of pool cashflows
Credit Opinion
1
Indian Receivable
Trust September
2016 - A
7472.4 8112.3 8562.6 Par with EIS CV
(100%) 100%,
0% 13 21 94% 13.0% 100%, 0%, 0% 10.0% 4.4% 5.6% - 4.9% -
CRISIL AAA (SO) - Series A PTCs CRISIL BBB+ (SO) - Second loss facility
Tata Motors Finance Limited- Pool Performance
Initial pool details Delinquencies Overdues
Sr. no
Transaction name
Pool principal (Rs. Mn)
Structure Asset class
Credit collateral as % of
pool cashflows
MPS Amortisation CCR
3 month average MCR Cumulative
prepayments
Current quarter
Previous quarter
Current quarter
Previous quarter Loss on
repossession and sale
Credit collateral utilisation
Liquidity facility
utilisation
Current credit
collateral as % of future
payouts
EIS as % of
future payouts
TCR TCC
Current quarter
Previous quarter
90+ 180+ 90+ 180+ 1+ 90+ 1+ 90+
1
Indian Receivable
Trust September
2016 - A
7472.4 Par with
EIS CV 10.0% 3 13.2% 92.4% 92.4% - 1.2% 0.0% 0.0% - - 1.1% 0.0% - - N.A 1.9% - 12.1% 4.9% 83.9%
Not relevant
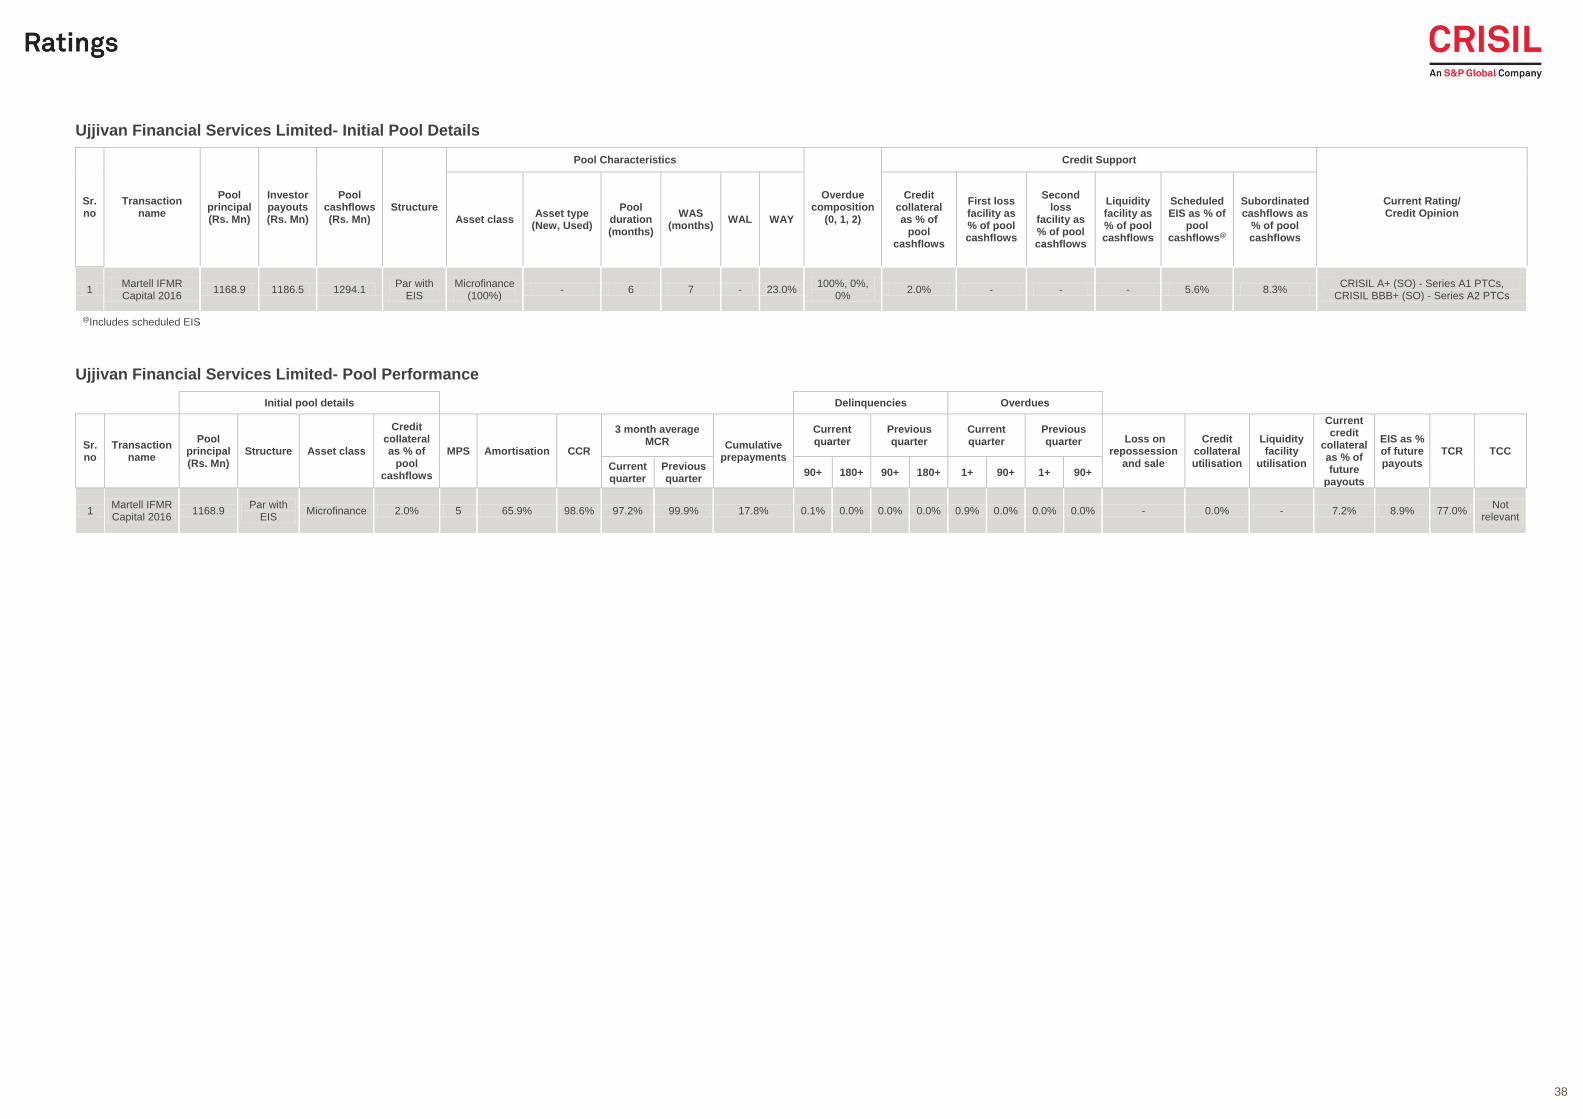
38
Classification: INTERNAL: CONFIDENTIAL
Ujjivan Financial Services Limited- Initial Pool Details
Sr. no
Transaction name
Pool principal (Rs. Mn)
Investor payouts (Rs. Mn)
Pool cashflows (Rs. Mn)
Structure
Pool Characteristics
Overdue composition
(0, 1, 2)
Credit Support
Current Rating/ Credit Opinion
Asset class Asset type
(New, Used)
Pool duration (months)
WAS (months)
WAL WAY
Credit collateral as % of
pool cashflows
First loss facility as % of pool cashflows
Second loss
facility as % of pool cashflows
Liquidity facility as % of pool cashflows
Scheduled EIS as % of
pool cashflows@
Subordinated cashflows as
% of pool cashflows
1 Martell IFMR Capital 2016
1168.9 1186.5 1294.1 Par with
EIS Microfinance
(100%) - 6 7 - 23.0%
100%, 0%, 0%
2.0% - - - 5.6% 8.3% CRISIL A+ (SO) - Series A1 PTCs,
CRISIL BBB+ (SO) - Series A2 PTCs
@Includes scheduled EIS
Ujjivan Financial Services Limited- Pool Performance
Initial pool details Delinquencies Overdues
Sr. no
Transaction name
Pool principal (Rs. Mn)
Structure Asset class
Credit collateral as % of
pool cashflows
MPS Amortisation CCR
3 month average MCR Cumulative
prepayments
Current quarter
Previous quarter
Current quarter
Previous quarter Loss on
repossession and sale
Credit collateral utilisation
Liquidity facility
utilisation
Current credit
collateral as % of future
payouts
EIS as % of future payouts
TCR TCC
Current quarter
Previous quarter
90+ 180+ 90+ 180+ 1+ 90+ 1+ 90+
1 Martell IFMR Capital 2016
1168.9 Par with
EIS Microfinance 2.0% 5 65.9% 98.6% 97.2% 99.9% 17.8% 0.1% 0.0% 0.0% 0.0% 0.9% 0.0% 0.0% 0.0% - 0.0% - 7.2% 8.9% 77.0%
Not relevant

39
Mortgage – backed Securities

40
This page has been intentionally left blank

41
Dewan Housing Finance Corporation Limited- Initial Pool Details
Sr. no
Transaction name Asset class
Structure Pool
principal (Rs. Mn)
Pool duration (months)
WAS (months)
WAL WAY Credit collateral
as % of pool principal
First loss facility as % of pool
principal
Second loss facility as % of pool principal
Scheduled EIS as % of pool
principal
Current Rating/ Credit Opinion
1 Nirmaan RMBS Trust - Series II - 2014 Housing loans Par with EIS 1169.3 130 33 57% 11.6% 7.0% - - 30.3% CRISIL AAA (SO) - Series A1 PTCs CRISIL AA (SO) - Series A2 PTCs
2 Nirmaan RMBS Trust - Series V - 2014 Housing loans Par with EIS 2968.9 139 18 76% 11.9% 7.7% - - 27.2% CRISIL AAA (SO) - Series A1 PTCs CRISIL AA (SO) - Series A2 PTCs
Dewan Housing Finance Corporation Limited- Pool Performance
Initial Pool Details 3 month average
MCR Delinquencies Overdues
Sr. no
Transaction name
Pool principal (Rs. Mn)
Structure
Credit collateral as % of
pool principal
MPS WAM
(months) Average
yield Amortisation CCR
Current quarter
Previous quarter
TCE Cumulative
prepayments
Current quarter
Previous quarter
Current quarter
Previous quarter
Credit collateral utilisation
Current credit
collateral as % of
principal outstanding
Available EIS as % of
principal outstanding
TCR
90+ 180+ 90+ 180+ 1+ 90+ 1+ 90+
1
Nirmaan RMBS Trust -
Series II - 2014
1169.3 Par with
EIS 7.0% 34 81 11.7% 46.0% 99.7% 99.7% 100.0% 87.8% 35.0% 0.4% 0.4% 0.4% 0.4% 0.1% 0.1% 0.1% 0.1% 0.0% 13.0% 21.7% 81.3%
2
Nirmaan RMBS Trust -
Series V - 2014
2968.9 Par with
EIS 7.7% 33 82 11.6% 41.0% 99.8% 100.6% 100.7% 93.4% 32.8% 0.2% 0.1% 0.3% 0.1% 0.1% 0.0% 0.1% 0.0% 0.0% 13.0% 12.8% 86.2%

42
42
Housing Development Finance Corporation Limited- Initial Pool Details
Sr. no
Transaction name Asset class Structure Pool
principal (Rs. Mn)
Pool duration (months)
WAS (months)
WAL WAY Credit collateral
as % of pool principal
First loss facility as % of pool
principal
Second loss facility as % of pool principal
Scheduled EIS as % of pool
principal
Current Rating/ Credit Opinion
1 Assignment of Mortgage Receivables -
March 2008 Housing loans Par with EIS 1999.9 110 9 80% 11.4% 5.9% 1.9% 4.0% 9.50%
CRISIL AAA (SO) Equivalent - Acquirer payouts
2 Assignment of Mortgage Receivables -
March 2009 Housing loans Par with EIS 12804.8 138 12 76% 11.5% 10.0% 2.8% 7.2% 11.0%
CRISIL AAA (SO) Equivalent - Acquirer payouts
3 HDFC Assignment of Receivables January
2012 Housing loans Par with EIS 8003.1 124 6 76% 10.7% 5.5% 1.5% 4.0% 7.3%
CRISIL AAA (SO) Equivalent - Acquirer payouts
CRISIL BBB (SO) Equivalent - Second loss facility
4 HDFC Trust 2014 Housing loans Par with EIS 5439.0 96 42 78% 11.0% 6.0% - - 22.5% CRISIL AAA (SO) - Series A PTCs
Housing Development Finance Corporation Limited- Pool Performance
Initial Pool Details 3 month average
MCR Delinquencies Overdues
Sr. no
Transaction name
Pool principal (Rs. Mn)
Structure
Credit collateral as % of
pool principal
MPS WAM
(months) Average
yield Amortisation CCR
Current quarter
Previous quarter
TCE Cumulative
prepayments
Current quarter
Previous quarter
Current quarter
Previous quarter
Credit collateral utilisation
Current credit
collateral as % of
principal outstanding
Available EIS as % of
principal outstanding
TCR
90+ 180+ 90+ 180+ 1+ 90+ 1+ 90+
1
Assignment of Mortgage
Receivables - March 20082
1999.9 Par with
EIS 5.9% 103 49 10.9% 90.3% 99.9% 100.8% 99.8% 77.9% 57.6% 0.0% 0.0% 0.1% 0.0% 0.1% 0.0% 0.1% 0.0% 0.0% 60.4% 8.8% 52.2%
2
Assignment of Mortgage
Receivables - March 2009
12804.8 Par with
EIS 10.0% 94 52 11.3% 80.3% 99.8% 99.4% 100.6% 70.3% 47.7% 0.6% 0.3% 0.6% 0.2% 0.2% 0.1% 0.2% 0.1% 0.0% 50.6% 7.0% 61.6%
3
HDFC Assignment
of Receivables
January 2012
8003.1 Par with
EIS 5.5% 61 64 10.5% 53.8% 99.7% 99.8% 99.7% 82.0% 25.5% 0.9% 0.4% 0.8% 0.3% 0.2% 0.1% 0.2% 0.1% 0.0% 11.9% 4.3% 89.8%
4 HDFC Trust
2014 5439.0
Par with EIS
6.0% 33 63 10.7% 38.8% 99.4% 100.4% 99.9% 79.7% 18.3% 0.8% 0.3% 0.9% 0.3% 0.3% 0.1% 0.3% 0.1% 0.0% 9.8% 15.5% 84.0%

43
43
ICICI Bank Limited- Initial Pool Details
Sr. no
Transaction name Asset class Structure Pool
principal (Rs. Mn)
Pool duration (months)
WAS (months)
WAL WAY Credit collateral
as % of pool principal
First loss facility as % of pool
principal
Second loss facility as % of pool principal
Scheduled EIS as % of pool
principal
Current Rating/ Credit Opinion
1 Indian Residential MBS Trust Series XI Housing loans Par with EIS 3159.3 87 15 74% 9.7% 7.0% - - 20.9% CRISIL AAA (SO) - Series A PTCs
2 Indian RMBS Trust Series IV Housing loans Par with EIS 4000.0 93 12 78% 7.6% 1.9% - - 17.0% CRISIL AAA (SO) - Series A PTCs
3 Indian RMBS Trust Series V Housing loans Par with EIS 999.1 134 11 76% 8.4% 1.9% - - 19.5% CRISIL AAA (SO) - Series A PTCs
4 Indian RMBS Trust Series VIII Housing loans Par with EIS 1950.0 95 13 74% 8.4% 3.8% - - 17.7% CRISIL AAA (SO) - Series A PTCs
5 Indian RMBS Trust Series IX Housing loans Par with EIS 1490.0 134 8 78% 8.3% 1.6% - - 25.6% CRISIL AAA (SO) - Series A PTCs
6 Indian RMBS Trust Series X Housing loans Par with EIS 4000.0 119 7 76% 8.2% 1.6% - - 22.9% CRISIL AAA (SO) - Series A PTCs
7 Nivas Trust Series V Housing loans Par with EIS 6000.0 123 9 78% 8.3% 2.2% - - 23.5% CRISIL AAA (SO) - Series A PTCs
8 Griha Trust Series II Housing loans Par with EIS 2000.0 110 7 80% 7.8% 2.0% - - 23.2% CRISIL AAA (SO) - Series A PTCs
9 Nivas Trust Series VI Housing loans Par with EIS 4000.0 117 7 78% 9.0% 2.0% - - 20.6% CRISIL AAA (SO) - Series A PTCs
10 Nivas Trust Series VII Housing loans Par with IO Strip 967.0 92 29 73% 10.0% 9.7% 4.9% 4.8% -
CRISIL AAA (SO) - Series A PTCs, Series IO PTCs
CRISIL AAA (SO) Equivalent - Second loss facility
11 Mortgage Repack Trust Series I Housing loans Par with IO Strip 6935.3 133 - - - 17.9% 9.0% 8.9% - CRISIL AAA (SO) Equivalent - Series IO-
A2 PTCs, Second loss facility
12 Aawas Trust Series VI Housing loans Par with IO Strip 3446.0 88 10 75% 8.6% 15.3% 5.7% 9.6% - CRISIL AAA (SO) Equivalent - Series A2 PTCs, Series A3 PTCs, Series B PTCs,
Second loss facility
13 Aawas Trust Series III Housing loans Par with IO Strip 2564.7 61 12 73% 8.4% 12.8% 4.9% 7.9% - CRISIL AAA (SO) Equivalent - Series A1
PTCs, Series A2 PTCs, Second loss facility

44
44
ICICI Bank Limited- Pool Performance
Initial Pool Details 3 month average
MCR Delinquencies Overdues
Sr. no
Transaction name
Pool principal (Rs. Mn)
Structure
Credit collateral as % of
pool principal
MPS WAM
(months) Average
yield Amortisation CCR
Current quarter
Previous quarter
TCE Cumulative
prepayments
Current quarter
Previous quarter
Current quarter
Previous quarter
Credit collateral utilisation
Current credit
collateral as % of
principal outstanding
Available EIS as % of
principal outstanding
TCR
90+ 180+ 90+ 180+ 1+ 90+ 1+ 90+
1
Indian Residential MBS Trust Series XI
3159.3 Par with
EIS 7.0% 153 61 16.9% 97.5% 99.7% 100.9% 98.3% 23.9% 55.1% 0.3% 0.3% 0.3% 0.3% 0.2% 0.2% 0.2% 0.2% 0.0% Fully covered 53.0% 0.0%
2 Indian RMBS Trust Series
IV 4000.0
Par with EIS
1.9% 146 77 14.5% 94.4% 99.5% 96.9% 98.2% 24.2% 74.3% 0.6% 0.6% 0.6% 0.6% 0.3% 0.3% 0.3% 0.3% 0.0% 22.2% 17.9% 79.8%
3 Indian RMBS Trust Series
V 999.1
Par with EIS
1.9% 141 89 15.9% 92.4% 98.6% 91.1% 94.6% 10.7% 72.9% 1.8% 1.7% 1.7% 1.7% 1.0% 1.0% 1.0% 1.0% 0.3% 17.1% 20.1% 84.0%
4 Indian RMBS Trust Series
VIII 1950.0
Par with EIS
3.8% 141 85 15.8% 95.1% 99.0% 95.5% 104.5% 10.9% 60.5% 1.2% 1.2% 1.2% 1.2% 0.8% 0.8% 0.8% 0.8% 0.0% 52.8% 18.9% 68.1%
5 Indian RMBS Trust Series
IX 1490.0
Par with EIS
1.6% 141 81 14.9% 92.9% 99.4% 115.6% 96.4% 21.2% 74.5% 0.9% 0.8% 1.0% 0.9% 0.5% 0.5% 0.5% 0.5% 0.0% 22.8% 18.9% 80.1%
6 Indian RMBS Trust Series
X 4000.0
Par with EIS
1.6% 141 83 14.5% 93.6% 99.0% 94.9% 97.5% 13.1% 67.5% 1.4% 1.3% 1.4% 1.3% 0.8% 0.8% 0.8% 0.8% 0.0% 25.7% 19.4% 78.4%
7 Nivas Trust
Series V 6000.0
Par with EIS
2.2% 141 85 14.8% 93.6% 98.5% 92.3% 97.6% 8.7% 69.8% 1.8% 1.8% 1.8% 1.8% 1.1% 1.1% 1.1% 1.1% 0.0% 33.7% 20.2% 75.1%
8 Griha Trust
Series II 2000.0
Par with EIS
2.0% 141 77 12.7% 94.9% 99.5% 97.9% 97.5% 20.0% 72.7% 0.6% 0.5% 0.5% 0.5% 0.3% 0.3% 0.3% 0.3% 0.0% 39.3% 18.3% 69.3%
9 Nivas Trust Series VI
4000.0 Par with
EIS 2.0% 141 79 14.0% 94.5% 98.6% 91.6% 89.9% 8.3% 69.5% 1.7% 1.7% 1.7% 1.7% 1.0% 1.0% 1.0% 1.0% 0.6% 36.5% 18.5% 72.4%
10 Nivas Trust Series VII
967.0 Par with IO Strip
9.7% 136 77 16.5% 92.7% 99.2% 100.3% 97.0% 19.3% 69.5% 1.0% 1.0% 1.1% 1.0% 0.6% 0.6% 0.6% 0.6% 0.0% 90.5% 17.5% 49.8%
11 Mortgage
Repack Trust Series I
6935.3 Par with IO Strip
17.9% 133 - - - - - - - - - - - - - - - - - Fully covered - 0.0%
12 Aawas Trust
Series VI 3446.0
Par with IO Strip
15.3% 135 54 15.6% 92.7% 99.0% 95.0% 99.1% 14.4% 65.8% 1.4% 1.3% 1.4% 1.3% 0.8% 0.8% 0.8% 0.7% 0.0% Fully covered 48.7% 18.9%
13 Aawas Trust
Series III 2564.7
Par with IO Strip
12.8% 135 22 15.7% 97.7% 99.4% 94.5% 101.9% 11.9% 54.3% 0.7% 0.7% 0.7% 0.7% 0.5% 0.5% 0.5% 0.5% 0.0% Fully covered 26.9% 0.0%
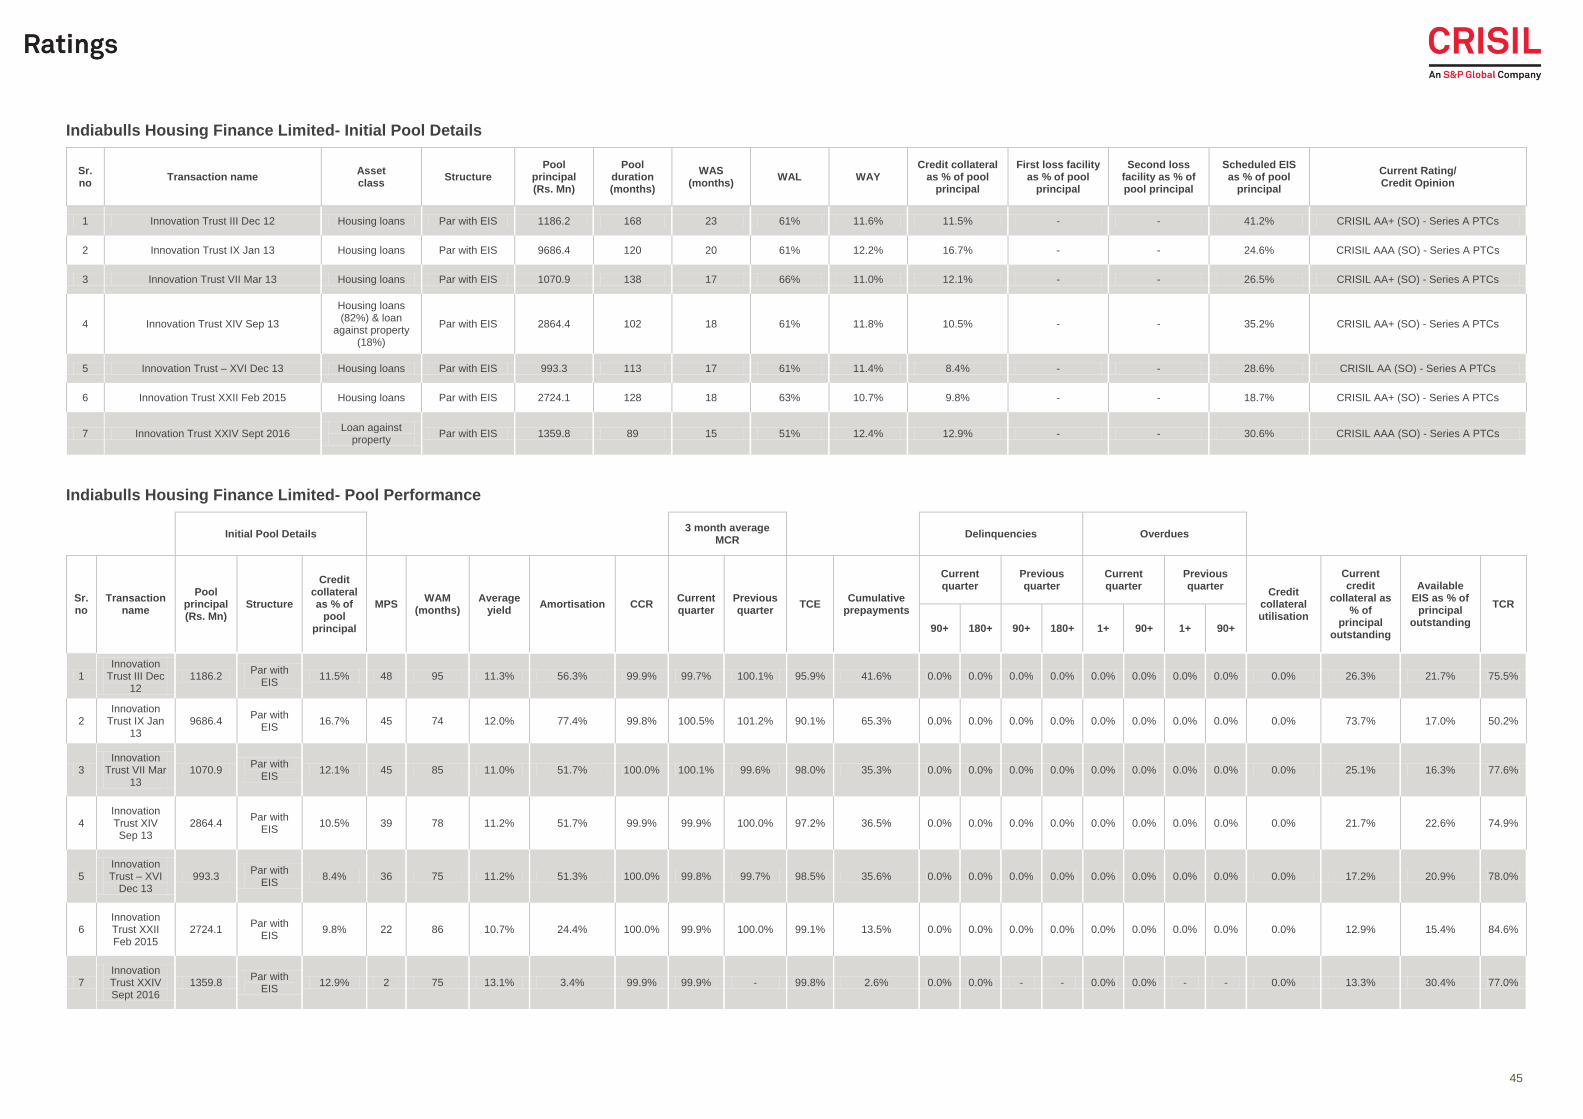
45
45
Indiabulls Housing Finance Limited- Initial Pool Details
Sr. no
Transaction name Asset class
Structure Pool
principal (Rs. Mn)
Pool duration (months)
WAS (months)
WAL WAY Credit collateral
as % of pool principal
First loss facility as % of pool
principal
Second loss facility as % of pool principal
Scheduled EIS as % of pool
principal
Current Rating/ Credit Opinion
1 Innovation Trust III Dec 12 Housing loans Par with EIS 1186.2 168 23 61% 11.6% 11.5% - - 41.2% CRISIL AA+ (SO) - Series A PTCs
2 Innovation Trust IX Jan 13 Housing loans Par with EIS 9686.4 120 20 61% 12.2% 16.7% - - 24.6% CRISIL AAA (SO) - Series A PTCs
3 Innovation Trust VII Mar 13 Housing loans Par with EIS 1070.9 138 17 66% 11.0% 12.1% - - 26.5% CRISIL AA+ (SO) - Series A PTCs
4 Innovation Trust XIV Sep 13
Housing loans (82%) & loan
against property (18%)
Par with EIS 2864.4 102 18 61% 11.8% 10.5% - - 35.2% CRISIL AA+ (SO) - Series A PTCs
5 Innovation Trust – XVI Dec 13 Housing loans Par with EIS 993.3 113 17 61% 11.4% 8.4% - - 28.6% CRISIL AA (SO) - Series A PTCs
6 Innovation Trust XXII Feb 2015 Housing loans Par with EIS 2724.1 128 18 63% 10.7% 9.8% - - 18.7% CRISIL AA+ (SO) - Series A PTCs
7 Innovation Trust XXIV Sept 2016 Loan against
property Par with EIS 1359.8 89 15 51% 12.4% 12.9% - - 30.6% CRISIL AAA (SO) - Series A PTCs
Indiabulls Housing Finance Limited- Pool Performance
Initial Pool Details 3 month average
MCR Delinquencies Overdues
Sr. no
Transaction name
Pool principal (Rs. Mn)
Structure
Credit collateral as % of
pool principal
MPS WAM
(months) Average
yield Amortisation CCR
Current quarter
Previous quarter
TCE Cumulative
prepayments
Current quarter
Previous quarter
Current quarter
Previous quarter
Credit collateral utilisation
Current credit
collateral as % of
principal outstanding
Available EIS as % of
principal outstanding
TCR
90+ 180+ 90+ 180+ 1+ 90+ 1+ 90+
1 Innovation
Trust III Dec 12
1186.2 Par with
EIS 11.5% 48 95 11.3% 56.3% 99.9% 99.7% 100.1% 95.9% 41.6% 0.0% 0.0% 0.0% 0.0% 0.0% 0.0% 0.0% 0.0% 0.0% 26.3% 21.7% 75.5%
2 Innovation
Trust IX Jan 13
9686.4 Par with
EIS 16.7% 45 74 12.0% 77.4% 99.8% 100.5% 101.2% 90.1% 65.3% 0.0% 0.0% 0.0% 0.0% 0.0% 0.0% 0.0% 0.0% 0.0% 73.7% 17.0% 50.2%
3 Innovation
Trust VII Mar 13
1070.9 Par with
EIS 12.1% 45 85 11.0% 51.7% 100.0% 100.1% 99.6% 98.0% 35.3% 0.0% 0.0% 0.0% 0.0% 0.0% 0.0% 0.0% 0.0% 0.0% 25.1% 16.3% 77.6%
4 Innovation Trust XIV Sep 13
2864.4 Par with
EIS 10.5% 39 78 11.2% 51.7% 99.9% 99.9% 100.0% 97.2% 36.5% 0.0% 0.0% 0.0% 0.0% 0.0% 0.0% 0.0% 0.0% 0.0% 21.7% 22.6% 74.9%
5 Innovation Trust – XVI
Dec 13 993.3
Par with EIS
8.4% 36 75 11.2% 51.3% 100.0% 99.8% 99.7% 98.5% 35.6% 0.0% 0.0% 0.0% 0.0% 0.0% 0.0% 0.0% 0.0% 0.0% 17.2% 20.9% 78.0%
6 Innovation Trust XXII Feb 2015
2724.1 Par with
EIS 9.8% 22 86 10.7% 24.4% 100.0% 99.9% 100.0% 99.1% 13.5% 0.0% 0.0% 0.0% 0.0% 0.0% 0.0% 0.0% 0.0% 0.0% 12.9% 15.4% 84.6%
7 Innovation Trust XXIV Sept 2016
1359.8 Par with
EIS 12.9% 2 75 13.1% 3.4% 99.9% 99.9% - 99.8% 2.6% 0.0% 0.0% - - 0.0% 0.0% - - 0.0% 13.3% 30.4% 77.0%

46
46
LIC Housing Finance Limited- Initial Pool Details
Sr. no
Transaction name Asset class
Structure Pool
principal (Rs. Mn)
Pool duration (months)
WAS (months)
WAL WAY Credit collateral
as % of pool principal
First loss facility as % of pool
principal
Second loss facility as % of pool principal
Scheduled EIS as % of pool
principal
Current Rating/ Credit Opinion
1 India MBS 2002 Series I Trust Housing loans Premium 1869.3 74 36 56% 12.3% 12.5% - - - CRISIL AAA (SO) - Series I-D PTCs
LIC Housing Finance Limited- Pool Performance
Initial Pool Details 3 month average
MCR Delinquencies Overdues
Sr. no
Transaction name
Pool principal (Rs. Mn)
Structure
Credit collateral as % of
pool principal
MPS WAM
(months) Average
yield Amortisation CCR
Current quarter
Previous quarter
TCE Cumulative
prepayments
Current quarter
Previous quarter
Current quarter
Previous quarter
Credit collateral utilisation
Current credit
collateral as % of
principal outstanding
Available EIS as % of
principal outstanding
TCR
90+ 180+ 90+ 180+ 1+ 90+ 1+ 90+
1 India MBS
2002 Series I Trust
1869.3 Premium 12.5% 166 N.A N.A 100.0% 91.8% 47.3% 16.2% 0.2% 66.6% N.A N.A N.A N.A 3.9% N.A 3.8% N.A 72.6% Fully covered - 0.0%

47
47
Reliance Capital Limited- Initial Pool Details
Sr. no
Transaction name Asset class
Structure Pool
principal (Rs. Mn)
Pool duration (months)
WAS (months)
WAL WAY Credit collateral
as % of pool principal
First loss facility as % of pool
principal
Second loss facility as % of pool principal
Scheduled EIS as % of pool
principal
Current Rating/ Credit Opinion
1 Indian Receivable Trust - 3
Loan against property (73%) &
Housing loans (27%)
Par with EIS 10000.0 88 29 48% 14.5% 11.5% - - 35.8% CRISIL AAA (SO) - Series A PTCs
2 Indian Receivable Trust - 12 Loan against
property (100%) Par with EIS 1582.3 78 26 43% 13.9% 13.7% - - 34.5% CRISIL AAA (SO) - Series A PTCs
3 Indian Receivable Trust - 14 Loan against
property (100%) Par with EIS 1031.5 117 16 55% 12.6% 12.0% - - 19.5% CRISIL AAA (SO) - Series A PTCs
Reliance Capital Limited- Pool Performance
Initial Pool Details 3 month average
MCR Delinquencies Overdues
Sr. no
Transaction name
Pool principal (Rs. Mn)
Structure
Credit collateral as % of
pool principal
MPS WAM
(months) Average
yield Amortisation CCR
Current quarter
Previous quarter
TCE Cumulative
prepayments
Current quarter
Previous quarter
Current quarter
Previous quarter
Credit collateral utilisation
Current credit
collateral as % of
principal outstanding
Available EIS as % of
principal outstanding
TCR
90+ 180+ 90+ 180+ 1+ 90+ 1+ 90+
1 Indian
Receivable Trust - 3
10000.0 Par with
EIS 11.5% 48 49 14.6% 82.0% 98.1% 104.5% 92.1% 33.8% 63.8% 2.9% 2.7% 3.4% 2.7% 0.9% 0.9% 1.0% 0.9% 0.0% 63.8% 18.6% 48.5%
2 Indian
Receivable Trust - 12
1582.3 Par with
EIS 13.7% 36 50 14.1% 68.2% 98.3% 96.1% 95.0% 47.9% 54.1% 3.9% 2.5% 3.3% 3.1% 0.6% 0.6% 0.6% 0.5% 0.0% 43.1% 24.7% 57.6%
3 Indian
Receivable Trust - 14
1031.5 Par with
EIS 12.0% 34 48 14.3% 70.0% 99.1% 97.7% 97.6% 67.7% 53.2% 1.7% 1.5% 1.5% 1.2% 0.3% 0.3% 0.3% 0.2% 0.0% 43.7% 25.3% 56.1%
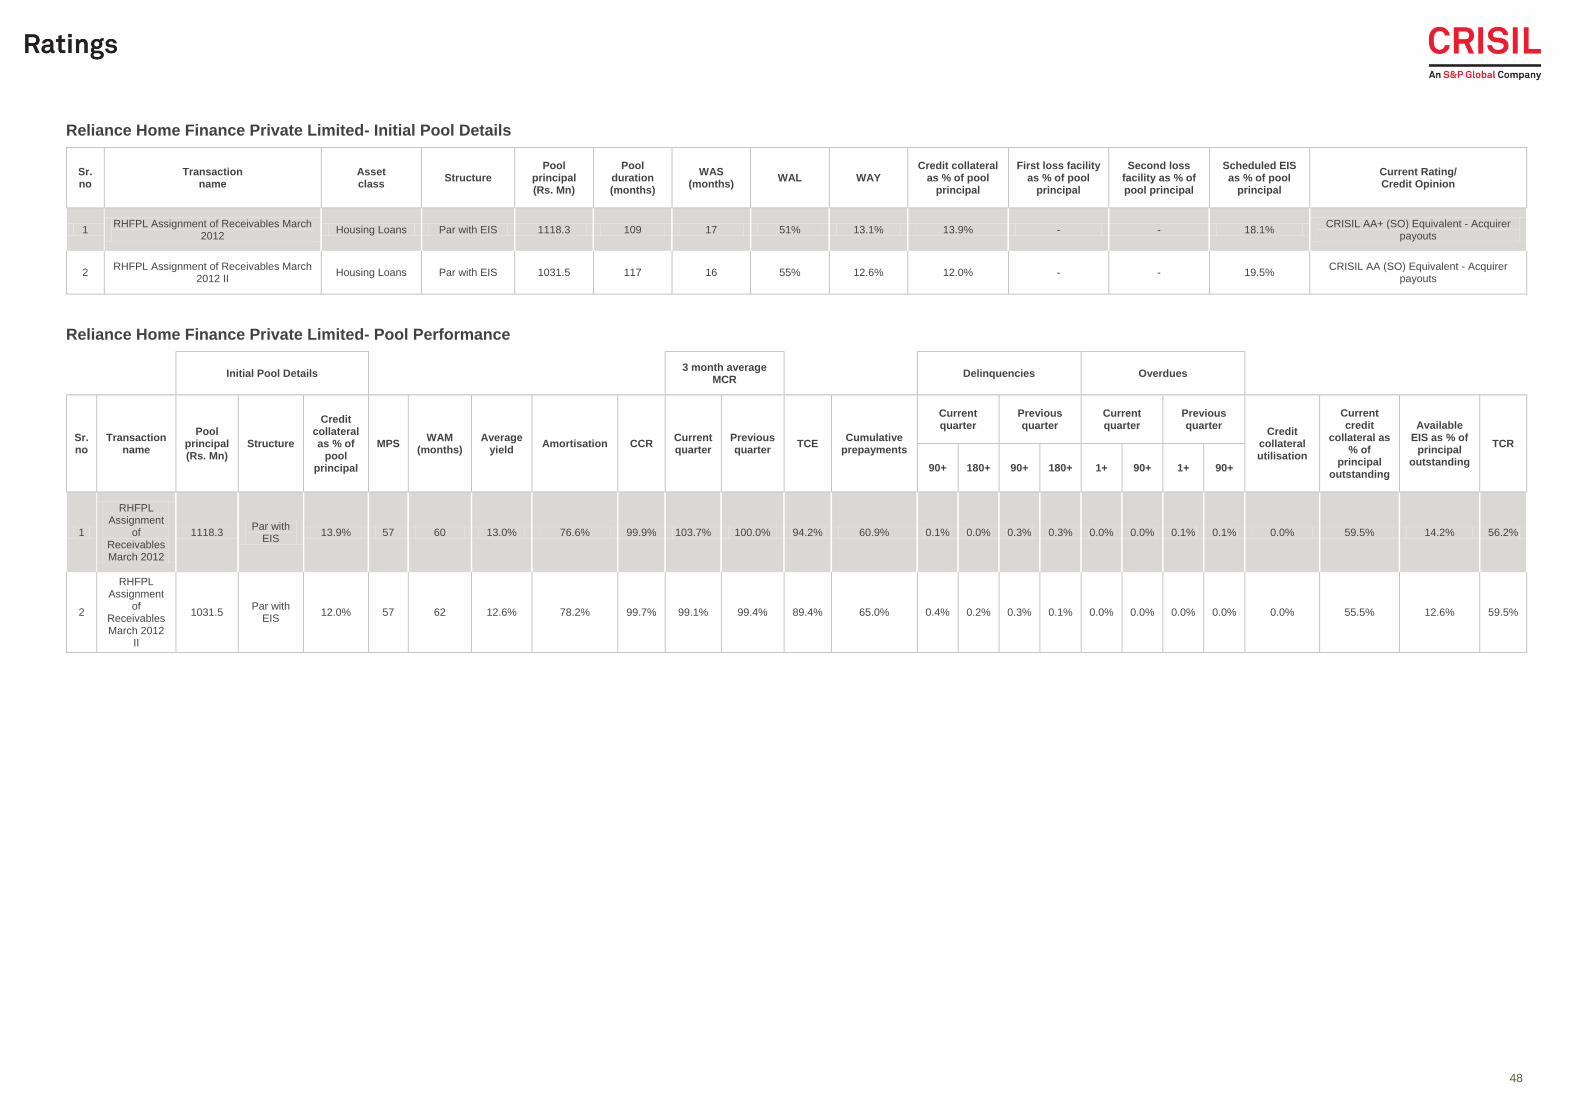
48
48
Reliance Home Finance Private Limited- Initial Pool Details
Sr. no
Transaction name
Asset class
Structure Pool
principal (Rs. Mn)
Pool duration (months)
WAS (months)
WAL WAY Credit collateral
as % of pool principal
First loss facility as % of pool
principal
Second loss facility as % of pool principal
Scheduled EIS as % of pool
principal
Current Rating/ Credit Opinion
1 RHFPL Assignment of Receivables March
2012 Housing Loans Par with EIS 1118.3 109 17 51% 13.1% 13.9% - - 18.1%
CRISIL AA+ (SO) Equivalent - Acquirer payouts
2 RHFPL Assignment of Receivables March
2012 II Housing Loans Par with EIS 1031.5 117 16 55% 12.6% 12.0% - - 19.5%
CRISIL AA (SO) Equivalent - Acquirer payouts
Reliance Home Finance Private Limited- Pool Performance
Initial Pool Details 3 month average
MCR Delinquencies Overdues
Sr. no
Transaction name
Pool principal (Rs. Mn)
Structure
Credit collateral as % of
pool principal
MPS WAM
(months) Average
yield Amortisation CCR
Current quarter
Previous quarter
TCE Cumulative
prepayments
Current quarter
Previous quarter
Current quarter
Previous quarter
Credit collateral utilisation
Current credit
collateral as % of
principal outstanding
Available EIS as % of
principal outstanding
TCR
90+ 180+ 90+ 180+ 1+ 90+ 1+ 90+
1
RHFPL Assignment
of Receivables March 2012
1118.3 Par with
EIS 13.9% 57 60 13.0% 76.6% 99.9% 103.7% 100.0% 94.2% 60.9% 0.1% 0.0% 0.3% 0.3% 0.0% 0.0% 0.1% 0.1% 0.0% 59.5% 14.2% 56.2%
2
RHFPL Assignment
of Receivables March 2012
II
1031.5 Par with
EIS 12.0% 57 62 12.6% 78.2% 99.7% 99.1% 99.4% 89.4% 65.0% 0.4% 0.2% 0.3% 0.1% 0.0% 0.0% 0.0% 0.0% 0.0% 55.5% 12.6% 59.5%
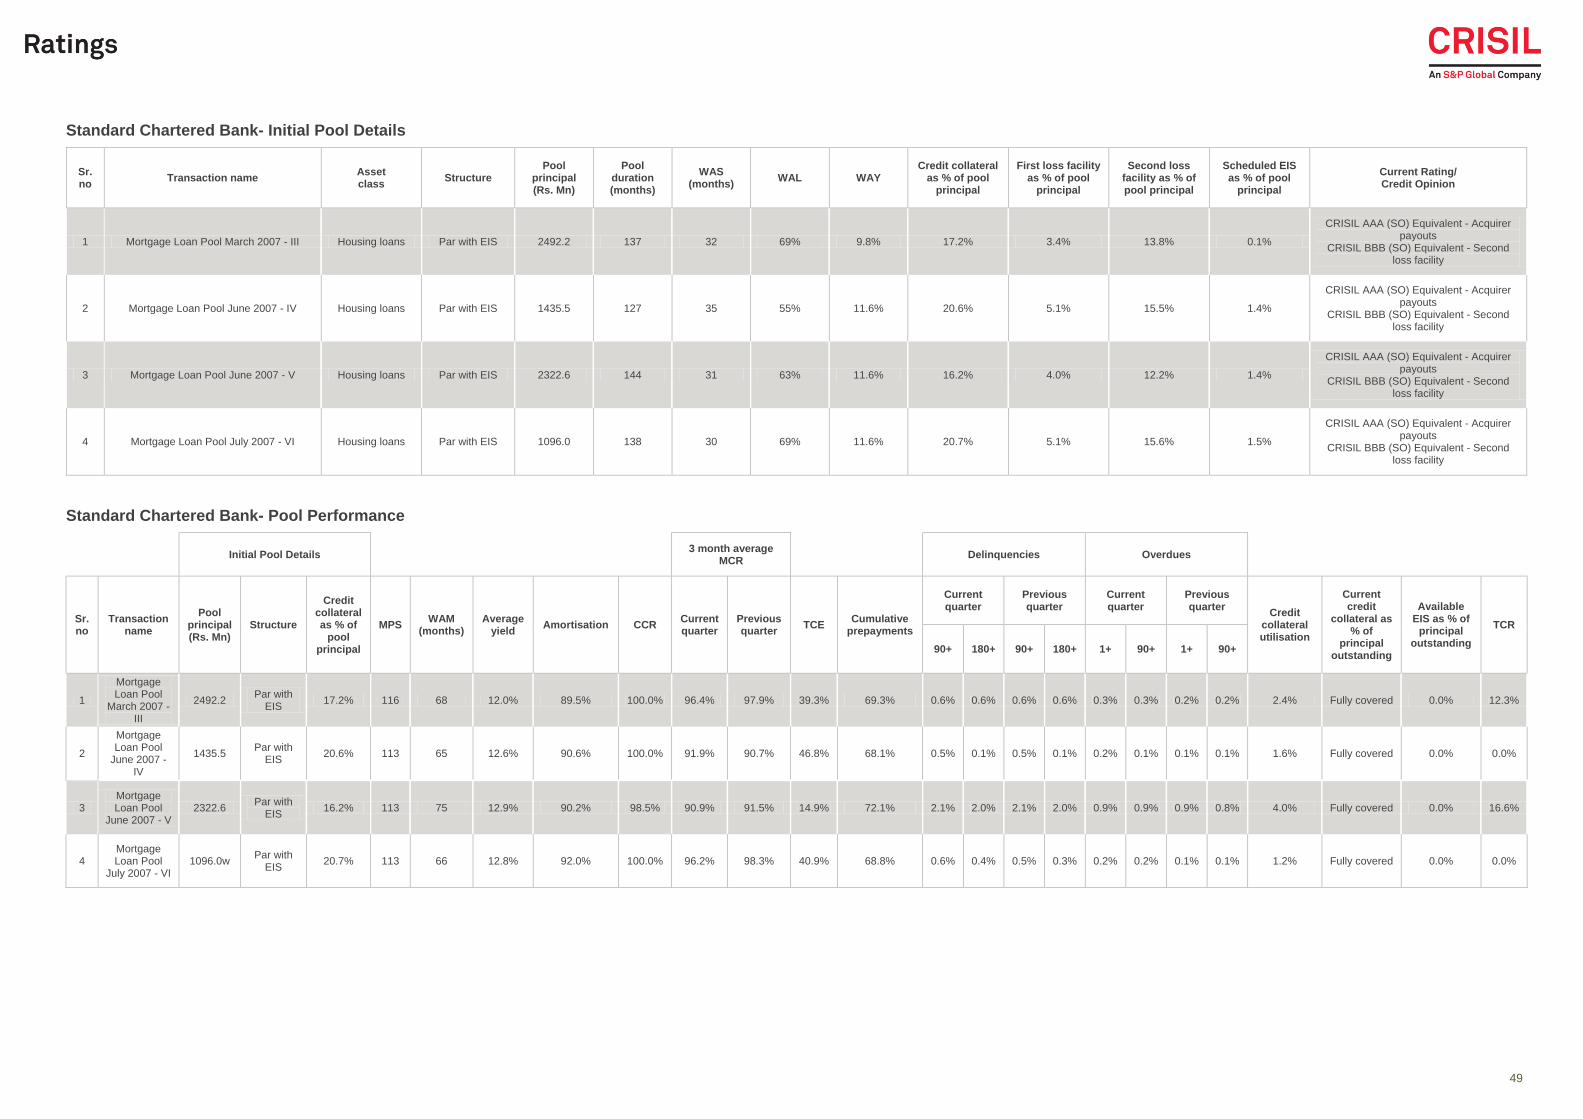
49
49
Standard Chartered Bank- Initial Pool Details
Sr. no
Transaction name Asset class
Structure Pool
principal (Rs. Mn)
Pool duration (months)
WAS (months)
WAL WAY Credit collateral
as % of pool principal
First loss facility as % of pool
principal
Second loss facility as % of pool principal
Scheduled EIS as % of pool
principal
Current Rating/ Credit Opinion
1 Mortgage Loan Pool March 2007 - III Housing loans Par with EIS 2492.2 137 32 69% 9.8% 17.2% 3.4% 13.8% 0.1%
CRISIL AAA (SO) Equivalent - Acquirer payouts
CRISIL BBB (SO) Equivalent - Second loss facility
2 Mortgage Loan Pool June 2007 - IV Housing loans Par with EIS 1435.5 127 35 55% 11.6% 20.6% 5.1% 15.5% 1.4%
CRISIL AAA (SO) Equivalent - Acquirer payouts
CRISIL BBB (SO) Equivalent - Second loss facility
3 Mortgage Loan Pool June 2007 - V Housing loans Par with EIS 2322.6 144 31 63% 11.6% 16.2% 4.0% 12.2% 1.4%
CRISIL AAA (SO) Equivalent - Acquirer payouts
CRISIL BBB (SO) Equivalent - Second loss facility
4 Mortgage Loan Pool July 2007 - VI Housing loans Par with EIS 1096.0 138 30 69% 11.6% 20.7% 5.1% 15.6% 1.5%
CRISIL AAA (SO) Equivalent - Acquirer payouts
CRISIL BBB (SO) Equivalent - Second loss facility
Standard Chartered Bank- Pool Performance
Initial Pool Details 3 month average
MCR Delinquencies Overdues
Sr. no
Transaction name
Pool principal (Rs. Mn)
Structure
Credit collateral as % of
pool principal
MPS WAM
(months) Average
yield Amortisation CCR
Current quarter
Previous quarter
TCE Cumulative
prepayments
Current quarter
Previous quarter
Current quarter
Previous quarter
Credit collateral utilisation
Current credit
collateral as % of
principal outstanding
Available EIS as % of
principal outstanding
TCR
90+ 180+ 90+ 180+ 1+ 90+ 1+ 90+
1
Mortgage Loan Pool
March 2007 - III
2492.2 Par with
EIS 17.2% 116 68 12.0% 89.5% 100.0% 96.4% 97.9% 39.3% 69.3% 0.6% 0.6% 0.6% 0.6% 0.3% 0.3% 0.2% 0.2% 2.4% Fully covered 0.0% 12.3%
2
Mortgage Loan Pool
June 2007 - IV
1435.5 Par with
EIS 20.6% 113 65 12.6% 90.6% 100.0% 91.9% 90.7% 46.8% 68.1% 0.5% 0.1% 0.5% 0.1% 0.2% 0.1% 0.1% 0.1% 1.6% Fully covered 0.0% 0.0%
3 Mortgage Loan Pool
June 2007 - V 2322.6
Par with EIS
16.2% 113 75 12.9% 90.2% 98.5% 90.9% 91.5% 14.9% 72.1% 2.1% 2.0% 2.1% 2.0% 0.9% 0.9% 0.9% 0.8% 4.0% Fully covered 0.0% 16.6%
4 Mortgage Loan Pool
July 2007 - VI 1096.0w
Par with EIS
20.7% 113 66 12.8% 92.0% 100.0% 96.2% 98.3% 40.9% 68.8% 0.6% 0.4% 0.5% 0.3% 0.2% 0.2% 0.1% 0.1% 1.2% Fully covered 0.0% 0.0%

50
50
Sundaram BNP Paribas Home Finance Limited- Initial Pool Details
Sr. no
Transaction name
Asset class
Structure Pool
principal (Rs. Mn)
Pool duration (months)
WAS (months)
WAL WAY Credit collateral
as % of pool principal
First loss facility as % of pool
principal
Second loss facility as % of pool principal
Scheduled EIS as % of pool
principal
Current Rating/ Credit Opinion
1 Santhanam Trust Series I Residential
housing loan receivables
Par with EIS 1826.1 106 27 62% 11.4% 7.0% - - 28.4% CRISIL AAA (SO) - Series A PTCs
Sundaram BNP Paribas Home Finance Limited- Pool Performance
Initial Pool Details 3 month average
MCR Delinquencies Overdues
Sr. no
Transaction name
Pool principal (Rs. Mn)
Structure
Credit collateral as % of
pool principal
MPS WAM
(months) Average
yield Amortisation CCR
Current quarter
Previous quarter
wTCE Cumulative
prepayments
Current quarter
Previous quarter
Current quarter
Previous quarter
Credit collateral utilisation
Current credit
collateral as % of
principal outstanding
Available EIS as % of
principal outstanding
TCR
90+ 180+ 90+ 180+ 1+ 90+ 1+ 90+
1 Santhanam
Trust Series I 1826.1 Par with EIS 7.0% 33 70 11.4% 41.3% 99.3% 98.8% 98.6% 91.4% 26.3% 0.2% 0.2% 0.2% 0.2% 0.1% 0.0% 0.1% 0.0% 0.0% 11.9% 21.4% 80.4%

51
CRISIL Rating Scale for Long-term Structured Finance Instruments
CRISIL AAA (SO)
(Highest Safety)
Instruments with this rating are considered to have the highest degree of safety regarding timely
servicing of financial obligations. Such instruments carry lowest credit risk.
CRISIL AA (SO)
(High Safety)
Instruments with this rating are considered to have high degree of safety regarding timely servicing of
financial obligations. Such instruments carry very low credit risk.
CRISIL A (SO)
(Adequate Safety)
Instruments with this rating are considered to have adequate degree of safety regarding timely servicing
of financial obligations. Such instruments carry low credit risk.
CRISIL BBB (SO)
(Moderate Safety)
Instruments with this rating are considered to have moderate degree of safety regarding timely servicing
of financial obligations. Such instruments carry moderate credit risk.
CRISIL BB (SO)
(Moderate Risk)
Instruments with this rating are considered to have moderate risk of default regarding timely servicing of
financial obligations.
CRISIL B (SO)
(High Risk)
Instruments with this rating are considered to have high risk of default regarding timely servicing of
financial obligations.
CRISIL C (SO)
(Very High Risk)
Instruments with this rating are considered to have very high likelihood of default regarding timely
payment of financial obligations.
CRISIL D (SO)
(Default) Instruments with this rating are in default or are expected to be in default soon.
Note:
1. CRISIL may apply '+' (plus) or '-' (minus) signs for ratings from 'CRISIL AA (SO)' to 'CRISIL C (SO)' to reflect comparative standing
within the category.
2. CRISIL may assign rating outlooks for ratings from 'CRISIL AAA (SO)' to 'CRISIL B (SO)'. Ratings on Rating Watch will not carry
outlooks. A rating outlook indicates the direction in which a rating may move over a medium-term horizon of one to two years.
A rating outlook can be 'Positive', 'Stable', or 'Negative'. A 'Positive' or 'Negative' rating outlook is not necessarily a precursor
of a rating change.
3. A suffix of 'r' indicates investments carrying non-credit risk. The 'r' suffix indicates that payments on the rated instrument have
significant risks other than credit risk. The terms of the instrument specify that the payments to investors will not be fixed, and
could be linked to one or more external variables such as commodity prices, equity indices, or foreign exchange rates. This
could result in variability in payments, including possible material loss of principal, because of adverse movement in value of
the external variables. The risk of such adverse movement in price/value is not addressed by the rating.
4. CRISIL may assign a rating of 'NM' (Not Meaningful) to instruments that have factors present in them, which render the
outstanding rating meaningless. These include reorganisation or liquidation of the issuer, the obligation being under dispute in
a court of law or before a statutory authority.
5. A prefix of 'PP-MLD' indicates that the instrument is a principal-protected market-linked debenture. The terms of such
instruments indicate that while the issuer promises to pay back the face value/principal of the instrument, the coupon rates of
these instruments will not be fixed, and could be linked to one or more external variables such as commodity prices, equity
share prices, indices, or foreign exchange rates.
6. A prefix of 'Provisional' indicates that the rating centrally factors in the completion of certain critical steps/documentation by
the issuer for the instrument, without these the rating would either have been different or not assigned ab initio.

CRISIL Performance Report
52
CRISIL Rating Scale for Short-term Structured Finance Instruments
CRISIL A1 (SO) Instruments with this rating are considered to have very strong degree of safety regarding timely
payment of financial obligation. Such instruments carry the lowest credit risk.
CRISIL A2 (SO) Instruments with this rating are considered to have strong degree of safety regarding timely payment of
financial obligation. Such instruments carry low credit risk.
CRISIL A3 (SO)
Instruments with this rating are considered to have moderate degree of safety regarding timely payment
of financial obligation. Such instruments carry higher credit risk as compared to instruments rated in the
two higher categories.
CRISIL A4 (SO) Instruments with this rating are considered to have minimal degree of safety regarding timely payment of
financial obligation. Such instruments carry very high credit risk and are susceptible to default.
CRISIL D (SO) Instruments with this rating are in default or expected to be in default on maturity.
Note:
1. CRISIL may apply '+' (plus) sign for ratings from 'CRISIL A1 (SO)' to 'CRISIL A4 (SO)' to reflect comparative standing within the
category.
2. A suffix of 'r' indicates investments carrying non-credit risk. The 'r' suffix indicates that payments on the rated instrument have
significant risks other than credit risk. The terms of the instrument specify that the payments to investors will not be fixed, and
could be linked to one or more external variables such as commodity prices, equity indices, or foreign exchange rates. This
could result in variability in payments, including possible material loss of principal, because of adverse movements in value of
the external variables. The risk of such adverse movements in price/value is not addressed by the rating.
3. CRISIL may assign a rating of 'NM' (Not Meaningful) to instruments that have factors present in them, which render the
outstanding rating meaningless. These include reorganisation or liquidation of the issuer, the obligation being under dispute in
a court of law or before a statutory authority.
4. A prefix of 'PP-MLD' indicates that the instrument is a principal-protected market-linked debenture. The terms of such
instruments indicate that while the issuer promises to pay back the face value/principal of the instrument, the coupon rates of
these instruments will not be fixed, and could be linked to one or more external variables such as commodity prices, equity
share prices, indices, or foreign exchange rates.
5. A prefix of 'Provisional' indicates that the rating centrally factors in the completion of certain critical steps/documentation by
the issuer for the instrument, without these the rating would either have been different or not assigned ab initio.

Ratings
India’s first CMBS transaction in 2014
Reset of credit enhancement post RBI guidelines in 2014
India's largest future - flow securitisation
India's first rating on an infrastructure investment trust
Auto loan securitisation in India for Citibank in 1992
Property receivables securitisation transaction in India for DLF Universal in 1992
Securitised municipal bonds programme rating in Asia
Mortgage-backed securitisation in India in 2000 for National Housing Bank
Offshore transaction backed by aircraft purchase receivables in 2001
Partial guarantee rated structure in the world for Ballarpur Industries Limited in 2002
Successful CDO transaction in India for ICICI Bank Limited in 2004
CDO transaction covering working capital facilities in the Asia Pacific and the first revolving
CDO in India for Citibank N.A. in 2004
Floating rate securitised instrument in India for Citicorp Finance India Ltd. In 2003
To publish quarterly statistics on performance of ABS pools
To publish quarterly statistics on performance of MBS pools
Dedicated legal, surveillance and criteria teams for securitisation
India's first microfinance loan receivables securitisation transaction
First multi-originator securitisation transaction
India's first capital market annuity securitisation transaction
India's first listed securitsation transaction
First INFRA EL rating under the new credit rating system for infrastructure projects 2017

About CRISIL LimitedCRISIL is a global analytical company providing ratings, research, and risk and policy advisory services. We are
India's leading ratings agency. We are also the foremost provider of high-end research to the world's largest banks
and leading corporations.
CRISIL is majority owned by S&P Global Inc., a leading provider of transparent and independent ratings,
benchmarks, analytics and data to the capital and commodity markets worldwide.
About RatingsCRISIL Ratings is India's leading rating agency. We pioneered the concept of credit rating in India in 1987. With a
tradition of independence, analytical rigour and innovation, we have a leadership position. We have
rated/assessed over 100,000 entities, by far the largest number in India. We are a full-service rating agency. We
rate the entire range of debt instruments: bank loans, certificates of deposit, commercial paper, non-convertible
debentures, bank hybrid capital instruments, asset-backed securities, mortgage-backed securities, perpetual
bonds, and partial guarantees. CRISIL sets the standards in every aspect of the credit rating business. We have
instituted several innovations in India including rating municipal bonds, partially guaranteed instruments,
microfinance institutions and voluntary organizations. We pioneered a globally unique and affordable rating
service for Small and Medium Enterprises (SMEs).This has significantly expanded the market for ratings and is
improving SMEs' access to affordable finance. We have an active outreach programme with issuers, investors and
regulators to maintain a high level of transparency regarding our rating criteria and to disseminate our analytical
insights and knowledge.
CRISIL Privacy CRISIL respects your privacy. We use your contact information, such as your name, address, and email id, to fulfil your request
and service your account and to provide you with additional information from CRISIL and other parts of S&P Global Inc. and its
subsidiaries (collectively, the “Company”) you may find of interest.
For further information, or to let us know your preferences with respect to receiving marketing materials, please visit
www.crisil.com/privacy. You can view the Company's Customer Privacy at https://www.spglobal.com/privacy
Last updated: April 2016
CRISIL Limited: CRISIL House, Central Avenue, Hiranandani Business Park, Powai, Mumbai – 400076. IndiaPhone: + 91 22 3342 3000 | Fax: + 91 22 3342 3001 | www.crisil.com
Argentina Hong Kong India Poland SingaporeChina UK USA| | | | | | |
/CRISILLimited /user/CRISILLimited @CRISILLimited/company/crisil