Embed Size (px)
Citation preview

116CBSMARCH 2016CAMAG BIBLIOGRAPHY SERVICE
WORLD LEADER IN PLANAR CHROMATOGRAPHYCA
MA
G B
IBLI
OG
RA
PHY
SER
VIC
E PL
AN
AR
CH
ROM
ATO
GR
APH
YC
BS 1
16 •
MA
RCH
201
6
For Food Analysis Explore the Advantages of Planar Chromatography
CAMAG BIBLIOGRAPHY SERVICE
No. 116, March 2016CAMAG Bibliography Service Planar Chromatography Edited by Gertrud Morlock [email protected] published by CAMAG Switzerland
CAMAG (Switzerland) Sonnenmattstrasse 11 • 4132 Muttenz Phone +41 61 4673434 • Fax +41 61 4610702 [email protected] • www.camag.com
CAMAG Scientific Inc. (USA) 515 Cornelius Harnett Drive Wilmington, NC 28401 Phone 800 334 3909 • Fax 910 343 1834 [email protected] • www.camagusa.com
IN THIS ISSUE
Procedures, applications
Determination of the hemolytic activity of saponins by an HPTLC-blood gelatin test .............. 2–4
The CAMAG TLC-MS Interface 2 in practice .................................... 5–7
Identification of herbal slimming drugs and screening for adulteration by HPTLC ........... 9–10
Determination of lactose in foodstuff ............... 11–12
Quantification of nicotine in liquids for electronic cigarettes ................. 13–15
Products featured in this issue
CAMAG TLC-MS Interface 2.............. 7
CAMAG TLC Scanner 4 ................... 16
Column: Know CAMAG
The members of the CAMAG laboratory team ................. 8
Printed on FSC paper
Planar Chromatography in Practice
Determination of the hemolytic activity of saponins by an HPTLC-blood gelatin test
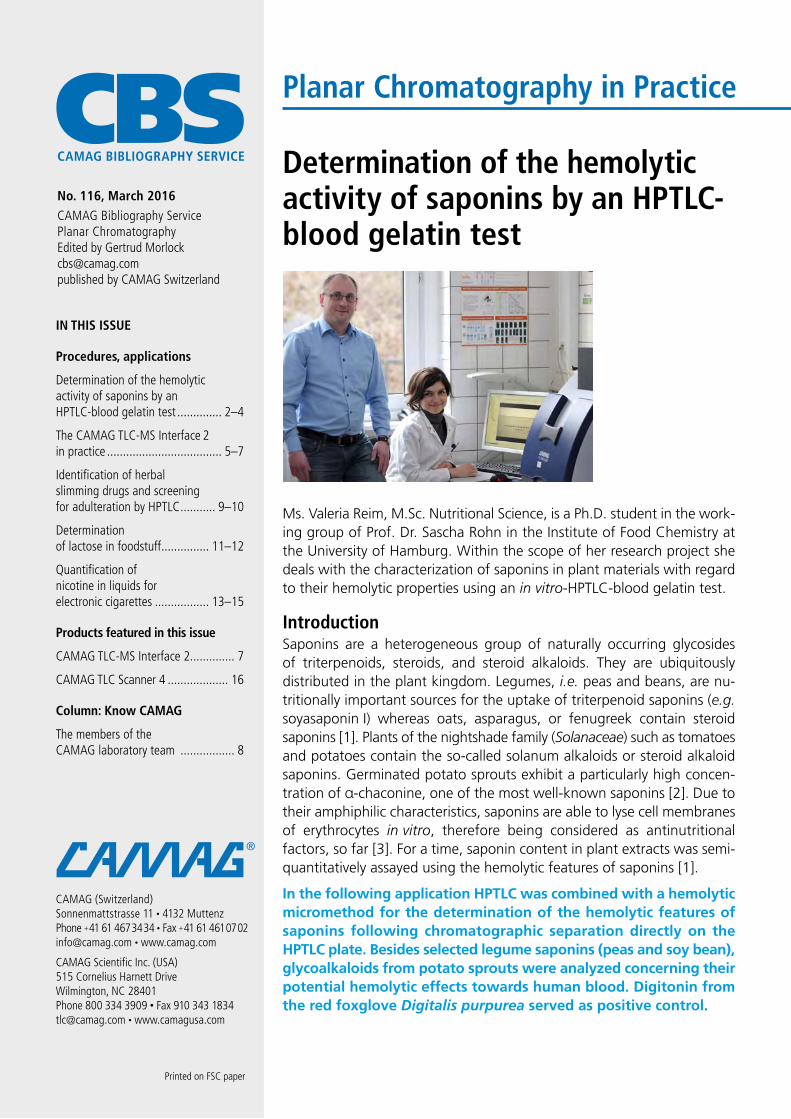
Ms. Valeria Reim, M.Sc. Nutritional Science, is a Ph.D. student in the work-ing group of Prof. Dr. Sascha Rohn in the Institute of Food Chemistry at the University of Hamburg. Within the scope of her research project she deals with the characterization of saponins in plant materials with regard to their hemolytic properties using an in vitro-HPTLC-blood gelatin test.
IntroductionSaponins are a heterogeneous group of naturally occurring glycosides of triterpenoids, steroids, and steroid alkaloids. They are ubiquitously distributed in the plant kingdom. Legumes, i.e. peas and beans, are nu-tritionally important sources for the uptake of triterpenoid saponins (e.g. soyasaponin I) whereas oats, asparagus, or fenugreek contain steroid saponins [1]. Plants of the nightshade family (Solanaceae) such as tomatoes and potatoes contain the so-called solanum alkaloids or steroid alkaloid saponins. Germinated potato sprouts exhibit a particularly high concen-tration of α-chaconine, one of the most well-known saponins [2]. Due to their amphiphilic characteristics, saponins are able to lyse cell membranes of erythrocytes in vitro, therefore being considered as antinutritional factors, so far [3]. For a time, saponin content in plant extracts was semi-quantitatively assayed using the hemolytic features of saponins [1].
In the following application HPTLC was combined with a hemolytic micromethod for the determination of the hemolytic features of saponins following chromatographic separation directly on the HPTLC plate. Besides selected legume saponins (peas and soy bean), glycoalkaloids from potato sprouts were analyzed concerning their potential hemolytic effects towards human blood. Digitonin from the red foxglove Digitalis purpurea served as positive control.

CBS 116 3
Structures of triterpenoid (soyasaponin I), steroid (digitonin) and steroid alkaloid saponins (α-chaconine)
Sample preparationSteroid alkaloid saponins from potato sprouts (freeze-dried, pulverized) were extracted with methanol in a ratio of 1:10 (w/v) under continu-ous stirring at room temperature. The supernatant was dried under a stream of nitrogen; the residue was dissolved in bi-distilled water (6 mL) and purified by solid phase extraction [SPE C18, wash-ing with water – methanol (3:2) and elution of saponins with 6 mL methanol]. Subsequently, the extracts were dried under a stream of nitrogen and dissolved in 1 mL methanol. Likewise, legume saponins were extracted from freeze-dried, ground plant material (hulls, saponin mixture from soy beans) with methanol in a ratio of 1:5 (w/v) about 4 h at 50 °C and non-saponin contents were pre- cipitated with ammonium sulfate solution (0.4 M). The extracts were dried under nitrogen flow, the residue was re-suspended in bi-distilled water (6 mL) and further purified by SPE (elution with aqueous methanol solutions with increasing con-centrations of 40–100 %, alkalized with 0.017 % aqueous ammonia solution). The saponin-rich fractions (60 % MeOH) were evaporated to dryness and dissolved in 0.25 mL MeOH (60 %, alkalized).
Standard solutions Ethanolic solutions of digitonin within a concen-tration range of 0.4–4.0 mg/mL, soyasaponin I (≥ 95 %) and a saponin mixture from soy beans at 1 mg/mL, respectively.
Chromatogram layerHPTLC plates silica gel 60 F254 (Merck), 20 x 10 cm
Sample applicationBandwise with Automatic TLC Sampler (ATS 4), max. 20 tracks, band length 7 or 8 mm, distance from left edge 9 or 10 mm, distance from the lower edge 10 mm, application volume between 10 and 20 µL for sample and standard solutions. Identical application on each half of the plate.
ChromatographyIn the Twin Trough Chamber 20 x 10 cm with chamber saturation (without filter paper) for 30 min, with chloroform – methanol – water 6:4:0.9 to a migration distance of 70 mm, air-drying for 1 h at room temperature, cutting the plates into halves with the smartCut
Post-chromatographic derivatizationVisualization of the bands by dipping one half of the plate in p-anisaldehyde-sulphuric acid reagent, immersion time 3 s, air-drying for 10 min, heating for 5 min at 70 °C
Blood-gelatin testFixation of the zones (2nd plate half) by immers-ing in 0.5 % polyisobutylmethacrylate solution (in n-hexan – chloroform 20:1) for 10 s; coating the plate with 40 mL blood-gelatin [2 % gelatin (w/v) in PBS buffer (pH 7.4) with 3 % human blood preserva-tion] in a petri dish and storage for 12–48 h at 4 °C
DocumentationTLC Visualizer under UV 366 nm and white light
Results and discussionAs saponins do not possess strong chromophores they are only detectable after post-chromatographic derivatization with p-anisaldehyde-sulphuric acid reagent under UV 366 nm and white light, cor-
1
Soyasaponin I
Digitonin
α-Chaconine

4 CBS 116
2
Chromatogram under UV 366 nm and white light after derivatization with p-anisaldehyde-sulphuric acid (D: digitonin, ES1-ES6: pea hulls, KS: potato sprouts, SSI: soyasaponin I standard, S: saponin mixture from soy beans)
One of the crucial biological features of saponins is their ability to lyse cell membranes of erythrocytes, which was detected by a modified microhemolytic method in this case [1]. Exclusively, digitonin and α-chaconine from potato sprouts known to lyse epithelial and red blood cells show-ed hemolytic zones as expected [4–6]. For a semi-quan-titative evaluation of the hemolytic action digitonin was applied in various concentrations. The hemolytic activity of α-chaconine from an extract made of potato sprouts was comparable with the effect of 16–20 µg digitonin. About 2–5 mg potato alkaloids per kilogram body weight proved to be acutely toxic and the minimum lethal dose amounts are 3–6 mg/kg body weight [2]. Therefore, intoxications to humans resulting from oral administration of glycoalkalo-ids are rare. In contrast to the studied steroid and steroid alkaloid compounds, the saponins from peas showed no hemolytic effects in vitro. When using prolonged incuba-tion of about 48 h, negative results remained, while the bands produced by digitonin became more intense [6]. Hence, relating to the hemolytic aspect of soyasaponins, legumes and legumes-based products can be consumed without hesitation.
Aside from the easy handling, a particular benefit of the presented HPTLC-blood-gelatin screening is the assignment of detected he-molytic zones to single compounds directly on the plate. Known or new saponin com-pounds can be evaluated concerning their bioactivity. Moreover, a semi-quantitative evaluation of the hemolytic features is ensu-red using appropriate standard compounds. This technology is extremely useful by giving valuable insights regarding the anti-nutritive status of saponin-rich extracts or foodstuffs, at least in vitro.
Further information is available on request from the authors.[1] W. A. Oleszek, Saponins In: Natural Food Anti- microbial Systems, CRC Press (2000) 295
[2] C. Weiss, Ernährungs-Umschau 54 (2007) 474
[3] G. Francis et al., Brit J Nutr 88 (2002) 587
[4] E. A. J. Keukens et al., Biochim Biophys Acta 1279 (1996) 243
[5] E. A. J. Keukens et al., Biochim Biophys Acta 1240 (1995) 216
[6] O. P. Sharma et al., Food Chem 132 (2012) 671
Contact: Prof. Dr. Sascha Rohn and Valeria Reim, University of Hamburg, Institute of Food Chemistry, Grindelallee 117, 20146 Hamburg, [email protected] hamburg.de, [email protected]
Hemolytic zones at white light: sample extracts (top) and digitonin concentration range (bottom, 4–40 µg/zone; outlier at 20 µg/zone; 2 zones, because a mixture of mainly digitonin and digalonin.
3
4
respondingly. Under the influence of ultraviolet light, the steroid alkaloid saponin α-chaconine in potatoe sprouts occurred purplish-blue and the steroid saponin digitonin appeared yellowish green. With regard to the saponins from pea hulls, the 2,3-dihydro-2,5-dihydroxy-6-methyl-4H-pyran-4-one saponin showed a violet-blue dye whereas soya- saponin I as well as the saponin mixture from soy beans and the soyasaponin I standard were stained in orange. Visualization under white light revealed a brownish colored α-chaconine, while digitonin being racemic occurred as yellow spot. In contrast, saponins from peas and soy beans were all recorded as violet bands.
a-Chaconinea-Chaconine

CBS 116 5
Planar Chromatography in Practice
The CAMAG TLC-MS Interface 2 in practice
François Bretin and Dr. Francis Maquin (right)
The Lead Generation to Candidate Realization (LGCR) platform of Sanofi identifies small molecule leads and progresses them up to registration. Dr. Francis Maquin and Mr. François Bretin are mem-bers of the R&D department at LGCR Analytical Sciences (AnSci), which is dedicated to supporting their Business Divisions and Therapeutics Units. Hav-ing introduced TLC-MS technology in 2009, Sanofi has now acquired one of the first instruments of the second generation in 2015 and has extensively tested the device.
IntroductionTLC-MS is complementary to HPLC-MS and is widely used as a rapid and reliable method for compound confirmation during chemical synthesis.
TLC-MS is especially used when compounds remain on the column due to high polarity or weak solubility or when analyte detection is poor (no chromophore). Thanks to significantly facilitated cleaning features, the TLC-MS Inter-face 2 can be used for several weeks without any maintenance.
The set-up is augmented by an MS software con-trolled valve, adding automation to the process and by an Evaporative Light Scattering Detector (ELSD). The latter enables the analyst to distinguish between compounds that were not eluted from the plate from those that were not sufficiently ionized for MS detection.
Chromatogram layerTLC and HPTLC plates silica gel 60 F254 (Merck), 20 × 10 cm. If necessary the plate size was reduced with the smartCut.
Sample preparationSample was collected at different stages of the or-ganic synthesis and diluted with an appropriate sol-vent (e.g. methanol, dimethyl sulfoxide, chloroform).
Sample applicationManually with disposable micropipettes of 5 to 20 µL volumesEditor’s Note: The Nanomat 4 is recommended to ensure precise positioning without damage to the layer. Especially for polar extracts, small volumes should be applied (<2 µL to obtain sharp start zones). For a fully-automated and band-wise application the ATS 4 is recommended.
ChromatographyIn a twin through chamber, e.g., with mixtures of methanol and dichloromethane – ethyl acetate, or ethyl acetate and heptane – cyclohexane; the ratios depend on the compound mixtures
DerivatizationCompounds with neither UV/Vis-activity nor native fluorescence can be derivatized by non-destructive derivatization reagents, e.g., the primuline or berberine reagents for lipophilic compounds, and directly eluted with the TLC-MS Interface 2 into the MS. However, for destructive derivatizations, e.g., based on strong acidic carbonization reactions, on both plate sides, the outer track was cut, de-rivatized, and the respective bands were marked by extrapolation.
Recording of MS spectraThe flow rate of the eluent (methanol – water 19:1, 0.35 mL/min) was split by a tee, and 0.15 mL/min were pumped to the MS (Micromass ZQ, Waters) and 0.20 mL/min to the ELSD (Sedere Sedex 85 LT). The TLC-MS Interface 2 was equipped with an oval elution head. The recording of mass spectra was performed in the positive/negative electrospray mode. For evaluation, the MS software (Mass Lynx V4.0/Open Lynx, Waters) was used.

6 CBS 116
2
1
Typical chronogram and TLC-MS spectrum
TLC/HPTLC-ELSD-MS system configuration
Tee to split the eluent for two detection modes (MS and ELSD)
3

CBS 116 7
Results and discussionFrom May 2015 to the end of October 2015, the TLC-MS Interface 2 was heavily used without the need for maintenance. We were highly impressed by its performance, as on average 200 elutions were done each month. Compared to the previous ver-sion, major improvements were made in cleaning, i.e. the elution path is cleaned of matrix particles with compressed air, preventing the system from becoming blocked. An easily accessible filter has been placed in front of the valve, whereas the pre-vious version had a frit inside the elution head. As shown in the image below, the results obtained with the TLC-MS Interface 2 are as satisfactory as with the previous version. We can highly recommend the TLC-MS Interface 2 which allowed us to elute hundreds of zones without any interruption.
Further information is available on request from the authors.
Contacts:
• Dr. Francis Maquin and Mr. François Bretin, Sanofi-Aventis, Centre de Recherche, 13, quai Jules Guesde, 94403 Vitry-sur- Seine cedex, France, [email protected]
• Mr. Pierre Bernard-Savary, Chromacim SAS, Pommiers la Placette, France
• Mrs. Véronique de Nailly, BCP Instruments, Irigny, France
A filter is located inline instead of a frit in the elution head
CAMAG TLC-MS Interface 2The CAMAG TLC-MS Interface 2 is the second generation of our module for the pioneering concept of hyphenating HPTLC with mass spectrometry. Plate positioning is significantly simplified. The elution head has been modified and an easily accessible, exchangeable filter has been arranged in front of the valve.
Cleaning is facilitated as compared to the previous version, making it highly efficient. By pushing a button, the elution path is cleaned of matrix particles with compressed air, increasing the lifetime of the filter and preventing the system from becoming blocked. Filters are separately available and can be easily replaced without any modification to the elu-tion head.
The CAMAG TLC-MS Interface 2 allows for rapid and contamination-free elution of TLC/HPTLC zones with online transfer to a mass spectrometer. The TLC-MS Interface 2 can be installed plug & play in almost any LC-MS system without adjustments or mass spec-trometer modifications. Depending on the MS system, the presence of a substance can be confirmed via its mass spectrum, or for an un-known substance, the respective sum formula can be obtained within a minute.
4
5

8 CBS 116
Know CAMAG
The members of the CAMAG laboratory team: HPTLC solutions for your analytical problem!
The members of the CAMAG laboratory team are experienced scientists and technicians dedicated to analytical excellence. They are focused on the advancement of HPTLC as an analytical tool and offer training, application support and feasibility studies to customers worldwide. In many cases HPTLC can be a powerful, pragmatic and cost-efficient solution to an analytical question. We are very proud to introduce below two ladies who have joined the team recently.
Tiên Do joined the team in July of 2014. She holds a master’s degree in chemistry (cosmetic formulations, analytics, and quality management) and is currently finishing her PhD thesis (“Evaluation of HPTLC in the analysis of natural extracts”) at the University of Nice. She brings experi-ence in applying different chromatographic techniques and problem solv-ing skills to work in interdisciplinary teams. As scientific support specialist Ms. Do provides training and seminars, and develops HPTLC methods in various field of application. Her outgoing personality, generalist’s perspec-tive, and ability to think out of the box when approaching an analytical problem are appreciated by customers all over the world.
Ilona Trettin, a chemical-technical and pharmaceutical-technical as-sistant by training, has practical experience with planar chromatography for more than 20 years, the last 12 of which working in a strictly regu-lated environment. Joining the team in October of 2014, she comple-ments the existing expertise in the field of HPTLC for quality control of herbal materials. Aside of her responsibility for the experimental section of the new modular in-house HPTLC courses, which are offered several times per year in Muttenz, Ms. Trettin has taken over method development as part of collaborative projects with the European and US Pharmacopoeia.
From left: Valeria Maire-Widmer (Information Management), Dr. Eike Reich (Head of Laboratory), Ilona Trettin (Application Specialist), Débora Frommenwiler (Scientist, M.Sc.), Eliezer Ceniviva (Application Specialist); Tiên Do (Scientific Support Specialist, M.Sc.)

CAMAG BIBLIOGRAPHY SERVICE116CBS
MARCH 2016
CAMAG LITERATURDIENSTCAMAG BIBLIOGRAPHY SERVICE PLANAR CHROMATOGRAPHY
The abstracts added to this CBS issue cover as usual a broad range of applications. Included also is a thorough review on instrument platforms for TLC/HPTLC (J. Chromatogr. A 1421, 2015, 184–202) presenting a good survey on the current state-of- the-art. Although there is still room for further improvement with regard to miniaturization, the available instrumentation for HPTLC allows a re-producible planar separation either in a standar-dized or a completely flexible mode of operation.
Some of the included abstracts refer to papers reporting the application of TLC-bioautography. Examples are “A new TLC bioautographic assay for qualitative and quantitative estimation of lipase in-hibitors” (Phytochem. Anal. 27, 2015, 5–12) and “The use of the DPPH radical reagent for the detec-tion of radical-scavengers” (J. Planar Chromatogr. 28, 2015, 443–447). Strictly speaking the term bioautography should only be used when biolo-gical detection methods are used that involve at least living organelles or cells. The investigation of enzyme inhibitions and the use of the DPPH ra-dical reagent are something of a quite different nature. Even though the current literature does not make a clear distinction between the two ap-proaches and reviewers and editors – as a last in-stance – do not seem to enforce it. The inclusive term “TLC/HPTLC with effect-directed detection” might be more suitable to describe this broad and still growing field of planar chromatographic research. However be aware that the term “effect- directed analysis” comprises not only effect-direct- ed detections in TLC/HPTLC but also micro-titer plate or cuvette assays.
Dear friends
The current CBS issue puts its focus on food analysis. Anchrom, the Indian distrib- utor of CAMAG products for more than 30 years, made a contribution on herbal slim-ming drugs in India and their potential adulteration. Other articles deal with the quantifi-cation of nicotine in liquids for electronic cigarettes, the simple analysis of lactose in food or the deter-mination of the hemolytic activity of saponins in potato sprouts, pea hulls and soy beans by a HPTLC blood gelatin test.
In addition, the R&D Group at Sanofi, after six success- ful years using the first generation TLC-MS Interface, reports on an application that demonstrates their experience with the new TLC-MS Interface 2.
In every CBS issue we present several applications: Planar Chromatography in Practice. We would very much appreciate feedback from you, dear CBS readers, whether the one or the other of these have prompted you to use this method in your lab or at least consider it. Please communicate your opinion via [email protected]. Thank you in advance.
Insight into all current TLC/HPTLC instrumentation can be accessed by visiting Pittcon 2016, 6–10 March, Atlanta, USA or Analytica 2016, 10–13 May, Munich, Germany or Ilmac 2016, 20–23 September, Basel, Switzerland. Reserve already now the date for the next HPTLC symposium in Berlin on July 5th–7th, 2017.
Kind regards
Gertrud Morlock [email protected]

1. Reviews and books a) Books on TLC b) Books containing one or several chapters on TLC c) Books containing frequent TLC information spread over several chapters of other information
2. Fundamentals, theory and general a) General b) Thermodynamics and theoretical relationship c) Relationship between structure and chrom. behaviour d) Measurement of physico-chemical and related values e) Optimization of solvent systems f) Validation of methods
3. General techniques (unless they are restricted to the application within one or two classification sections) a) New apparatus/techniques for sample preparation b) Separation material c) New apparatus for sample application/dosage d) New apparatus/techniques for chromatogram development e) New apparatus/techniques for pre- or post- chromatographic derivatization f) New apparatus/techniques for quantitative evaluation g) New apparatus/techniques for other TLC steps (distinguished from section 4)
4. Special techniques a) Automation of sample preparation/application b) Automation of complex chromatogram developing techniques c) Automation, computer application in quantitative chromatogram evaluation d) Combination of TLC with other chromatographic techniques e) Combination of TLC with other (non-chromatogra- phic) techniques...MS, IR...etc.
5. Hydrocarbons and halogen derivatives a) Aliphatic hydrocarbons b) Cyclic hydrocarbons c) Halogen derivatives d) Complex hydrocarbon mixtures
6. Alcohols
7. Phenols
8. Substances containing heterocyclic oxygen a) Flavonoids b) Other compounds with heterocyclic oxygen
9. Oxo compounds, ethers and epoxides
10. Carbohydrates a) Mono- and oligosaccharides, structural studies b) Polysaccharides, mucopolysaccharides, lipopolysaccharides
11. Organic acids and lipids a) Organic acids and simple esters b) Prostaglandins c) Lipids and their constituents d) Lipoproteins and their constituents e) Glycosphingolipids (gangliosides, sulfatides, neutral glycosphingolipids)
12. Organic peroxides
13. Steroids a) Pregnane and androstane derivatives b) Estrogens c) Sterols d) Bile acids and alcohols e) Ecdysones and other insect steroid hormones
14. Steroid glycosides, saponins and other terpenoid glycosides
15. Terpenes and other volatile plant ingredients a) Terpenes b) Essential oils
16. Nitro and nitroso compounds
17. Amines, amides and related nitrogen compounds a) Amines and polyamines b) Catecholamines and their metabolites c) Amino derivatives and amides (excluding peptides)
18. Amino acids and peptides, chemical structure of proteins a) Amino acids and their derivatives b) Peptides and peptidic proteinous hormones
19. Proteins
20. Enzymes
21. Purines, pyrimidines, nucleic acids and their constituents a) Purines, pyrimidines, nucleosides, nucleotides b) Nucleic acids, RNA, DNA
22. Alkaloids
23. Other substances containing heterocyclic nitrogen a) Porphyrins and other pyrroles b) Bile pigments c) Indole derivatives d) Pyridine derivatives e) other N-heterocyclic compounds
24. Organic sulfur compounds
25. Organic phosphorus compounds (other than phospholipids)
26. Organometallic and related compounds a) Organometallic compounds b) Boranes, silanes and related non-metallic compounds c) Coordination compounds
27. Vitamins and various growth regulators (non-peptidic)
28. Antibiotics, Mycotoxins a) Antibiotics b) Aflatoxins and other mycotoxins
29. Pesticides and other agrochemicals a) Chlorinated insecticides b) Phosphorus insecticides c) Carbamates d) Herbicides e) Fungicides f) Other types of pesticides and various agrochemicals
30. Synthetic and natural dyes a) Synthetic dyes b) Chloroplasts and other natural pigments
31. Plastics and their intermediates
32. Pharmaceutical and biomedical applications a) Synthetic drugs b) Pharmacokinetic studies c) Drug monitoring d) Toxicological applications e) Plant extracts, herbal and traditional medicines f) Clinico-chemical applications and profiling body fluids
33. Inorganic substances a) Cations b) Anions
34. Radioactive and other isotopic compounds
35. Other technical products and complex mixtures a) Surfactants b) Antioxidants and preservatives c) Various specific technical products d) Complex mixtures and non-identified compounds
36. Thin-layer electrophoresis
37. Environmental analysis a) General papers b) Air pollution c) Water pollution d) Soil pollution
38. Chiral separations
THE CBS CLASSIFICATION SYSTEM

By using the cart icon you can create your individual selection of abstracts throughout CCBS search and export to PDF.
Search by CBS edition: Select a CBS edition and retrieve all abstracts published in thisCBS issue. With this search you can get all abstracts of one CBS issue – similarly to the former printed yellow pages.
Alphabetical search: select an initial character and browse associated keywords
Cumulative CAMAG Bibliography Service (CCBS) Online Search
Browse and search by CBS classification: Select one of the 38 CBS classification categories and search by keyword
Full text search: Enter a keyword, e.g. a substance name, a sub- stance class, a technique, a reagent, or an author’s name
With the Cumulative CAMAG Bibliography Service (CCBS) Online Search, you can directly search for information within the CAMAG website. The CCBS covers more than 11’000 abstracts of TLC/HPTLC publications between 1982 and today. Providing reports was established by Dr. Dieter Jänchen in 1965 and the workflow and form evolved over the years. Manually written and transferred into the printed CBS form, it was set-up as a database in 1997. With CBS 93 in 2004, the electronic database for download was introduced and with the CBS 113 in 2014, the online search.
The database covers most relevant scientific journals in the field of Planar Chromatography including also various non-English publications in German, French, Spanish, Portuguese and Chinese. The CCBS features additional practical information for the analyst in the lab, for example details on the mobile phase or the detection. With CCBS the analyst is able to find relevant TLC/HPTLC publications which might be helpful for solving a particular analytical question.
Visit www.camag.com/ccbs and choose one of the following search options: full text search or search by CBS classification system or by alphabeti-cal register or by CBS edition. For classical full text search, just enter a keyword in the search box, e.g., a substance name, a substance class, an analytical technique, a reagent, or an author’s name, and find all related publications throughout the CCBS.
Alternatively, you can choose to browse by one of the 38 CBS classification categories and search by keyword. The alphabetical search allows select-ing an initial character and browsing associated keywords. When browsing by CBS edition, you can retrieve all abstracts published in the corresponding CBS issue, formerly printed as yellow pages.
To create your individual selection of TLC/HPTLC abstracts add your preferred publications to the PDF cart and download these selected articles in one single PDF file.

CAMAG application tutorials
To illustrate the unique characteristics of high-performance thin-layer chromatography and to better support our customers in answering their analytical questions, we have recently started creating case studies that include tutorial videos for various HPTLC application fields.
These complementary videos visualize the practical steps of each HPTLC case study and present the required CAMAG instruments for performing the respective standardized method. All steps, including sample preparation, are shown. Go to www.camag.com/applicationfields, choose the preferred field of application and select a case study from the upper box on the right side. The following videos are already on our website:
Herbal medicines and botanical dietary supplements
• Quantification of ginkgolides A, B, C and bilobalide in Ginkgo biloba by HPTLC
• HPTLC-Fingerprint of Ginkgo biloba flavonoids
Food and feed stuff
• Quantitative determination of steviol glycosides
• Identification of fixed oils by HPTLC
Industrial applications
• Determination of monoacylglycerides in biodiesel
Forensics
• In-process control during chemical synthesis of ergoline psychedelics by HPTLC

CBS 116 9
Planar Chromatography in Practice
Identification of herbal slimming drugs and screening for adulteration by HPTLC
Chromatogram layerHPTLC plates silica gel 60 F254, 20 × 10 cm
Standard solutions10 mg of orlistat dissolved with 10 mL acetone – methanol 2:3
Sample preparation500 mg of each powdered herbal sample was mixed with 10 mL acetone – methanol 2:3 and sonicated for 15 min. After centrifugation the supernatant was used for application.
Sample applicationBandwise with Linomat 5, 15 tracks, band length 8 mm, track distance 11.4 mm, distance from left edge 20 mm, distance from lower edge 8 mm, ap-plication volume 10 –20 µL for sample solutions and 5 –10 µL for standard solutions
ChromatographyIn the Automatic Developing Chamber 2 (ADC 2) with chamber saturation (with filter paper) for 20 min and after conditioning at 47 % relative humidity using a saturated potassium thiocyanate solution, development with toluene – ethyl acetate 4:1 to the migration distance of 70 mm (from the lower edge), drying for 5 min.
HPTLC offers a fast way for identity testing of herbal slimming drugs and to check for adulteration. Herein, a combined methodology is proposed. The presence of orlistat can be determined prior derivatization by scanning densitometry and the identity can be confir-med by HPTLC fingerprint after derivatization.
Anchrom has been CAMAG’s distributor in India for more than 30 years. Mr. Thite runs Anchrom’s well-equipped laboratory, established in Mumbai in 1989 with a team of experienced application specialists. His son, a medical doctor, came up with the idea to develop new HPTLC methods for identification and screening of herbal slimming drugs described here.
IntroductionWorldwide obesity has more than doubled since 1980. It substantially raises the risk for noncom-municable diseases such as cardiovascular diseases, diabetes, musculoskeletal disorders, and some cancers [1]. Medications available for weight loss are pharmacological agents that either reduce ap-petite or the resorption of food. In the United States one of the anti-obesity medications is orlistat, which has been approved by the FDA for long term use. It reduces intestinal fat absorption by inhibiting pan-creatic lipase. Recently some herbal slimming drugs for weight reduction were commercially promoted, creating a concern in medical and scientific circles that there was a need to analyze samples of these drugs for synthetic drug adulteration. The draft USP chapter <2251> is specifically written for adulteration of dietary supplements (equivalent to herbal drugs) with drugs and drug analogs (for weight loss, sexual enhancement or sport performance enhancement).
From left: (back row) Kiran Dodtale, Shahrukh Bharucha, Dr. Sharad Medhe, Dr. Karuppiah Jayachandran, (front row) Prashant Hande, Tukaram Thite
1
Structure of orlistat

10 CBS 116
3
Further information is available on request from the authors.
[1] WHO, Fact sheet No. 311, Obesity and overweight,http://www.who.int/mediacentre/factsheets/fs311/en/
Contact: Dr. Sharad Medhe, Anchrom Testlab Pvt. Ltd., A-101, Shree Aniket Apt. Navghar Road, 400 081, Mulund (E) Mumbai, India, [email protected]
Anchrom and CAMAG will help interested parties to establish this method as a routine procedure for the screening of slimming drugs in herbal mixtures.
trum scan can be used to test for adulteration with orlistat. If illegally added Orlistat is found, HPTLC-MS can be used for further confirmation.
HPTLC is suitable for screening of a large number of samples. After derivatization, the HPTLC fingerprint can be used for further confirmation of orlistat and for comparing different herbal samples side by side.
To reach a low limit of detection (LOD), a high sample load can be applied on the HPTLC plate (e.g. 1 mg sample per 20 µL volume). As the LOD of the Orlistat standard is 70 ng/band, the LOD of the method is calculated to be 70 mg/kg. The normal dose prescribed for orlistat is 120 mg. Tablets usu-ally weigh 1 g, while the recommended dose for powders is on average 4 g. Considering that about 12 % of orlistat were expected to be present in pills and about 3 % in powder samples, the method should be suitable for adulteration detection. In the case a zone is present at the same hRF, a spec-
Densitogram of different herbal samples (green and blue) and the orlistat standard (red, 10 µg/band)
Post-chromatographic derivatizationThe plate was immersed into the phosphomolybdic acid reagent (10 g in 200 mL ethanol) using the Chromatogram Immersion Device, immersion time 3 s and immersion speed 3 cm/s and heating at 110 °C for 5 min using the TLC Plate Heater.
DocumentationWith TLC Visualizer at 254 nm, 366 nm and white light illumination
DensitometryTLC Scanner 4 and winCATS, absorption measure-ment at 195 nm, slit dimension 6.0 x 0.3 mm, scan speed 20 mm/s, spectra recording from 190 to 400 nm
Results and discussionThis method is well-suited for analysis of orlistat in herbal drugs, sold in tablet or powder form. The presence or absence of orlistat can be tested by scanning densitometry prior to derivatization.
HPTLC chromatogram under white light after derivatization with phosphomolybdic acid (samples U1–U5, orlistat standard S (10 µg/band) as white zone at hRF 40)
Editor's note: The derivatization shown can be substituted by more appropriate reagents.
2
Orlistat substance window{

CBS 116 11
Planar Chromatography in Practice
From left: Hans Griesinger, Michael Schulz, Markus Burholt, Vanessa Pilakowski, Michaela Oberle
Determination of lactose in foodstuff
TLC/HPTLC coupled with mass spectrometry has a wide range of application fields. Michael Schulz’s group from Merck in Darmstadt develops new chromatographic layers for TLC and HPTLC. They also explore new fields of application for use with these and other techniques.
IntroductionToday food intolerances play an important role in our society, affecting the daily lives of many people. For example, a significant number of people are lactose intolerant, usually more in Asian countries than in Europe or North America. Foodstuff with a lactose content less than 100 mg/100 g can be labeled as “lactose-free”, but currently no official limit has been established in Europe. Traditionally, analysis is done by HPLC, photometry or by an enzymatic test kit [1].
HPTLC offers an advantageous option for de-termination of lactose in high-matrix samples. A very easy and sensitive method was recently published [2]. As shown in this article, diffe-rent food samples like milk and yoghurt can be applied on the HPTLC plate without a complex sample preparation. Lactose can be quantified by image evaluation with the help of the TLC
Visualizer and visionCATS. Afterwards the corresponding lactose zones can be eluted with the TLC-MS interface and detected by mass spectrometry.
Chromatogram layerHPTLC plates silica gel 60 F254 MS-grade (Merck), 20 × 10 cm
Standard solutionsLactose in water (0.1 and 1 mg/mL)
Sample preparationMilk was centrifuged for 5 min and the supernatant centrifuged again for 5 min. 1 mL was diluted in 50 mL water. 1 g yoghurt was dissolved in 10 mL water and centrifuged for 5 min. An instant sauce was cooked as directed. 1 g sauce was mixed with 10 mL water and centrifuged for 5 min.
Sample applicationBandwise with Automatic TLC Sampler (ATS 4), band length 6 mm, track distance 8.9 mm, distance from left edge 15 mm, distance from lower edge 10 mm, application volume between 0.3 and 2.0 µL/zone (samples) and between 0.1 and 4.0 µL/zone (standards)
ChromatographyIn the Flat Bottom Chamber 20 × 10 cm with ace-tonitrile – water 3:1 (with 0.1 % trifluoroacetic acid) to the migration distance of 5 cm
Post-chromatographic derivatization Spraying onto the HPTLC plate with aniline-di- phenylamine-phosphoric acid reagent (2 g diphenyl- amine and 2 mL aniline in 80 mL methanol, 10 mL of o-phosphoric acid 85 %, filled up to 100 mL) and heating on the TLC Plate Heater for 10 min at 120 °CEditor’s note: For quantification, a homogeneous application of the derivatization reagent is recommended. Automated immersion is better suited than manual spraying.

12 CBS 116
Documentation and digital evaluationWith the TLC Visualizer and visionCATS software under white light
Mass spectrometryElution of zones with TLC-MS Interface into an ESI-MS with acetonitrile – water 19:1 (with 0.1 % formic acid) and detected in positive ionization mode
Results and discussionA representative densitogram of a yoghurt sample is shown. Lactose (2) shows the same hRF values for the samples as for the standards and is well separated from matrix components (3).
The lactose content was determined by image evaluation with the help of the TLC Visualizer and visionCATS. Calibration was done in a range of 0.01 – 4 µg/zone.
Determined lactose content (g/100 g)
Organic fresh milk 4.7
UHT milk 4.4
Lactose free UHT milk < 0.01
Instant sauce 1.6
Yoghurt 5.5
Densitogram of yoghurt sample
1
2
The mass spectrum shows as mass signals of lactose (342 g/mol) the corresponding sodium adduct (m/z 365) as well as the solvent adduct (m/z 406). A semi-quantitative determination of lactose by image evaluation is fast and reliable. With this method lactose-free products can be confirmed as such.
Further information is available on request from the authors.
[1] L. Frank et al. GIT-Labor 15.01.2014
[2] G.E. Morlock, L.P. Morlock, C. Lemo, J Chromatogr A 1324 (2014) 215–223
Contact: Michael Schulz, Merck KGaA, Frankfurter Str. 250, 64293 Darmstadt, [email protected]
Mass spectrum of the lactose zone in a yoghurt sample
3
The left side of the plate was derivatized with aniline-diphenylamine-phosphoric acid reagent for localizing the zones on the right side of the plate (covered during spraying). The non-derivatized zones were eluted into the mass spectrometer.
Editor’s note: It is an option one should consider to cut the developed plate with the smartCut and then derivatize one half of the plate.
Sig
nal
inte
nsi
tySi
gn
al in
ten
sity
Ab
sorb
ance
[AU
]
Calibration curve: green standard levels, blue samples
CBS 116 13
CAMAG Laboratory: Method Development in Practice
Quantification of nicotine in liquids for electronic cigarettes
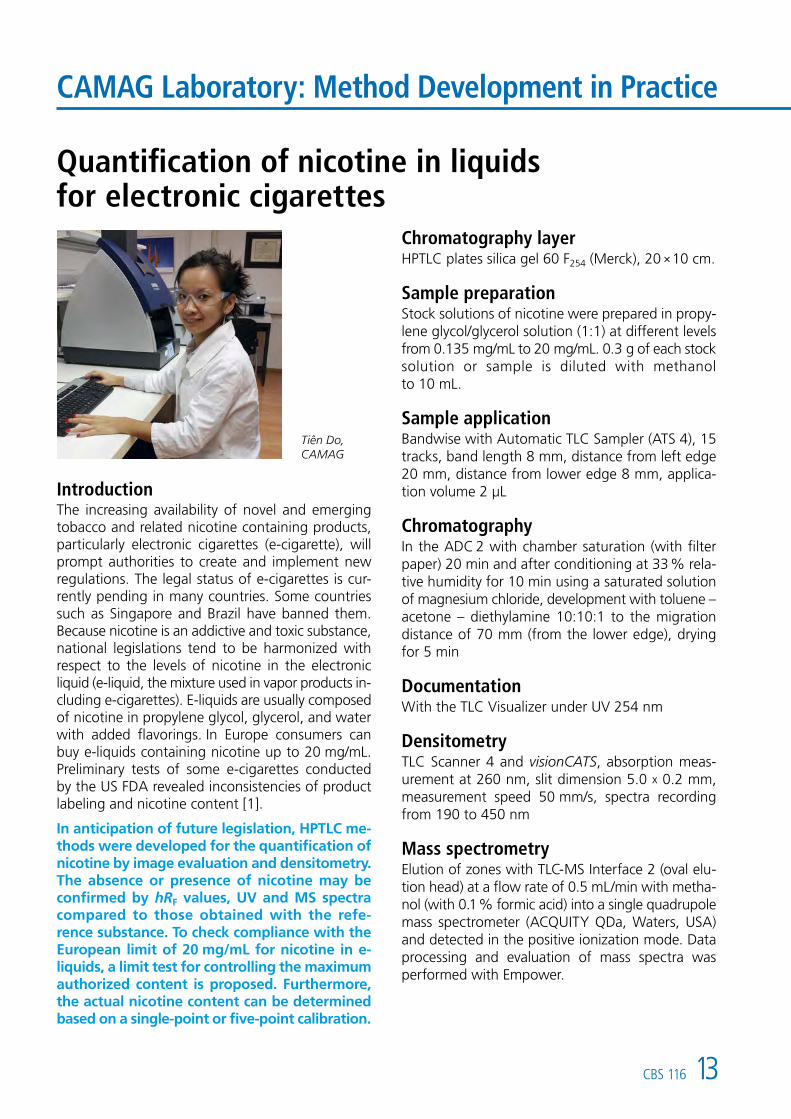
Tiên Do, CAMAG
IntroductionThe increasing availability of novel and emerging tobacco and related nicotine containing products, particularly electronic cigarettes (e-cigarette), will prompt authorities to create and implement new regulations. The legal status of e-cigarettes is cur-rently pending in many countries. Some countries such as Singapore and Brazil have banned them. Because nicotine is an addictive and toxic substance, national legislations tend to be harmonized with respect to the levels of nicotine in the electronic liquid (e-liquid, the mixture used in vapor products in-cluding e-cigarettes). E-liquids are usually composed of nicotine in propylene glycol, glycerol, and water with added flavorings. In Europe consumers can buy e-liquids containing nicotine up to 20 mg/mL. Preliminary tests of some e-cigarettes conducted by the US FDA revealed inconsistencies of product labeling and nicotine content [1].
In anticipation of future legislation, HPTLC me-thods were developed for the quantification of nicotine by image evaluation and densitometry. The absence or presence of nicotine may be confirmed by hRF values, UV and MS spectra compared to those obtained with the refe-rence substance. To check compliance with the European limit of 20 mg/mL for nicotine in e-liquids, a limit test for controlling the maximum authorized content is proposed. Furthermore, the actual nicotine content can be determined based on a single-point or five-point calibration.
Chromatography layerHPTLC plates silica gel 60 F254 (Merck), 20 × 10 cm.
Sample preparationStock solutions of nicotine were prepared in propy-lene glycol/glycerol solution (1:1) at different levels from 0.135 mg/mL to 20 mg/mL. 0.3 g of each stock solution or sample is diluted with methanol to 10 mL.
Sample applicationBandwise with Automatic TLC Sampler (ATS 4), 15 tracks, band length 8 mm, distance from left edge 20 mm, distance from lower edge 8 mm, applica-tion volume 2 µL
ChromatographyIn the ADC 2 with chamber saturation (with filter paper) 20 min and after conditioning at 33 % rela-tive humidity for 10 min using a saturated solution of magnesium chloride, development with toluene – acetone – diethylamine 10:10:1 to the migration distance of 70 mm (from the lower edge), drying for 5 min
DocumentationWith the TLC Visualizer under UV 254 nm
DensitometryTLC Scanner 4 and visionCATS, absorption meas-urement at 260 nm, slit dimension 5.0 x 0.2 mm, measurement speed 50 mm/s, spectra recording from 190 to 450 nm
Mass spectrometryElution of zones with TLC-MS Interface 2 (oval elu-tion head) at a flow rate of 0.5 mL/min with metha-nol (with 0.1 % formic acid) into a single quadrupole mass spectrometer (ACQUITY QDa, Waters, USA) and detected in the positive ionization mode. Data processing and evaluation of mass spectra was performed with Empower.

14 CBS 116
Left: Chromatogram under UV 254 nm (tracks 1–5: reference solutions, tracks 6–7: samples without flavor; tracks 8–9: samples with flavor); center: UV spectra of all reference and sample solutions; right: mass spectrum of the eluted nicotine zone in a sample at m/z 163 [M+H]+
a) Limit test for samples at 20 mg/mLA reference solution with 20 mg/mL nicotine (in propylene glycol/glycerol) and 9 e-liquid samples were applied. All samples show values below that of the reference solution.
1
2
Sample Claimed concentration (mg/mL)
Measured concentration (mg/mL)
Scan* Image**
1 18.0 18.5 19.1
2 18.0 19.0 19.8
3 18.0 19.5 19.9
*extrapolation range of 10%**extrapolation range of 15%
Results and discussionThe developing solvent used for the separation of nicotine from other ingredients was modified [2]. The developing solvent was decreased in the elution strength. The hRF value of 56 obtained for nicotine was sufficient for separation from other ingredients (propylene glycol, glycerol and flavors), which were located in the lower part of the chro-matogram. Each sample was then visually evaluated for the presence of a zone matching the hRF value of the nicotine. UV and MS spectra of target zones were recorded and compared with the one of the reference substance. Analysis of 9 samples including flavored and non-flavored e-liquids showed levels consistent with the respective label claims.
Calibration curve (image evaluation at UV 254 nm)

CBS 116 15
b) Single-point calibration The consistency of the nicotine labeling of 3 sam-ples, claimed to contain 18 mg/mL was tested. The measured concentrations were slightly higher, but below the European limit.
The proposed method is applicable to e-liquid samples containing different concentrations of nicotine. No interference with excipients and flavor ingredients was found. Depending on the regulatory requirements to be met, analytical approaches can be adopted to either include image-based evalu- ation or densitometric determination of nicotine.
c) Five-point calibration For quantification of e-liquids containing different concentrations of nicotine a five-point calibration was used.
Sample Claimed concentration (mg/mL)
Measured concentration (mg/mL)
Scan Image
1 6.0 6.5 5.7
2 12.0 12.3 12.6
3 18.0 17.7 17.8
4 18.0 17.2 17.9
5 18.0 17.9 18.1
6 18.0 16.6 16.7
7 18.0 16.4 16.2
8 18.0 16.5 16.4
9 18.0 16.6 17.6
Sample Claimed concentration (mg/mL)
Measured concentration (mg/mL)
Scan* Image**
1 18.0 18.5 19.1
2 18.0 19.0 19.8
3 18.0 19.5 19.9
*extrapolation range of 10%
**extrapolation range of 15%
Further information is available on request from the author. [1] Summary of Results: Laboratory Analysis of Electronic Cigarettes Conducted by the FDA: http://www.fda.gov/ NewsEvents/PublicHealthFocus/ucm173146.htm
[2] Kenyon et al., J AOAC Int 81 (1998) 44–50
Contact: Tiên Do, CAMAG, Sonnenmattstrasse 11, 4132 Muttenz, [email protected]
Single-point calibration curves of image-based or densitometric determination
Five-point calibration curves of image-based or densitometric determination
3
4

WORLD LEADER IN PLANAR CHROMATOGRAPHY CBS
116
E 99
6.22
70-1
9
Further information: www.camag.com/tlc-scanner
CAMAG TLC Scanner 4
2
1
Controlled by visionCATS HPTLC software, the CAMAG TLC Scanner 4 facilitates the densitometric evaluation of planar chromatograms. The state-of-the-art software controls all functions of the TLC Scanner and enables optimal evaluation of measured data.
Spectrum scan of sulfamerazine: overlay of sample and reference spectra
Technical specifications:
• Measurement of reflected light, either in absorbance or fluorescence mode
• Object formats up to 200 x 200 mm
• Spectral range 190 – 900 nm
• Automatic start of all lamps: deuterium, halogen-tungsten, and high pressure mercury lamp
• Data step resolution 25 – 200 μm
• Scanning speed 1–100 mm/s
visionCATS supports the following functions:
• Single-wavelength scan
• Multi-wavelength scan for quantitative evaluation of differently absorbing substances in one single measuring run
• Wavelength subtraction for background correction
• Spectra recording for checking identity
• Scanner selftest and IQ/OQ
• 21 CFR Part 11