Embed Size (px)
Citation preview

Introduction Literacy involves more than the ability to read or write; it includes the capacity to read, write, speak, listen, and use language effectively.1 It is also a foundational skill and the gateway to higher-level learning. Research shows that achieving reading proficiency by the end of third grade is a strong predictor of high school graduation.2 The consequences of illiteracy, such as poor school performance, low high school and college attendance and graduation rates, result in low-paying jobs and economic insecurity for individuals and families. Low literacy levels cost the U.S. roughly $225 billion or more each year in non-productivity in the workforce, crime, and loss of tax revenue due to unemployment.3 The Alliance for Excellent Education estimates that increasing the 2012 high school graduation rate in Nevada to 90 percent would increase wages by $112 million per year and would result in $90 million in increased annual spending.4 Reports find that low literacy levels directly cost the healthcare industry over $70 million every year.5 The link between low literacy levels and crime are striking. Two-thirds of students who cannot read proficiently by the end of the fourth grade are likely to end up in jail or on welfare.6 Over 70 percent of America’s inmates cannot read above a fourth-grade level. During the 2013 Nevada Legislative Session, much of the discussion on literacy centered on English Language Learners, which led to passage of Senate Bill 504 (Chapter 515, Statutes of Nevada 2013). Analysis of reading achievement data shows that significant numbers of Nevada’s students are struggling in literacy, not just English Language Learners. Nevada currently has several tools in place to address literacy, including the 2011 Nevada State Literacy Plan, the school accountability system, and state and Federal funding. This policy brief provides a profile of 99 schools in Nevada struggling the most in literacy and discusses what resources are available to address this need. This brief then discusses early literacy policies adopted by other states based on best practices and analyzes which states have had the best results. For a more local perspective, this brief also reviews instructional practices to improve literacy in the Clark County School District and the Washoe County School District. This analysis concludes with recommendations for improving literacy in Nevada. Nevada Faces Major Challenges in Literacy Outcomes on state and national reading assessments show that Nevada’s students face significant challenges in literacy. Students in grades 4 and 8 take the National Assessment of Educational Progress (NAEP), which is administered nationwide. Students also take the Nevada Criterion Referenced Test (CRT) at the state level.
Literacy Challenges in Nevada Schools
POLICY BRIEF guinncenter.org March 2014

Page 2
POLICY BRIEF guinncenter.org March 2014
Reading proficiency generally means that a student can read and understand words, sentences, and paragraphs and answer comprehension questions. It is important to note that the NAEP and CRT measure reading proficiency in different ways. The NAEP definition of proficiency is higher than the standards used by most states.7 Because the standards are different, Nevada’s students have traditionally performed better on the CRT than on the NAEP. Table 1 compares the percentage of students at or above proficiency in reading on the NAEP and CRT for fourth and eighth grade in 2012-13. Nevada ranked 46th in the nation on the NAEP for fourth grade reading and 40th for eighth grade reading. Only 27 percent of Nevada’s fourth grade students were proficient in reading compared to 34 percent nationwide. In eighth grade, 30 percent of Nevada’s eighth grade students were proficient in reading compared to 34 percent nationwide. Nevada’s students performed better on the State CRT, with proficiency levels of 71 percent for fourth grade and 50 percent for eighth grade. Table 1: Percentage of Nevada Students Proficient in Reading: 2012-13
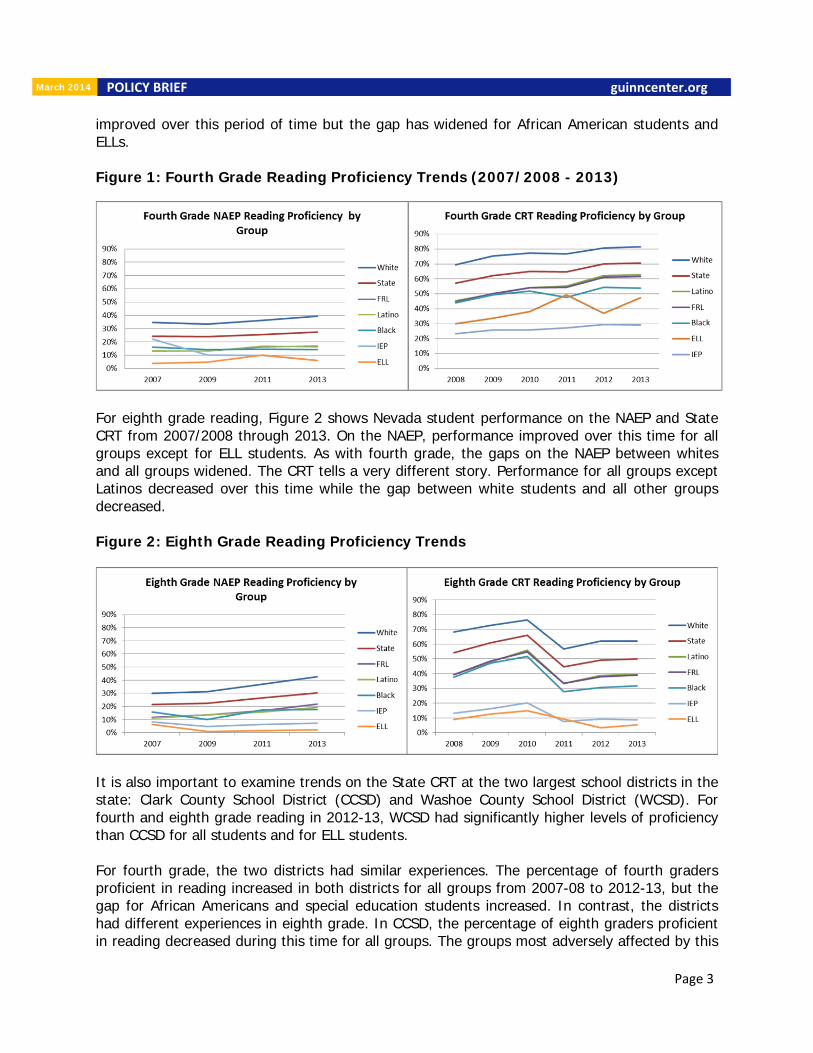
The data from both assessments highlight the performance gaps between white students and non-white students. There are also performance gaps for students who participate in the Free and Reduced Lunch (FRL) program, special education students with Individualized Education Plans (IEP), and English Language Learners (ELLs). On both assessments, ELL students and special education students had the lowest performance levels. Reading proficiency levels in Nevada on the 2013 NAEP for all students, as well as a number of subgroups, were lower than those for many of its Intermountain West neighbors and states with the largest school districts. Appendix A compares 2013 NAEP scores for fourth and eighth graders in Nevada, the Intermountain West (Arizona, California, Colorado, New Mexico, Texas, and Utah), and states with the largest school districts (Florida, Illinois, and New York). Additionally, there is variation within Nevada on how well school districts perform on the State CRT. Appendix B provides State CRT data on reading proficiency in fourth and eighth grade for each school district and subgroup in 2012-13. To get a historical perspective of Nevada student performance on the NAEP and CRT, Figure 1 compares Nevada student performance on the NAEP to the State CRT for fourth grade from 2007/2008 through 2013. On the NAEP, performance improved over this time period for all groups except for African Americans and IEP students. In addition, the gaps on the NAEP between whites and all the other groups widened. On the CRT, performance for all groups has
Grade 4 Grade 8 Grade 4 Grade 8
Total State 27 30 71 50
White 39 43 81 62
Black 14 18 54 32
Latino 16 19 63 40
FRL 17 22 62 39
IEP 6 6 29 9
ELL 6 2 47 5
NAEP State CRT
Page 3
POLICY BRIEF guinncenter.org March 2014
improved over this period of time but the gap has widened for African American students and ELLs. Figure 1: Fourth Grade Reading Proficiency Trends (2007/2008 - 2013)
For eighth grade reading, Figure 2 shows Nevada student performance on the NAEP and State CRT from 2007/2008 through 2013. On the NAEP, performance improved over this time for all groups except for ELL students. As with fourth grade, the gaps on the NAEP between whites and all groups widened. The CRT tells a very different story. Performance for all groups except Latinos decreased over this time while the gap between white students and all other groups decreased. Figure 2: Eighth Grade Reading Proficiency Trends
It is also important to examine trends on the State CRT at the two largest school districts in the state: Clark County School District (CCSD) and Washoe County School District (WCSD). For fourth and eighth grade reading in 2012-13, WCSD had significantly higher levels of proficiency than CCSD for all students and for ELL students. For fourth grade, the two districts had similar experiences. The percentage of fourth graders proficient in reading increased in both districts for all groups from 2007-08 to 2012-13, but the gap for African Americans and special education students increased. In contrast, the districts had different experiences in eighth grade. In CCSD, the percentage of eighth graders proficient in reading decreased during this time for all groups. The groups most adversely affected by this

Page 4
POLICY BRIEF guinncenter.org March 2014
decrease were African Americans and ELLs. In WCSD, proficiency decreased only for certain groups—students as a whole, whites, ELLs, and special education students. At the individual school level, the strongest predictors of reading proficiency on the State CRT are the percentage of Free and Reduced Lunch students and the percentage of white students.8 As the percentage of FRL students increases, reading proficiency decreases. In contrast, as the percentage of white students increases, reading proficiency increases. Usually, the lowest performing subgroups are special education students and ELLs. However, there were nine elementary schools in Clark County School District where African American students had lower fourth grade reading proficiency rates than ELL students in 2012-13.9 How Nevada Currently Addresses Literacy Needs Nevada has several tools to address the literacy challenge: the 2011 Nevada State Literacy Plan, the school accountability system, and state and Federal resources. The 2011 Nevada State Literacy Plan was developed by the Nevada Department of Education (NDE) as part of the Striving Readers Comprehensive Literacy federal grant program.10 The Striving Readers Comprehensive Literacy program funding is provided to 85 schools within Clark, Douglas, Lyon, and Washoe Counties. Phase I began in 2012-13, Phase II began in 2013-14, and the grant ends in 2015-16. While only certain schools received funding under this grant, the Nevada State Literacy Plan was intended to apply to the entire state and included goals to be accomplished within three years. However, resources were not provided to implement the plan statewide and monitoring has not been initiated. The NDE plans to revise the Nevada State Literacy Plan in 2014 to create a more comprehensive document. The essential elements of the current literacy plan include effective leadership, effective instruction, teacher preparation programs, family and community partnerships, early childhood literacy instruction, and intermediate and adolescent literacy instruction. The plan envisions a Data Based Decision Making (DBDM) Literacy Improvement Team at each school and targeted professional development. It also includes support for school districts in adopting a Response-to-Instruction/Intervention (RTI) framework that identifies students at-risk for failure early in their education and provides targeted interventions to improve literacy achievement.11 Nevada’s school accountability system is the State’s vehicle for improving academic performance. In August 2012, Nevada received a waiver from the Elementary and Secondary Education Act (ESEA) from the U.S. Department of Education, which allowed Nevada to implement the Nevada School Performance Framework (NSPF) as the State’s school accountability system.12 Through this system, the State established a 5-star rating system for K-12 public schools, with 1 being the lowest and 5 being the highest. The NSPF also designated 24 schools with low subgroup performance as Focus schools and 9 schools with low performance of all students as Priority schools. Schools with 1 to 3 stars are required to participate in the Student Achievement Gap Elimination (SAGE) school improvement planning process.13 Federal funding is integrated into the accountability system to increase resources available to schools. Schools with high percentages of poverty are eligible to receive federal Title I, Part A
Page 5
POLICY BRIEF guinncenter.org March 2014
funds. In 2012-13, 343 of Nevada’s 717 public schools statewide (47 percent) received Title I funding. In addition, school districts with Focus and/or Priority schools, or a high proportion of 1 or 2 star schools, are required to set aside 5 to 15 percent of certain federal funds to improve academic achievement at these schools. This includes Title I Part A funds, Title II Part A teacher quality funds, Title III funds for English language acquisition, and Individuals with Disabilities Education Act (IDEA) funds for special education students. Federal Title I School Improvement Grants are also available for focus and priority schools. As part of Senate Bill 504, the State launched a new $50 million initiative for the 2013-2015 biennium to improve outcomes for ELLs. Funds have been provided to 20 “Zoom Schools” in Clark and Washoe counties with the highest rates of ELLs and the lowest academic outcomes. These schools are required to provide pre-kindergarten programs, full-day kindergarten programs, intersession programs, and reading skills development centers. These programs are provided to all students in the Zoom schools, not just ELLs. Schools in other counties are also receiving funding for English Language Learners through this initiative. At the local level, CCSD has identified nine schools in the historic Westside of Las Vegas known as Prime 6 schools. The District provides these schools with flexibility and additional resources to improve academic outcomes. Profile of 99 Schools Struggling in Literacy We reviewed the characteristics of 99 Nevada public schools struggling the most in literacy based on 2012-13 state test results, as well as the resources provided to help them succeed. A total of 22 schools statewide had reading proficiency rates on the CRT of less than 35 percent while 77 schools had reading proficiency rates of 35 percent to 49.8 percent. Key findings include:
Literacy is not exclusively a challenge in the early grades; 52 percent of the schools struggling with low proficiency rates are elementary schools, 40 percent are middle schools, 3 percent are high schools, and 5 percent are alternative schools for students with IEPs.
Not all of the schools rank poorly in the star ranking system: 16 schools have 1 star, 46 schools have 2 stars, 25 schools have 3 stars, 1 school has 4 stars, and 11 are not rated.
The State and school districts have directed special resources towards some of these schools as shown in Table 2 on the following page:

Page 6
POLICY BRIEF guinncenter.org March 2014
Table 2: Resources at Schools Struggling in Literacy 2012-13
*Total Schools in State of 717 is based on reporting on Nevada School Performance Network, which breaks down schools with multiple grade spans into separate schools for accountability purposes.
The 99 struggling schools also have disproportionately high concentrations of students in minority and special populations:
85 percent of the schools have a higher FRL rate than the statewide rate of 49.9 percent.
64 percent of the schools have a higher ELL rate than the statewide rate of 14.9 percent. However, only 6 of the 22 schools with reading proficiency of less than 35 percent have ELL rates higher than the statewide rate.
71 percent of the schools have a higher IEP rate than the statewide rate of 11.0 percent.
67 percent of the schools have a higher percentage of Latinos than the statewide rate of 40.0 percent.
47 percent of the schools have a higher percentage of African Americans than the statewide rate of 9.7 percent.
This data illustrates that schools performing poorly in literacy share many population characteristics but have differential access to resources. Title I funds are the most common funding source and are also the most long-standing funding source. Other sources such as Striving Readers and Zoom Schools are too new to assess impact. However, the continuing poor performance of schools in Nevada that have had long-term access to supplemental funds demonstrates the need to reexamine practices to improve literacy. Policies and Practices to Improve Early Literacy To address the literacy needs of students not meeting the proficiency standards and English Language Learners, schools need to implement best practices that can meet the needs of all struggling readers. A total of 36 states plus the District of Columbia have policies in statute aimed at improving third grade reading proficiency.14 While Nevada has a state literacy plan, it does not currently have any early literacy policies in statute. In the absence of statewide
Category Schools with Less
than 35% of
Students
Proficient in
Reading
Schools from 35%
to 50% Students
Proficient in
Reading
Total
Schools in
State
Total Schools 22 77 717*
Title I 10 65 340
Focus 4 13 24
Priority 0 1 9
Zoom 1 12 20
Prime 6 0 2 9
Striving Readers‐ Phase I 1 9 53
Striving Readers‐ Phase II 1 5 32

Page 7
POLICY BRIEF guinncenter.org March 2014
policies in Nevada, school districts have designed their own policies and systems to address early literacy, including Response-to-Intervention (RTI) and Multi-Tiered Systems of Support.15 Common elements of state literacy policies are discussed below. Identification of Students A total of 35 states plus the District of Columbia currently require early literacy assessments.16 Research supports using universal screening to identify struggling readers who need additional assistance.17 In Response-to-Intervention (RTI) models, screening is typically conducted three times per year, in the fall, winter, and spring. Screening in kindergarten or first grade allows for early identification and intervention in early literacy. Research shows that effective screening methods accurately identify students who need intervention, are easy and quick to administer, and result in timely intervention for students who need assistance.18 State policies vary in terms of which grade levels must be tested. The most common requirement is to require assessments in grades K through 3 or grades PK through 3. States either require a specific state assessment or allow local school districts to select the assessment. Often, school districts must pick an assessment from a state-approved list. States also differ on the timing of the assessment, ranging from annually to three times per year. Parent Notification and Engagement Academic research shows a strong link between parent involvement and early literacy.19 States vary in the role for parents in their early literacy policies. A total of 23 states plus the District of Columbia require that parents be notified that a student has been identified as needing intervention.20 Five states go further by allowing parents to be involved in choosing an intervention strategy, while 11 states provide information and support for parents to work with students at home.21 Instructional and Intervention Practices State policies typically require some type of intervention to assist struggling readers, but differ in whether certain interventions are required or recommended. The most common interventions in state policies include supplemental instruction during regular school hours, after school, or summer school. In addition, some states require creation of academic improvement plans for struggling readers.22 Research shows that effective practices and programs for English Language Learners are also broadly effective for English-proficient students.23 A comprehensive review of studies of interventions for struggling readers identified that the best programs have a strong focus on classroom instruction and provide one-to-one, phonetic tutoring to students who experience difficulties.24 Specific findings include:
Cooperative learning is a particularly effective classroom instruction model, where students work in teams of four to five to help each other learn academic content;
Professional development is key to ensuring quality instruction; One-to-one tutoring is very effective in improving reading performance;

Page 8
POLICY BRIEF guinncenter.org March 2014
Tutoring models that focus on phonics obtain much better outcomes than others; Teachers are more effective than paraprofessionals and volunteers as tutors; and Small-group, phonetic tutorials can be effective, but are not as effective as one-to-one
phonetically-focused tutoring. For English Language Learners, a review of studies found that quality of instruction is more important than the language of instruction. Common features of the most promising interventions include emphasis on vocabulary and writing, use of extensive professional development, coaching, and cooperative learning. In addition, whole school and whole class interventions have shown success.25 Monitoring and evaluating the effectiveness of the intervention provided is also intrinsic to success.26 Professional Development As discussed above, professional development is an intrinsic component to programs that have improved outcomes for struggling readers. Successful programs have emphasized professional development on academic language, reading comprehension, and writing skills for all the teachers in a school to assist struggling readers and ELLs. Professional development can be implemented through a variety of methods, including training by experts and peer coaching. Professional development can also include Professional Learning Communities, which give teachers time to plan, network with colleagues, reflect, analyze and modify instruction. Some states have recently increased professional development to improve literacy. For example, in Massachusetts, the state now requires 45 hours of professional development for more than 40,000 teachers in 12 critical instructional areas central to the academic success of ELLs.27 Massachusetts also requires 15 hours of professional development for all principals, assistant principals, and supervisors on the 12 instructional features, classroom observation practices, and teacher support. In Virginia, the State has allocated professional development for cohorts of content teachers, ELL teachers, literacy teachers, and administrators in several districts, including rural districts. It is also experimenting with whole-school interventions in which professional development would be extended to administrators, literacy coaches, and all teachers at a single school. Effectiveness of Literacy Policies While all of the intervention strategies described above are based on rigorous academic research, simply adopting legislation or creating policies will not automatically improve literacy. Many states have similar policies in place but have experienced varying levels of success. A review of the research suggests that there are many factors that determine a state’s success, including the size of the population of struggling readers, leadership, resources, quality of professional development, and monitoring. We reviewed NAEP scores from 2007 to 2013 to determine which states have been relatively successful in improving reading proficiency for ELLs, since this population is one of the lowest performing subgroups in Nevada and many other states. We examined states where

Page 9
POLICY BRIEF guinncenter.org March 2014
intervention systems were stressed by rapid growth in the ELL population, as has occurred in Nevada. In 2013, the average reading proficiency rate for fourth grade ELLs was 6 percent in Nevada and 7 percent in the United States as a whole. The states with the highest fourth grade reading proficiency rates had smaller percentages of English Language Learners than Nevada, but all had experienced substantial growth in the ELL population. Table 3 shows the reading proficiency levels for ELLs in each of these states in 2007 and 2013, the percentage of ELLs in 2011, and the percentage growth in ELLs from 2007 to 2011.28 Table 3: States with Highest Reading Proficiency for fourth Grade ELL Students
What accounts for better outcomes in these states, including Arkansas, Indiana, and Kansas? An analysis of all the factors that could have led to these results is beyond the scope of this policy brief. However, we note that all of these states with better outcomes have early literacy policies in statute that are similar to polices adopted in other states that are not performing as well. Clearly, the quality of implementation is critical to success. One State, Different Approaches To get a better idea of what may determine success, we reviewed early literacy instructional practices in CCSD and WCSD. At CCSD, the district has been implementing many of the practices identified in this policy brief through Response-to-Intervention (RTI) for many years. While some schools have had great success with RTI and are serving as models for other schools, implementation is weak at other sites. Schools use a variety of screening tools depending on the need. In addition, limited resources have been available for professional development and time has not been specifically set aside in the school schedule for teachers to come together to discuss their assessment of students, to identify the type of interventions that should be implemented, and to monitor the success of interventions. While Academic Managers are responsible for monitoring the performance of each school, limited resources are available to monitor how well RTI is being implemented in each school. In addition, in 2011, budget cuts forced CCSD to eliminate the majority of their 160 ELL specialists, who were responsible for overseeing a school's ELL teachers, testing for English proficiency, coaching and mentoring other teachers who work with ELL students, collecting data
StateProficiency
2007
Proficiency
2013
ELLs as
Percent of
Enrollment
2011
Growth in
ELL
Enrollment
2007 to 2011
Arkansas 7% 17% 7% 35%
Indiana 8% 13% 5% 16%
Kansas 14% 17% 8% 32%
Maryland 15% 18% 5% 33%
Nevada 4% 6% 19% 16%
Ohio 18% 19% 2% 31%
South Carolina 19% 18% 5% 19%
Fourth Grade ELL Reading Proficiency on NAEP

Page 10
POLICY BRIEF guinncenter.org March 2014
on a school's ELL population, and more importantly, for serving as liaisons between the school and parents.29 Currently, there are approximately 13 ELL coaches on CCSD staff.30 However, despite fiscal pressures, CCSD, in collaboration with the University of Nevada, Las Vegas, stood up the Reading Skills Development Centers (RSDC) in 6 high risk, underperforming schools that feature early student assessments, student interventions involving high quality tutoring and the placement of a Master Reading Teacher at each site, and professional development for RSDC staff, as well as other school faculty. An assessment of the 2012-2013 pilot indicates that the percentage of students attending RSDCs achieving proficiency increased over the assessment period.31 At WCSD, the district is using an approach called Multi-Tiered Systems of Support (MTSS). This framework also includes many of the best practices identified in this policy brief. The district has developed a team at each site that includes an MTSS lead teacher, administrator, psychologist, and counselor. This team is trained annually by the district and is responsible for training teachers at the school site. The district also has several screening tools in place that are district supported. A key feature of MTSS is providing time for teachers to meet in grade-level professional learning communities on Wednesdays to discuss interventions for students and receive professional development. Students are released an hour early on Wednesdays and school days are longer on other days to accommodate this schedule. The district office monitors academic outcomes as well as how well MTSS is being implemented at each site. As noted earlier, WCSD experienced significantly higher reading proficiency rates than CCSD in 2012-13 for students as a whole and for ELL students. While both school districts have similar instructional models in place, WCSD’s instructional practices are more formalized and embedded in the schools. WCSD has also placed a greater emphasis on professional development and monitoring. Moving Towards Improved Literacy Outcomes in Nevada Improving literacy in Nevada requires commitment at all levels, including teachers, principals, administrators, school boards, and the state. Legislators and school districts should examine the following strategies to improve outcomes for Nevada’s struggling readers.
1. Standardize Early Literacy Expectations Across the State: Decision makers should consider legislation in the 2015 Legislative Session to create a state policy on early literacy to standardize and formalize expectations across the state. Key components should include universal assessments to identify students needing intervention, parent involvement, intervention programs for students, and evaluation of the effectiveness of the interventions. It is important that any legislation provide school districts with options so that they can tailor programs to student needs.
2. Retool Professional Development: To ensure that instruction and interventions are being implemented effectively, sustained, job-embedded professional development on literacy must be available to teachers. In addition, professional development resources are needed to train teachers in ELL literacy. Teachers in ELL settings should possess a Teaching English as a Second Language (TESOL) endorsement on their teaching

Page 11
POLICY BRIEF guinncenter.org March 2014
certificate. Professional development resources should be directed to provide and/or expand coaching, including peer coaching, as well as trainings. Additional public investment will likely be needed to ensure that teachers receive high quality professional development.
3. Refocus on Literacy at Higher Grade Levels: While early literacy is a critical to the success of Nevada’s students, there also needs to be a strong focus on literacy needs in middle school and high school, particularly for ELLs. While more than 75 percent of ELLs in CCSD are concentrated in elementary school (50 percent in first to third grade and 25 percent in grades 4 and 5), 25 percent are in middle school (15 percent) and high school (10 percent). As reported in Appendix B, NAEP reading proficiency scores for ELLs were 6.1 in fourth grade and 2.1 in eighth grade. Programs such as Striving Readers Comprehensive Literacy do contain interventions for middle school and high school, but they do not appear as comprehensive as elementary school interventions.
4. Maximize Resources: Regardless of any new funding provided, school districts should
critically examine existing state and Federal resources available for professional development and intervention to maximize effectiveness of existing funds. Schools with low reading proficiency rates do not currently have access to the same resources, as illustrated in the profile of 99 schools with the lowest reading proficiency rates. School districts should critically review which schools are receiving Title I funds and how much funding each school receives. The ESEA Waiver provides an exemption from the Title I ranking and serving requirements. Under the regular rules, schools must be served in rank order based on poverty. With the ESEA waiver, a school with a lower poverty rate could be served before a school with a higher poverty rate based on literacy needs. School districts can also decide to concentrate more funds per pupil at schools with lower reading proficiency rates. These changes will involve hard choices since Title I funds are a finite resource.
5. Utilize Existing Accountability Structures: Schools with 1 to 3 stars are required to use the SAGE Planning Process as part of the Nevada School Performance Framework. Each school and district should use this process as part of a continuous system of improvement. SAGE can be used by each school and district to evaluate how well interventions are working and to determine what changes need to be made. SAGE should also be used to analyze how supplemental funds are currently being used for struggling readers and how they can be refocused towards best practices.
Raising the literacy proficiency of Nevada’s students is critical for the long-term economic success of Nevada. In 2011, the Governor’s Office of Economic Development crafted an economic development plan that identified the need to catalyze development within seven industrial sectors: Tourism, Gaming, and Entertainment; Clean Energy; Health and Medical Services; Aerospace and Defense; Mining, Materials, and Manufacturing; Business IT Ecosystems; and Logistics and Operations. A more educated workforce will make Nevada more attractive to these industries and will improve future economic outcomes for Nevada’s students.

Page 12
POLICY BRIEF guinncenter.org March 2014
Appendix A: Comparison of NAEP Scores for Fourth and Eighth Grade Students At or Above Proficient in Reading, 2013
State Category Grade 4 Grade 8 State Category Grade 4 Grade 8
Arizona All Students 27.59 27.84 Nevada All Students 27.33 30.34
White 42.35 41.74 White 39.46 42.57
Black 18.99 15.96 Black 14.12 17.58
Latino 16.63 17.15 Latino 16.40 19.25
FRL 15.18 16.16 FRL 16.97 21.62
IEP 7.48 4.37 IEP 6.12 5.78
ELL 0.61 0.00 ELL 6.13 2.09
California All Students 26.90 29.31 New MexicoAll Students 21.46 22.19
White 46.11 44.32 White 38.01 39.95
Black 13.04 14.85 Black 24.05 14.51
Latino 15.56 18.37 Latino 16.84 16.53
FRL 14.66 17.05 FRL 15.16 15.86
IEP 11.40 4.74 IEP 3.77 4.83
ELL 4.75 2.21 ELL 3.19 2.00
Colorado All Students 40.64 39.84 New York All Students 37.01 34.97
White 51.79 49.50 White 47.05 46.07
Black 19.24 13.20 Black 21.21 17.83
Latino 22.57 23.10 Latino 21.45 19.20
FRL 21.33 22.15 FRL 22.57 20.52
IEP 7.25 10.37 IEP 9.46 8.25
ELL 8.21 3.06 ELL 4.32 1.09
Florida All Students 38.96 33.27 Texas All Students 28.47 30.82
White 49.31 42.49 White 46.06 49.46
Black 20.30 19.02 Black 18.35 17.32
Latino 35.53 26.87 Latino 17.12 19.87
FRL 26.82 22.72 FRL 16.94 18.73
IEP 19.56 13.22 IEP 9.14 7.51
ELL 10.17 3.33 ELL 8.66 2.10
Ill inois All Students 33.51 36.23 Utah All Students 36.98 39.23
White 46.17 46.75 White 42.76 43.68
Black 13.84 14.02 Black 0.00 0.00
Latino 18.15 23.78 Latino 14.04 22.11
FRL 16.04 19.60 FRL 24.40 26.36
IEP 9.96 7.32 IEP 11.53 7.33
ELL 3.29 1.24 ELL 2.06 3.02

Page 13
POLICY BRIEF guinncenter.org March 2014
Appendix B: Percentage of Nevada Students Proficient in Reading on State CRT by School District
County All Students White Black Latino FRL IEP ELLState 70.6 81.4 53.8 62.6 61.6 29.1 47.4Carson City 70.5 78.0 59.1 60.2 49.3 48.0Churchill 75.5 81.9 61.2 70.5 23.7 40.0Clark 69.3 82.0 53.7 62.5 61.1 26.7 46.4Douglas 78.6 81.6 67.4 64.7 46.0 45.5Elko 71.2 78.2 56.4 59.0 24.7 46.3EsmeraldaEurekaHumboldt 72.1 80.0 61.3 63.8 28.9 45.7Lander 79.4 85.4 71.4 68.8Lincoln 66.0 64.7 64.0Lyon 78.9 81.2 73.6 73.1 42.0 49.0Mineral 53.7 52.2Nye 65.2 68.7 54.4 60.2 23.8 31.6Pershing 76.6 80.0 70.0State Charters 77.9 79.7 55.1 75.2 65.1 41.7 62.5Storey 84.4 85.2Washoe 74.1 84.0 57.1 62.8 62.2 32.5 52.3White Pine 58.7 59.2 52.8
County All Students White Black Latino FRL IEP ELLState 50.0 61.9 31.8 39.6 38.9 8.7 5.2Carson City 59.3 69.9 46.9 43.2 22.2 2.9Churchill 50.5 53.6 45.8 38.3 9.1Clark 48.8 63.7 31.3 39.2 38.3 8.0 5.6Douglas 59.9 66.6 38.3 43.5 8.9Elko 53.2 61.5 37.4 42.7 6.3 10.0EsmeraldaEurekaHumboldt 43.5 50.0 37.5 27.3 10.0Lander 45.6 49.1 39.1 37.5Lincoln 37.3 38.5 33.3Lyon 49.7 51.1 45.8 45.8 12.5Mineral 55.6 0.0 45.5Nye 43.3 47.8 29.1 37.7 9.2 4.2Pershing 30.9 35.7 27.8State Charters 45.8 48.3 29.7 35.0 35.9 15.3Storey 28.9 31.3Washoe 55.6 65.8 41.4 41.6 41.4 9.1 3.2White Pine 53.2 53.7 38.9
Fourth Grade Reading Proficiency: 2012‐13
Eighth Grade Reading Proficiency: 2012‐13

Page 14
POLICY BRIEF guinncenter.org March 2014
1 There are several related definitions of literacy. In 1991, Congress passed the National Literacy Act in 1991 that defined literacy as "an individual's ability to read, write, and speak in English, and compute and solve problems at levels of proficiency necessary to function on the job and in society, to achieve one's goals, and develop one's knowledge and potential." Workforce literacy is defined as an individual's ability to read, write, and speak in English, and compute and solve problems at levels of proficiency necessary to function on the job. 2 Hernandez, D. (2012). Double Jeopardy: How Third Grade Reading Skills and Poverty Influence High School Graduation. Baltimore: Annie E. Casey Foundation. Available: http://www.aecf.org/~/media/Pubs/Topics/Education/Other/DoubleJeopardyHowThirdGradeReadingSkillsandPovery/DoubleJeopardyReport030812forweb.pdf 3 Literacy Partners website using data from Proliteracy.org. Available: http://www.literacypartners.org/literacy‐in‐america/impact‐of‐illiteracy; http://www.proliteracy.org/about‐us/mission‐vision‐and‐history 4 The Economic Benefits of Increasing the High School Graduation Rate for Public School Students. Alliance for Excellent Education (2013); http://impact.all4ed.org/ 5 Literacy Partners website using data from Proliteracy.org. 6 Literacy Partners website using data from Proliteracy.org. 7 Strauss, Valerie, “NAEP: A flawed Benchmark Producing the Same Old Story,” Washington Post November 4, 2011. Available:
http://www.easybib.com/reference/guide/mla/newspaper and National Assessment of Educational Progress. The NAEP Reading Achievement Levels by Grade, 2009‐2013 Achievement‐Level Descriptions. Available: http://nces.ed.gov/nationsreportcard/reading/achieve.aspx 8 Nevada Department of Education, Nevada Report Card: http://www.nevadareportcard.com/di/ 9 Nevada Department of Education, Nevada Report Card: http://www.nevadareportcard.com/di/ 10 Nevada Department of Education, State Literacy Plan for a Strong Nevada (2011) http://www.doe.nv.gov/NDE_Offices/APAC/Striving_Readers/ 11 Clark County School District Striving Readers Comprehensive Literacy Program presentation 2012; Washoe County School District Striving Readers Program, http://washoestrivingreaders.com/ 12 Nevada Department of Education, Nevada ESEA Flexibility Waiver: http://www.doe.nv.gov/Resources/NV_ESEA_Waiver/ 13 Nevada Department of Education, SAGE School Performance Planning: http://www.doe.nv.gov/Ofice_Educational_Opportunity_SI_Resources/ 14 Education Commission of the States. Third Grade Reading Policies. August 2012. Available: http://www.ecs.org/clearinghouse/01/03/47/10347.pdf. Several states with policies were not included in this study, including Alaska (4 AAC 06.713), Indiana (Indiana Code 20‐32‐8.5), and Kansas (Kansas Statutes Annotated 72‐9921 through 72‐9927), and Mississippi (Mississippi Code 37‐177). 15 Clark County School District implements Response to Instruction (RTI) and Washoe County School District uses Multi‐Tiered Systems of Support (MTSS). See: http://www.ccsd.net/parents/response‐instruction/ and http://www.washoe.k12.nv.us/staff/multi‐tiered‐systems‐of‐support 16 Education Commission of the States. Third Grade Reading Policies. August 2012. 17 Hughes, C and Dexter, D. Universal Screening within a Response‐to‐Intervention Model. Available: http://www.rtinetwork.org/learn/research/universal‐screening‐within‐a‐rti‐model 18 Jenkins, J. & Johnson, E. Universal Screening for Reading Problems: Why and How Should We Do This? Available: http://www.rtinetwork.org/essential/assessment/screening/readingproblems 19 Lin, Q. Parent Involvement and Early Literacy, Harvard Family Research Project. http://www.hfrp.org/publications‐resources/publications‐series/family‐involvement‐research‐digests/parent‐involvement‐and‐early‐literacy 20 Education Commission of the States. Third Grade Reading Policies. August 2012. 21 Education Commission of the States. Third Grade Reading Policies. August 2012. 22 Education Commission of the States. Third Grade Reading Policies. August 2012. 23 Calderon, M. (2012). Breaking Through: Effective Instruction & Assessment for Reaching English Learners. Bloomington, IN: Solution Tree Press 24 Davis, S., Lake, C., Madden, N., & Slavin, R.E. (2009). Effective Programs for Struggling Readers: A Best‐Evidence Synthesis. Baltimore: Center for Research and Reform in Education. Available: http://www.bestevidence.org/word/strug_read_Jul_07_2011.pdf 25 Cheung, A. & Slavin, R.E. (2012). Effective Reading Programs for Spanish Dominant English Learners (ELLs) in Elementary Grades: A Synthesis of Research. Baltimore: Center for Research and Reform in Education. Available: http://www.bestevidence.org/word/ell_read_Mar_19_2012.pdf
Page 15
POLICY BRIEF guinncenter.org March 2014
26 Safer, N. & Fleischman, S. Research Matters/ How Student Progress Monitoring Improves Instruction. Educational Leadership February 2005. Volume 62, Number 5. Available: http://www.studentprogress.org/library/ArticlesResearch/Edleadershiparticle.pdf 27 Calderon, M. Presentation at Nevada Literacy Summit: ExC‐ELL: Whole School, Whole District, Whole State Successes, March 18, 2014 28 National Center for Education Statistics, Table 47. Available: https://nces.ed.gov/programs/digest/d12/tables/dt12_047.asp. Data is only available through 2010‐11. 29 Las Vegas Review Journal. Budget crisis could sink English Language Learner program. April 24, 2011. Available: http://www.reviewjournal.com/news/education/budget‐crisis‐could‐sink‐english‐language‐learner‐program 30 Channel 8 News Now, Budget Cuts Hurting English Language Learners in Higher Grades. October 30, 2013. Available: http://www.8newsnow.com/story/23834666/budget‐cuts‐hurting‐english‐language‐learners‐in‐higher‐grades 31 Testimony submitted to the Nevada Assembly Committee on Education on AB 222 Reading Skills Development Consortium. March 25, 2013. Available: http://www.leg.state.nv.us/Session/77th2013/Exhibits/Assembly/ED/AED601I.pdf
Page 16
POLICY BRIEF guinncenter.org March 2014
About the Kenny C. Guinn Center for Policy Priorities The Kenny C. Guinn Center for Policy Priorities (Guinn Center) is a nonprofit, bipartisan, think‐do tank focused on independent, fact‐based, relevant, and well‐reasoned analysis of critical policy issues facing the state of Nevada. The Guinn Center engages policy‐makers, experts, and the public with innovative, fact‐based research, ideas, and analysis to advance policy solutions, inform the public debate, and expand public engagement. The Guinn Center is a 501(c)(3) nonprofit organization. The Guinn Center does not take institutional positions on policy issues. © 2014 Kenny C. Guinn Center for Policy Priorities All rights reserved. Contact Information Contacts Kenny C. Guinn Center for Policy Priorities Nancy E. Brune, Ph.D. c/o InNEVation Center Executive Director 6795 Edmond Street [email protected], (702) 522‐2178 Suite 300/Box 10 Las Vegas, NV 89118 Victoria Carreón Director of Research & Policy Phone: (702) 522‐2178 [email protected], (702) 522‐2178 Email: [email protected] www.guinncenter.org