Embed Size (px)
Citation preview
1
The carbon market in 2020: volumes, prices
and gains from trade
Marcel Brinkman, Samuel Fankhauser, Ben Irons and Stephan Weyers
November 2009
Centre for Climate Change Economics and Policy Working Paper No. 13
Grantham Research Institute on Climate Change and the Environment
Working Paper No. 11
2
The Centre for Climate Change Economics and Policy (CCCEP) was established by the University of Leeds and the London School of Economics and Political Science in 2008 to advance public and private action on climate change through innovative, rigorous research. The Centre is funded by the UK Economic and Social Research Council and has five inter-linked research programmes:
1. Developing climate science and economics 2. Climate change governance for a new global deal 3. Adaptation to climate change and human development 4. Governments, markets and climate change mitigation 5. The Munich Re Programme - Evaluating the economics of climate risks and
opportunities in the insurance sector More information about the Centre for Climate Change Economics and Policy can be found at: http://www.cccep.ac.uk. The Grantham Research Institute on Climate Change a nd the Environment was established by the London School of Economics and Political Science in 2008 to bring together international expertise on economics, finance, geography, the environment, international development and political economy to create a world-leading centre for policy-relevant research and training in climate change and the environment. The Institute is funded by the Grantham Foundation for the Protection of the Environment, and has five research programmes:
1. Use of climate science in decision-making 2. Mitigation of climate change (including the roles of carbon markets and low-
carbon technologies) 3. Impacts of, and adaptation to, climate change, and its effects on development 4. Governance of climate change 5. Management of forests and ecosystems
More information about the Grantham Research Institute on Climate Change and the Environment can be found at: http://www.lse.ac.uk/grantham. This working paper is intended to stimulate discussion within the research community and among users of research, and its content may have been submitted for publication in academic journals. It has been reviewed by at least one internal referee before publication. The views expressed in this paper represent those of the author(s) and do not necessarily represent those of the host institutions or funders.
3
The Carbon Market in 2020
Volumes, Prices and Gains from Trade
Marcel Brinkmana, Samuel Fankhauserb, Ben Ironsa, b and Stephan Weyersa
10 November 2009
Abstract Carbon markets are central to the global effort to reduce greenhouse gas emissions. This paper introduces a new carbon market model that aims to simulate the development of the global carbon market over the next 10-20 years. The model is based on detailed regional and sectoral marginal abatement cost data and takes an “investor perspective”. That is, it takes into account market distortions like taxes and accounts for imperfections in policy delivery. We estimate that implementing all the carbon market proposals that are currently contemplated would result in global emission reductions of 7 GtCO2 by 2020 – substantial, but well short of the mitigation effort required for a 450ppm CO2e pathway. The global carbon price would vary from €30 per tCO2 in Europe to €15 per tCO2 on the international offset market and in the new US emissions trading scheme currently under discussion. Keywords: climate change mitigation, carbon markets, CDM, EU ETS JEL codes : G15, Q47, Q54, Q58
a McKinsey and Company, 1 Jermyn Street, London SW1Y 4UH b Grantham Research Institute and Centre for Climate Change Economics and Policy, London School of Economics, Houghton St, London WC2A 2AE. Corresponding author ([email protected]) This paper has benefited greatly from comments and feedback by Alex Bowen, Raphael Calel and Luca Taschini. Fankhauser and Irons would also like to acknowledge the financial support from the Grantham Foundation for the Protection of the Environment and the Centre for Climate Change Economics and Policy, which is funded by the UK’s Economic and Social Research Council (ESRC) and by Munich Re.
4
The Carbon Market in 2020
Volumes, Prices and Gains from Trade
1. Introduction
Carbon trading has emerged as one the key policy instruments in the fight against
climate change. Economists have long argued that putting a price on carbon is an
essential and effective way to curtail greenhouse gas emissions.1 In theory, this can be
achieved either through a tax on carbon emissions or a cap-and-trade scheme, where a
restricted number of emission allowances is traded on dedicated markets. The relative
merits of the two approaches is still debated in the literature,2 but in practice policy
makers have overwhelmingly opted for cap-and-trade.3 They are swayed by the
political economy advantages of carbon trading, for which political support is much
easier to build (Hepburn 2006, 2007).
In 2008 the global carbon market was worth $126 billion – twice as much as in 2007
and four times as much as in 2006 (Capoor and Ambrosi 2009). Thanks to growing
trading volumes (which offset depressed prices) 2009 promises to be another record
year. The biggest market by far is the EU Emissions Trading Scheme (EU ETS),
which accounts for over 70% of activity. The Clean Development Mechanism
(CDM), the world’s biggest baseline-and-credit (or offset) market, accounts for
around 25%, most of it secondary market transactions. Smaller schemes like Joint
Implementation, international emissions (or AAU) trading or the voluntary carbon
market and regional systems, for example, in New England and New South Wales,
contribute the rest.
These schemes could all be dwarfed by a new federal US cap and trade scheme that is
currently being debated by Congress and which observers expect could be up and
running within five years. Carbon trading is also being deliberated in Australia, New
1 See for example Fisher et al. (1996) for an early articulation, and subsequently Stern (2006), among others. 2 See Hoel and Karp (2001), Hepburn (2006) and Newell and Pizer (2003). The classic reference is Weitzman (1974). 3 A prominent supporter of taxation is Nordhaus (2005).
5
Zealand and – to a lesser extent – Canada, Japan and Mexico, among others.
Meanwhile, the negotiations on the international climate change regime post-2012
may well result in an extended scope for global carbon trading, for example through
an enhanced CDM and new trading instruments for forest-based carbon or
international transport emissions.
This paper asks how the international carbon market may develop over the next ten
years if these systems are put in place as currently contemplated. The analysis is
based on a new carbon market model, which extends and draws on previous work by
McKinsey (2009) on the cost of greenhouse gas mitigation.4 The model uses
differences in marginal abatement costs between countries and sectors to calculate
potential trading volumes, gains from trade and the equilibrium price of carbon in
different market segments.
Using marginal abatement cost estimates to simulate arbitrage opportunities is a fairly
common piece of analysis. Most regionally disaggregated energy-economy models
and integrated assessment models function in that vein, using either top-down
(production function-based) or bottom-up (engineering-based) cost information.5
An important feature of our model versus other (particularly top down) energy models
is the granularity of the abatement data, which is modeled by lever/technology, by
industry and by region. Detailed and consistent cost information allows us to model
individual policy proposals at much higher resolution than other models and isolate
the consequences of detailed policy choices, such as constraints on the use of forestry
offsets or regulatory policies to force renewable energy uptake (two prominent
features of the EU’s climate change and energy package).
Further real-world flavor is added by incorporating policy distortions (such as most
taxes and subsidies), firm-level constraints (such as high costs of capital) and limits to
the uptake of some abatement options (for example due to insufficient or poorly 4 Other sources of “bottom up” marginal abatement cost data include for example AIM (Kainuma et al. 2007), GAINS (Amann et al. 2009b), IMAGE (Bouwman et al. 2006) and POLES (European Commission 1996, Russ et al. 2009). See also Amann et al. (2009a). 5 See for example the results of the EMF-22 model comparison (Clarke et al. 2009) and the IPCC mitigation cost discussion (Barker et al. 2007a). For a critical assessment of the use of MACs see Morris et al. (2008).
6
executed policies). In other words, our analysis takes an investor perspective, rather
than the social planning perspective typical of economic models. We are less
interested in the theoretical economic potential of carbon trading than in the actual
financial flows, trade volumes and carbon prices that may materialize in the real
world.
We start our discussion, in the next section, with a brief description of the carbon
market model on which the analysis is based. Section 3 then looks at likely carbon
market developments up to 2020, based on the implementation of the policy proposals
on the table in summer 2009. These proposals are still in flux and bound to evolve.
Section 4 therefore highlights the sensitivity of market developments to some
pertinent policy choices, in particular the overall level of ambition and the degree of
trading flexibility over space (through linking) and time (through banking /
borrowing). Section 5 concludes.
2. Modeling the carbon market
Trade in carbon emissions is driven by differences in abatement costs. The larger the
differences in costs, the larger the scope for trading and the bigger the gains from
trade. At the core of our carbon market model are the detailed marginal abatement
cost data gathered by McKinsey and summarized in version 2 of its global cost curves
(McKinsey 2009).
McKinsey’s cost curve model is a bottom up, microeconomic model that assesses the
technically available abatement potential versus a business-as-usual (BAU) reference
case solution. It does so at a granular level – covering approximately 200
technologies, in 13 sectors, and 21 regions. The G8+5 nations are covered
individually, with a further 8 regional assessments ensuring global coverage.
The carbon markets model splits the original cost data further into different carbon
market segments: international emissions trading among governments (the AAU
market), domestic cap-and-trade markets in Annex 1 countries (including the EU
ETS, and the new US trading system) and the international offset market (a reformed
and expanded CDM, say). Separate cost curves were derived for “traded sectors” that
7
are expected to be covered by the various carbon markets and non-traded sectors that
are likely to remain outside. The analysis also accounts for regulatory policies that
mandate particular abatement options, such as energy efficiency standards in
buildings and renewable energy targets.
The original McKinsey cost curves are estimates of the economic potential for cost-
effective GHG mitigation. For the current purpose, this economic perspective was
replaced by an investor perspective. This required two adjustments.
First, economic costs were translated into financial costs by introducing existing
policy interventions like fuel taxes and energy subsidies (such as feed-in tariffs).
Financing constraints were introduced by replacing the social discount rate of the
original cost curves (4 % real) with a higher, differentiated rate (on average 11%) that
reflects firms’ actual costs of capital – varying by industry and geography.6
The net effect of these corrections typically is to make the cost curves steeper. Energy
efficiency measures with negative costs tend to become even more attractive if energy
is subject to tax,7 while the higher cost of capital increases the cost of capital-
intensive investments like renewables. There are also some changes in the merit order,
as measures with particularly high upfront costs become more expensive and move
further up the cost curve.
The second adjustment acknowledges limits in policy effectiveness. Rather than
assuming the full implementation of all cost-effective mitigation options, as the
original cost curve implicitly does, our analysis recognizes that the uptake will be less
than perfect as a result of insufficient policy ambition, ineffective policies and poor
execution. This is similar to the approach taken by the UK Committee on Climate
Change, which also distinguishes between technical / economic potential and actual
uptake, which is a function of the policy environment (CCC 2008).8
6 Discounting is one of the most controversial issues in climate change economics. A good synthesis is Dasgupta (2008). 7 The inverse happens in countries with energy subsidies, still a frequent occurrence in many parts of the world. 8 Of course, policy makers anticipating an imperfect uptake of policies may ramp up their measures to counterbalance that effect.
8
To do so we made an assessment of the current policy proposals in each of the 21
regions and 13 sectors of the model. Each of those proposals was rewarded a policy
ambition score, which scaled the abatement potential (see Chart 1). These policy
ambition scores are based on a literature study of the effectiveness of climate change
policy. Further, each country was awarded a policy execution score, which is based on
McKinsey staff assessments informed by a range of governance indicators.9 The
technical abatement potential was then multiplied with the two factors in order to
derive an assessment of the achievable abatement, given expected government policy
effectiveness. Note that this does not include the expected outcome of the carbon
market, which effectively provides the financing for the positive cost measures.
The result of this adjustment was to reduce the uptake of cost effective measures to 24
GtCO2 in 2030, compared with a technical potential of 38 GtCO2 in the original
analysis (see Chart 2). Alternative assumptions on policy effectiveness will be
introduced in section 4.
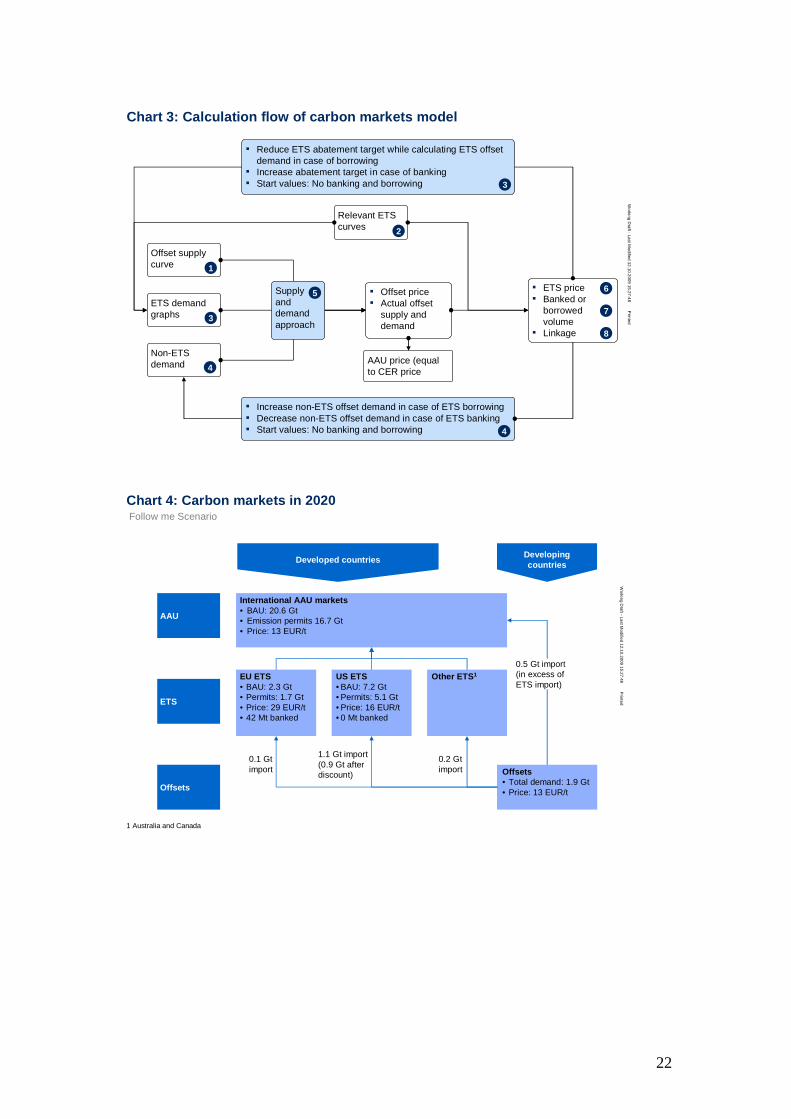
The model is solved over four steps (see Chart 3). The first step is to balance supply
and demand in the international offset market. Second, the regional cap-and-trade
systems are balanced using the market-clearing offset price calculated in step one.
Third, the AAU price is set equal to the offset price. These steps allow us to calculate
the prices in each of the markets, the amount of (domestic) abatement achieved as
well as the trading with other markets (typically import of international offsets).
In the fourth step banking and borrowing is introduced, assuming a five-year time
horizon for companies under a cap. That is, companies are assumed to bank (borrow)
allowances, if the expected price five years later is much higher (lower) than in the
current year.
Since banking and borrowing of allowances can increase or reduce the offset demand
in the given year, an iterative algorithm is used. Linkage of carbon markets (beyond
the international offset market) is possible, but not set in the default model.
9 UNDP (2004) provides a useful survey of available governance indicators.
9
The international offset market is the key market mechanism in the model, balancing
global supply and demand across markets. The offset supply curve depends on sectors
and regions participating in the offset market, policy effectiveness, and rules
governing eligible offsets (for example, NPV-positive levers may be excluded as non-
additional).10
For each of the regional cap-and-trade systems, the demand for international offsets is
dependent on the offset price assuming that companies will always choose the
cheapest option between regular allowances, abatement under the cap-and-trade
system, domestic offsets, international offsets and, where applicable, strategic reserve
allowances. The offset demand on a country level (as opposed to the cap-and-trade
system) is assumed to be inelastic and is calculated as the gap between a country’s
reduction target and the abatement achieved through domestic actions (both inside
and outside a cap-and-trade system) after perfect AAU trading.11
3. The carbon market in 2020
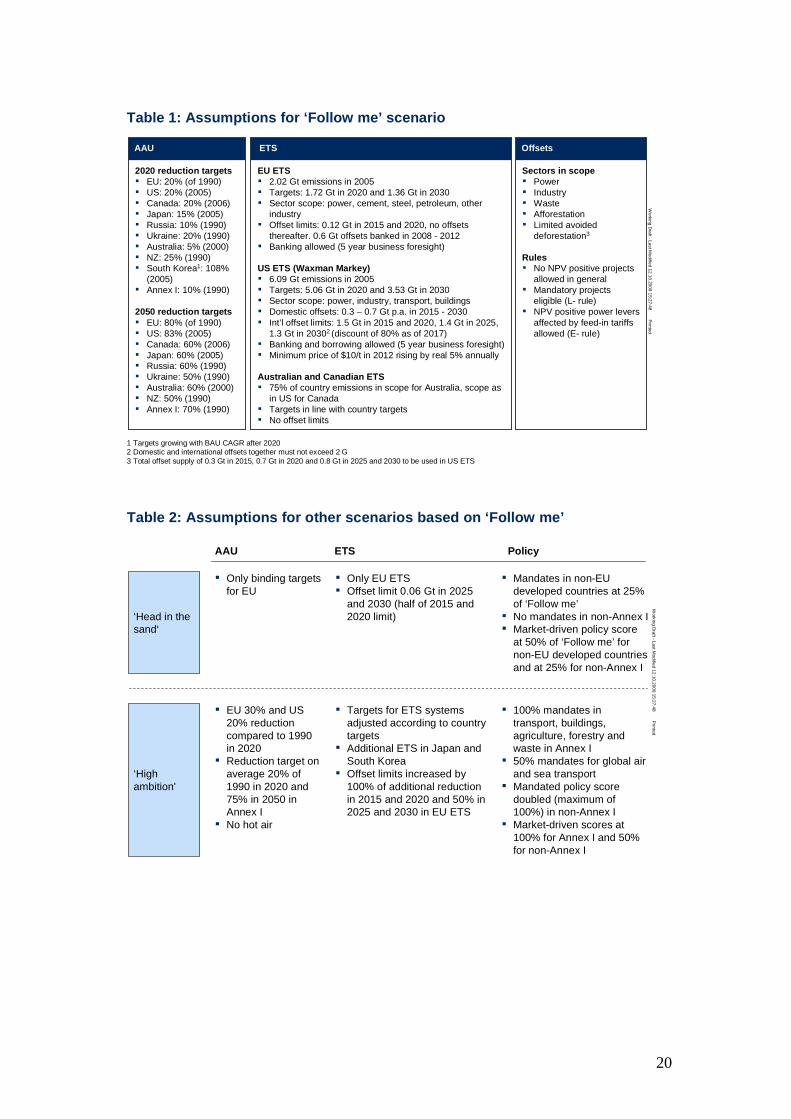
The first application of the model was to analyze carbon market developments under a
“Follow me” scenario, that is, the expectation that the low range of all currently
announced or proposed policies will be implemented. More specifically, we
considered carbon market policies as contemplated in summer 2009 (see Table 1 for
details). The scenario was derived from a range of policy documents, including the
December 2008 climate change and energy package of the EU and the Waxman-
Markey bill (version passed by the House of Representatives) in the US.
The scenario foresees the establishment or expansion of national cap -and-trade
schemes in Europe (EU and neighboring states like Iceland, Norway and
Switzerland), the US, Australia and Canada. It foresees an expanded global baseline-
and-credit (or offset) market modeled on a reformed CDM and the continuation of
international emissions (or AAU) trading between Annex I governments. The various
cap-and-trade markets are not linked, although they are all connected to the global
10 See IETA (2008), Michaelowa and Pallav (2007), Michaelowa and Umamaheswaran (2006), Streck and Lin (2008) and Wara (2007) for a discussion of CDM additionality and CDM performance. 11 We ignore the effect of penalties for non-performance.
10
offset market and AAU trading, which creates an indirect link. Importantly, we
assume that avoided deforestation (so called REDD) offsets are only eligible and
available to a limited extent.
The main results are summarized in Chart 4. In the AAU market, the Annex-I cap-
and-trade caps total an estimated 16.7 GtCO2 in 2020 and 12.6 GtCO2 in 2030. Of
the abatement required to meet these targets in the developed world, about two thirds
will be realized domestically, with the remainder through offsets. Offsets are the
price-setting (i.e., marginal) supplier of abatement to developed world, suggesting that
AAU prices will be equal to offset prices.
The EU ETS has 1.7 GtCO2 of emission allowances in 2020 and potentially 1.4
GtCO2 in 2030. The majority of the required abatement to meet these targets is
realized domestically, as the offset quotas are tight (about 1.6 GtCO2 over 2008-12).
The tight targets and offset quotas means the EU ETS has the highest prices of all
carbon markets, peaking at €40 per tCO2 in 2025. The price-setting abatement
capacity is domestic. Banking of offsets can reduce the risk of price drops, but unlike
the US ETS there are no other stabilization mechanisms in place.
The US ETS (as proposed in the Waxman-Markey bill) is assumed to be operational
as of 2012. The market has 5.1 GtCO2 of emission allowances in 2020 and 3.5
GtCO2 in 2030. Initially most abatement is realized through domestic and
international offsets (1 GtCO2 out of 1.4 GtCO2 in 2015), but over time domestic
abatement starts to play a larger role (2.5 GtCO2 out of 4.1 GtCO2 in 2030). The US
ETS market price will be set by offsets, even after taking into account the 4:5 discount
rate that is currently contemplated.
The offset market is assumed to continue in the future, with avoided deforestation
offsets remaining limited to 20-40% of global offset supply. Demand for offsets
comes mainly from the US ETS and AAU countries.
Overall, carbon trading is estimated to trigger incremental investments of almost €800
billion between 2016 and 2020, much of it in electric power and transport, and over
three quarters of it in China, the US and the EU.
11
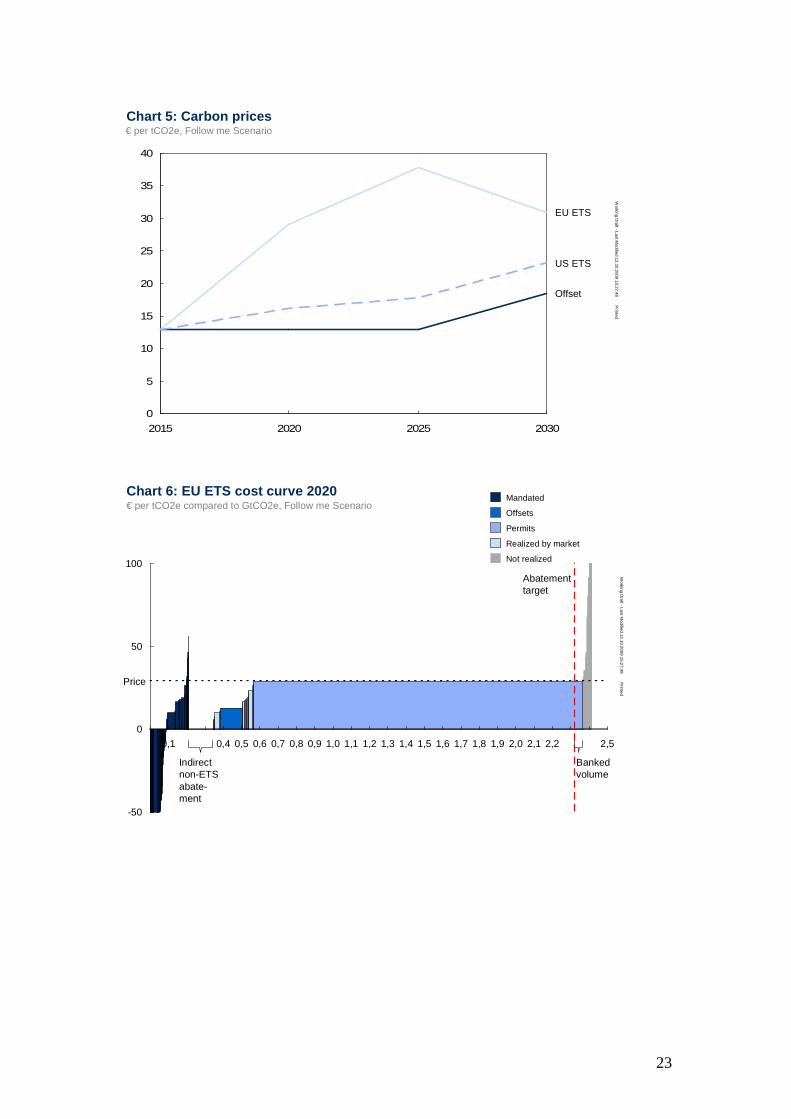
Chart 5 displays price developments. It shows a substantial price differential between
the EU ETS, where the allowance price could rise above €35 in 2025, and the
international offset and US allowance prices, which we expect to increase to €23 by
2030. In Europe, where the use of offsets is constrained, the carbon price is
determined by the marginal cost of domestic abatement, assumed to be various
renewable energy technologies (for example, wind alongside fuel switching in 2015,
solar alongside small hydro in 2020). In the US, which currently foresees a more
liberal use of international offsets, the allowance price is expected to follow the
(discounted) offset price, since offset purchases are the preferred abatement activity at
the margin.12
It is important to note that in both markets, a large share of the abatement will be
covered and achieved through mandated policies like the EU’s Renewable Energy
Directive. Chart 6 shows this in more detail for the case of the EU ETS. The chart
shows the EU marginal abatement cost curve, reordered to give priority to mandated
actions and to factor in the contribution of offsets. The chart also shows how the
prevalence of cheap abatement opportunities encourages banking. We will come back
to this issue in section 4.
The offset price, in the meantime, is kept low by a steady flow of low cost emission
reductions in sectors like electric power, industry, forestry and waste (two thirds of it
from China). In fact offset prices could remain almost constant over time as the
growth in offset supply is in line with growing demand (see Chart 5 above). But even
at this relatively low price offset trading is a financially attractive activity, creating
substantial trade flows and yielding substantial benefits. Chart 7 shows the net trade
flows in the offset market and the gains from trade.
4. The impact of different policy designs
Although currently announced initiatives provide a good indication of how policy
might develop, the debate is clearly still in flux and much will change as options are
12 See Goettle and Fawcett (2009) for a detailed analysis of cap and trade impacts in the US.

12
reviewed and political consensus is built. The academic debate on the merit of
different design mechanisms is also ongoing and will influence policy choices (see for
example Fankhauser and Hepburn 2009). In this section, we ask how different policy
choices would affect the price and volume dynamics in the carbon market. In
particular, we look at four design options: (i) a change in policy effectiveness and
abatement ambition (ii) the linking of regional markets and (iii) changes to the rules
on banking and borrowing.
4.1 Different levels of ambition
The policies currently announced, which form the backbone of section 3, would result
in global emission reductions of 7 GtCO2 in 2020 and 15 GtCO2 in 2030. This is well
short of the 25-40% reduction in global emissions that the IPCC called for in its
fourth assessment report (Barker et al. 2007b) and the 17 GtCO2 of reductions that
Project Catalyst (2009) estimates will be needed by 2020 to stabilize concentrations at
around 450ppm CO2e, and thus have a fighting chance of limiting global warming to
2oC. However, even the low targets used in the "Follow me" scenario are not ratified
yet.
We also looked at two other carbon market scenarios reflecting different degrees of
ambition. The first scenario, labeled a “High ambition”, includes a stricter, 20%
reduction target, relative to 1990, – with correspondingly tighter domestic caps and
offset limits – and increased policy effectiveness: 100% of technical potential
mandated in Annex I countries in non-market sectors and increased ambitions in the
developing world.
The second alternative is a pessimistic “Head in the sand” scenario, where only
policies that are already into effect (for example the EU ETS) are included. Crucially,
this excludes federal carbon trading in the US. The two scenarios are detailed in Table
2.
Chart 8 shows difference in carbon prices for the two scenarios, and Chart 9 displays
the impact on global emissions reductions. Higher levels of ambition have a strong
impact on carbon prices, in part offset by improved policy effectiveness, which
13
increases supply. In the "Head in the sand" scenario, offset prices could fall to around
€5 per tCO2 by 2020 without the US joining the global carbon markets.
In contrast, the effect of more ambitious scenarios on overall emission reductions is
relatively limited (Chart 9). Under a “High ambition” scenario only about 60% of the
theoretical potential is taken up. This is mainly due to the fact that emissions will
continue to grow strongly in countries that are currently at a low level of
development, including India. To change that and move closer to the 450ppm
pathway, much more comprehensive targets that cover most countries would be
required, as well as more aggressive policies on sectors like forestry and agriculture
that are not covered by the carbon market.
4.2 Linking of markets
Key design question is to what extent regional markets will be linked up. This
particularly concerns the link between the world’s two biggest carbon markets in the
US and the EU. In our main results, we assumed that the two markets would be linked
only indirectly through the international offset market, on which they both draw.
It is instructive to explore what would happen if the two markets were more closely
integrated, at the extreme through the unrestricted exchange of allowances between
the two jurisdictions. It is an aspiration among many European policy makers to
achieve such a link as early as 2015 (Lazerowicz 2009).
The enthusiasm for linking is understandable. Conceptually, flexibility in space is key
to keeping down compliance costs. In practice, a number of preconditions will have to
be met before such a link becomes realistic (Fankhauser and Hepburn 2009). Chief
among them are consistent levels of ambition between the two policy spheres.
Linking a system that is designed to be high price with a low-price scheme would
create policy tensions as trading will inevitably equate prices across systems. In
addition there is a need for coordination on regulatory arrangements, including the use
of, and quality standards for, offsets.

14
A linked market would result in prices very close to the prices in an autarkic US
market (chart 10). This can be explained by the much smaller size of the EU ETS
compared to the US system and the generous US offset limit that is not exhausted in
the autarky case.
4.3 Banking and borrowing
Banking and borrowing (or flexibility over time, in the terminology of Fankhauser
and Hepburn 2009) is similarly important. Complete flexibility to allocate abatement
effort over time would allow firms to smooth short-term fluctuations (for example,
related to fuel prices) and coordinate emission reductions with the investment cycle
and the replacement of the capital stock.
For example, the summer 2009 drop in the EU allowance price would have been
much sharper if it had not been possible to bank surplus emissions into the post-2012
period. Conversely, the price collapse in the first phase of the EU ETS would have
been avoided if surplus emissions could have been banked into the second trading
period. In fact, self-contained trading periods without banking or borrowing lead, by
design, to price spikes or troughs at the end of that period unless installations are able
to plan their emissions to perfection.
Despite its conceptual advantages, most systems constrain intertemporal flexibility.
Banking from one commitment period to the next is generally allowed, but there tend
to be limits to the amount of borrowing that is permitted, both between commitment
periods and within individual periods. This is due to a (political) preference for timely
abatement, but also concerns about time inconsistency – that is, the possibility that
delayed commitments may not be honoured in full (Fankhauser and Hepburn 2009).
The simulation results show how banking and borrowing can soften price fluctuations.
The effect is particularly strong in the EU ETS, where tight targets and limited offset
quotas may lead to a price spike in 2025 in the absence of intertemporal flexibility.
Borrowing between trading phases is not allowed in the EU ETS, but banking alone is
capable of reducing the spike from €65 per tCO2 to €38 per tCO2 (Chart 11).
15
The US ETS, as currently envisaged, would allow borrowing one year ahead for free
and from subsequent years at an 8% interest rate. This is anticipated to have minimal
effect however, as the offset price is the predominant driver of the US ETS price.
5. Conclusion
The global carbon market could grow spectacularly over the next ten years. If current
proposals are implemented – and this crucially includes a Waxman-Markey-style
federal trading scheme in the US – the market volumes might reach $800 billion by
2020, compared with $126 billion in 2008.
In our main scenario, which is based on ‘current proposals’, we see the EU ETS
prices rise from €13 in 2015 to €38 in 2025 before falling back to about €30. The high
price is driven primarily by limited offset quotas. In the US, where offset quotas are
more generous, prices stay much closer to the offset market price – rising from €13 in
2015 to €23 in 2030.
However, ‘current proposals’ result in an abatement outcome of just 7 GtCO2,
bringing emissions down from a business-as-usual level of 61 GtCO2 in 2020 to 54
GtCO2. This compares to 17 GtCO2 that might be needed by 2020 to stabilize
concentrations at 450ppm, according to Project Catalyst (2009), and underscores the
fact that the unilateral commitments in both developed and developing countries
remain insufficient. Even in our most aggressive "High ambition" scenario, only
about 60% of the theoretical emission reduction potential is taken up. To change that,
much more comprehensive targets would be required that cover most countries, as
well as more aggressive policies on forestry and agriculture.
The shortfall in all our scenarios also underscores that carbon markets, while central
to the global mitigation effort, are on their own not enough. The carbon market will
only provide about 40% of the total abatement effort. Carbon trading has to be
complemented by additional policy instruments to address non carbon price-related
externalities. They may include standards (for example, renewable electricity
standards, building codes and fuel efficiency standards), targeted revenue support
(such as feed-in tariffs) and technology support in the form of subsidies for R&D and

16
pilot programs. Moreover, additional public finance will be needed to provide a
strong, additional impetus for abatement in developing countries, particularly those
currently not covered by the carbon market.
Much will depend on how carbon markets are designed – how comprehensive they
are, how ambitious, how well they are regulated and so on. This will determine to a
large extent how much abatement we can achieve and at what overall cost.
Particularly pertinent will be links to other markets, including the amount of offsets
allowed and direct linking with other developed country schemes. The banking and
borrowing mechanisms will determine the inter-temporal price development, and
could influence price strongly as abatement will become cheaper over time when the
abatement potential increases.
The model we used to derive these conclusions is relatively simple in terms of its
economic structure, but very rich in terms of the country and sector level mitigation
strategies it details. These data were taken from the McKinsey cost curves, which
provide comprehensive, internally consistent cost data for a wide array of countries
and sectors. Cost data are of necessity uncertain, but even accepting these
uncertainties it is clear that there is substantial scope for efficiency gains from carbon
trade. Carbon markets can make an important and effective contribution to the global
transition to a low carbon economy.

17
References
Amann, M., P. Rafaj and N. Höhne (2009a). GHG Mitigation Potentials in Annex I countries. Comparison of Model Estimates for 2020. International Institute for Integrated Systems Analysis, Laxenburg. http://gains.iiasa.ac.at/index.php/reports Amann, M., I. Bertok, J. Borken, J. Cofala, C. Heyes, L. Hoglund, Z. Klimont, P. Purohit, P. Rafaj, W. Schoepp, G. Toth, F. Wagner and W. Winiwarter (2009b). GAINS. Potentials and Costs of GHG Mitigation in Annex I Countries. International Institute for Integrated Systems Analysis, Laxenburg. http://gains.iiasa.ac.at/ index.php/reports. Barker, T., I Bashmakov, A. Alharthi, M. Amann, L. Cifuentes, J. Drexhage, M.Duan, O. Edenhofer, B. Flannery, M. Grubb, M. Hoogwijk, F. Ibitoye, C. Jempa, W. Pizer and K. Yamaji (2007a). “Mitigation from a Cross-Sectoral Perspective”, in B. Metz, O. Davidson, P. R. Bosch, R. Dave and L. A. Meyer (eds.), Climate Change 2007: Mitigation. Contribution of Working Group III to the Fourth Assessment Report of the Intergovernmental Panel on Climate Change, Cambridge: CUP Barker, T., I. Bashmakov, L. Bernstein, J. E. Bogner, P. R. Bosch, R. Dave, O. R. Davidson, B. S. Fisher, S. Gupta, K. Halsnæs, B. Heij, S. Kahn Ribeiro, S. Kobayashi, M. D. Levine, D. L. Martino, O. Masera Cerutti, B. Metz, L. A. Meyer, G.J. Nabuurs, A. Najam, N. Nakicenovic, H. H. Rogner, J. Roy, J. Sathaye, R. Schock, P. Shukla, R. E. H. Sims, P. Smith, D. Tirpak, D. Urge-Vorsatz and Z. Dadi (2007b). “Technical Summary”, in: B. Metz, O. Davidson, P. R. Bosch, R. Dave and L. A. Meyer (eds) Climate Change 2007: Mitigation. Contribution of Working Group III to the Fourth Assessment Report of the Intergovernmental Panel on Climate Change. Cambridge: CUP. Bouwman, A.F., T. Kram, and K. Klein Goldewijk, eds. (2006). Integrated Modelling of Global Environmental Change. An Overview of IMAGE 2.4, Netherlands Environmental Assessment Agency (MNP), Bilthoven. Capoor, K. and Ambrosi, P. (2008), State and Trends of the Carbon Market 2008, World Bank, Washington DC. Clarke, L., J. Edmonds, V. Krey, R. Richels, S. Rose and M. Tavoni (2009). “International Climate Policy Architectures: Overview of the EMF 22 International Scenarios”, in Energy Economics, forthcoming. Committee on Climate Change (2008). Building a Low Carbon Economy. The UK’s Contribution to Tackling Climate Change. The First Report of The Committee on Climate Change. December 2008. London: TSO. Also www.theccc.org.uk. Dasgupta, P. (2008). “Discounting Climate Change”, in: Journal of Risk and Uncertainty: 37(2/3): 141-169.

18
European Commission (1996). POLES 2.2. European Commission DG XII, EUR 17358 EN, Brussels. Fankhauser, S. and C. Hepburn (2009). Carbon Markets in Time and Space. Background paper for the Lazerowicz Review, July. http://www.decc.gov.uk/ en/content/cms/what_we_do/ change_energy/ tackling_clima/emissions/ emissions.aspx. Fisher, B.S., S. Barrett, P. Bohm, M. Kuroda, J.K.E. Mubazi, A. Shah, and R.N. Stavins (1996). “ An Economic Assessment of Policy Instruments for Combating Climate Change”, in IPCC, Climate Change 1996. Economic and Social Dimensions of Climate Change, Contributions of Working Group III to the Second Assessment Report of the Intergovernmental Panel on Climate Change, Cambridge: CUP. Goettle, R.J. and A.A. Fawcett (2009). “The Structural Effects of Cap and Trade on Climate Policy”, Energy Economics, doi: 10.1016/j.eneco.2009.06.016 Hepburn, C. (2006), ‘Regulating by prices, quantities or both: an update and an overview’, Oxford Review of Economic Policy, 22:2, 226-247. Hepburn, C. (2007) 'Carbon trading: a review of the Kyoto mechanisms', Annual Review of Environment and Resources, 32, 375-393. Hoel, M. and Karp, L. S. (2001), ‘Taxes and Quotas for a Stock Pollutant with Multiplicative Uncertainty’. Journal of Public Economics, 82, 91-114. IETA (2008). State of the CDM 2008: Facilitating a Smooth Transition into a Mature Environmental Financing Mechanism. International Emissions Trading Association, Geneva, Switzerland. Kainuma, M., Y. Matsuoka, T. Masui, K.Takahashi, J. Fujino and Y. Hijioka (2007). “Climate Policy Assessment Using the Asia-Pacific Integrated Model”. In: M. Schlesigner, H. Kheshgi and J. Smith (eds.). Human Induced Climate Change, Cambridge CUP. Lazerwowicz, M. (2009). Global Carbon Trading. A Framework for Reducing Emissions. London: The Stationary Office. McKinsey (2009). Pathways to a low-carbon economy. Version 2 of the Global Greenhouse Gas Abatement Cost Curve. McKinsey and Company, London. Michaelowa, A. and P. Pallav (2007). Additionality determination of Indian CDM projects. Can Indian CDM project developers outwit the CDM Executive Board? London: Climate Strategies. Michaelowa, A. and K. Umamaheswaran (2006). Additionality and Sustainable Development Issues Regarding CDM Projects in Energy Efficiency Sector. HWWA Discussion Paper No. 346. Hamburg Weltwirtschafts Archiv, Hamburg.
19
Morris, J., S. Paltsev and J. Reilly (2008). Marginal Abatement Costs and Marginal Welfare Costs for Greenhouse Gas Emissions Reductions: Results from the EPPA Model. Report No. 164, MIT Joint Program on the Science and Policy of Global Change, Boston, MA, November. Newell, R.G. and Pizer, W.A. (2003), ‘Regulating Stock Externalities under Uncertainty’, Journal of Environmental Economics and Management, 45(2): 416–432. Nordhaus, W.D. (2005). "After Kyoto: Alternative Mechanisms To Control Global Warming," American Economic Review 96(2): 31-34. Project Catalyst (2009). Limiting Atmospheric CO2e to 450ppm - the Mitigation Challenge. Summary findings of the Mitigation Working Group, March. www.projectcatalyst.info. Russ, P. J.C. Ciscar, B. Saveyn, A. Soria, L. Szabo, T. van Ierland, D. van Regemorter, and R. Virdis (2009). Economic Assessment of Post 2012 Global Climate Policies. Analysis of Greenhouse Gas Emission Reduction Scenarios with the POLES and GEM-E3 models. Report EUR 23768 EN (2009). European Commission, Brussels. Stern, N. (2006). The Economics of Climate Change. The Stern Review. Cambridge: CUP. Streck C. and J. Lin (2008). “Making Markets Work: A Review of CDM Performance and the Need for Reform.” European Journal of International Law 19 (2): 409-442. UNDP (2004). Sources for Democratic Governance Indicators. Oslo Governance Centre, United Nations Development Programme. Wara, M. (2007). “Is the Global Carbon Market Working?” Nature 445: 595-596. Weitzman, M. L. (1974), ‘Prices vs. Quantities’, Review of Economic Studies, 41(4), 477-491.
20
Working D
raft -Last M
odified 12.10.2009 15:27:48P
rinted
Table 1: Assumptions for ‘Follow me’ scenario
2020 reduction targets▪ EU: 20% (of 1990)▪ US: 20% (2005)▪ Canada: 20% (2006)▪ Japan: 15% (2005)▪ Russia: 10% (1990)▪ Ukraine: 20% (1990)▪ Australia: 5% (2000)▪ NZ: 25% (1990)▪ South Korea1: 108%
(2005)▪ Annex I: 10% (1990)
2050 reduction targets▪ EU: 80% (of 1990)▪ US: 83% (2005)▪ Canada: 60% (2006)▪ Japan: 60% (2005)▪ Russia: 60% (1990)▪ Ukraine: 50% (1990)▪ Australia: 60% (2000)▪ NZ: 50% (1990)▪ Annex I: 70% (1990)
AAU
EU ETS▪ 2.02 Gt emissions in 2005▪ Targets: 1.72 Gt in 2020 and 1.36 Gt in 2030▪ Sector scope: power, cement, steel, petroleum, other
industry▪ Offset limits: 0.12 Gt in 2015 and 2020, no offsets
thereafter. 0.6 Gt offsets banked in 2008 - 2012▪ Banking allowed (5 year business foresight)
US ETS (Waxman Markey)▪ 6.09 Gt emissions in 2005▪ Targets: 5.06 Gt in 2020 and 3.53 Gt in 2030▪ Sector scope: power, industry, transport, buildings▪ Domestic offsets: 0.3 – 0.7 Gt p.a. in 2015 - 2030▪ Int’l offset limits: 1.5 Gt in 2015 and 2020, 1.4 Gt in 2025,
1.3 Gt in 20302 (discount of 80% as of 2017)▪ Banking and borrowing allowed (5 year business foresight)▪ Minimum price of $10/t in 2012 rising by real 5% annually
Australian and Canadian ETS▪ 75% of country emissions in scope for Australia, scope as
in US for Canada▪ Targets in line with country targets▪ No offset limits
ETS
Sectors in scope▪ Power▪ Industry▪ Waste▪ Afforestation▪ Limited avoided
deforestation3
Rules▪ No NPV positive projects
allowed in general▪ Mandatory projects
eligible (L- rule)▪ NPV positive power levers
affected by feed-in tariffs allowed (E- rule)
Offsets
1 Targets growing with BAU CAGR after 20202 Domestic and international offsets together must not exceed 2 G3 Total offset supply of 0.3 Gt in 2015, 0.7 Gt in 2020 and 0.8 Gt in 2025 and 2030 to be used in US ETS
Workin
g Draft -
Last Modified 12.10.2009 15:27:48
Printed
Table 2: Assumptions for other scenarios based on ‘ Follow me’
AAU ETS Policy
▪ Only binding targets for EU
▪ Only EU ETS▪ Offset limit 0.06 Gt in 2025
and 2030 (half of 2015 and 2020 limit)
▪ Mandates in non-EU developed countries at 25% of ‘Follow me’
▪ No mandates in non-Annex I▪ Market-driven policy score
at 50% of ‘Follow me’ for non-EU developed countries and at 25% for non-Annex I
‘Head in the sand‘
‘High ambition'
▪ Targets for ETS systems adjusted according to country targets
▪ Additional ETS in Japan and South Korea
▪ Offset limits increased by 100% of additional reduction in 2015 and 2020 and 50% in 2025 and 2030 in EU ETS
▪ 100% mandates in transport, buildings, agriculture, forestry and waste in Annex I
▪ 50% mandates for global air and sea transport
▪ Mandated policy score doubled (maximum of 100%) in non-Annex I
▪ Market-driven scores at 100% for Annex I and 50% for non-Annex I
▪ EU 30% and US 20% reduction compared to 1990 in 2020
▪ Reduction target on average 20% of 1990 in 2020 and 75% in 2050 in Annex I
▪ No hot air

21
Working D
raft -Last M
odified 12.10.2009 15:27:48P
rinted
Chart 1: Market-driven policy effectiveness scores in ‘Follow me’ scenario
Groupings
Power
Market driven policy ambition by policy execution resulting in a policy effectiveness score , %
RoadTransport
Agriculture
Rus
sia
Bra
zil
Mex
ico
Mid
dle
Eas
t
Sou
th A
fric
a
Sea transport
Air transport
5 Industry sectors
Buildings
Chi
na
Can
ada
Ger
man
y
Res
t of
EU
27
Fran
ce
Italy
Jap
an
Res
t of
OE
CD
E
urop
e
Res
t of O
EC
D
Pac
ific
U.K
.
Indi
a
Res
t of E
aste
rn
Eur
ope
Res
t of
Lat
in
Am
eric
a
Res
t of
Afr
ica
Res
t of d
evel
-op
ing
Asi
a
Waste
U.S. and Canada OECD China Fiscally strong emerging India and ot her developing
Forestry
U.S., Canada, OECD and Fiscally strong
Brazil Other developing Rest of Africa
Rest of devel-opingAsia (incl. Indonesia)
Forestry is grouped differently to reflect importance of Brazil, Indonesia and Rest of Africa
100 * 100 = 100
Policy ambition score
Policy execution score
U.S
.
100 * 90 = 90
90 * 90 = 81
25 * 80 = 20
90 * 100 = 90
35 * 90 = 32
100 * 100 = 100
85 * 90 = 77
67 * 90 = 60
60 * 80 = 48
90 * 100 = 90
45 * 90 = 41
77 * 80 = 61
30 * 60 = 18
47 * 60 = 28
40 * 60 = 24
72 * 80 = 58
100 * 60 = 60
100 * 100 = 10073 * 70 = 51
25 * 50 = 13
40 * 50 = 20
30 * 50 = 15
73 * 70 = 51
100 * 70 = 70
30 * 60 = 18
50 * 80 = 40
80 * 90 = 72
63 * 70 = 44
40 * 70 = 28
50 * 60 = 30
74 * 90 = 67
100 * 80 = 80
85 * 100 = 85 75 * 80 = 60 50 * 50 = 25 40 * 40 = 16 65 * 60 = 39
Working D
raft -Last M
odified 12.10.2009 15:27:48
Printed
-250
-200
-150
-100
50
200
150
100
0
-50
86 404 38363432100 3028262422202 181612 14
AbatementGtCO2e per year
Investorperspective
Economicperspective
Chart 2: Abatement cost curve after investor perspe ctive adjustmentsAbatement cost 2030, € per tCO2e
22
Working D
raft -
Last Modified 12
.10.2
009 15:27
:48
Prin
ted
Chart 3: Calculation flow of carbon markets model
ETS demand graphs
Offset supply curve
Non-ETS demand
▪ Offset price▪ Actual offset
supply and demand
Relevant ETS curves
▪ ETS price▪ Banked or
borrowed volume
▪ Linkage
▪ Reduce ETS abatement target while calculating ETS offset demand in case of borrowing
▪ Increase abatement target in case of banking▪ Start values: No banking and borrowing
AAU price (equal to CER price
1
2
3
6
4
7
Supply and demand approach
5
8
▪ Increase non-ETS offset demand in case of ETS borrowing▪ Decrease non-ETS offset demand in case of ETS banking▪ Start values: No banking and borrowing
3
4
Working D
raft -Last M
odified 12.10.2009 15:27:48P
rinted
International AAU markets• BAU: 20.6 Gt• Emission permits 16.7 Gt• Price: 13 EUR/t
EU ETS• BAU: 2.3 Gt• Permits: 1.7 Gt• Price: 29 EUR/t• 42 Mt banked
Offsets• Total demand: 1.9 Gt• Price: 13 EUR/t
US ETS• BAU: 7.2 Gt• Permits: 5.1 Gt• Price: 16 EUR/t• 0 Mt banked
0.1 Gtimport
1.1 Gt import(0.9 Gt after discount)
0.5 Gt import(in excess of ETS import)
Chart 4: Carbon markets in 2020
AAU
Offsets
ETS
Developed countries Developing countries
Other ETS 1
1 Australia and Canada
0.2 Gtimport
Follow me Scenario
23
Working D
raft -Last M
odified 12.10.2009 15:27:48P
rinted
Chart 5: Carbon prices
0
5
10
15
20
25
30
35
40
2015 2020 2025 2030
US ETS
EU ETS
Offset
€ per tCO2e, Follow me Scenario
Working D
raft -Last M
odified 12.10.2009 15:27:48P
rinted
1,1 1,5
-50
50
0,1
100
0,7 1,3 1,81,71,2 2,0 2,1 2,21,90,80,5 0,9 1,61,4 2,50,4 0,6
0
1,0
Chart 6: EU ETS cost curve 2020€ per tCO2e compared to GtCO2e, Follow me Scenario
Abatement target
Price
Indirect non-ETS abate-ment
Banked volume
Not realized
Offsets
Mandated
Realized by market
Permits

24
Working
Draft -
Last Mod
ified 12
.10.20
09 15:27:48P
rinted
-1.0
-0.5
-0.7
-10.1
-5.4
-14.0
-5.2
-3.3
Chart 7: Capital flows and abatement cost
2.0
US -15.5
EU -4.1
Rest of Annex I -0.9
Japan -2.1
Canada -1.6
India
Rest of non-Annex I 12.1
China 10.2
Revenue in 2020, € billion, Follow me Scenario
1.3
2.0
4.8
-29.5
-9.4
-4.2
-3.1
-2.2
Capital flows Cost of abatement 1 Total revenue / cost
+ =
1 Negative cost set to zero
Wo
rking D
raft -La
st Mod
ified 12.10
.2009
15:27
:48
Printed
0
10
20
30
40
50
60
2015 2020 2025 2030
Follow me
0
10
20
30
40
50
60
2015 2020 2025 2030
Head in the sand
EU ETS
US ETS
Offset
Chart 8: Carbon prices under different climate scen arios€ per tCO2
0
10
20
30
40
50
60
2015 2020 2025 2030
High ambition

25
Working D
raft -Last M
odified 12.10.2009 15:27:48P
rinted
2005 2010 2015 2020 2025 2030
70
65
60
55
50
45
40
35
0
Full technical potential
High ambition
Follow me
Head in the sand
BAU
Chart 9: Abatement under different climate scenario sGtCO2e
Working D
raft -Last M
odified 12.10.2009 15:27:48P
rinted
0
5
10
15
20
25
30
35
40
2015 2020 2025 2030
Linked market
US ETS without linkage
EU ETS without linkage
Chart 10: Carbon prices before and after linkage€ per tCO2e, Follow me Scenario

26
Working D
raft -Last M
odified 12.10.2009 15:27:48P
rinted
Chart 11: Carbon prices with and without banking
0
5
10
15
20
25
30
35
40
45
50
55
60
65
70
2015 2020 2025 2030
EU ETS without banking
US ETS with banking
US ETS without banking
EU ETS with banking
€ per tCO2e, Follow me Scenario